
Citizen Science and The University of Queensland Seismograph Stations (UQSS)—A Study of Seismic T Waves in S-W Pacific Ocean


Abstract
1. Introduction
Although the opportunities from citizen-based seismology are many, it is the role of the scientific community to work with and ensure that accurate information and understanding of recorded signals is available to all citizen-based seismic monitoring communities. Failure to collaborate with citizen-based scientists may otherwise lead to spread of misinformation, conspiracy theories, and mistrust of scientific seismological organizations that in turn could result in increased seismic risk due to lack of knowledge in a community. With the ongoing developments in the field of seismoacoustic instrumentation, sources, and observations, future interactions between scientific experts and citizen-based seismoacoustic communities will be critical to prevent misunderstanding, especially of these complex phenomena [8].
2. Materials and Methods
2.1. Citizen Science Influences of the UQSS
2.2. Seismograph Observatory Practice for Earthquake Data Collection
- ○
- Annotate the six charts (short period Z, N-S, E-W and long period Z, N-S, E-W) with their unique descriptors.
- ○
- Provide station name, date/time ON-OFF; sensor direction; clocking error.
- ○
- Methodically and chronologically pic timed events (blast. earthquake, local noise, microseism noise level) into the observers daily log of seismic phases, onset strength and direction and comments.
- ○
- Telex the day’s logs of observed earthquake phase times and descriptors to the United States Geological Survey and Geosciences Australia (then BMR or AGSO), and then compile them into a weekly station bulletin publication. This was faxed to global agencies who compiled definitive catalogues of earthquake epicentres, e.g., ISC, USGS and GA, as well as the UQSS archives [13].
2.3. Brief Review of (BRS) Seismograph Station T Wave Historical Research Literature
A study of more than 200 records of T from the Atlantic 7 has shown that in all cases the period ranges upward rather than downward from 0.5 s, being for the most part between 0.5 and 1.0. This is significant, because SOFAR propagation (SOFAR stands for sound fixing and ranging) along an axis of minimum velocity cannot explain transmission of waves of periods longer than 0.5 s carrying the greater part of the energy in T. T does not travel with the velocity of sound in water for the part of its path crossing deep water. Its oceanic velocity ranges from 1.70 km/s to 2.65 km/s, in different parts of the Atlantic (5577 to 8695 ft/s), in contrast to velocities of sound in water from 1.46 to 1.53 km/s. (4790 to 5020 ft/s). Its speed over land paths is 2.13 km/s. (6988 ft/s) [16].
2.4. A Concision of Recent Research Literature about the Relevance of T Waves
- What are the known parameters that define a T wave in water?
- Why seismograph T waves are relevant to ocean climate change?
- Are there experimental ethics linking T waves to oceanography?
- Have T waves been researched as a tsunami predictor?
- Where are T phases best observed? What enhances their signal/noise ratio?
“The mechanism of coupling from acoustic waves to seismic waves is not clear but has been proposed to be related to the slope of the seafloor near the shore, and the contrast.”
“The T phase does not depend only on the earthquakes’ magnitude, but also on the depth where earthquakes occur, the continental slope, the conversion location, and the conversion efficiency” [28]
- Do T waves themselves constitute a disaster hazard?
- Thermometry and bathymetry;
- Is the significance of acoustic thermometry and T wave velocity established?An exhaustive study of T waves from the CTBTO global database and a highly computational paper by Evers and Snellen [29] is worthy of mention to demonstrate the diverse origins of T waves. The physics is based on the efficient propagation through the SOFAR channel and uses the above-mentioned dependence of the sound speed on the temperature, noting,
- ○
- Diurnal variations in the SOFAR channel were found by analysing the travel time differences from the source to the receivers.
- ○
- From this, propagation in the Atlantic appeared to vary strongly between the north and south Atlantic Oceans, which is further studied in Section 4. The celerity approach and findings are evaluated in Section 5, where also opportunities for future research are identified. The conclusions from this study are drawn in Section 5 [29].
2.5. The Original 1993 Student (Citizen Science) UQSS Project
3. Results
3.1. Student T Wave Data Collection and Epicentre Location Analysis Results
- Not all earthquakes generate T waves.
- T waves originate from only certain tectonic zones (some naming variations?).
- There is a wide variation in T wave travel velocity.
- There does appear to be seasonality in T wave reception by BRS.
- There is a paucity of T waves passing across the submerged Zealandia continent.
- T wave paths also plot paths for tsunami hazards along the east coast of Australia [31].
3.2. Student T Wave Travel Times Derived from Epicentre Location Analysis—Showing T Wave Velocities Calculated
- Accurate bathymetric path plots should better discriminate SoFaR travel time and seismic travel time.
- There may be a seasonality effect. There appear to be more T waves recorded from all cluster areas between May to September over the decadal data collection. Refer to Figure 6.
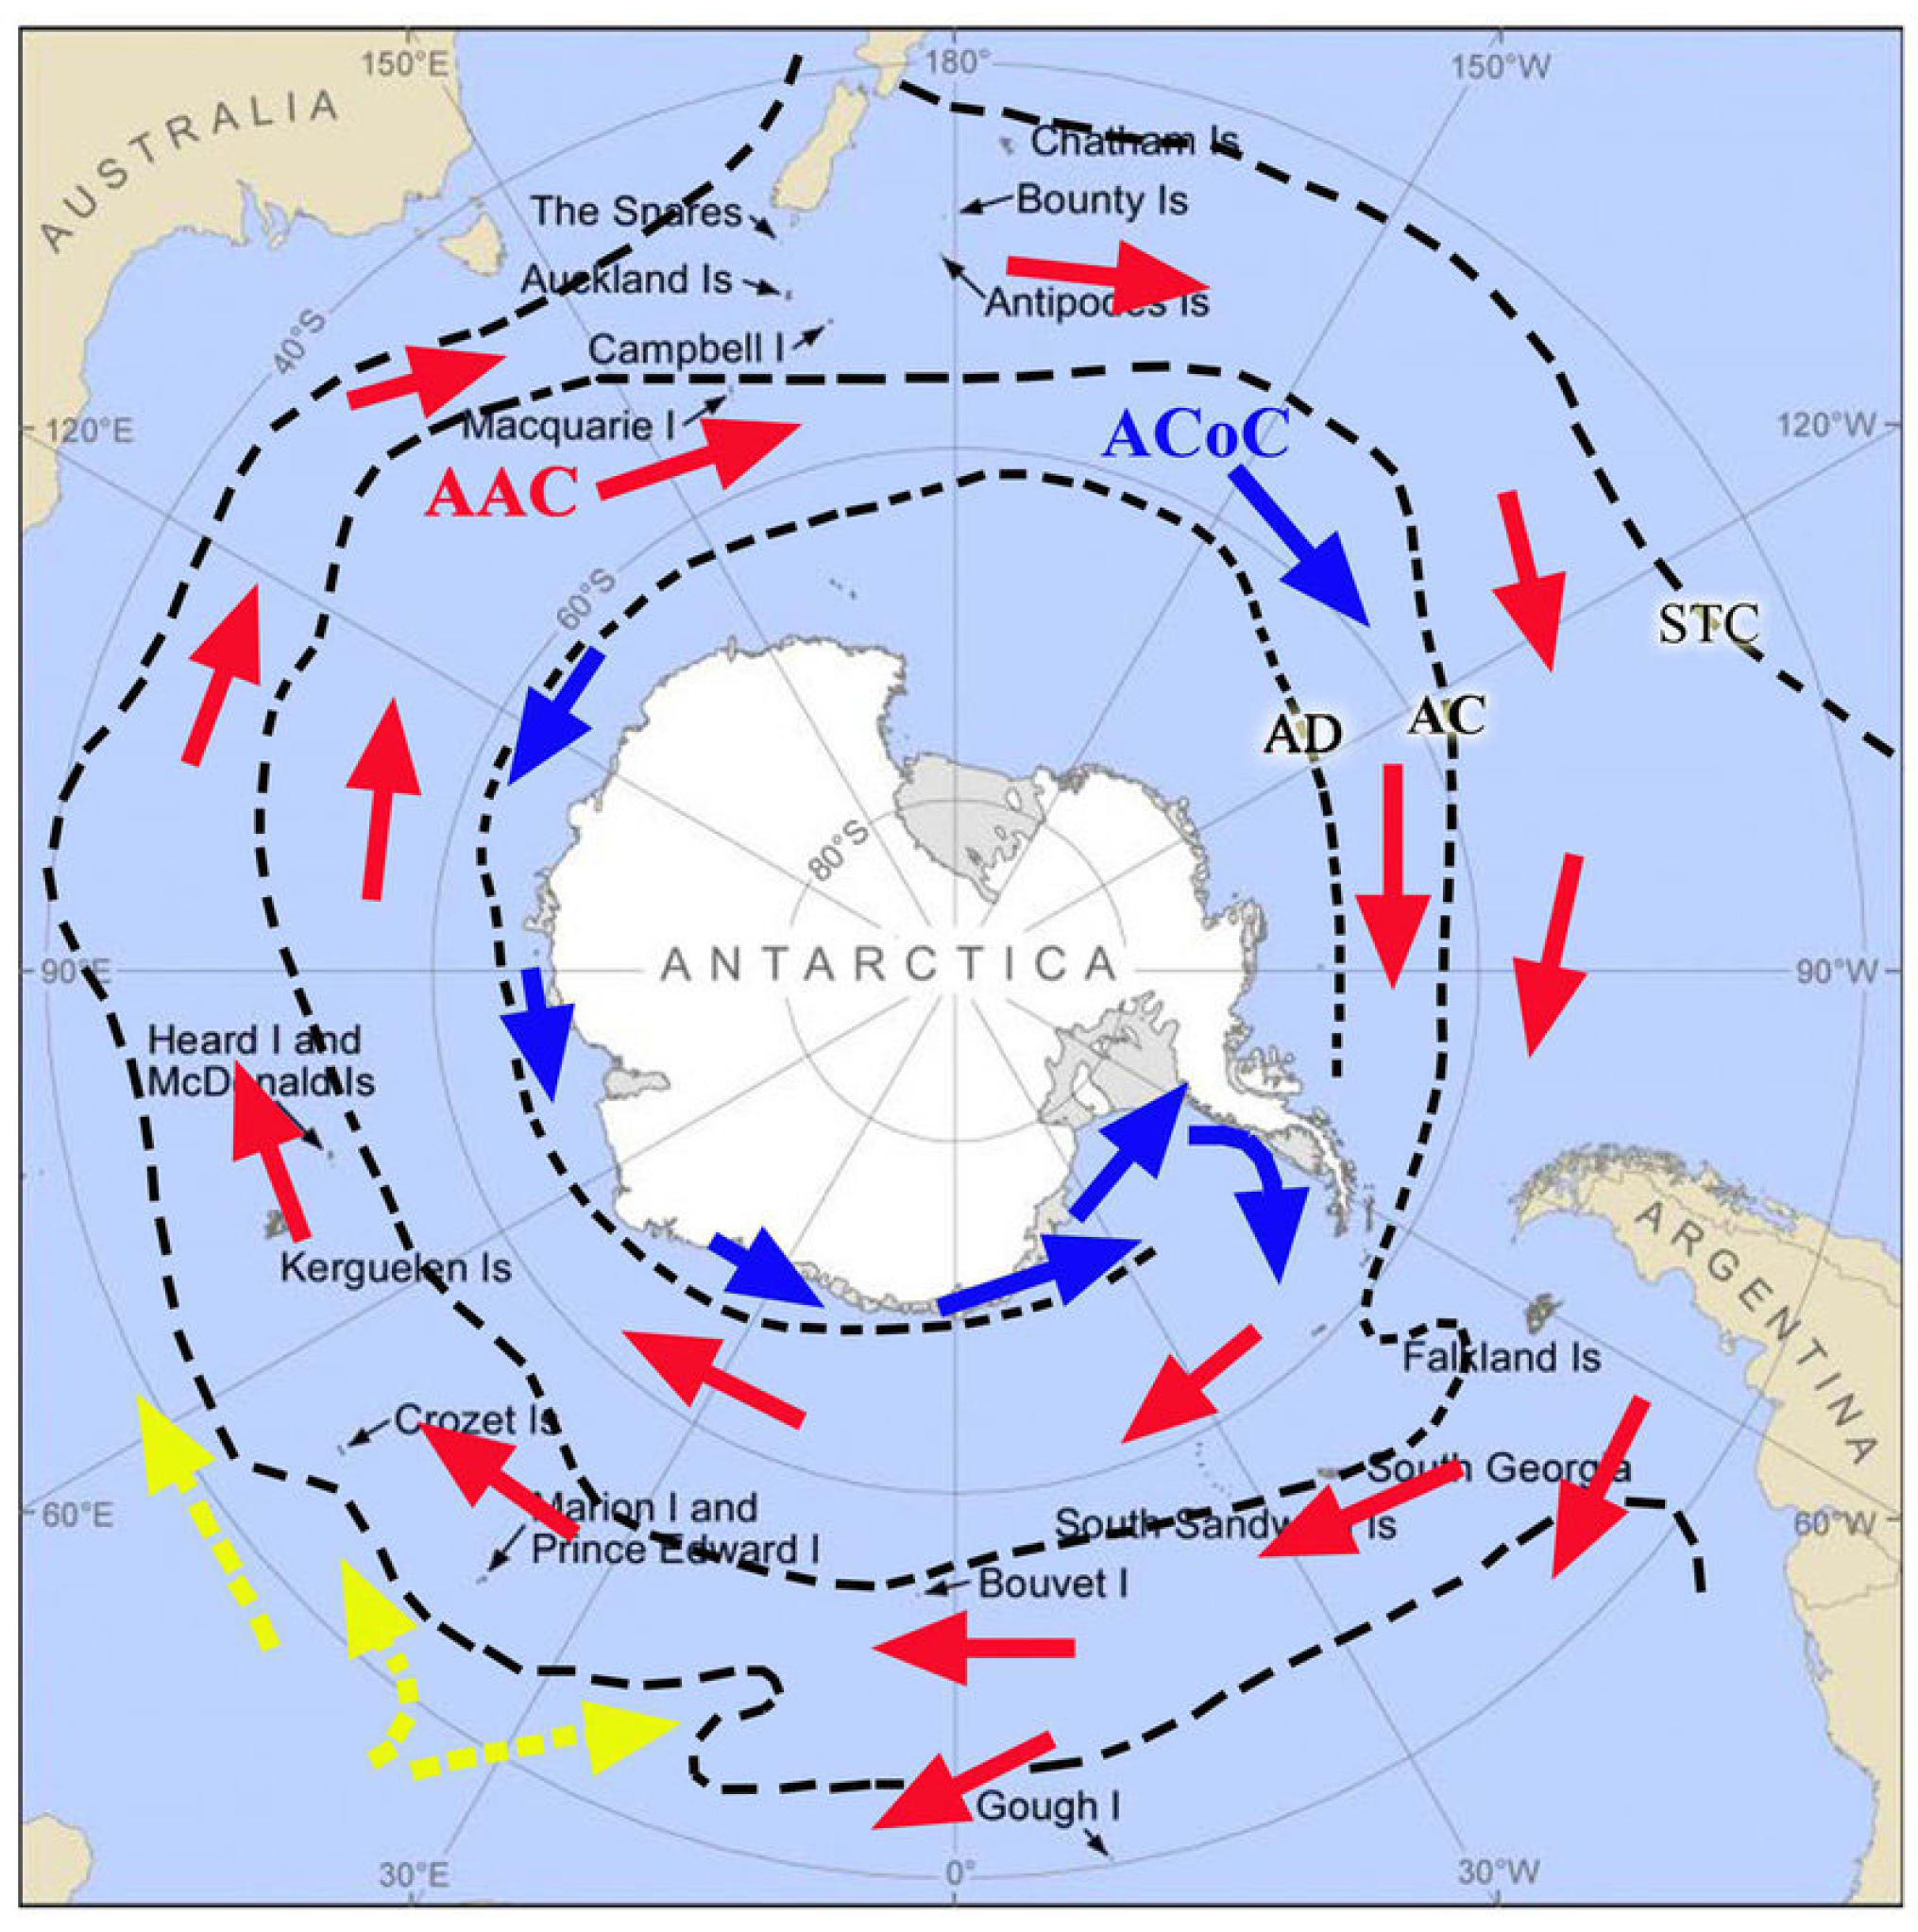
- There may be a temperature or salinity effect from the migrating Antarctic Converge boundary that could affect the ocean temperatures around Macquarie Island, Auckland Island and Balleny Island sourced T waves (See Figure 7)
4. Discussion
4.1. Value of Citizen Science in the Laboratory
4.2. Other Discovered Citizen Science T Wave Recordings and Research
4.3. Climate Change Related Acoustic Thermometry
5. Conclusions
The challenges facing Australia’s biosecurity system are too big for any organisation or sector to tackle by themselves. The solution is a united, multifaceted approach. We need to harness the collective knowledge and eyes-on-the-ground capability of our citizens, our communities, our industries, and our governments to ensure that all Australians are aware of their role in managing biosecurity risks and are working together to build the resilience of the biosecurity system. Shared responsibility involves improved community engagement; more systemic collaborations between Indigenous and non-Indigenous organisations and individuals and working with industry to develop their role in surveillance. For it to work, every stakeholder has to understand its value and feel invested in Australia’s biosecurity. Together, system connectivity and shared responsibility will allow us to quickly share critical information, resources, and expertise. We will be able to coordinate prevention strategies, improve our rapid response, and efficiently identify research needs across the human health, agricultural, and environmental sectors. ‘Science’ is the application of scientific methods to observations about the biophysical world.
Author Contributions
Funding
Data Availability Statement
Acknowledgments
Conflicts of Interest
References
- Lynam, C.; Hearn, S.; Karunaratne, A.M.; Lahey, B. Earthquake Generated T Phases on BRS Seismograph (Brisbane, Q’ld)—A Predictor for Tasman Sea Tsunamis? Available online: https://www.researchgate.net/publication/363533716_Earthquake_generated_T_phases_on_BRS_Seismograph_Brisbane_Q’ld-_a_predictor_for_Tasman_Sea_Tsunamis (accessed on 14 April 2021).
- UNESCO. What You Need to Know about Education for Sustainable Development (Cited 7-04-2023). Available online: https://www.unesco.org/en/education-sustainable-development/need-know (accessed on 14 March 2023).
- Ough, T. The Phones that Detect Earthquakes. (Cited 15-4-2023) BBC Future. Available online: https://www.bbc.com/future/article/20230405-the-phones-that-detect-earthquakes (accessed on 14 April 2023).
- Sambridge, M.; Millar, M.S.; Salmon, M. The Australian Seismometers in Schools Network (AuSIS). 2014. Available online: https://earthsciences.anu.edu.au/australian-seismometers-schools-network-ausis (accessed on 27 June 2023).
- Wesseloo, J.; Hudyma, M.R.; Harris, P. A Community Based Seismic System for Obtaining Regional and Local Seismic Data of Strategic Importance, Strategic Versus Tactical Approaches in Mining; Potvin, Y., Ed.; Australian Centre for Geomechanics: Perth, Australia, 2011; ISBN 978-0-9806154-6-3. [Google Scholar] [CrossRef]
- Lade, B. Newsletter of the Seismological Association of Australia Inc., (Vol 1 No.2). Available online: https://earthquake.net.au/wp-content/uploads/2022/07/SAA_Newsletter_2.pdf (accessed on 10 October 2017).
- FDSN AM: Raspberry Shake, FDSN Network Information—Citizen Scientist Earthquake Monitoring Network. Available online: https://www.fdsn.org/networks/detail/AM/ (accessed on 14 February 2023).
- Dannemann Dugick, F.; Koch, C.; Berg, E.; Arrowsmith, S.; Albert, S. A New Decade in Seismoacoustics (2010–2022). Bull. Seismol. Soc. Am. 2023, 1–34. [Google Scholar] [CrossRef]
- Leonard, M. T-phase Perception: The August 2003, Mw 7.1, New Zealand Earthquake Felt in Sydney 1800 km Away. Seismol. Res. Lett. 2004, 75, 475–480. [Google Scholar] [CrossRef]
- Trundle, P. Earthquake watching can be a new cheap sport. Courier-Mail, 18 February 1953; 2. [Google Scholar]
- Lynam Colin, J. In the 1950′s, a Priest from Warwick (Qld) Was Inspired to Discover Cyclone Related Microseismic Research on His Home-Built Instruments. Available online: https://www.researchgate.net/publication/313391376_In_the_1950’s_a_priest_from_Warwick_Qld_was_inspired_to_discover_cyclone_related_microseismic_research_on_his_home_built_instruments_Published_on_January_24_2017 (accessed on 1 January 2017).
- Lynam, C. Seismology, Earthquakes, Tsunamis, and Seismographic Data The University of Queensland Data Collection. 2022. Available online: https://espace.library.uq.edu.au/view/UQ:2ede8a0 (accessed on 23 March 2023).
- University of Queensland. Seismological Station. Bulletin/University of Queensland, Seismological Station; University of Queensland University of Queensland Seismology Station Bulletin/University of Queensland, Seismological Station: Brisbane, Australia, 1945; Available online: https://espace.library.uq.edu.au/view/UQ:730089/ID23112821050003131_1937_1945x.pdf?dsi_version=14f1312ec02ab25f3c785e494b5ebf1c (accessed on 1 June 2023).
- Jones, O.A. The New University of Queensland Seismological Station. Bull. Seismol. Soc. Am. 1953, 43, 247–254. [Google Scholar] [CrossRef]
- Lynam, C.J.; Webb, J.P. Cooperation and The Seismograph Stations of The University of Queensland—Departmental Seminar given by the Late Dr Jack Webb (Senior Lecturer Geophysics), Honorary Director of University of Queensland Seismograph Stations, Dept of Geology and Mineralogy, on 27/08/1982. (Tape and transcript made by C.J. Lynam). 2019. Available online: https://www.researchgate.net/publication/347472073_Cooperation_and_The_UQ_Seismograph_Stations (accessed on 23 April 2023).
- Linehan, D. Earthquake in the West Indian Region, Reports and Papers, Eos, Transactions American Geophysical Union (pp. 229–232). 1940. Available online: https://agupubs.onlinelibrary.wiley.com/doi/pdf/10.1029/TR021i002p00229?casa_token=9V3Bbit6kmwAAAAA:aRYVgNNyk7gxFtjAVEbPnnTb8BotRhbaQxxr5Ks4kMDQrj3oVQxZlhOe455dGranJb1FaXSRMe-GOTIKoA (accessed on 27 June 2023).
- Ewing, M.; Press, F.; Worzel, J.L. Further Study of the T Phase. BSSA 1952, 42, 37–51. Available online: https://pubs.geoscienceworld.org/bssa/article-lookup/42/1/37?casa_token=IIqyZNzPOcYAAAAA:zBd5EOi7_jKj3tgCEKnIDRMk-zGL2xnjB9tA61ni-RjXFMDNS-md8By_VL3SQuhSdoRv7owqzw (accessed on 23 April 2023). [CrossRef]
- Burke-Gaffney, T.N. The T-Phase from the New Zealand Region. J. Proc. Roy. Soc. NSW 1954, V87–V88, 51–54. Available online: https://www.biodiversitylibrary.org/page/46423200#page/355/mode/1up (accessed on 1 May 2023). [CrossRef]
- Ripper, I.; Green, R. Tasmanian examples of the influence of bathymetry and crustal structure upon seismic T-wave propagation. N. Z. J. Geol. Geophys. 1967, 10, 1226–1230. [Google Scholar] [CrossRef]
- Green, R. Tasmanian Records of Earthquake T-Phases from New Zealand. N. Z. J. Geol. Geophys. 1961, 5, 322–330. Available online: https://www.tandfonline.com/action/showCitFormats?doi=10.1080/00288306.1962.10423122 (accessed on 14 August 1991). [CrossRef]
- Chapp, E.; Bohnenstiehl, D.R.; Tolstoy, M. Sound-channel observations of ice-generated tremor in the Indian Ocean. Geochem. Geophys. Geosyst. 2005, 6, Q06003. [Google Scholar] [CrossRef]
- Metz, D.; Watts, A.B.; Grevemeyer, I.; Rodgers, M. Tracking submarine volcanic activity at Monowai: Constraints from long-range hydro acoustic measurements. J. Geophys. Res. Solid Earth 2018, 123, 7877–7895. [Google Scholar] [CrossRef]
- Talandier, J.; Okal, E.A. Human Perception of Z Waves: The June 22, 1977, Tonga Earthquake Felt on Tahiti. Bull. Seismol. Soc. Am. 1979, 69, 1475–1486. [Google Scholar] [CrossRef]
- Wu, W.; Zhan, Z.; Peng, S.; Ni, S.; Callies, J. Seismic Ocean thermometry. Science 2020, 369, 1510–1515. [Google Scholar] [CrossRef] [PubMed]
- Simon, J.D.; Simons, F.J.; Irving, J.C.E. A MERMAID Miscellany: Seismoacoustic Signals beyond the P Wave. Seismol. Res. Lett. 2021, 92, 3657–3667. [Google Scholar] [CrossRef]
- McGrath, M. Climate Change: Earthquake ‘Hack’ Reveals Scale of Ocean Warming, Yahoo News. 2020. Available online: https://au.news.yahoo.com/climate-change-earthquake-hack-reveals-181429327.html (accessed on 23 April 2023).
- Buehler, J.S.; Shearer, P.M. T phase observations in global seismogram stacks. Geophys. Res. Lett. 2015, 42, 6607–6613. [Google Scholar] [CrossRef]
- Zhou, Y.; Chen, X.; Ni, S.; Qian, Y.; Zhang, Y.; Yu, C.; Zhong, Q.; Zheng, T.; Xu, M. Determining crustal attenuation with seismic T waves in southern Africa. Geophys. Res. Lett. 2021, 48, e2021GL094410. [Google Scholar] [CrossRef]
- Evers, L.G.; Snellen, M. Probing the sound fixing and ranging channel with hydro-acoustic observations from ridge earthquakes. J. Acoust. Soc. Am. 2015, 137, 2124–2136. [Google Scholar] [CrossRef] [PubMed]
- Di Giacomo, D.; Olaru, D.; Armstrong, A.; Harris, J.; Storchak, D.A. The ISC Electronic Archive of Printed Station and Network Bulletins. Seismol. Res. Lett. 2021, 93, 749–752. [Google Scholar] [CrossRef]
- Lynam, C. On a Fine Day in Shorncliffe the Sea Came Boiling Upwards Across the Bathers. Proc. R. Soc. Qld. 2020, 128, 29–48. [Google Scholar] [CrossRef]
- Leach, F.; Campbell, H.; Eby, N.; Holt, K.; Regelous, M.; Richards, R.; Weaver, S. Obsidian Floater Washed Up on a Beach in the Chatham Islands: Geochemical Composition and Comparison with Other Volcanic Glasses, Tuhinga 27 (pp. 21–49) Copyright © Museum of New Zealand Te Papa Tongarewa. 2016. Available online: https://www.researchgate.net/publication/304581597_Obsidian_floater_washed_up_on_a_beach_in_the_Chatham_Islands_geochemical_composition_and_comparison_with_other_volcanic_glasses (accessed on 1 May 2023).
- Philips, M. ’T-Phase’ Seismic Events Recorded at EPSO, Coonabarabran, NSW. 2022. Available online: http://www.map.id.au/seismic/epso_events_t-phase.html (accessed on 1 December 2022).
- CSIRO. ‘Australia’s Biosecurity Future: Preparing for Future Biological Challenges. 2014. Available online: https://www.csiro.au/en/Research/BF/Areas/Our-impact-strategy/Biosecurity-Future-Report (accessed on 3 April 2022).
- Carrol, D. Australia Leads the World as a Solar Sets Global Generation Record. PV Magazine. Available online: https://www.pv-magazine.com/2022/03/31/Australia-leads-world-as-solar-sets-global-generation-record/ (accessed on 31 March 2022).


| Date | TME_REC (UTC) | Location | Lat (S) | Long (E) | Depth (Km) | Azmuth | MS * | MB ** |
|---|---|---|---|---|---|---|---|---|
| 25/05/1981 | 11:09:40 | AUCKLAND ISLANDS | 49.41 | 164.28 | 12 | 334 | 5.1 | |
| 25/05/1981 | 11:30:10 | AUCKLAND ISLANDS | 49.35 | 164.58 | 19 | 333 | 4.6 | |
| 25/05/1981 | 14:18:10 | AUCKLAND ISLANDS | 49.34 | 164.27 | 33 | 334 | 4.3 | |
| 25/05/1981 | 20:07:10 | AUCKLAND ISLANDS | 49.35 | 164.28 | 33 | 334 | 4.4 | |
| 25/05/1981 | 22:23:05 | AUCKLAND ISLANDS | 49.28 | 164.23 | 33 | 334 | 4.5 | |
| 28/05/1981 | 0:48:00 | AUCKLAND ISLANDS | 49.5 | 163.88 | 33 | 335 | 4.3 | |
| 28/05/1981 | 05:52:00 | AUCKLAND ISLANDS | 49.13 | 164.43 | 12 | 333 | 4.9 | |
| 30/05/1981 | 09:12:28 | AUCKLAND ISLANDS | 49.14 | 164.63 | 333 | 5.3 | 5.8 | |
| 31/05/1981 | 08:24:00 | AUCKLAND ISLANDS | 49.82 | 164.1 | 33 | 335 | 4.2 | |
| 16/06/1981 | 16:29:45 | AUCKLAND ISLANDS | 49.07 | 164.79 | 33 | 332 | 5.3 | |
| 6/08/1981 | 11:52:20 | AUCKLAND ISLANDS | 49.76 | 163.96 | 33 | 335 | 4.6 | |
| 16/08/1981 | 05:41:45 | AUCKLAND ISLANDS | 49.54 | 164.32 | 33 | 334 | 4.5 | |
| 22/04/1986 | 22:19:23 | AUCKLAND ISLANDS | 49.96 | 163.69 | 10 | 336 | 4.8 | |
| 3/05/1987 | 12:52:33 | AUCKLAND ISLANDS | 49.17 | 164.6 | 13 | 333 | 5.3 | 4.6 |
| 20/12/1988 | 14:20:10 | AUCKLAND ISLANDS | 50.5 | 163.1 | 10 | 4.7 | 4.8 | |
| 26/10/1989 | 03:09:00 | AUCKLAND ISLANDS | 50.7 | 162.8 | 10 | 4.7 | 4.4 | |
| 21/11/1989 | 15:03:21 | AUCKLAND ISLANDS | 50.18 | 162.6 | 10 | 5.8 | 5.6 | |
| 23/02/1991 | 15:26:00 | AUCKLAND ISLANDS | 49.1 | 164.9 | 10 | 332 | 4.9 | |
| 17/09/1989 | 06:28:10 | BAL.LENY ISLAND | 61.4 | 154.1 | 10 | 5.6 | 5.4 | |
| 16/01/1980 | 04:17:50 | LOYALTY ISLANDS | 21.85 | 170.58 | 56 | 5.6 | 5.4 | |
| 6/07/1981 | 03:25:36 | LOYAL TY ISLANDS | 22.29 | 171.64 | 114 | 250 | 6.3 | |
| 6/09/1981 | 11:19:30 | LOYALTY ISLANDS | 21.5 | 169.61 | 36 | 246 | 6.0 | |
| 29/10/1981 | 12:23:47 | LOYAL TY ISLANDS | 23.65 | 169.11 | 18 | 252 | 5.1 | |
| 15/11/1984 | 03:03:22 | LOYALTY ISLANDS | 22 | 170.91 | 119 | 248 | 6.3 | |
| 15/01/1986 | 20:33:57 | LOYAL TY ISLANDS | 21.37 | 170.31 | 144 | 246 | 6.0 | |
| 1/05/1986 | 19:49:00 | LOYAL TY ISLANDS | 21.85 | 170.13 | 71 | 247 | 5.7 | |
| 31/07/1988 | 13:06:41 | LOYALTY ISLANDS | 22.26 | 171.02 | 85 | 5.7 | ||
| 21/09/1988 | 11:21:00 | LOYALTY ISLANDS | 22.27 | 170.97 | 88 | 5.1 | ||
| 17/02/1991 | 07:16:23 | LOYAL TY ISLANDS | 21.17 | 169.76 | 73 | 245 | 5.5 | |
| 31/12/1984 | 22:21:27 | MACCQUARIE ISLAND | 60.21 | 153.8 | 10 | 359 | 5.5 | 5.3 |
| 3/09/1987 | 00:07:17 | MACQUARIE ISLAND | 58.86 | 158.48 | 15 | 7.2 | 5.9 | |
| 15/11/1989 | 19:48:37 | MACCQUARIE ISLAND | 52.34 | 160.07 | 10 | 5.4 | 5.7 | |
| 17/09/1990 | 14:15:00 | MACCQUARIE ISLAND | 53.17 | 159.64 | 10 | 346 | 6.0 | 5.9 |
| 23/05/1984 | 00:05:44 | N OF MACQUARIE I | 51.88 | 161.08 | 10 | 342 | 5.8 | 5.8 |
| 18/09/1981 | 09:24:05 | NEW CALDONIA | 22.81 | 167.6 | 33 | 248 | 4.4 | |
| 17/12/1988 | 01:13:45 | NEW CALEDONIA | 26.93 | 167.53 | 25 | 5.3 | 5.5 | |
| 24/02/1991 | 09:52:00 | NEW CALEDONIA | 22.72 | 166.64 | 33 | 247 | 5.0 | 4.9 |
| 28/01/1980 | 12:55:10 | NEW ZEALAND | 45.26 | 167.5 | 118 | 5.1 | ||
| 26/07/1987 | 22:12:12 | NW OF NZ | 30.23 | 165.8 | 10 | 5.4 | 5.2 | |
| 25/05/1988 | 13:41:39 | NWOF NZ | 30.7 | 167.7 | 10 | 4.4 | 4.8 | |
| 27/09/1985 | 03:59:30 | SOLOMON ISL.ANDS | 9.81 | 165.85 | 33 | 200 | 6.8 | 6.2 |
| 30/08/1980 | 06:19:02 | SOUTH ISLAND NZ | 45.06 | 167.67 | 112 | 321 | 4.6 | |
| 27/05/1981 | 19:23:00 | SOUTH ISLAND NZ | 48.48 | 164.48 | 12 | 332 | 4.6 | |
| 22/11/1981 | 19:00:15 | SOUTH ISLAND NZ | 44.46 | 167.63 | 18 | 320 | ||
| 4/07/1982 | 16:05:00 | SOUTH ISLAND NZ | 10 | 320 | 4.7 | |||
| 27/09/1984 | 22:04:21 | SOUTH ISLAND NZ | 44.14 | 168.66 | 1 | 317 | 4.7 | |
| 12/09/1985 | 13:16:30 | SOUTH ISL.AND NZ | 45.4 | 167.36 | 80 | 322 | 5.1 | |
| 11/07/1986 | 17:20:05 | SOUTH ISLAND NZ | 44.54 | 167.45 | 12 | 321 | 4.2 | |
| 16/05/1988 | 10:19:00 | SOUTH ISLAND NZ | 44.17 | 168.13 | 12 | 4.2 | ||
| 3/06/1988 | 23:47:20 | SOUTH ISLAND NZ | 44.86 | 167.64 | 82 | 5.7 | ||
| 9/06/1988 | 12:33:30 | SOUTH ISLAND NZ | 44.99 | 167.48 | 65 | 4.2 | ||
| 14/06/1988 | 16:07:00 | SOUTH ISLAND NZ | 44.47 | 168.34 | 8 | 4.2 | ||
| 15/02/1991 | 11:12:16 | SOUTH ISLAND NZ | 42.08 | 171.59 | 8 | 308 | 5.0 | 5.8 |
| 28/05/1981 | 21:18:00 | VANUATU | 15.01 | 166.97 | 121 | 225 | 4.8 | |
| 6/04/1984 | 23:25:10 | VANUATU | 18.95 | 168.89 | 185 | 237 | 5.8 | |
| 16/07/1986 | 12:58:08 | VANUATU | 19.52 | 169.16 | 21 | 239 | 6.2 | |
| 12/08/1990 | 21:41:50 | VANUATU | 19.48 | 169.12 | 164 | 239 | 6.3 | |
| 15/06/1981 | 02:56:00 | W COAST, SIS NZ | 48.46 | 165.11 | 33 | 331 | 5.3 | 5.2 |
| 27/06/1981 | 22:04:00 | W COAST, S IS NZ | 48.8 | 164.2 | 33 | 333 | 4.4 | |
| 23/12/1981 | 15:24:00 | W COAST, SIS NZ | 47.74 | 165.77 | 10 | 329 | 3.8 | |
| 31/01/1985 | 04:56:00 | W COAST, SIS NZ | 46.01 | 165.16 | 10 | 328 | 6.0 | 5.8 |
| 21/09/1985 | 14:14:26 | W COAST, S IS NZ | 46.37 | 165.78 | 22 | 327 | 4.9 | |
| 3/04/1986 | 14:33:22 | W COAST, S IS NZ | 45.81 | 165.24 | 33 | 327 | 4.8 | |
| 11/07/1986 | 08:51:30 | W COAST, SIS NZ | 45.46 | 166.33 | 33 | 325 | 5.5 | 5.3 |
| 15/05/1988 | 18:45:53 | W COAST, SIS NZ | 43.85 | 168.68 | 10 | 4.9 | 5.5 | |
| 15/05/1988 | 19:42:00 | W COAST, SIS NZ | 43.94 | 168.46 | 4 | 4.0 | ||
| 18/01/1980 | No info found | |||||||
| 7/02/1980 | No info found | |||||||
| 5/08/1981 | 03:30:24 | No info found | ||||||
| 27/06/1982 | 16:48:17 | No info found | ||||||
| 30/10/1986 | 00:24:31 | No info found | ||||||
| 17/02/1987 | 09:52:30 | No info found |
| Location | Date/ | Time of Origin | BRS Time (UTC) | Lat (S) | Long (E) | Distance to BRS (Degrees) | Azimuth | Depth | MB ** | MS * | T Travel Time (s) | Distance to Origin(Km) | Velocity (Km/s) | |
|---|---|---|---|---|---|---|---|---|---|---|---|---|---|---|
| 3 | AUCKLAND ISLANDS | 06/08/81 | 11:25:47 | 11:52:20 | 49.76 | 163.96 | 23.93 | 335 | 33 | 4.6 | 1593 | 2655 | 1.730769 | |
| 4 | AUCKLAND ISLANDS | 03/05/87 | 12:26:53 | 12:52:33 | 49.17 | 164.60 | 23.57 | 333 | 13 | 4.6 | 1540 | 2620 | 1.473566 | |
| 5 | AUCKLAND ISLANDS | 02/23/91 | 14:59:40 | 15:26:00 | 49.10 | 164.90 | 23.63 | 332 | 10 | 4.9 | 1580 | 2620 | 1.088040 | |
| 6 | AUCKLAND ISLANDS | 02/25/81 | 11:03:02 | 11:30:10 | 49.35 | 164.58 | 23.02 | 333 | 19 | 4.6 | 1628 | 2620 | 1.609037 | |
| 7 | AUCKLAND ISLANDS | 04/22/86 | 21:53:05 | 22:19:23 | 40.06 | 163.60 | 24.04 | 336 | 10 | 4.8 | 1578 | 2665 | 1.730510 | |
| 8 | AUCKLAND ISLANDS | 05/25/81 | 10:44:25 | 11:09:40 | 49.27 | 164.41 | 23.71 | 334 | 12 | 1515 | 2635 | 1.730274 | ||
| 9 | AUCKLAND ISLANDS | 05/25/81 | 13:27:50 | 14:18:10 | 40.34 | 164.27 | 23.64 | 334 | 33 | 4.3 | 3020 | 2620 | 0.867550 | |
| 10 | AUCKLAND ISLANDS | 05/25/81 | 19:39:13 | 20:07:10 | 49.35 | 164.28 | 23.66 | 334 | 33 | 4.4 | 1677 | 2635 | 1.571258 | |
| 11 | AUCKLAND ISLANDS | 05/25/81 | 21:50:51 | 22:23:05 | 49.28 | 164.23 | 23.58 | 334 | 33 | 4.5 | 1934 | 2620 | 1.354705 | |
| 12 | AUCKLAND ISLANDS | 05/28/81 | 0:21:15 | 0:48:00 | 49.50 | 163.88 | 23.67 | 335 | 33 | 4.3 | 1605 | 2635 | 1.641745 | |
| 13 | AUCKLAND ISLANDS | 05/28/81 | 5:25:52 | 5:52:00 | 49.13 | 164.43 | 23.50 | 333 | 12 | 4.9 | 1568 | 2610 | 1.664541 | |
| 14 | AUCKLAND ISLANDS | 05/30/81 | 9:47:12 | 10:12:28 | 49.14 | 164.63 | 333 | 5.8 | 1516 | 2665 | 1.757916 | |||
| 15 | AUCKLAND ISLANDS | 05/31/81 | 7:57:07 | 8:24:00 | 49.82 | 164.10 | 335 | 33 | 4.2 | 1613 | 2665 | 1.709429 | ||
| 16 | AUCKLAND ISLANDS | 06/16/81 | 16:03:46 | 16:29:45 | 49.07 | 164.79 | 23.56 | 332 | 33 | 5.3 | 1559 | 2620 | 1.644690 | |
| 17 | AUCKLAND ISLANDS | 08/16/81 | 5:10:11 | 5:41:45 | 49.54 | 104.32 | 23.84 | 334 | 33 | 4.5 | 1894 | 2645 | 1.005017 | |
| 18 | AUCKLAND ISLANDS | 10/26/89 | 2:14:14 | 3:09:00 | 50.67 | 162.76 | 24.47 | 10 | 4.4 | 3286 | 2755 | 1.786641 | ||
| 19 | AUCKLAND ISLANDS | 11/21/89 | 14:37:39 | 15:03:21 | 50.18 | 164.60 | 23.97 | 10 | 5.6 | 1542 | 2665 | 1.696372 | ||
| 20 | AUCKLAND ISLANDS | 12/20/88 | 13:53:32 | 14:20:10 | 50.50 | 163.10 | 21.57 | 10 | 4.8 | 1598 | 2400 | 0.730371 | ||
| 21 | BALLENY ISLAND | 07/09/89 | 5:48:02 | 6:28:10 | 61.40 | 154.10 | 34.01 | 10 | 5.4 | 2408 | 3780 | 3.624161 | ||
| 22 | LOYALTY ISLANDS | 06/07/81 | 3:08:34 | 3:25:36 | 22.29 | 171.04 | 17.86 | 250 | 114 | 6.3 | 1022 | 1980 | 1.962339 | |
| 23 | LOYALTY ISLANDS | 06/09/81 | 11:02:41 | 11:19:30 | 21.50 | 160.61 | 16.41 | 246 | 30 | 6.0 | 1009 | 1820 | 1.786065 | |
| 24 | LOYALTY ISLANDS | 01/05/86 | 19:31:42 | 19:49:00 | 21.85 | 170.13 | 16.72 | 247 | 71 | 5.7 | 1038 | 1855 | 1.873737 | |
| 25 | LOYALTY ISLANDS | 01/15/86 | 20:17:31 | 20:33:57 | 21.37 | 170.31 | 17.06 | 246 | 144 | 6.0 | 986 | 1900 | 1.830443 | |
| 26 | LOYALTY ISLANDS | 01/I6/80 | 4:00:27 | 4:17:50 | 21.85 | 170.58 | 17.10 | 56 | 5.4 | 1043 | 1900 | 1.859100 | ||
| 27 | LOYALTY ISLANDS | 02/17/91 | 6:59:14 | 7:16:23 | 21.17 | 169.76 | 16.67 | 245 | 73 | 5.5 | 1029 | 1865 | 0.791260 | |
| 28 | LOYALTY ISLANDS | 07/31/88 | 12:50:11 | 13:06:41 | 22.26 | 171.02 | 16.61 | 85 | 5.7 | 990 | 1845 | 1.904025 | ||
| 29 | LOYALTY ISLANDS | 09/21/88 | 11:04:51 | 11:21:00 | 22.27 | 170.97 | 17.28 | 88 | 5.1 | 969 | 1920 | 1.865889 | ||
| 30 | LOYALTY ISLANDS | 10/29/81 | 12:06:48 | 12:23:47 | 23.65 | 169.11 | 15.21 | 252 | 18 | 5.1 | 1019 | 1690 | 1.855240 | |
| 31 | LOYALTY ISLANDS | 11/15/84 | 2:46:21 | 3:03:22 | 22.00 | 170.01 | 17.33 | 248 | 110 | 6.3 | 1021 | 1920 | 1.047262 | |
| 32 | MACQUARIE ISLAND | 03/09/87 | 6:40:11 | 7:17:00 | 58.86 | 158.80 | 31.70 | 15 | 5.9 | 2209 | 3520 | 2.046512 | ||
| 33 | MACQUARIE ISLAND | 05/23/84 | 5:16:34 | 5:44:00 | 51.88 | 161.08 | 25.25 | 342 | 10 | 5.8 | 1646 | 2800 | 2.777778 | |
| 34 | MACQUARIE ISLAND | 09/17/90 | 13:47:26 | 14:15:00 | 53.17 | 159.64 | 26.25 | 346 | 10 | 5.9 | 1654 | 2910 | 1.767922 | |
| 35 | MACQUARIE ISLAND | 11/15/80 | 19:10:57 | 19:48:37 | 52.34 | 160.07 | 22.61 | 10 | 5.7 | 2260 | 2500 | 1.511487 | ||
| 36 | MACQUARIE ISLAND | 12/31/84 | 21:42:10 | 22:21:27 | 60.21 | 153.80 | 32.81 | 359 | 10 | 5.3 | 2357 | 3645 | 1.650068 | |
| 37 | NEW CALEDONIA | 02/24/91 | 9:36:57 | 9:52:00 | 22.72 | 166.64 | 13.40 | 247 | 33 | 4.9 | 903 | 1490 | 1.027590 | |
| 38 | NEW CALEDONIA | 09/18/81 | 9:07:17 | 9:24:05 | 22.81 | 167.60 | 14.22 | 248 | 33 | 4.4 | 1008 | 1580 | 1.644121 | |
| 39 | NEW CALEDONIA | 12/17/88 | 0:58:14 | 1:13:45 | 20.93 | 167.53 | 13.15 | 25 | 5.5 | 931 | 1465 | 1.011661 | ||
| 40 | NEW ZEALAND | 01/28/80 | 12:30:56 | 12:55:10 | 45.26 | 167.50 | 21.36 | 118 | 5.1 | 1454 | 2375 | 3.149867 | ||
| 41 | NW OF NZ | 05/25/88 | 13:25:23 | 13:41:39 | 30.70 | 167.70 | 13.43 | 10 | 4.8 | 976 | 1490 | 1.219313 | ||
| 42 | NW OF NZ | 07/26/87 | 21:59:38 | 22:12:12 | 30.23 | 105.80 | 11.77 | 10 | 5.2 | 754 | 1310 | 1.342213 | ||
| 43 | SOLOMON ISLANDS | 09/27/85 | 3:39:08 | 3:59:30 | 9.81 | 165.85 | 18.31 | 200 | 33 | 6.2 | 1222 | 2035 | 1.465083 | |
| 44 | SOUTH ISLAND NZ | 08/30/80 | 5:55:53 | 6:19:02 | 45.06 | 167.67 | 21.27 | 321 | 112 | 4.6 | 1389 | 2365 | 1.533720 | |
| 45 | SOUTH ISLAND NZ | 04/07/82 | 15:42:24 | 16:05:00 | 21.15 | 320 | 10 | 4.7 | 1356 | 2355 | 1.736726 | |||
| 46 | SOUTH ISLAND NZ | 12/09/85 | 12:53:02 | 13:16:30 | 45.40 | 107.36 | 21.40 | 322 | 80 | 5.1 | 1408 | 2380 | 1.690341 | |
| 47 | SOUTH ISLAND NZ | 03/06/88 | 23:27:35 | 23:47:20 | 44.06 | 107.04 | 21.11 | 82 | 5.7 | 1185 | 2455 | 2.071730 | ||
| 48 | SOUTH ISLAND NZ | 02/15/91 | 10:48:09 | 11:12:16 | 42.08 | 171.59 | 21.23 | 308 | 8 | 5.8 | 1447 | 2355 | 1.627505 | |
| 49 | SOUTH ISLAND NZ | 05/16/88 | 9:55:34 | 10:19:00 | 44.17 | 168.13 | 12 | 4.2 | 1406 | 2345 | 1.667852 | |||
| 50 | SOUTH ISLAND NZ | 05/27/81 | 18:57:18 | 19:23:00 | 48.48 | 164.48 | 332 | 12 | 4.6 | 1542 | 2345 | 1.520752 | ||
| 51 | SOUTH ISLAND NZ | 07/11/BG | 16:56:38 | 17:20:05 | 44.54 | 167.45 | 20.78 | 321 | 12 | 4.2 | 1407 | 2310 | 1.641791 | |
| 52 | SOUTH ISLAND NZ | 09/27/84 | 21:41:05 | 22:04:21 | 44 14 | 168.66 | 21.04 | 317 | 1 | 4.7 | 1396 | 2345 | 1.679799 | |
| 53 | SOUTH ISLAND NZ | 11/22/81 | 18:37:00 | 19:00:15 | 44.46 | 167.63 | 20.80 | 320 | 18 | 1395 | 2310 | 1.655914 | ||
| 54 | SOUTH ISLAND NZ | O6/09/88 | 12:10:04 | 12:33:30 | 44.00 | 167.48 | 65 | 4.2 | 1406 | 2345 | 1.205036 | |||
| 55 | SOUTH ISLAND NZ | O6/14/88 | 15:43:21 | 16:07:00 | 44.4? | 168.34 | 8 | 4.2 | 1419 | 2345 | 1.652572 | |||
| 56 | VANUATU | 10/07/86 | 12:41:29 | 12:58:08 | 19.52 | 169.16 | 16.94 | 239 | 21 | 6.2 | 999 | 1880 | 1.881882 | |
| 57 | VANUATU | 12/08/90 | 21:25:24 | 21:41:50 | 19.48 | 169.12 | 16.93 | 239 | 164 | 6.3 | 986 | 1880 | 1.906694 | |
| 58 | VANUATU | 04/00/84 | 23:08:22 | 23:25:10 | 18.95 | 108.89 | 17.02 | 237 | 185 | 5.8 | 1008 | 1890 | 1.875000 | |
| 59 | VANUATU | 05/28/81 | 21:04:22 | 21:18:00 | 15.01 | 166.97 | 18.06 | 225 | 121 | 4.8 | 818 | 2010 | 2.409287 | |
| 60 | W COAST, SOUTH ISLAND NZ | 03/04/86 | 14:09:04 | 14:33:22 | 45.81 | 165.24 | 20.89 | 327 | 33 | 4.8 | 1458 | 2320 | 1.591221 | |
| 61 | W COAST, SOUTH ISLAND NZ | 11/07/86 | 8:27:46 | 8:51:30 | 45.96 | 166.33 | 21.43 | 325 | 33 | 5.3 | 1424 | 2380 | 1.671348 | |
| 62 | W COAST, SOUTH ISLAND NZ | 01/31/85 | 4:32:58 | 4:56:00 | 46.01 | 165.16 | 21.02 | 328 | 10 | 5.8 | 1382 | 2335 | 1.689580 | |
| 63 | W COAST, SOUTH ISLAND NZ | 05/15/88 | 18:26:16 | 18:45:53 | 43.85 | 168.68 | 20.84 | 10 | 5.5 | 1177 | 2310 | 1.962617 | ||
| 64 | W COAST, SOUTH ISLAND NZ | 05/15/88 | 19:18:25 | 19:42:00 | 43.94 | 168.46 | 20.80 | 4 | 4.0 | 1415 | 2310 | 1.632509 | ||
| 65 | W COAST, SOUTH ISLAND NZ | 06/15/81 | 2:31:18 | 2:56:00 | 48.46 | 165.11 | 23.12 | 331 | 33 | 5.2 | 1482 | 2565 | 1.730769 | |
| 66 | W COAST, SOUTH ISLAND NZ | 06/27/81 | 21:39:00 | 22:04:00 | 48.80 | 164.20 | 23.14 | 333 | 33 | 4.4 | 1500 | 266 | 1.710000 | |
| 67 | W COAST, SOUTH ISLAND NZ | 09/21/85 | 13:50:15 | 14:14:26 | 46.37 | 165.78 | 21.86 | 327 | 22 | 4.9 | 1451 | 2435 | 1.678153 | |
| 68 | W COAST, SOUTH ISLAND NZ | 12/23/81 | 14:58:19 | 15:24:00 | 47.74 | 105.77 | 329 | 10 | 3.8 | 1541 | 2665 | 1.752137 | ||
Disclaimer/Publisher’s Note: The statements, opinions and data contained in all publications are solely those of the individual author(s) and contributor(s) and not of MDPI and/or the editor(s). MDPI and/or the editor(s) disclaim responsibility for any injury to people or property resulting from any ideas, methods, instructions or products referred to in the content. |
© 2023 by the authors. Licensee MDPI, Basel, Switzerland. This article is an open access article distributed under the terms and conditions of the Creative Commons Attribution (CC BY) license (https://creativecommons.org/licenses/by/4.0/).
Share and Cite
Lynam, C.J.; Karunaratne, A. Citizen Science and The University of Queensland Seismograph Stations (UQSS)—A Study of Seismic T Waves in S-W Pacific Ocean. Sustainability 2023, 15, 10885. https://doi.org/10.3390/su151410885
Lynam CJ, Karunaratne A. Citizen Science and The University of Queensland Seismograph Stations (UQSS)—A Study of Seismic T Waves in S-W Pacific Ocean. Sustainability. 2023; 15(14):10885. https://doi.org/10.3390/su151410885
Chicago/Turabian StyleLynam, Colin John, and Asanka Karunaratne. 2023. "Citizen Science and The University of Queensland Seismograph Stations (UQSS)—A Study of Seismic T Waves in S-W Pacific Ocean" Sustainability 15, no. 14: 10885. https://doi.org/10.3390/su151410885
APA StyleLynam, C. J., & Karunaratne, A. (2023). Citizen Science and The University of Queensland Seismograph Stations (UQSS)—A Study of Seismic T Waves in S-W Pacific Ocean. Sustainability, 15(14), 10885. https://doi.org/10.3390/su151410885