
Investigation of the Microenvironment, Land Cover Characteristics, and Social Vulnerability of Heat-Vulnerable Bus Stops in Knoxville, Tennessee


Abstract
1. Introduction
2. Methods
2.1. Study Area
2.2. Data Acquisition and Processing
2.2.1. Bus Stop with the Highest Temperature and Heat Index
2.2.2. Microenvironment of Bus Stops
2.2.3. Social Vulnerability
3. Results
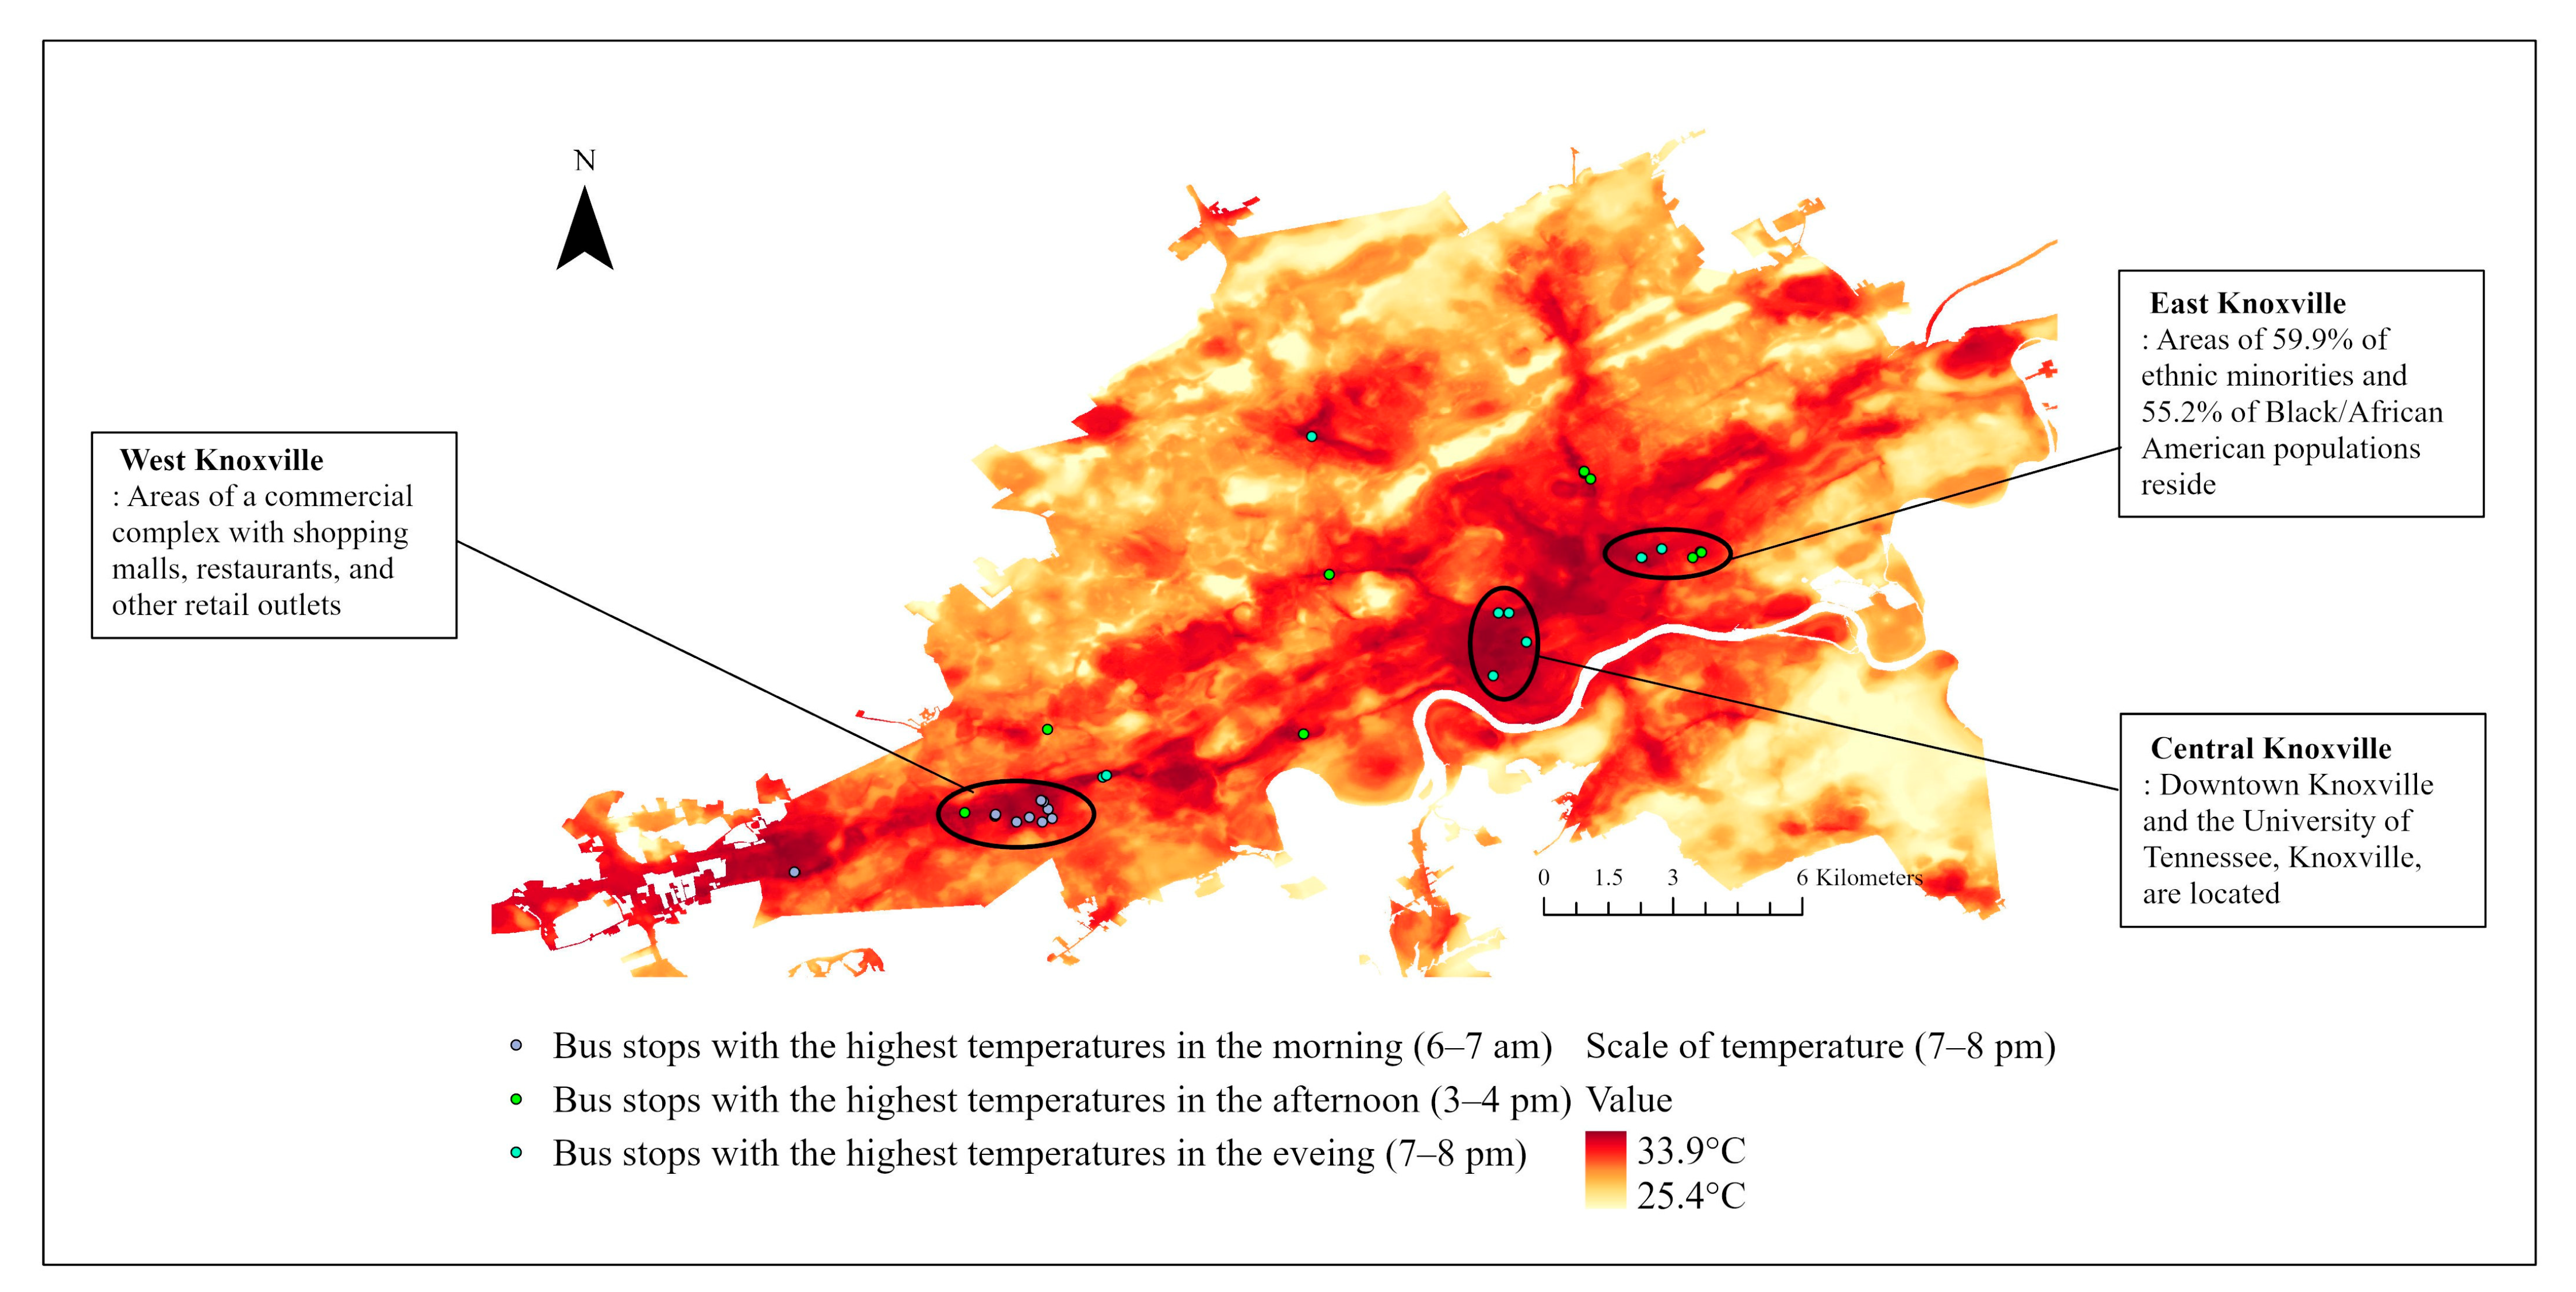
3.1. Bus Stops with the Highest Temperature
3.2. Bus Stops with the Highest Heat Index
3.3. Land Cover Characteristics on Bus Stops
3.4. Presence of Trees and Shelters
3.5. SVI in the Areas Where the Most Heat-Vulnerable Bus Stops Are Located
4. Discussion
5. Conclusions
Supplementary Materials
Author Contributions
Funding
Institutional Review Board Statement
Informed Consent Statement
Data Availability Statement
Conflicts of Interest
References
- Reidmiller, D.R.; Avery, C.W.; Easterling, D.R.; Kunkel, K.E.; Lewis, K.L.M.; Maycock, T.K.; Stewart, B.C. Impacts, Risks, and Adaptation in the United States: Fourth National Climate Assessment, Volume II. 2017. Available online: https://repository.library.noaa.gov/view/noaa/19487 (accessed on 10 April 2023).
- Maxwell, K.; Julius, S.; Grambsch, A.; Kosmal, A.; Larson, L.; Sonti, N. Built Environment, Urban Systems, and Cities. 2018. Available online: https://doi.org/10.7930/NCA4.2018.CH11 (accessed on 10 April 2023).
- Laird, B.; Ashbaugh, M.; Khemani, M.; Murray, S. Wichita Climate: Using Satellite Data to Identify Neighborhoods Vulnerable to Extreme Heat for Equitable Climate Mitigation and Planning. Tech Report. 2022. Available online: https://ntrs.nasa.gov/citations/20220013729 (accessed on 10 April 2023).
- Tan, J.; Zheng, Y.; Tang, X.; Guo, C.; Li, L.; Song, G.; Zhen, X.; Yuan, D.; Kalkstein, A.J.; Li, F.; et al. The urban heat island and its impact on heat waves and human health in Shanghai. Int. J. Biometeorol. 2010, 54, 75–84. [Google Scholar] [CrossRef]
- Hsu, A.; Sheriff, G.; Chakraborty, T.; Manya, D. Disproportionate exposure to urban heat island intensity across major US cities. Nat. Commun. 2021, 12, 2721. [Google Scholar] [CrossRef] [PubMed]
- Vaidyanathan, A.; Malilay, J.; Schramm, P.; Saha, S. Heat-related deaths—United States, 2004–2018. MMWR Morb. Mortal. Wkly. Rep. 2020, 69, 729–734. [Google Scholar] [CrossRef] [PubMed]
- Ashbaugh, M.; Khemani, M.; Laird, B.; Murray, S. Environmental Justice & Climate Change in Wichita, Kansas. 2022. Available online: https://ntrs.nasa.gov/citations/20220013018 (accessed on 9 May 2023).
- Li, D.; Newman, G.D.; Wilson, B.; Zhang, Y.; Brown, R.D. Modeling the relationships between historical redlining, urban heat, and heat-related emergency department visits: An examination of 11 Texas cities. Environ. Plan. B Urban Anal. City Sci. 2022, 49, 933–952. [Google Scholar] [CrossRef]
- Rothstein, R. The Color of Law: A Forgotten History of How Our Government Segregated America; Liveright: New York, NY, USA, 2018. [Google Scholar]
- Mital, A. Change in environmental justice scores in historically redlined communities compared to non-redlined communities: A case study of Richmond, Virginia. Urban Clim. 2023, 49, 101505. [Google Scholar] [CrossRef]
- Burke, L.M.; Schwalbach, J. Housing Redlining and Its Lingering Effects on Education Opportunity. Backgrounder. No. 3594. Heritage Foundation. 2021. Available online: https://www.heritage.org/education/report/housing-redlining-and-its-lingering-effects-education-opportunity (accessed on 9 May 2023).
- Aaronson, D.; Hartley, D.; Mazumder, B. The effects of the 1930s HOLC “Redlining” maps. Am. Econ. J. Econ. Policy 2021, 13, 355–392. [Google Scholar] [CrossRef]
- Lanza, K.; Stone, B., Jr.; Haardörfer, R. How race, ethnicity, and income moderate the relationship between urban vegetation and physical activity in the United States. Prev. Med. 2019, 121, 55–61. [Google Scholar] [CrossRef]
- Nardone, A.; Rudolph, K.E.; Morello-Frosch, R.; Casey, J.A. Redlines and greenspace: The relationship between historical redlining and 2010 greenspace across the United States. Environ. Health Perspect. 2021, 129, 17006. [Google Scholar] [CrossRef]
- Miller, P.; de Barros, A.G.; Kattan, L.; Wirasinghe, S.C. Public transportation and sustainability: A review. KSCE J. Civ. Eng. 2016, 20, 1076–1083. [Google Scholar] [CrossRef]
- Hamurcu, M.; Eren, T. Strategic Planning Based on Sustainability for Urban Transportation: An Application to Decision-Making. Sustainability 2020, 12, 3589. [Google Scholar] [CrossRef]
- Klinenberg, E. Heat Wave: A Social Autopsy of Disaster in Chicago; University of Chicago Press: Chicago, IL, USA, 2015. [Google Scholar]
- Cutter, S.L.; Boruff, B.J.; Shirley, W.L. Social vulnerability to environmental hazards. Soc. Sci. Q. 2003, 84, 242–261. [Google Scholar] [CrossRef]
- Biswas, S. A review of socio-economic vulnerability: The emergence of its theoretical concepts, models and methodologies. Nat. Hazards 2023. [Google Scholar] [CrossRef]
- Breil, M.; Downing, C.; Kazmierczak, A.; Mäkinen, K.; Romanovska, L.; Terämä, E.; Swart, R. Social Vulnerability to Climate Change in European Cities–State of Play in Policy and Practice. Tech Report. 2018. Available online: https://www.eionet.europa.eu/etcs/etc-cca/products/etc-cca-reports/tp_1-2018 (accessed on 10 April 2023).
- Kamruzzaman, M.; Hine, J.; Yigitcanlar, T. Investigating the link between carbon dioxide emissions and transport-related social exclusion in rural Northern Ireland. Int. J. Environ. Sci. Technol. 2015, 12, 3463–3478. [Google Scholar] [CrossRef]
- Deilami, K.; Kamruzzaman, M. Modelling the urban heat island effect of smart growth policy scenarios in Brisbane. Land Use Policy 2017, 64, 38–55. [Google Scholar] [CrossRef]
- Cervero, R.; Sullivan, C. Green TODs: Marrying transit-oriented development and green urbanism. Int. J. Sustain. Dev. World Ecol. 2011, 18, 210–218. [Google Scholar] [CrossRef]
- Chakraborty, T.; Hsu, A.; Manya, D.; Sheriff, G. Disproportionately higher exposure to urban heat in lower-income neighborhoods: A multi-city perspective. Environ. Res. Lett. 2019, 14, 105003. [Google Scholar] [CrossRef]
- Macintyre, H.L.; Heaviside, C.; Taylor, J.; Picetti, R.; Symonds, P.; Cai, X.M.; Vardoulakis, S. Assessing urban population vulnerability and environmental risks across an urban area during heatwaves—Implications for health protection. Sci. Total Environ. 2018, 610–611, 678–690. [Google Scholar] [CrossRef]
- Zhao, F.; Gustafson, T. Transportation Needs of Disadvantaged Populations: Where, When, and How? 2013. Available online: https://doi.org/10.21949/1503567 (accessed on 9 May 2023).
- Beirão, G.; Sarsfield Cabral, J.A. Understanding attitudes towards public transport and private car: A qualitative study. Transp. Policy 2007, 14, 478–489. [Google Scholar] [CrossRef]
- U.S. Census Bureau. QuickFacts: Knoxville City, Tennessee. n.d. Available online: https://www.census.gov/quickfacts/knoxvillecitytennessee (accessed on 10 May 2023).
- National Weather Service. Knoxville Climate Page. n.d. Available online: https://www.weather.gov/mrx/tysclimate (accessed on 9 May 2023).
- Climatecheck. Knoxville, TN, Top Climate Change Risks: Precipitation, Heat, Fire | Climate Change Hazard Rating for Knoxville, TN. n.d. Available online: https://climatecheck.com/tennessee/knoxville (accessed on 9 May 2023).
- The University of Tennessee, Knoxville. 2022 Knoxville Heat Equity Coalition: Knoxville’s Heat Mapping Report. n.d. Available online: https://heatequity.utk.edu/ (accessed on 9 May 2023).
- City of Knoxville, Tennessee. Knoxville Area Transit (KAT) GTFS feed. n.d. Available online: https://www.knoxvilletn.gov/cms/One.aspx?portalId=109562&pageId=11688599 (accessed on 10 May 2023).
- Lanza, K.; Oluyomi, A.; Durand, C.; Gabriel, K.P.; Knell, G.; Hoelscher, D.M.; Ranjit, N.; Salvo, D.; Walker, T.J.; Kohl, H.W., 3rd. Transit environments for physical activity: Relationship between micro-scale built environment features surrounding light rail stations and ridership in Houston, Texas. J. Transp. Health. 2020, 19, 100924. [Google Scholar] [CrossRef]
- U.S. Geological Survey. National Land Cover Database Active. National Land Cover Database. n.d. Available online: https://www.usgs.gov/centers/eros/science/national-land-cover-database (accessed on 10 April 2023).
- Dzyuban, Y.; Hondula, D.M.; Coseo, P.J.; Redman, C.L. Public transit infrastructure and heat perceptions in hot and dry climates. Int. J. Biometeorol. 2022, 66, 345–356. [Google Scholar] [CrossRef]
- Lanza, K.; Durand, C.P. Heat-moderating effects of bus stop shelters and tree shade on public transport ridership. Int. J. Environ. Res. Public Health 2021, 18, 463. [Google Scholar] [CrossRef]
- USGS EROS Archive. Aerial Photography. National Agriculture Imagery Program (NAIP). n.d. Available online: https://www.usgs.gov/centers/eros/science/usgs-eros-archive-aerial-photography-national-agriculture-imagery-program-naip (accessed on 10 May 2022).
- U.S. Census Bureau. Tiger/line Shapefiles. 2022. Available online: https://www.census.gov/geographies/mapping-files/time-series/geo/tiger-line-file.html (accessed on 10 April 2023).
- Reid, C.E.; Mann, J.K.; Alfasso, R.; English, P.B.; King, G.C.; Lincoln, R.A.; Margolis, H.G.; Rubado, D.J.; Sabato, J.E.; West, N.L.; et al. Evaluation of a Heat Vulnerability Index on Abnormally Hot Days: An Environmental Public Health Tracking Study. Environ. Health Perspect. 2012, 120, 715–720. [Google Scholar] [CrossRef] [PubMed]
- Cutter, S.L. GI Science, Disasters, and Emergency Management. Trans. GIS 2003, 7, 439–446. [Google Scholar] [CrossRef]
- O’Neill, M.S.; Zanobetti, A.; Schwartz, J. Disparities by race in heat-related mortality in four US cities: The role of air conditioning prevalence. J. Urban Health 2005, 82, 191–197. [Google Scholar] [CrossRef]
- Sharma, A.; Conry, P.; Fernando, H.J.S.; Hamlet, A.F.; Hellmann, J.J.; Chen, F. Green and cool roofs to mitigate urban heat island effects in the Chicago metropolitan area: Evaluation with a regional climate model. Environ. Res. Lett. 2016, 11, 064004. [Google Scholar] [CrossRef]
- U.S. Centers for Disease Control and Prevention, Agency for Toxic Substances and Disease Registry, Geospatial Research, Analysis, and Services Program. CDC/ATSDR Social Vulnerability Index 2018 Database Tennessee. 2018. Available online: https://www.atsdr.cdc.gov/placeandhealth/svi/index.html (accessed on 10 April 2023).
- Lever, J.; Krzywinski, M.; Altman, N. Principal component analysis. Nat. Methods 2017, 14, 641–642. [Google Scholar] [CrossRef]
- Chen, T.-L.; Lin, H.; Chiu, Y.-H. Heat vulnerability and extreme heat risk at the metropolitan scale: A case study of Taipei metropolitan area, Taiwan. Urban Clim. 2022, 41, 101054. [Google Scholar] [CrossRef]
- Neely, J. From the Shadow Side: And Other Stories of Knoxville, Tennessee; Tellico Books: Oak Ridge, TN, USA, 2003; pp. 125–139. [Google Scholar]
- Multi-Resolution Land Characteristics Consortium. National Land Cover Database Class Legend and Description. Available online: https://www.mrlc.gov/data/legends/national-land-cover-database-class-legend-and-description (accessed on 10 April 2023).
- Chen, Y.M.; Su, J.L.; Fan, K.S. Disaster risk assessment development trend. J. Crisis Manag. 2009, 6, 41–50. [Google Scholar]
- EPA. Technical Documentation: Heat Waves. 2021. Available online: https://www.epa.gov/climate-indicators/climate-change-indicators-heat-waves (accessed on 10 April 2023).
- EPA. Climate Change and Extreme Heat: What You Can Do to Prepare. 2016. Available online: https://www.cdc.gov/disasters/extremeheat/index.html (accessed on 10 April 2023).
- Lee, S.; First, J.M. Mental health impacts of tornadoes: A systematic review. Int. J. Environ. Res. Public Health 2022, 19, 13747. [Google Scholar] [CrossRef]
- First, J.M.; Ellis, K.; Held, M.L.; Glass, F. Identifying risk and resilience factors impacting mental health among Black and Latinx adults following nocturnal tornadoes in the U.S. Southeast. Int. J. Environ. Res. Public Health 2021, 18, 8609. [Google Scholar] [CrossRef]
- Hansson, S.; Orru, K.; Siibak, A.; Bäck, A.; Krüger, M.; Gabel, F.; Morsut, C. Communication-related vulnerability to disasters: A heuristic framework. Int. J. Disaster Risk Reduct. 2020, 51, 101931. [Google Scholar] [CrossRef]
- UCAR Center for Science Education. How Weather Affects Air Quality. Available online: https://scied.ucar.edu/learning-zone/air-quality/how-weather-affects-air-quality (accessed on 10 April 2023).


| Vulnerability Aspects | Descriptions | Variable Names |
|---|---|---|
| Socioeconomic status | % of people below 150% poverty estimate | EP_POV |
| Unemployment rate estimate | EP_UNEMP | |
| % of people with no high school diploma (age 25+) estimate | EP_NOHSDP | |
| Household characteristics | % of people aged 65 and older estimate, 2014–2018 American Community Survey (ACS) | EP_AGE65 |
| % of people aged 17 and younger estimate, 2014–2018 ACS | EP_AGE17 | |
| % of civilian noninstitutionalized population with a disability estimate, 2014–2018 ACS | EP_DISABL | |
| Racial and ethnic minority status | % of minority (all people except white, non-Hispanic) estimate, 2014–2018 ACS | EP_MINRTY |
| % of Black/African American population estimate | EP_AFAM | |
| Housing and transportation | % of households with no vehicle available estimate | EP_NOVEH |
| % of people in institutionalized group quarters estimate, 2014–2018 ACS | EP_GROUPQ |
| Vulnerability Aspects | Variable Names | PC1 | PC2 | The Number of Bus Stops in Census Tracts with Variable Scores below Knox County’s Average |
|---|---|---|---|---|
| Socioeconomic status | EP_POV | 0.609 | −0.701 | 22 |
| EP_UNEMP | 0.559 | −0.174 | 24 | |
| EP_NOHSDP | 0.677 | 0.338 | 22 | |
| Household characteristics | EP_AGE65 | −0.330 | 0.799 | 22 |
| EP_AGE17 | 0.183 | 0.820 | 11 | |
| EP_DISABL | 0.347 | 0.764 | 28 | |
| Racial and ethnic minority status | EP_MINRTY | 0.865 | 0.117 | 24 |
| EP_AFAM | 0.926 | 0.101 | 26 | |
| Housing and transportation | EP_NOVEH | 0.711 | −0.268 | 23 |
| EP_GROUPQ | 0.082 | −0.755 | 21 | |
| Eigenvalue | 3.619 | 3.100 | ||
| Proportion (%) | 35.228 | 31.963 | ||
| Culminative (%) | 35.228 | 31.963 | ||
| KMO test | 0.685 (p < 0.001) | |||
| Bartlett’s test | Test value: 222.470, degrees of freedom: 45 | |||
Disclaimer/Publisher’s Note: The statements, opinions and data contained in all publications are solely those of the individual author(s) and contributor(s) and not of MDPI and/or the editor(s). MDPI and/or the editor(s) disclaim responsibility for any injury to people or property resulting from any ideas, methods, instructions or products referred to in the content. |
© 2023 by the authors. Licensee MDPI, Basel, Switzerland. This article is an open access article distributed under the terms and conditions of the Creative Commons Attribution (CC BY) license (https://creativecommons.org/licenses/by/4.0/).
Share and Cite
Lee, S.; First, J.M. Investigation of the Microenvironment, Land Cover Characteristics, and Social Vulnerability of Heat-Vulnerable Bus Stops in Knoxville, Tennessee. Sustainability 2023, 15, 10866. https://doi.org/10.3390/su151410866
Lee S, First JM. Investigation of the Microenvironment, Land Cover Characteristics, and Social Vulnerability of Heat-Vulnerable Bus Stops in Knoxville, Tennessee. Sustainability. 2023; 15(14):10866. https://doi.org/10.3390/su151410866
Chicago/Turabian StyleLee, Sangwon, and Jennifer M. First. 2023. "Investigation of the Microenvironment, Land Cover Characteristics, and Social Vulnerability of Heat-Vulnerable Bus Stops in Knoxville, Tennessee" Sustainability 15, no. 14: 10866. https://doi.org/10.3390/su151410866
APA StyleLee, S., & First, J. M. (2023). Investigation of the Microenvironment, Land Cover Characteristics, and Social Vulnerability of Heat-Vulnerable Bus Stops in Knoxville, Tennessee. Sustainability, 15(14), 10866. https://doi.org/10.3390/su151410866