Article

Impact of Spatial Configuration on Promoting Lifelong Learning Development in Pathum Thani, Thailand

by
Pawinee Iamtrakul
1,*,
Sararad Chayphong
1 and
Alexander M. Crizzle
2
1
Center of Excellence in Urban Mobility Research and Innovation, Faculty of Architecture and Planning, Thammasat University, Pathum Thani 12120, Thailand
2
School of Public Health, University of Saskatchewan, Saskatoon, SK S7N 5E5, Canada
*
Author to whom correspondence should be addressed.
Sustainability 2023, 15(14), 10791; https://doi.org/10.3390/su151410791
Submission received: 3 June 2023 / Revised: 27 June 2023 / Accepted: 4 July 2023 / Published: 10 July 2023

Abstract

:
A “Learning City” uses its resources to enhance learning opportunities for individuals and communities that promote social cohesion, cultural prosperity and economic development. While the UNESCO network of learning cities provides guidelines for measuring social and economic prosperity, there have been no studies examining the current strengths and weaknesses of such cities in Thailand. The purpose of this study was to identify current strengths and opportunities for improvement in the Thanyaburi district of Thailand. We surveyed 400 residents to examine formal and informal learning activities, followed by layering the survey data using geographic information systems, to determine geographic differences in population size, density and transportation access. The findings show that formal and informal learning activities differ by the density and diversity of various geographical locations within the district according to urban centrality scores. The most popular activities were community-based, environmental and educational activities, respectively. However, various municipalities had few learning opportunities for local residents. Promoting lifelong learning opportunities is an essential response to establishing a vibrant environment for individuals, communities and cities and is a key driver to improving economic development (e.g., employment and education) and sustainability.

1. Introduction

Urban centrality refers to the capacity of an urban or peri-urban city to provide access to local and nearby services [1]. Urban centrality has typically been measured using spatial modeling to examine the urban structure [2,3,4] and its interactions with commuting patterns [5], population diversity, density [6], distance from the central business district and attractiveness [7]. In developing countries such as Thailand, urban centrality, with the context of urbanization, has become more challenging and complex, often resulting in urban sprawl with more fragmented areas at the outskirts of cities.
Urbanization is defined as the expansion of cities associated with increasing population densities resulting in land transformation to accommodate residential, commercial and industrial growth [8]. Urban planning is critically important to ensure that infrastructures, facilities and services are implemented to meet growing cities and to ensure its residents have an appropriate quality of life. Adequate urban planning practices can lead to reductions in poverty and inequality by providing better access to housing, employment and education [8]. For example, urban planning activities that developed commercial enterprises from agricultural lands have resulted in additional opportunities for farmers to earn higher incomes while also providing local residents with increased selection of consumer goods and products [9,10].
Urban planning initiatives, however, when implemented poorly, can also result in negative impacts. One issue is that higher income regions may receive additional provisions and services that improve the economy while lower income regions may not, furthering the divide between high- and low-income areas [11]. This divide is reflected when examining indicators related to population, economic and land developments [12]. Studies show that while urbanization can initially contribute to community improvement through private and commercial development, as cities and communities grow, there is often a lack of planning [9,13,14,15] to ensure cities and communities have access to important services and amenities [8].
The lack of amenities and services tends to be more pronounced in urban cities in developing countries [16]. For example, in Thailand, cities are growing at a rate much faster than the rate of development [17]. Even in large cities such as Bangkok, this phenomenon has extended beyond the immediate city core to peri-urban areas where population growth is rapidly increasing, including the adjacent provinces of Nakhon Pathom, Pathum Thani, Nonthaburi, Samut Prakan and Samut Sakhon [18,19]. The rapid change associated with urbanization has generated challenges to urban planning developments [20,21], including further increasing socio-economic divisions [22]. As all cities/communities are distinct in social and economic opportunities, urban planners must ensure these cities/communities are interconnected to facilitate opportunities to live, work, play and learn, otherwise known as “learning cities”. Incorporating activities related to learning cities will reduce the inequalities between cities and communities and narrow the divide among high- and low-income populations.
Studies show that adopting a “learning city” approach provides employment opportunities regardless of gender, age or socio-economic status, resulting in greater economic benefits [22,23,24]. This “learning city” initiative has now been adopted by seven cities in Thailand including Chiang Rai, Phuket, Chiang Mai, Chachoengsao, Sukhothai, Phayao and Hat Yai in Songkhla [22]. One of the goals of the learning city initiatives in Thailand is to promote lifelong learning. Lifelong learning promotes continuous learning over a person’s lifespan and refers to both formal (e.g., education) and informal (e.g., community participation) activities [22]. Lifelong learning is embedded within the UNESCO Institute for Lifelong Learning’s strategy to improve access to information that facilitates learning, skill development and employment opportunities [25,26,27].
Recent studies have moved towards creating “learning cities” by incorporating existing physical spaces and activities to foster community engagement. For example, Khurana (2022) converted physical spaces into learning spaces which improved accessibility and activity participation among community members [28]. Other studies have noted that lifelong learning through the provision of formal and informal community-based activities is integral to a city and/or communities’ development, which can be offered both in-person and virtually [24]. More importantly, the development or re-structuring of physical spaces is important to reduce barriers related to learning opportunities and to improve community integration and wellbeing, which has often been neglected in prior studies and is often influenced by various socio-economic factors [24,28,29]. While prior studies acknowledge the importance of including opportunities for learning, there is a dearth of literature on what activities various cities and communities currently provide and whether they are being accessed.
Studies show that integrating lifelong learning opportunities within cities must be considered with other disciplines including urban planning [24,30], spatial and environmental design [31,32,33] and inclusive and sustainable development [22,34] to maximize social and economic benefits. However, to better understand how urban planners can contribute to learning cities, a thorough understanding of a city’s strengths and weaknesses is critically important to ensure opportunity growth for all residents. We hypothesize that developed urban infrastructures, facilities and services (centrality scores) will be associated with a greater number of learning activities and better activity uptake. The objectives of this paper are to present a case study to (1) examine differences in urban characteristics in Pathum Thani province (urban centrality) and (2) to examine the influences of differences in spatial patterns and urban diversity on participation of learning activities in Pathum Thani province by focusing on Thanyaburi District. Findings from this study may show how different spatial configurations and urban structures influence the availability and uptake of various learning activities among different geographic regions and population characteristics.

2. Methodology

2.1. Site Selection

Bangkok is the most developed city in Thailand. While city development and expansion in Bangkok have slowed due to limited land space, nearby peri-urban cities such as in Pathum Thani province (north of Bangkok) is growing rapidly [35,36]. This phenomenon of suburbanization in peri-urban areas has resulted in increasing population densities associated with migration. Additionally, as migrants come from various regions of Thailand, these peri-urban areas include diverse cultures and interests, along with varying needs and demands related to employment, housing, facilities and services. However, public investment to develop appropriate infrastructures, facilities and services in peri-urban areas has not kept pace with how quickly they have been growing. The lack of infrastructures, services and facilities, in tandem with mixed cultures and interests, can result in inequalities among its residents with respect to employment opportunities, education, health and housing [36]. Furthermore, the complexity of urban hierarchical systems often results in a lack of inclusivity planning that reduces resident opportunities for housing, employment, education and service needs and does not adequately allow residents opportunities across their lifespan. A learning city for all ages is essential for providing lifelong learning opportunities to ensure residents have greater opportunities that can impact their lifespan. Incorporation of learning activities into peri-urban areas fosters stronger community ties and more educated and potentially more affluent residents. However, data show that the peri-urban area of Pathum Thani province has been overlooked due to its quick development together with ad hoc planning related to both formal and informal learning activities [22,30]. Thus, understanding the formal and informal learning activities residents use is critical to improving access to key activities that may be missing.
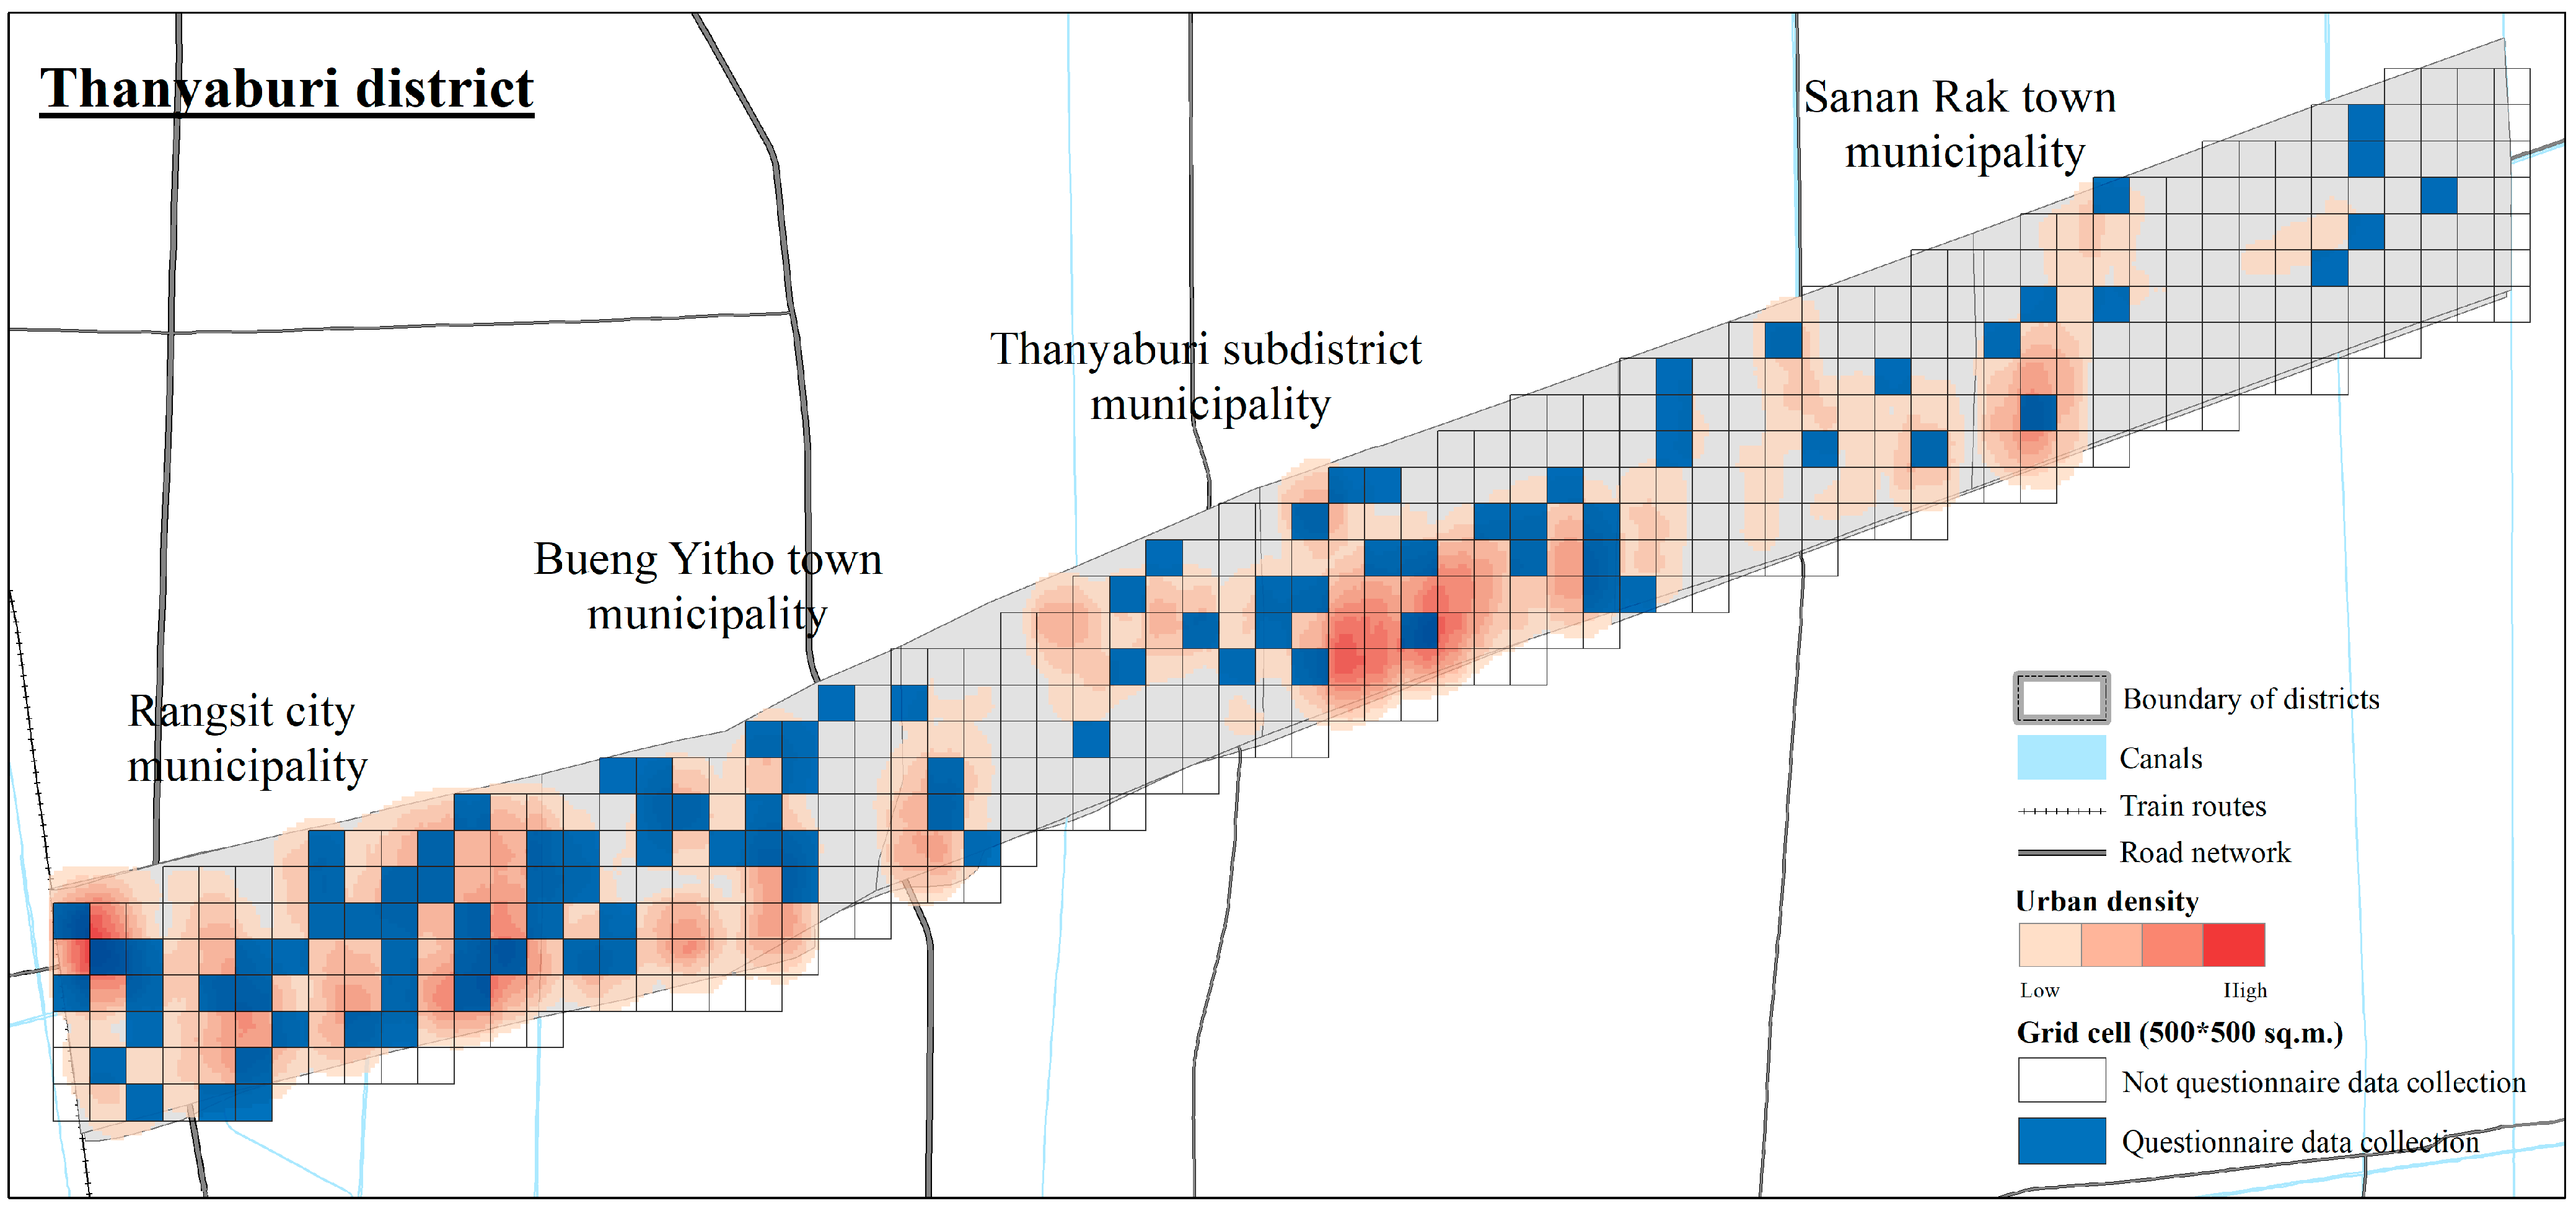
The geography of Pathum Thani province includes one major highway that connects to Bangkok, resulting in a large concentration of activities along a single corridor [37]. As shown in Figure 1, the Thanyaburi district of Pathum Thani province is divided into four municipalities—Rangsit city, Bueng Yitho, Thanyaburi and Sanan Rak—and has a total area of 112.124 square kilometers and a population of about 214,091 people [38]. Thanyaburi district has many learning activities and opportunities that include museums, science centers, shops, restaurants, libraries, agriculture and lifestyle learning facilities [30].

2.2. Questionnaire

A questionnaire was created to collect information from residents living in Thanyaburi district from December 2021 to February 2022 (Figure 2). The questionnaire captured information on demographics (e.g., age, gender, education (formal learning) and income) and informal learning activities. Informal learning activities included seven subsets of questions on education, enterprise, community, history, environment, culture, health and wellbeing. The activities were defined as (1) community (learning activities to appreciate the community’s way of life); (2) enterprise (activities related to professional skill development); (3) environment (learning activities for environmental preservation); (4) historical (activities for discovering the history of the area); (5) education (e.g., public libraries, museums); (6) cultural (learning activities related to culture, tradition and rituals); and (7) health and wellbeing (learning activities for self and family care, diet, physical activity, hobbies). The inclusion criteria required respondents to (1) be 15 years or older; (2) currently live in Thanyaburi district; and (3) have lived for at least one year in Thanyaburi district.
The questionnaire was disseminated to cover an area of 500 × 500 square meters to ensure data could be used for spatial analyses. The 500 × 500 grid is used for digitizing data and consists of layers from the questionnaire data to produce geographic information system (GIS) maps. This approach provides a method for examining participation in formal and informal activities to better understand usage patterns on a local level. This approach has been used in prior studies to better integrate urban planning with learning activity provisions [24,30,31,32,33] consistent with recommendations for inclusive communities and sustainable development [22,34]. Thus, using a 500 × 500 grid ensures we can capture sufficient information on activity accessibility within geographic areas of interest.
In total, a sample size of 400 was needed to ensure an appropriate representation of residents in Thanyaburi district based on a population size of 215,461 with a power of 80% and a confidence level of 95% [39]. The research team visited various communities in Thanyaburi district to recruit participants. The research team, consisting of 10 staff/student members, walked around the various areas to observe the community focal points (e.g., major intersections, shopping malls, parks). Participants were then approached at these focal points (convenience sampling) to solicit participation. The research team aimed to recruit participants from each community according to the population density distribution, as shown in Figure 2. Thus, there were less participants recruited in lower populated areas and more participants recruited in areas with high population density. The sample included 159 participants from the Rangsit city municipality, 55 from the Bueng Yitho town municipality, 119 from the Thanyaburi subdistrict municipality and 67 from the Sanan Rak town municipality, respectively.

2.3. GIS Modeling

Data from the questionnaire were integrated with spatial mapping using a geographic information system (GIS) to explore characteristics and geographics patterns of formal and informal learning activities in Thanyaburi district. By using GIS, the spatial mapping can uncover differences in geographic characteristics and patterns including diversity and density of activities, population and transportation system. The GIS program can showcase the functional structure of the city to visualize the locations where residents can access learning activities. Additionally, challenges with accessing learning activities (e.g., access to paved roads) and spaces can be observed from the spatial distribution of activities. Thus, spatial differences and accessibility of formal and informal learning in different geographic locations can be easily visualized. Data from the questionnaire were divided into a 500 × 500 sq. kilometer grid, resulting in 479 cells which allowed for visualized comparisons across the four different cities in Thanyaburi district. These visualized comparisons (spatial mapping) provide a better understanding of differences in social, economic and physical characteristics in each district. This approach has been used in prior studies to characterize spatial patterns [40,41].

2.4. Data Analysis

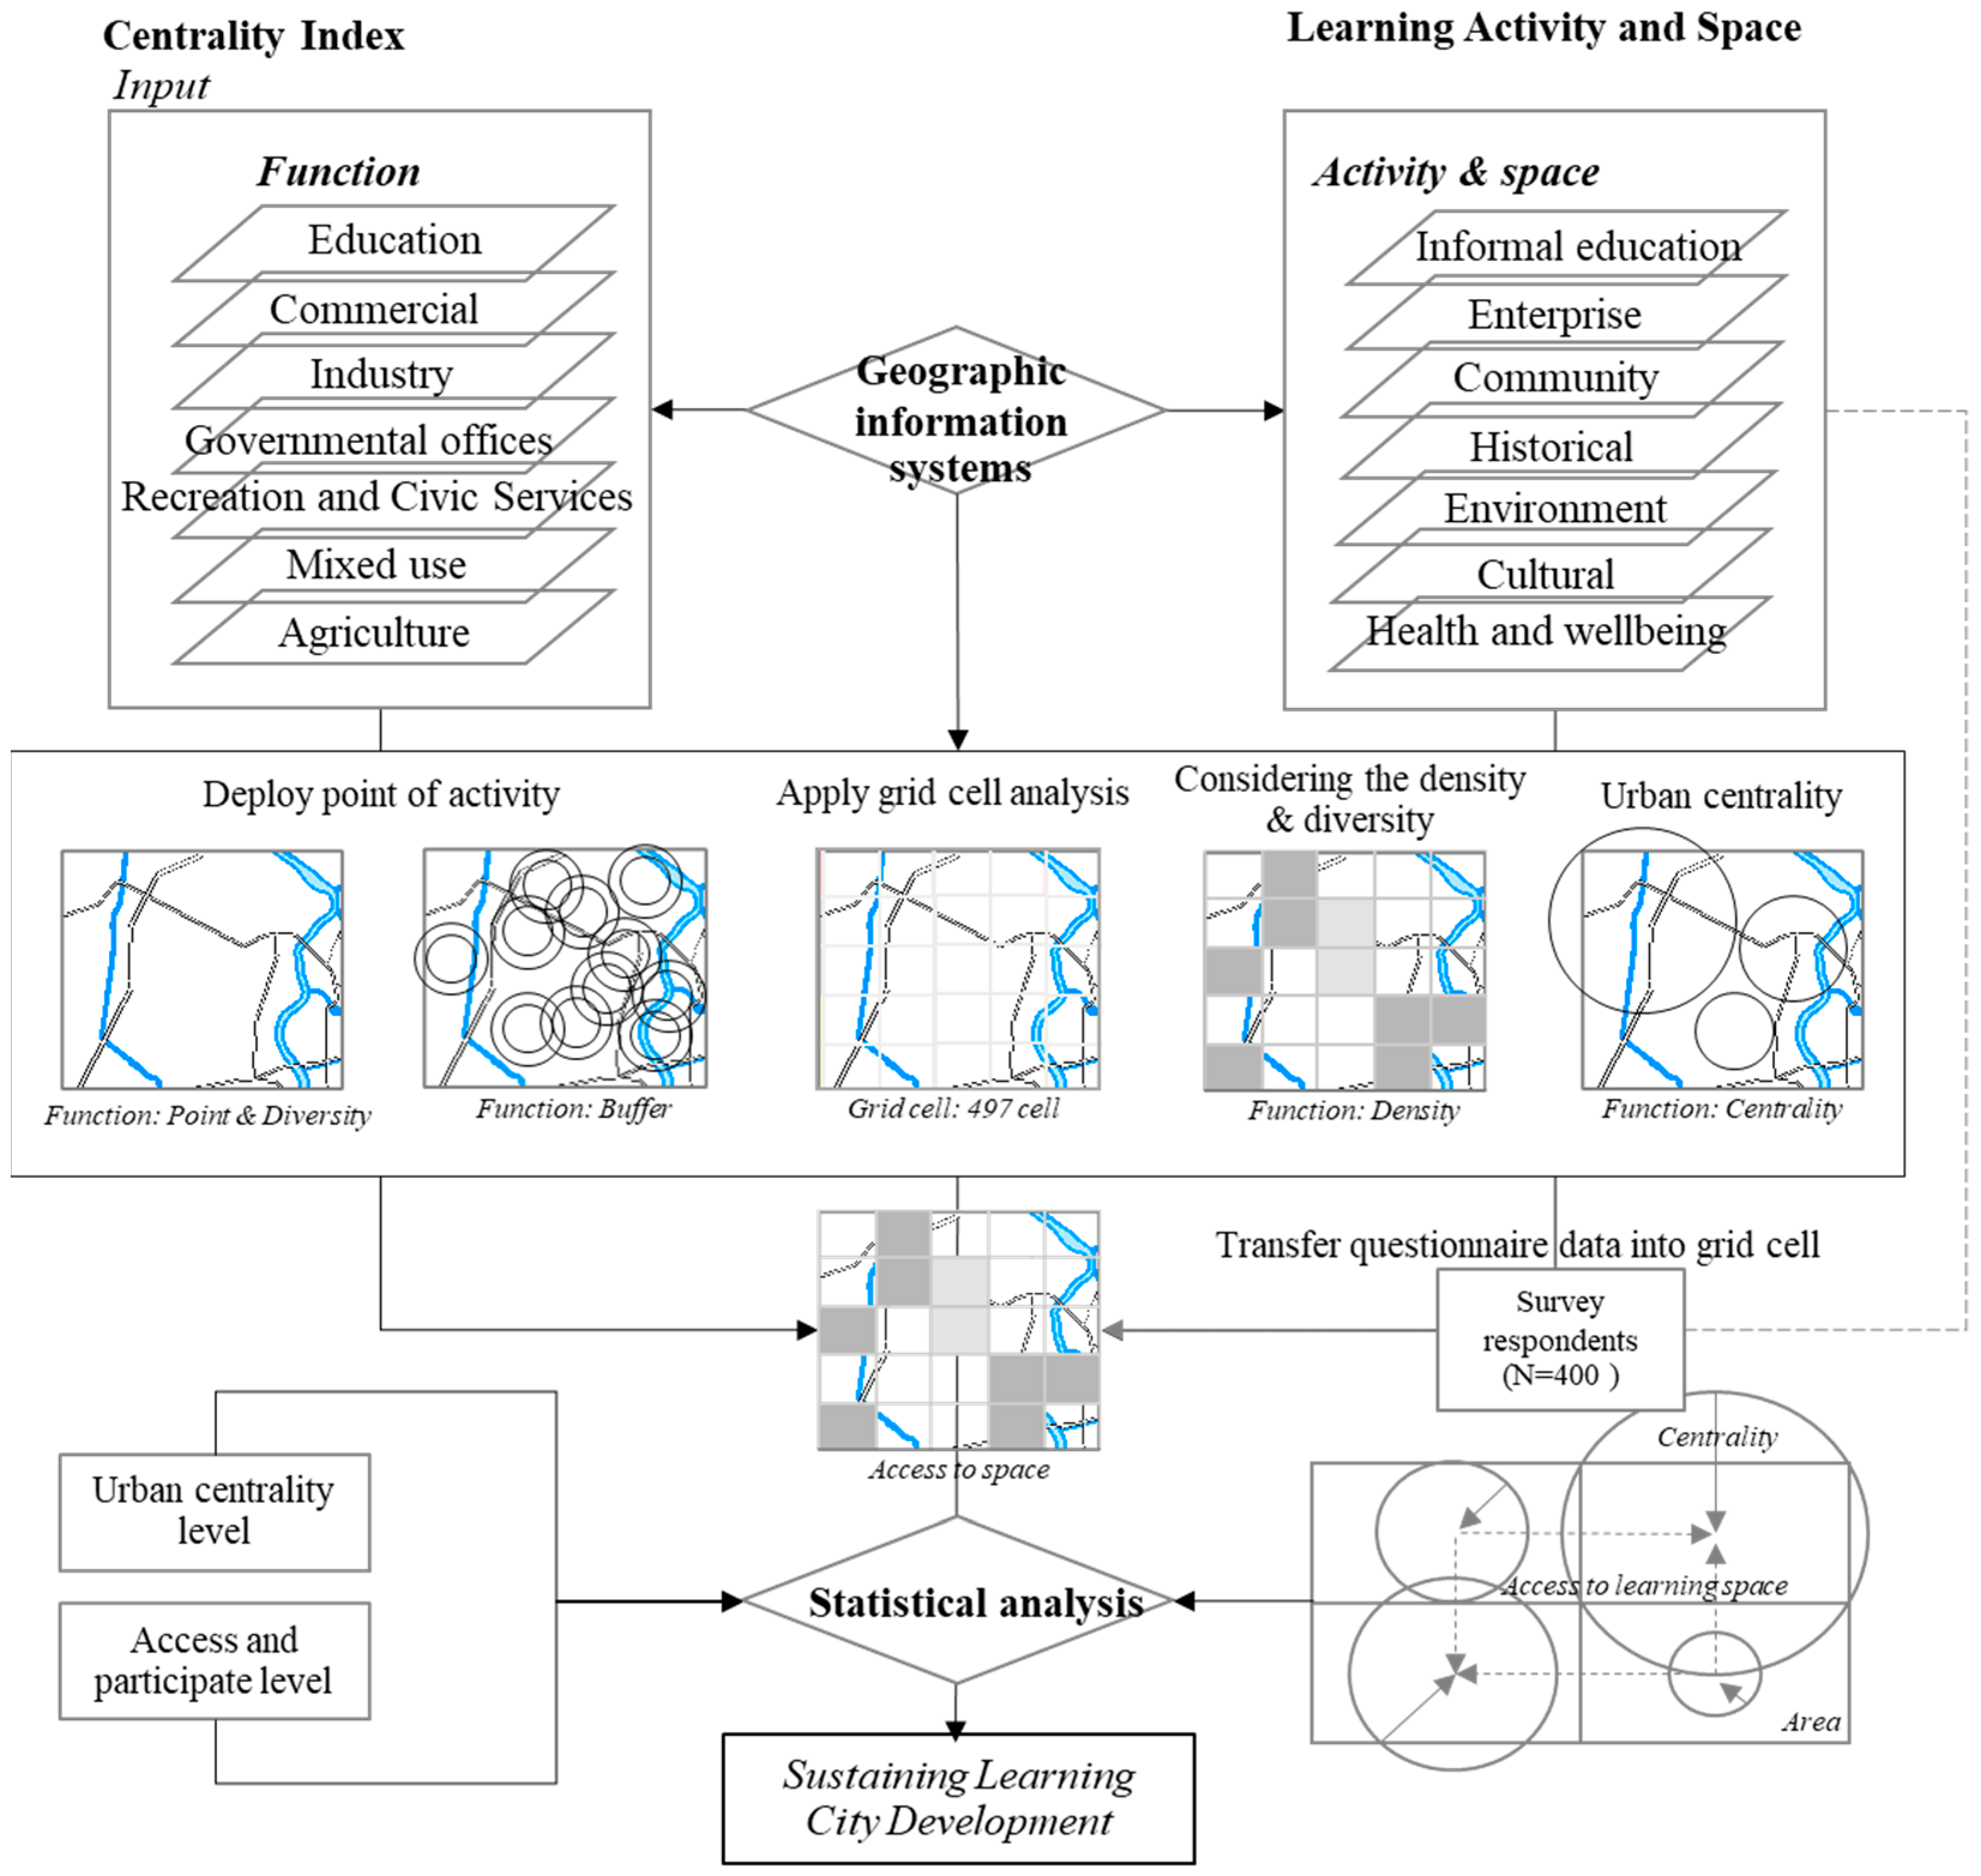
The association between urban centrality and participation in informal learning activities was examined using univariate analysis. SPSS Version 28.0 was used for all statistical analyses; significance level was p < 0.05. Questionnaire data on access and participation in informal learning activities using the seven categories (e.g., education, enterprise, community, history, environment, cultural, health and wellbeing) were layered into a spatial map to calculate an urban centrality score (see Figure 3). Spatial analysis was applied to identify patterns of respondents’ behavior in participating in learning activities. Then, spatial data were extracted into grid cells with an urban centrality score being calculated for each city in Thanyaburi district. The urban centrality score is used to understand different spatial characteristics related to the informal learning activities within a given area [1].
The urban centrality score counts the number of buildings related to the different informal learning activities. Each building represents possible learning opportunities for residents to access within each area. The urban centrality formula, as shown below, considers whether a defined area is monocentric or polycentric. Scores can range from 0 to 1 where 0 is extreme polycentric and 1 is extreme monocentric.
C I x = 100 i = 1 n x
Here, CIx is the centrality index of type x buildings; x is the type of building analyzed; n is the number of unit areas. Based on the centrality index, the diversity and density of each area can be calculated using the presence of city activity and the total number of city activities compared to other cities with the same activity.
In this study, building data were adopted to classify the main building groups into different types of building utilization (e.g., educational, commercial, industrial, governmental, recreation, mixed-use and agricultural). The centrality index was then used to calculate a hierarchy of settlement (HS) score:
H S i = i = 1 n C I i
where HSn is the hierarchy of settlement of cities I; CIi is the centrality index of the function I; n is the number of cities analyzed.
The centrality index can measure the urbanization process from increasing density and population metrics of different districts. The centrality scores can be validated and confirmed through the counting of observed learning activities. Furthermore, the multifaceted functions of centrality scores can produce and compare information on how sub-districts are spatially arranged in terms of infrastructures, services and facilities. This allows for a comparison of spatial arrangements by sub-district. By understanding the location of local learning activities together with migration patterns, we can uncover the urban structures through a spatio-functional process and make assumptions about the socio-economic impacts.

3. Results

3.1. Sample Description

The sample consisted of 400 respondents from Thanyaburi district. Table 1, Table 2 and Table 3 show the data related to social, economic and the built environment, respectively. As shown in Table 1, there were more men who completed the questionnaire than women (52.3% vs. 44.5%). The mean age was 38 ± 12.3 years (range 19 to 83); almost a third were between the ages of 22 and 25 years (30.86%). Most respondents were Buddhist (95.25%), and just over half were married (53.5%).
As shown in Table 2, just over half of the workforce are women (52.69%). The average income is THB 39,506.99, with approximately THB 31,639.92 being spent on daily needs. Just over half had a bachelor’s degree; over a fifth of respondents reported they had their own personal business; income ranged from THB 15,001–20,000 (21.5%).
As shown in Table 3, most land is considered agricultural land, followed by residential areas. The average number of years respondents lived in their homes was 1–10 years (48%), followed by 10–20 years (26.5%).

3.2. Urban Centrality

As shown in Figure 4, the density and types of activities among the four municipalities in Thanyaburi district are different. More than a third of the activities across all districts were mixed-use (38.45%) and commercial (35.96%). These activities primarily took place along the main road. The highest density and activities were in Rangsit city (49.3 percent), followed by Bueng Yitho (19.6 percent), Thanyaburi subdistrict (18.89 percent) and Sanan Rak (12.15 percent), respectively. The data show that central areas are denser than areas further away from the city centers.
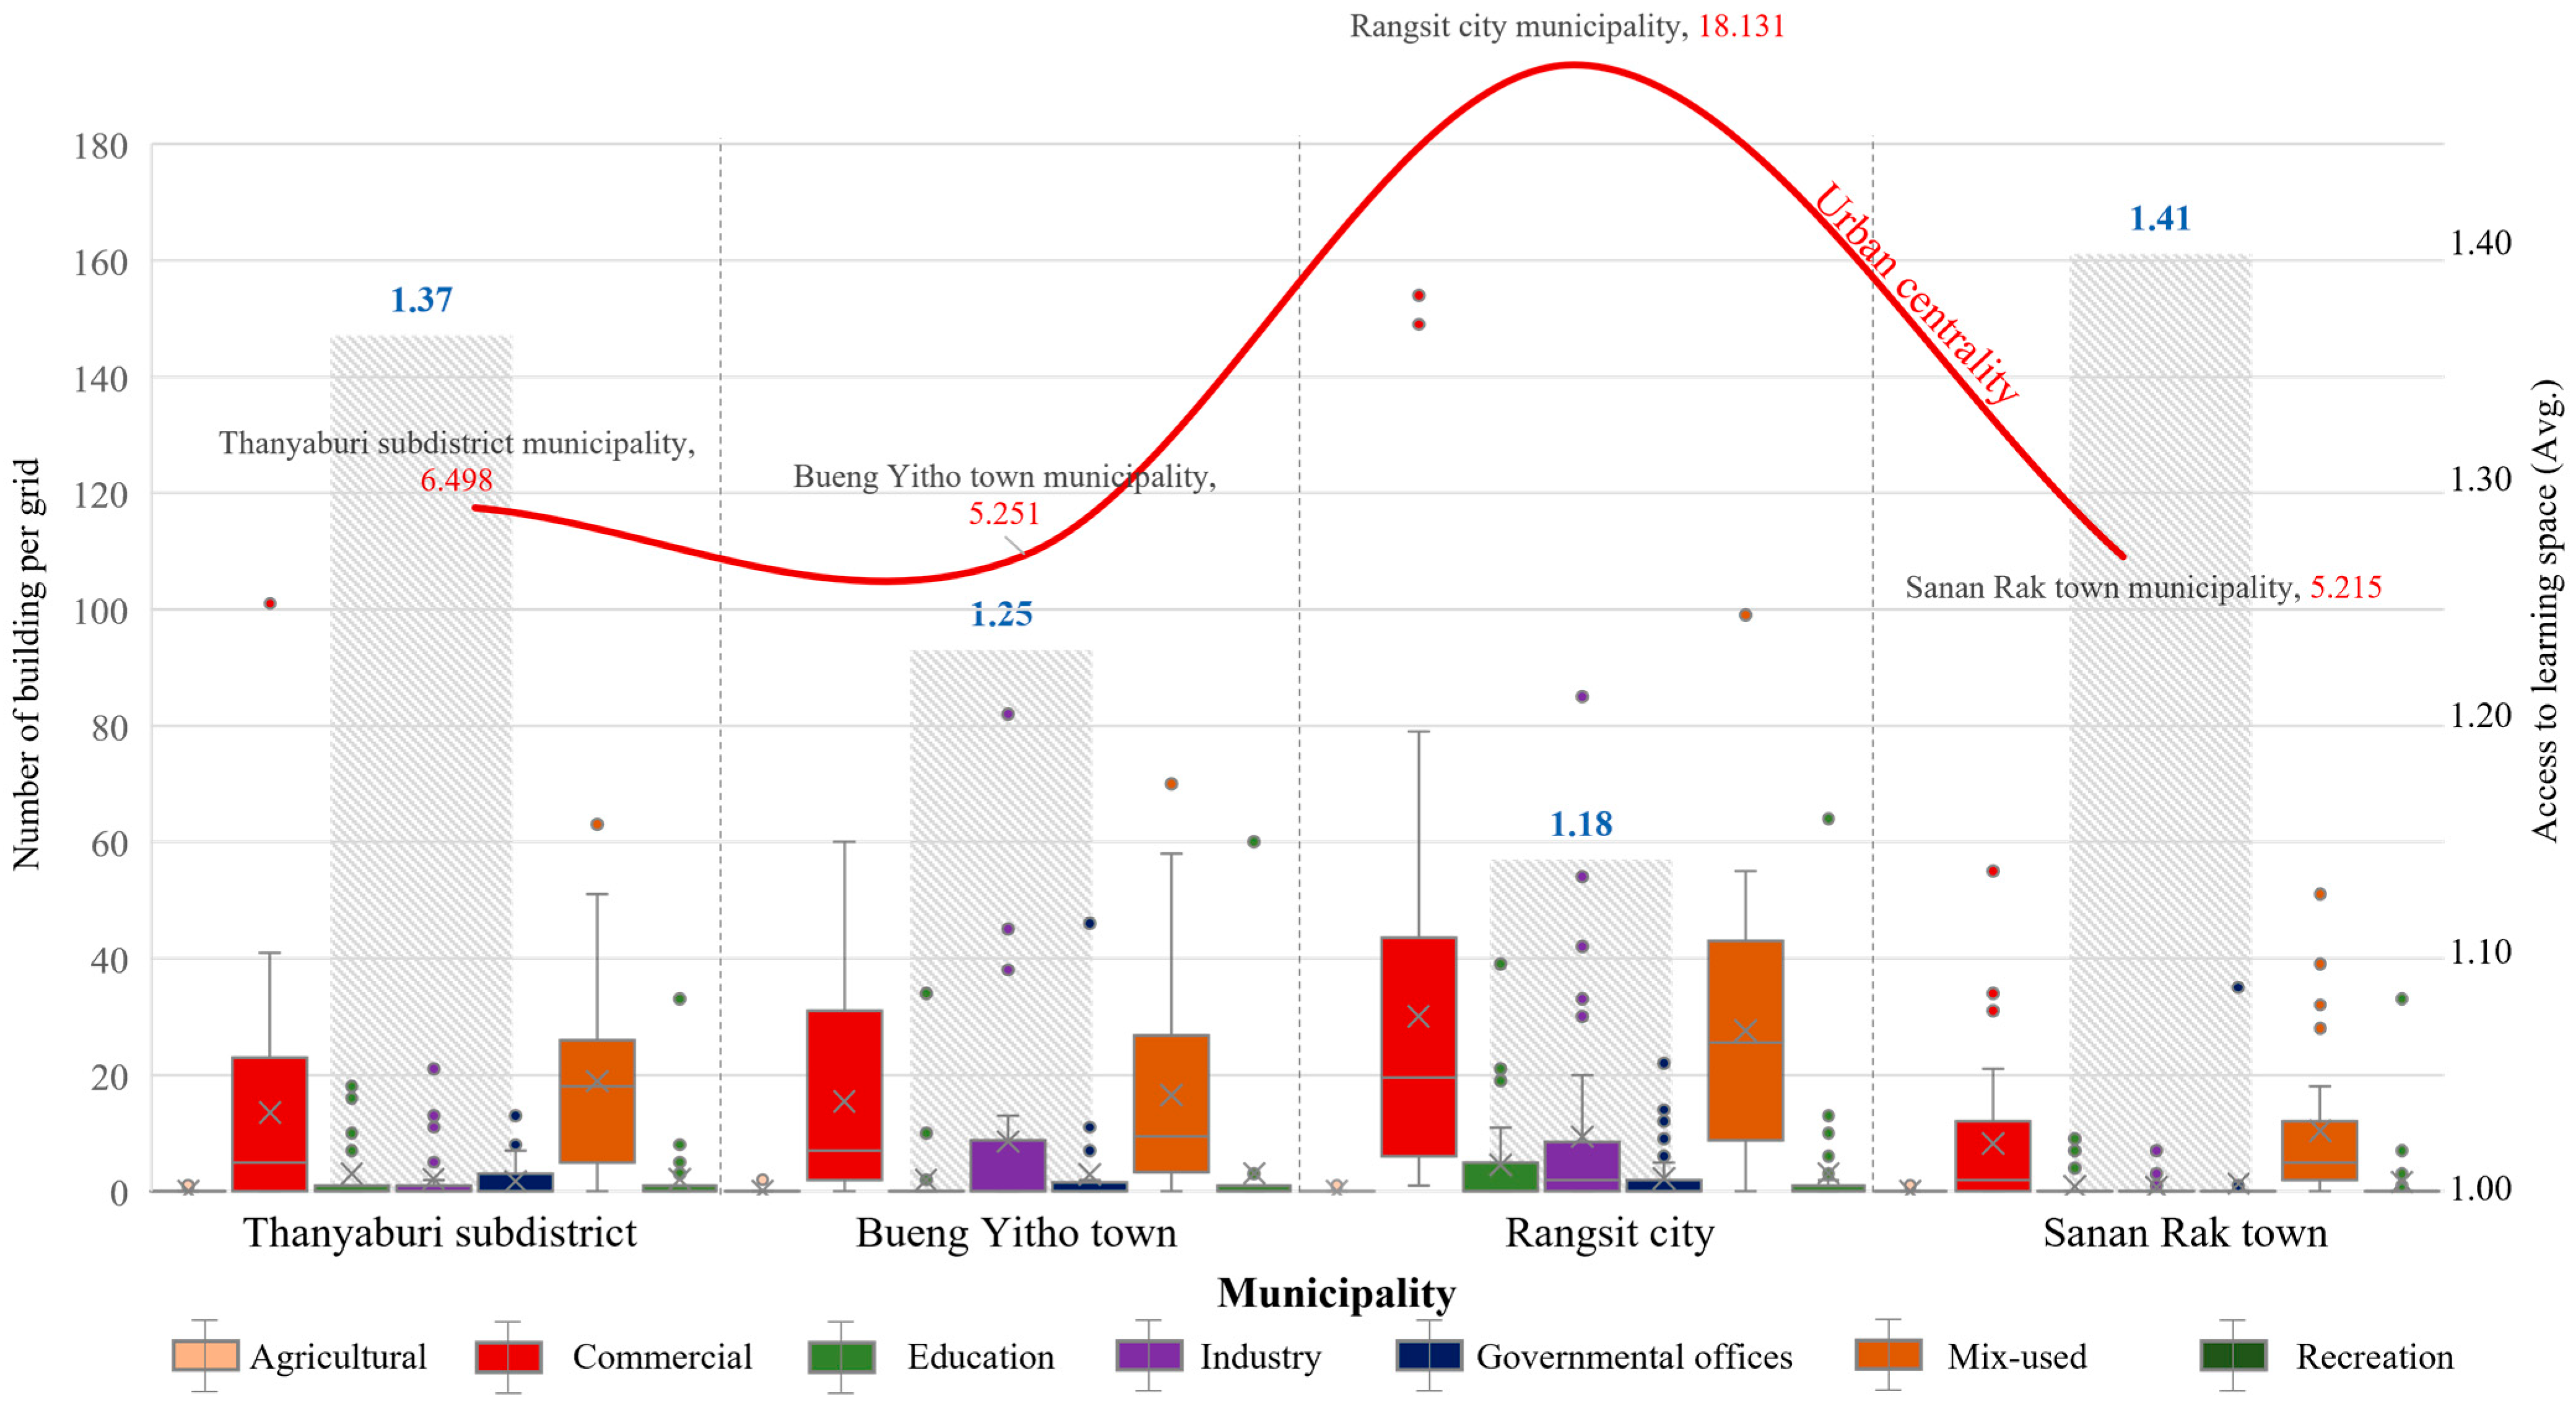
Figure 5 describes the urban centrality scores of the various cities within Thanyaburi district. The lowest urban centrality score is 0.32, while the highest is 122.05. These scores are then divided by the size of the city center. The city center is divided into three levels: small (0–10), medium (11–40) and significant (over 40). According to the grid-by-grid data (Figure 4a), urbanized areas are concentrated in areas with high activity density (Figure 4b). The municipality with the highest urban center value was Rangsit municipality (18.13), followed by Thanyaburi subdistrict (6.50), Bueng Yitho (5.25) and Sanan Rak (5.21).
When examining grid data by city boundaries, Rangsit city municipality had the area with the highest density of activities, including access to transportation (e.g., Sky Train), large department stores and a hospital. As for the Thanyaburi subdistrict municipality, although the municipality is at the sub-district level, there are educational institutions (e.g., universities) in the area, making it a source of residential activities and mixed utilization. The other cities/districts have lower scores, which can be attributed to a lack of amenities and activities.

3.3. Urban Centrality, Accessibility and Participation in Learning Activities

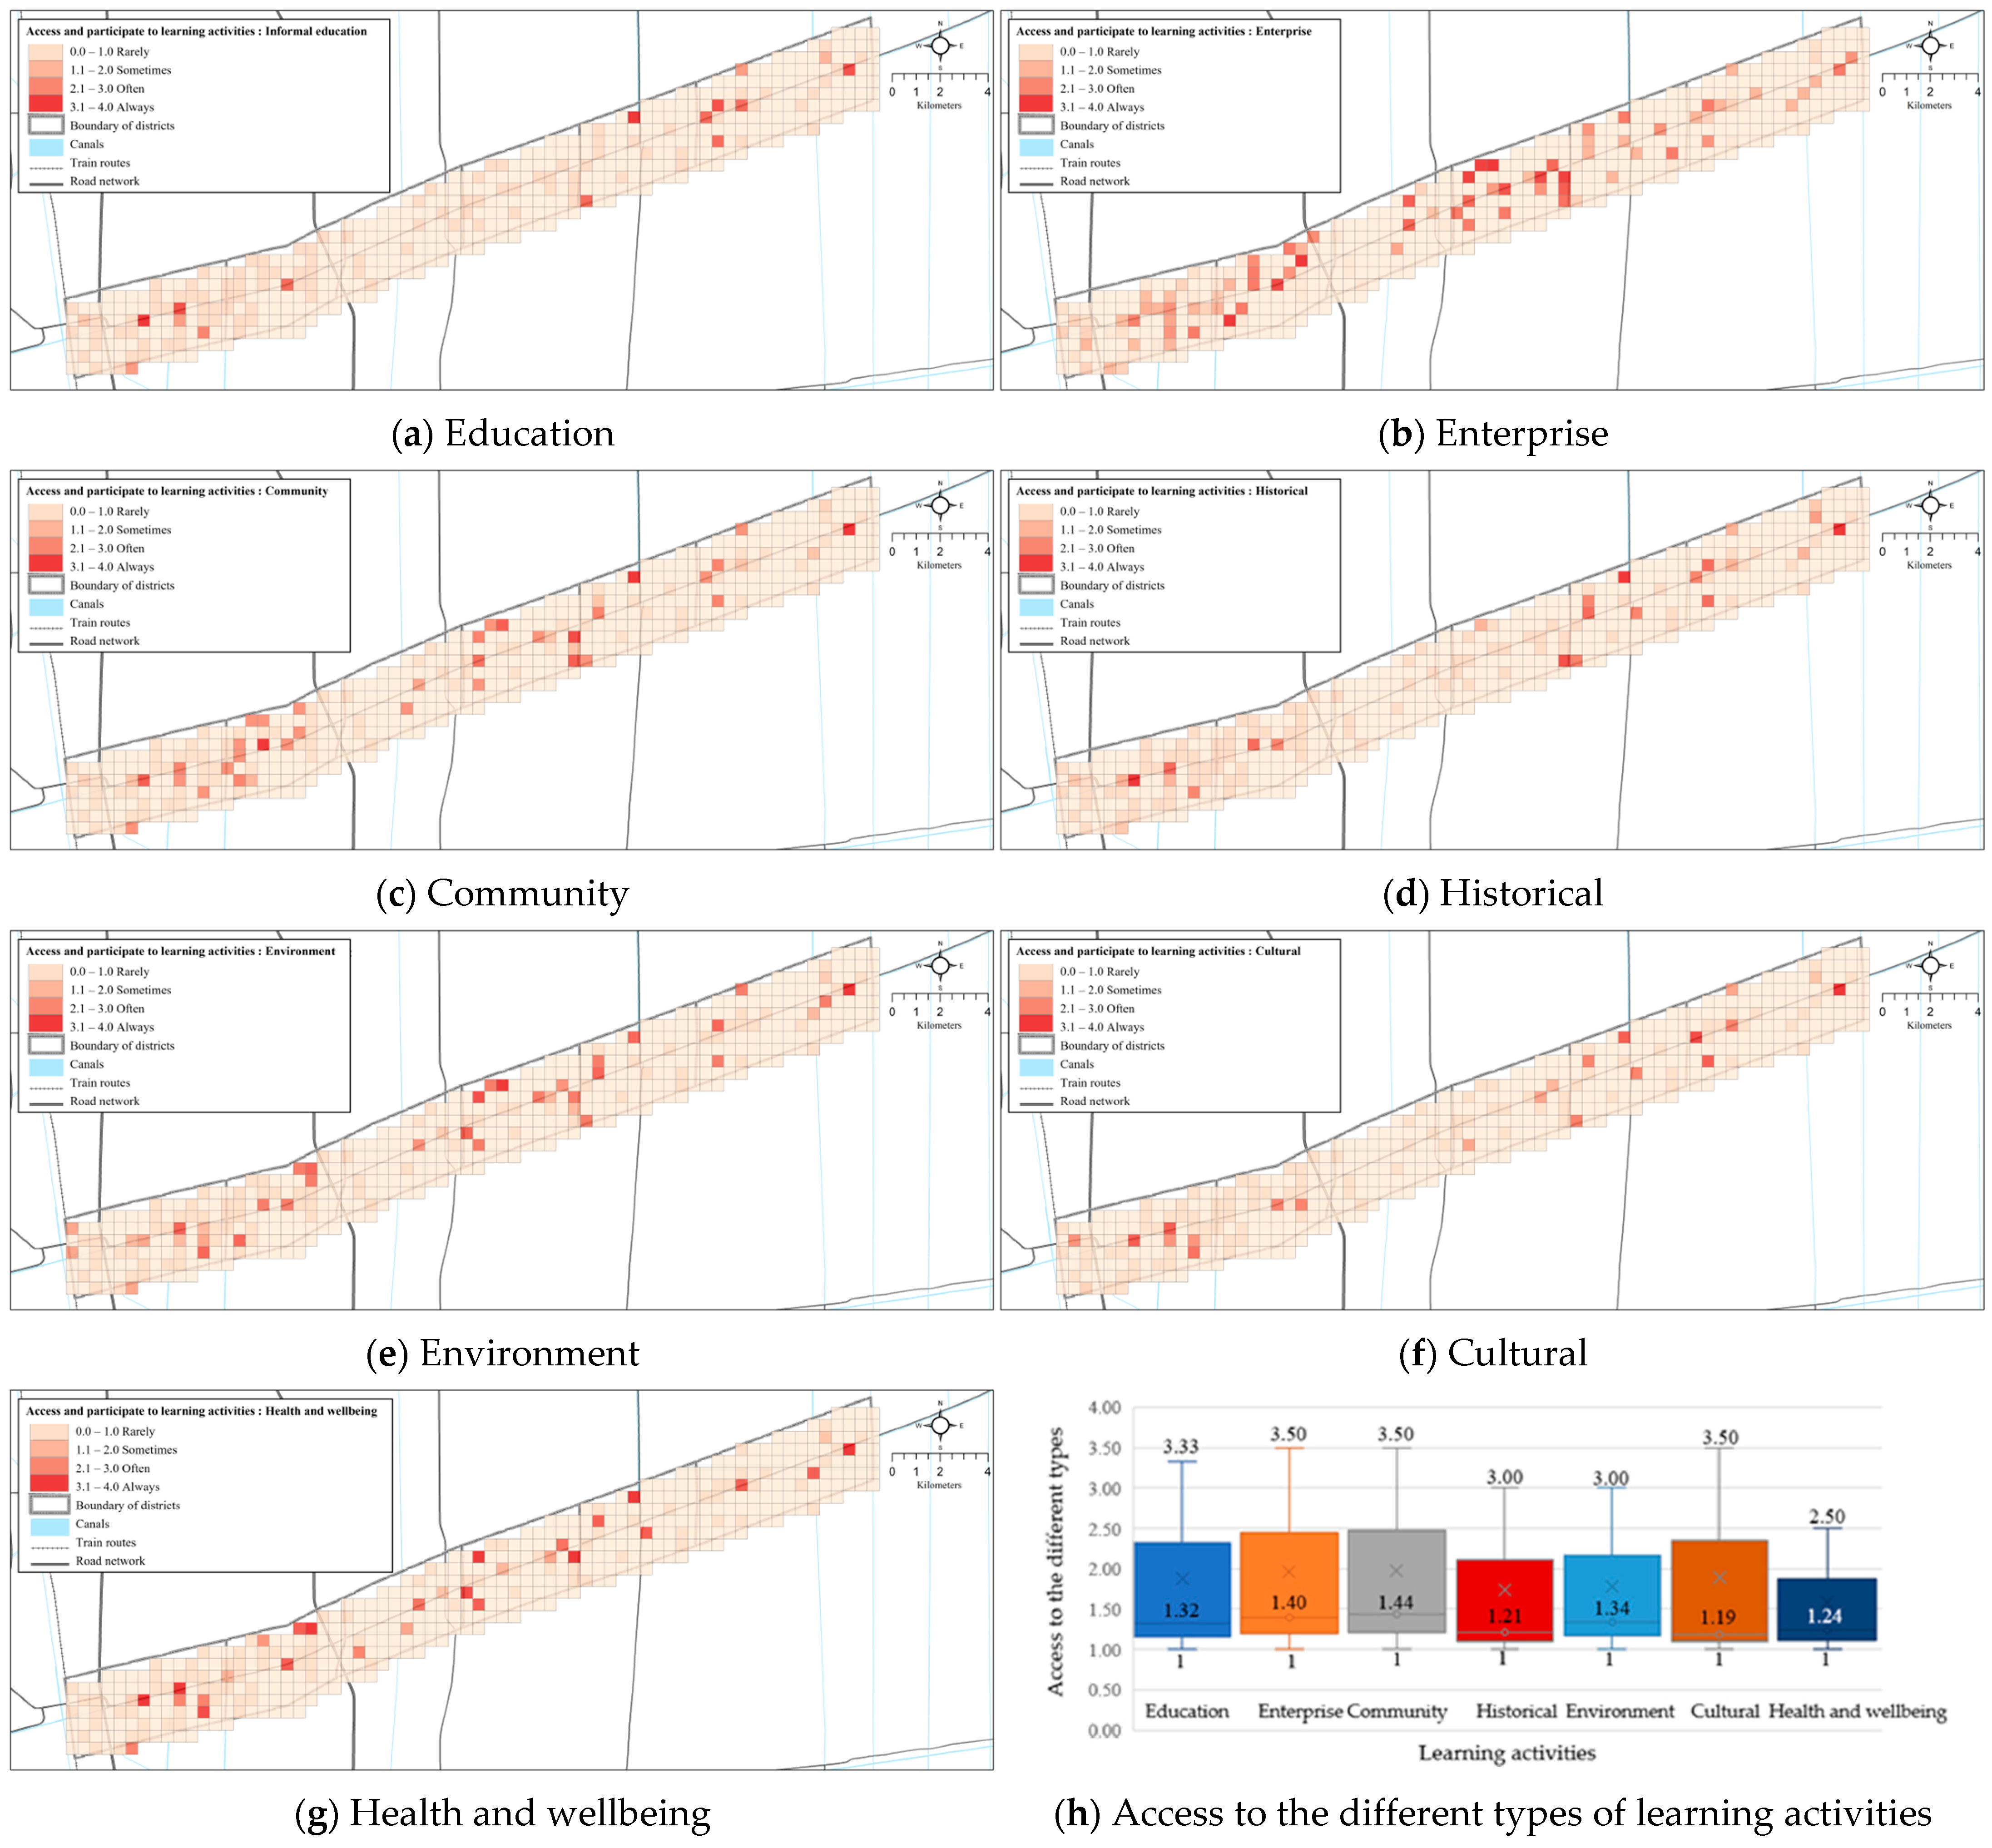
The questionnaire data were used to examine the various types of activities residents have access to (e.g., education, enterprise, community, historical, environment, cultural, health and wellbeing) in Thanyaburi district, as shown in Figure 6. The most popular learning activities were related to “ways of living” ( x ¯ = 1.44), followed by activities related to advancing careers and skill development ( x ¯ = 1.40) and environmental conservation activities ( x ¯ = 1.34), respectively.
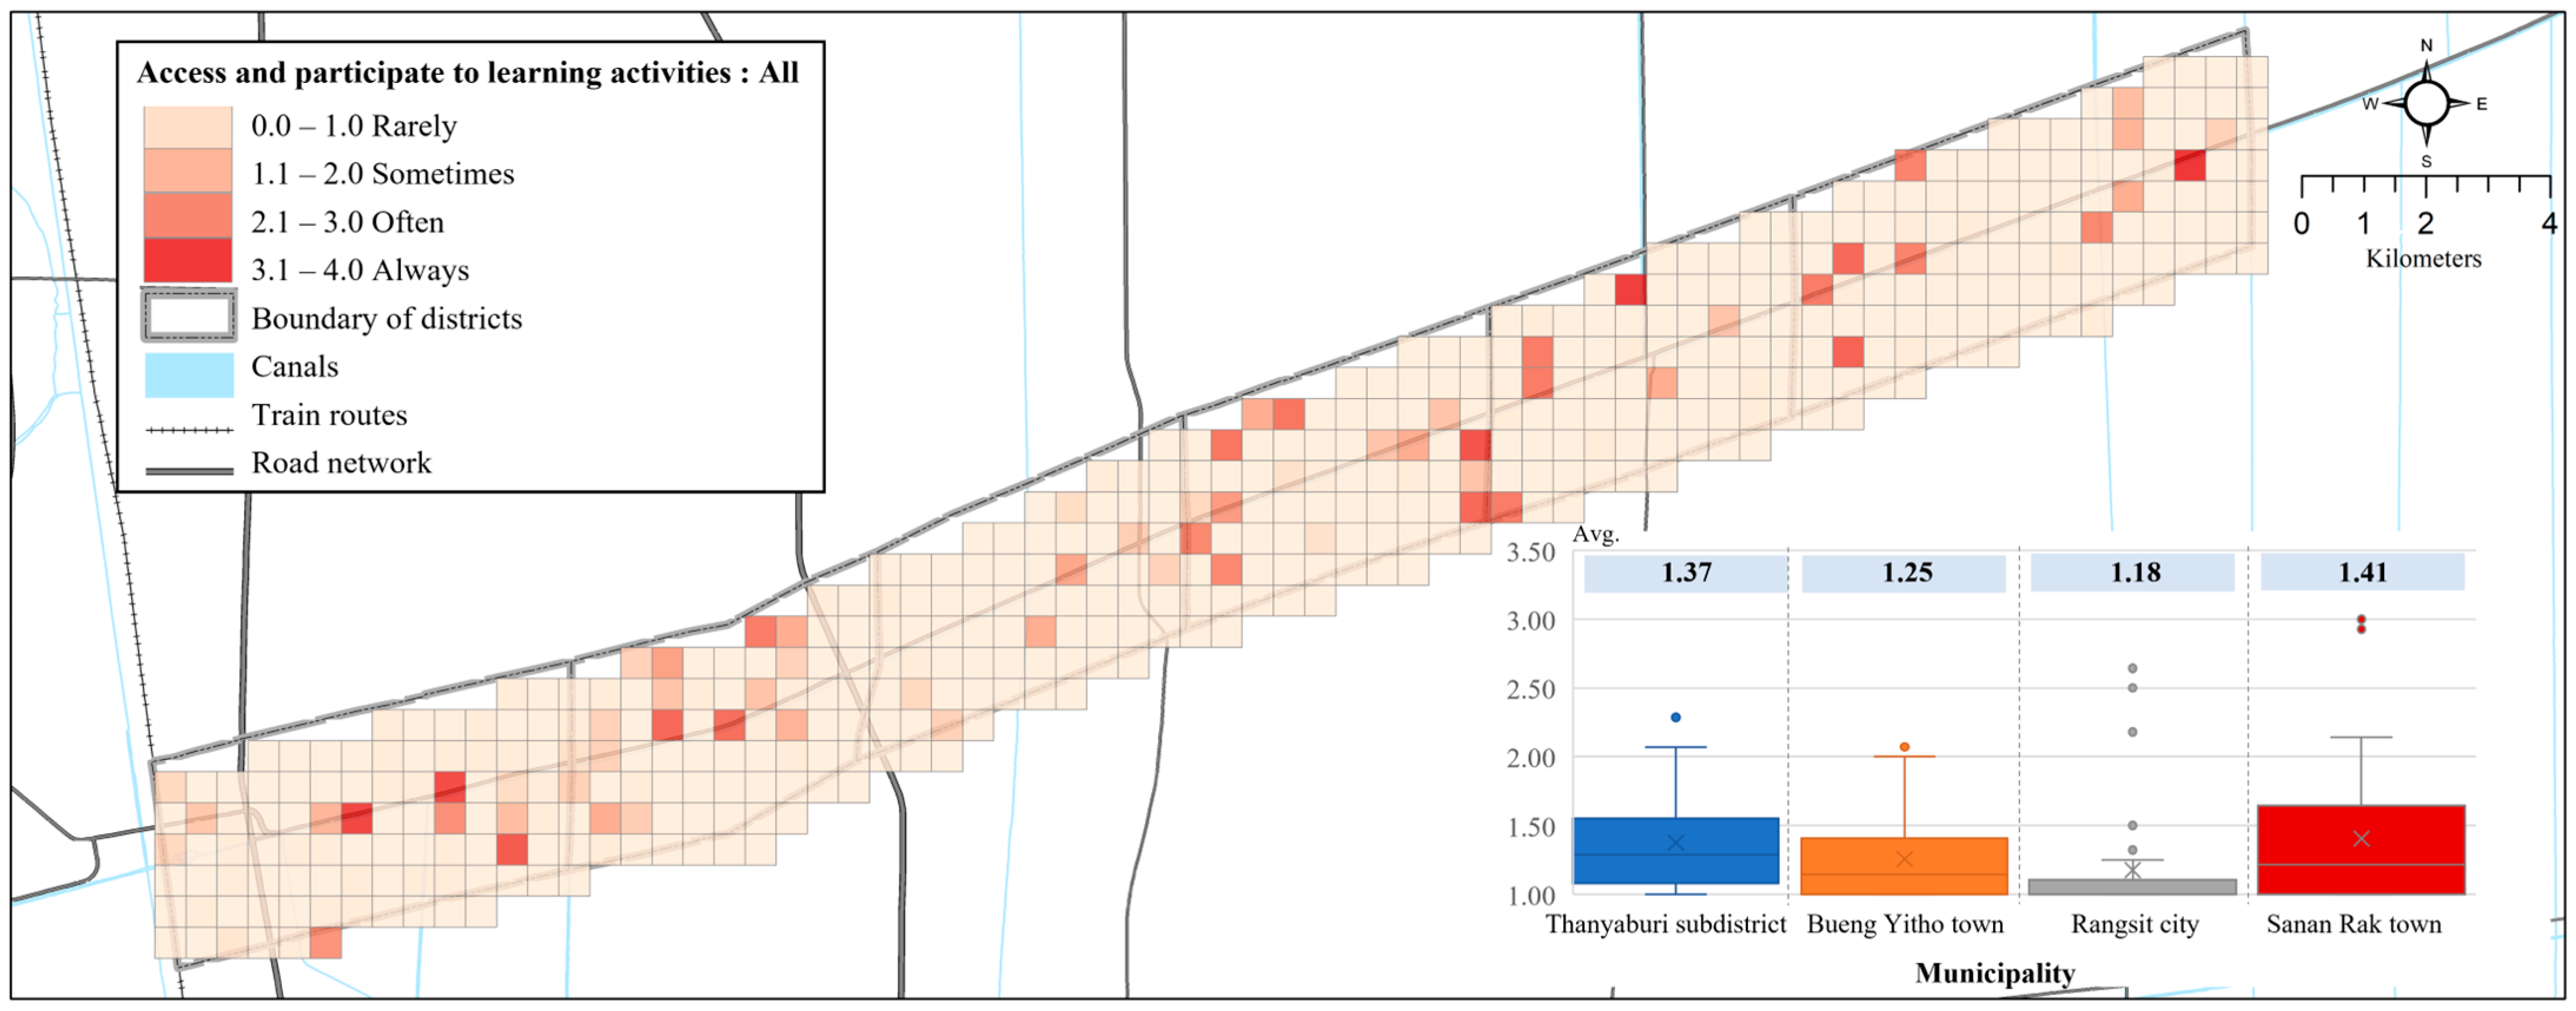
As shown in Figure 7, the Sananrak municipality had the highest learning activity participation rates ( x ¯ = 1.41) followed by Thanyaburi municipality ( x ¯ = 1.37), Bueng Yitho municipality ( x ¯ = 1.26) and Rangsit city municipality ( x ¯ = 1.18). Although the Sanarak municipality had the poorest access to learning activities compared to larger cities such as Rangsit (highest urban centrality score), it had the highest participation among learning activities.
Figure 8 presents the associations between centrality scores and activity participation rates by municipality. Commercial and mixed land use were the most common activities across all municipalities. The findings show that the urban centrality scores were highest in Rangsit city, which was also associated with greater commercial and mixed land use developments, although there were few recreational activities, similar to all other municipalities.
Figure 9 incorporates the centrality index with geospatial modeling to examine the association between location and activity accessibility. The data show a significant association between the degree of centrality and access to learning activities. However, when examining each municipality individually at the district level, there was a significant association between activity participation and accessibility (significance level of p < 0.001 for all within municipality analyses).

4. Discussion

The findings show that urbanization in the province of Pathum Thani, Thailand, does not contain adequate learning activities for its residents. It is possible that life circumstances such as work may influence opportunities to access learning activities or that urban centers do not have the appropriate learning activities desired by its residents. Thus, prior to creating urban planning and design for new infrastructures, facilities and services, it is imperative to understand the needs of people who live in the community. There is a clear need to better link urban development with learning activities desired by residents to make cities more vibrant. Additionally, from an urban planning perspective, better understanding the capacity of cities (space and cost) to create activity hubs can improve the design and attractiveness of learning activities for residents and visitors.
The creation of “learning cities” requires not only ample activities but a range of different activities. It is well known that migration moves towards cities from suburban and rural areas in search of better opportunities including education, employment or more attractions [30,36]. Cities must be constructed in a way that provides opportunities for a wide range of activities. Our findings show that the most popular activities were community-based, environmental and educational activities, respectively. However, it was also clear that different municipalities provide different opportunities that are unique to each area. The centrality score provides a metric for understanding activity allocation based on infrastructures, facilities and services; however, there is limited information on activity usage. It is likely that centrality and accessibility also highly influence participation in activities, especially if they are not within their home municipality. Additionally, all municipalities were focused on commercial and mixed land-use developments compared to providing opportunities for recreational activities. To enhance attractiveness for all municipalities, all should provide greater opportunities for activities and have activities that are related to the interests of its residents. Simply having space or having activities in general does not guarantee activity participation, as people generally have a wide range of interests. The findings indicate that urban planners should place more emphasis on creating opportunities for learning when considering their urban planning and design. However, it is also important that urban planning approaches solicit input from community members to maximize the benefit of urban development.
Planning the creation and development of accessible and desired activities is an important indicator for a city’s sustainability [42]. Additionally, such activities are a driver to develop and improve skills at the individual, family and community levels, all of which can improve social dynamics and drive the economy. In addition to improving planning and infrastructures to support learning cities, online learning has become a popular medium. Online learning, otherwise known as field-based learning, is more effective especially when creating interaction between learners [43] and includes education and training (learning new skills or upgrading qualifications) for community members to ensure they have the skills required for employment opportunities [14,30]. Future studies are needed to examine whether there is a strong preference for online learning vs. more traditional learning activities that require travel. This can help inform how future activities are promoted and developed.
While this study shows the association between available activities and centrality scores of each municipality, it is also possible that learning opportunities are influenced by socio-economic factors. It is possible that despite municipalities having the desired activities, some of them may not be affordable to low-income residents. Unfortunately, this study could not examine the residential location and where they were going to access activities. We hypothesize that many residents participate in activities within their home municipality; however, it is also possible that residents travel to other municipalities to access certain activities. The complexities of spatio-functional interactions can efficiently capture and translate to spatial descriptions in explaining functional structures and residents’ learning activity utilization patterns. Better understanding the learning opportunities desired by residents and travel patterns to access learning opportunities, in tandem with socio-demographic factors, would provide a more comprehensive picture of lifelong learning opportunities among a range of diverse users, which is important from a planning perspective. The geospatial modeling used in this study should be incorporated into urban planning developments to better visualize where opportunities for learning activities can exist or where they can be allocated. Understanding the capacity of municipalities to host a range of activities can help reduce economic divide and allow for a more prosperous local economy, supporting the movement towards a “learning city”.
Our findings provide urban planners with additional considerations when designing and developing urban structures given their association with learning activities. While centrality scores are useful for examining urban density, merging centrality scores with both physical data (building structures) and activity participation can further validate and expand its use. This novel approach helps address limitations of prior research that have used either GIS or focus groups to capture data on learning activities. Our current approach using geospatial analyses with various metrics allows further examination considering geographical boundaries and various socio-economic factors (e.g., income, vulnerable groups), which are important considerations for urban planners. More importantly, incorporating community needs (e.g., surveys or focus groups) with the modeling techniques used in the present study can enhance urban planning and ensure the voices of the community are heard. Additionally, community members can often provide input, not otherwise captured, to improve urban planning and design. Moreover, community members are more likely to participate in activities and have a stronger sense of community if they are provided the opportunity to provide input on urban planning and design. This bottom-up approach can ensure many facets of planning are incorporated including the interaction between land use and transportation to ensure activities are needed and accessible. This would also ensure the long-term development goals of urban planning and ensure its sustainability through the provision of appropriate learning activities [30]. The findings must take into account the study’s limitations. While we identified centrality scores and their association with learning activities, we could not describe the community’s actual utilization of those learning activities. Future studies need to examine who is accessing what learning activities and from where. This will provide important information about whether local residents are using the existing learning activities and would provide further validation of using centrality scores as a design metric. Additionally, despite employing a 500 × 500 grid to ensure adequate geographic representation, it is unclear whether our sample is the representative of the demographics within each district. This may directly influence the responses for what learning activities are the most desirable as well as the association between centrality scores and learning activities. Moreover, we could not identify participants who accessed learning activities. Although the GIS maps show roadways, we do not know if the transit routes are in near proximity to learning activities. This is another factor that could influence activity uptake.

5. Conclusions

This study considered the association between urban development and learning activities in Thanyaburi district, Pathum Thani province. The findings show that the most popular activities were community-based, environmental and educational activities, respectively. However, various municipalities had few learning opportunities for local residents. The results also indicate a significant conflict between the pattern of urbanization and accessibility across a variety of learning activities within Thanyaburi district. This may be due to several factors that influence activity uptake including land-use patterns, transportation and spatial configuration of urban structures [44]. Future studies need to capture additional information on demographics, transportation availability and usage, travelling distance and urban design to determine how best to develop “learning cities”. Promoting lifelong learning opportunities is an essential response to establishing a vibrant environment for individuals, communities and cities and is a key driver to improving economic development (e.g., employment and education) and sustainability.

Author Contributions

Conceptualization, P.I.; Methodology, P.I.; Validation, S.C.; Formal analysis, P.I. and S.C.; Investigation, S.C.; Data curation, S.C.; Writing–original draft, P.I., S.C. and A.M.C.; Writing–review & editing, P.I., S.C. and A.M.C.; Visualization, S.C.; Supervision, P.I. and A.M.C.; Project administration, P.I.; Funding acquisition, P.I. All authors have read and agreed to the published version of the manuscript.

Funding

This research was funded by the Program Management Unit on Area Based Development (PMU A), NXPO, grant number [A15F640125].

Institutional Review Board Statement

This study was conducted according to the guidelines of the Declaration of Helsinki and approved by the Human Research Ethics Committee of Thammasat University Social Science (certificate of approval number 128/2021, 29 December 2021).

Informed Consent Statement

Informed consent was obtained from all subjects involved in the study.

Data Availability Statement

Not applicable.

Conflicts of Interest

The authors declare no conflict of interest.

References

  1. Zhou, Y.X.; Zhang, L.; Wu, Y. Study of China’s urban centrality hierarchy. Reg. Areal Res. Dev. 2001, 20, 1–5. [Google Scholar]
  2. Shim, G.-E.; Rhee, S.-M.; Ahn, K.-H.; Chung, S.-B. The relationship between the characteristics of transportation energy consumption and urban form. Ann. Reg. Sci. 2006, 40, 351–367. [Google Scholar] [CrossRef]
  3. Irwan, M.D.; Hughes, H.L. Centrality and the Structure of Urban Interaction: Measures, Concepts, and Applications. Soc. Forces 1992, 71, 17–51. [Google Scholar] [CrossRef]
  4. Miranda, E.; E Silva, J.B.; Da Costa, A.R. Emergence and Structure of Urban Centralities in a Medium-Sized Historic City. SAGE Open 2020, 10, 2158244020930002. [Google Scholar] [CrossRef]
  5. Aguilera, A. Growth in Commuting Distances in French Polycentric Metropolitan Areas: Paris, Lyon and Marseille. Urban Stud. 2005, 42, 1537–1547. [Google Scholar] [CrossRef] [Green Version]
  6. Anas, A.; Arnott, R.; Small, K.A. Urban Spatial Structure. J. Econ. Lit. 1998, 36, 1426–1464. [Google Scholar]
  7. Galster, G.; Hanson, R.; Ratcliffe, M.R.; Wolman, H.; Coleman, S.; Freihage, J. Wrestling Sprawl to the Ground: Defining and measuring an elusive concept. Hous. Policy Debate 2001, 12, 681–717. [Google Scholar] [CrossRef]
  8. United Nations. Urbanization: Expanding Opportunities, but Deeper Divides. 2020. Available online: https://www.un.org/development/desa/en/news/social/urbanization-expanding-opportunities-but-deeper-divides.html (accessed on 1 April 2023).
  9. Ha, N.M.; Le, N.D.; Trung-Kien, P. The impact of urbanization on poverty reduction: An evidence from Vietnam. Cogent Econ. Financ. 2021, 9, 1918838. [Google Scholar] [CrossRef]
  10. Arouri, M.; Ben Youssef, A.; Nguyen, C. Does urbanization reduce rural poverty? Evidence from Vietnam. Econ. Model. 2017, 60, 53–270. [Google Scholar] [CrossRef] [Green Version]
  11. Qi, W.; Liu, S.; Zhao, M.; Liu, Z. China’s different spatial patterns of population growth based on the “Hu Line”. J. Geogr. Sci. 2016, 26, 1611–1625. [Google Scholar] [CrossRef]
  12. Chen, D.; Zhang, Y.; Yao, Y.; Hong, Y.; Guan, Q.; Tu, W. Exploring the spatial differentiation of urbanization on two sides of the Hu Huanyong Line—Based on nighttime light data and cellular automata. Appl. Geogr. 2019, 112, 102081. [Google Scholar] [CrossRef]
  13. Liddle, B. Urbanization and Inequality/Poverty. Urban Sci. 2017, 1, 35. [Google Scholar] [CrossRef] [Green Version]
  14. Chen, G.; Glasmeier, A.K.; Zhang, M.; Shao, Y. Urbanization and Income Inequality in Post-Reform China: A Causal Analysis Based on Time Series Data. PLoS ONE 2016, 11, e0158826. [Google Scholar] [CrossRef] [Green Version]
  15. Iamtrakul, P.; Kardi, T.; Jian, G.; Kazunori, H. Interaction of activity involvement and recreational location selection behavior in Lowland City: A case study of public parks in Saga City, Japan. J. Zhejiang Univ. A 2005, 6, 900–906. [Google Scholar] [CrossRef]
  16. Xu, G.; Jiao, L.; Liu, J.; Shi, Z.; Zeng, C.; Liu, Y. Understanding urban expansion combining macro patterns and micro dynamics in three Southeast Asian megacities. Sci. Total Environ. 2019, 660, 375–383. [Google Scholar] [CrossRef]
  17. Iamtrakul, P.; Chayphong, S. The perception of Pathumthani residents toward its environmental quality, suburban area of Thailand. Geogr. Pannonica 2021, 25, 136–148. [Google Scholar] [CrossRef]
  18. Nakagawa, S. Residents in a suburban area of Bangkok Metropolis; Classification by migratory and social characteristics. Reg. Views 1997, 10, 45–59. [Google Scholar]
  19. Padon, A.; Iamtrakul, P.; Thanapirom, C. The Study of Urbanization Effect on the Land Use Changes and Urban Infrastructures Development in the Metropolitan Areas, Thailand. IOP Conf. Ser. Earth Environ. Sci. 2021, 738, 012077. [Google Scholar] [CrossRef]
  20. Kearns, P. Learning cities as healthy green cities: Building sustainable opportunity cities. Aust. J. Adult Learn. 2012, 52, 368–391. [Google Scholar]
  21. Iamtrakul, P.; Chayphong, S.; Kantavat, P.; Hayashi, Y.; Kijsirikul, B.; Iwahori, Y. Exploring the Spatial Effects of Built Environment on Quality of Life Related Transportation by Integrating GIS and Deep Learning Approaches. Sustainability 2023, 15, 2785. [Google Scholar] [CrossRef]
  22. UNESCO Institute for Lifelong Learning. Inclusive Lifelong Learning in Cities: Policies and Practices for Vulnerable Groups. 2021. Available online: https://unesdoc.unesco.org/ark:/48223/pf0000379538 (accessed on 15 April 2023).
  23. OECD. CASE Study: Lifelong Learning in Korea. 2019. Available online: https://www.oecd-ilibrary.org/sites/cd2b486a-en/index.html?itemId=/content/component/cd2b486a-en (accessed on 25 March 2023).
  24. Atchoarena, D.; Howells, A. Advancing Learning Cities: Lifelong Learning and the Creation of a Learning Society. In Powering a Learning Society during an Age of Disruption; Education in the Asia-Pacific Region: Issues, Concerns and Prospects, 58; Ra, S., Jagannathan, S., Maclean, R., Eds.; Springer: Singapore, 2021; pp. 165–180. [Google Scholar] [CrossRef]
  25. Longworth, N. The Local and Regional Dimension of Lifelong Learning: Creating Learning Cities, Towns and Regions, a European Policy Paper from the TELS Project; DG Education and Culture: Brussels, Belgium, 2001. [Google Scholar]
  26. UNESCO Institute for Lifelong Learning. Learning Cities and the SDGs: A Guide to Action. 2017. Available online: https://www.local2030.org/library/403/Learning-Cities-and-the-SDGs-A-Guide-to-Action.pdf (accessed on 15 April 2023).
  27. UIL. Conceptual Evolution and Policy Developments in Lifelong Learning; UIL: Hamburg, Germany, 2011. [Google Scholar]
  28. Khurana, A. Converting physical spaces into learning spaces: Integrating universal design and universal design for learning. Front. Educ. 2022, 7, 965818. [Google Scholar] [CrossRef]
  29. Németh, B.; Issa, O.; Diba, F.; Tuckett, A. Learning cities and learning communities: Analyzing contextual factors and their impacts on adult and lifelong learning in urban settings. Andragoske Stud. 2020, 2020, 17–52. [Google Scholar] [CrossRef]
  30. Iamtrakul, P.; Chayphong, S.; Lo, A.Y.W. Exploring the Contribution of Social and Economic Status Factors (SES) to the Development of Learning Cities (LC). Sustainability 2022, 14, 12685. [Google Scholar] [CrossRef]
  31. Casanova, D.; Huet, I.; Garcia, F. The Experience of Co-Designing a Learning Space with Teachers and Students. Educ. Sci. 2023, 13, 103. [Google Scholar] [CrossRef]
  32. Mei, B.; May, L. Reflective renovation: Insights from a collaborative and active learning space project evaluation. Australas. J. Educ. Technol. 2018, 34, 4476. [Google Scholar] [CrossRef] [Green Version]
  33. Kersh, N. Rethinking the learning space at work and beyond: The achievement of agency across the boundaries of work-related spaces and environments. Int. Rev. Educ. 2015, 61, 835–851. [Google Scholar] [CrossRef]
  34. Azeiteiro, U.M.; Akerman, M.; Leal Filho, W.; Setti, A.F.F.; Brandli, L.L. (Eds.) Lifelong Learning and Education in Healthy and Sustainable Cities; World Sustainability Series; Springer: Berlin/Heidelberg, Germany, 2018. [Google Scholar] [CrossRef]
  35. Iamtrakul, P.; Padon, A.; Klaylee, J. Analysis of Urban Sprawl and Growth Pattern Using Geospatial Technologies in Megacity, Bangkok, Thailand; Lecture Notes on Data Eng; Sprinegering and Communications Technologies; Springer: Singapore, 2022; Volume 143, pp. 109–123. [Google Scholar] [CrossRef]
  36. Iamtrakul, P.; Chayphong, S. Factors affecting the development of a healthy city in Suburban areas, Thailand. J. Urban Manag. 2023; in press. [Google Scholar] [CrossRef]
  37. Iamtrakul, P.; Raungratanaamporn, I.; Klaylee, J. The impact of urban development on social capital in urban fringe area of Bangkok, Thailand. Lowl. Technol. Int. 2018, 20, 331–340. [Google Scholar]
  38. Official Statistics Registration Systems. Population Statistics. 2021. Available online: https://statboradopagoth/new_stat/webPage/statByYearphp (accessed on 25 March 2023).
  39. Krejcie, R.V.; Morgan, D.W. Determining Sample Size for Research Activities. Educ. Psychol. Meas. 1970, 30, 607–610. [Google Scholar] [CrossRef]
  40. Poorthuis, A.; Zook, M. Making Big Data Small: Strategies to Expand Urban and Geographical Research Using Social Media. J. Urban Technol. 2017, 24, 115–135. [Google Scholar] [CrossRef]
  41. Haider, M.A.; Iamtrakul, P. Analyzing Street Crime Hotspots and Their Associated Factors in Chittagong City, Bangladesh. Sustainability 2022, 14, 9322. [Google Scholar] [CrossRef]
  42. Walters, S. Researching Indicators for a Learning Region. 2006. Available online: http://wwwleedsacuk/educol/documents/155405htm (accessed on 31 March 2023).
  43. Fauzi, I.; Khusuma, I.H.S. Teachers’ Elementary School in Online Learning of COVID-19 Pandemic Conditions. J. IQRA 2020, 5, 58–70. [Google Scholar] [CrossRef]
  44. Kasanobu, K.; Varameth, V.; Carlos, L.; Ana, M.; Rolf, M.; Yoshitsugu, H. Impact of Decentralization and Rail Network Extension on Future Traffic in The Bangkok Metropolitan Region. Sustainability 2021, 13, 13196. [Google Scholar] [CrossRef]
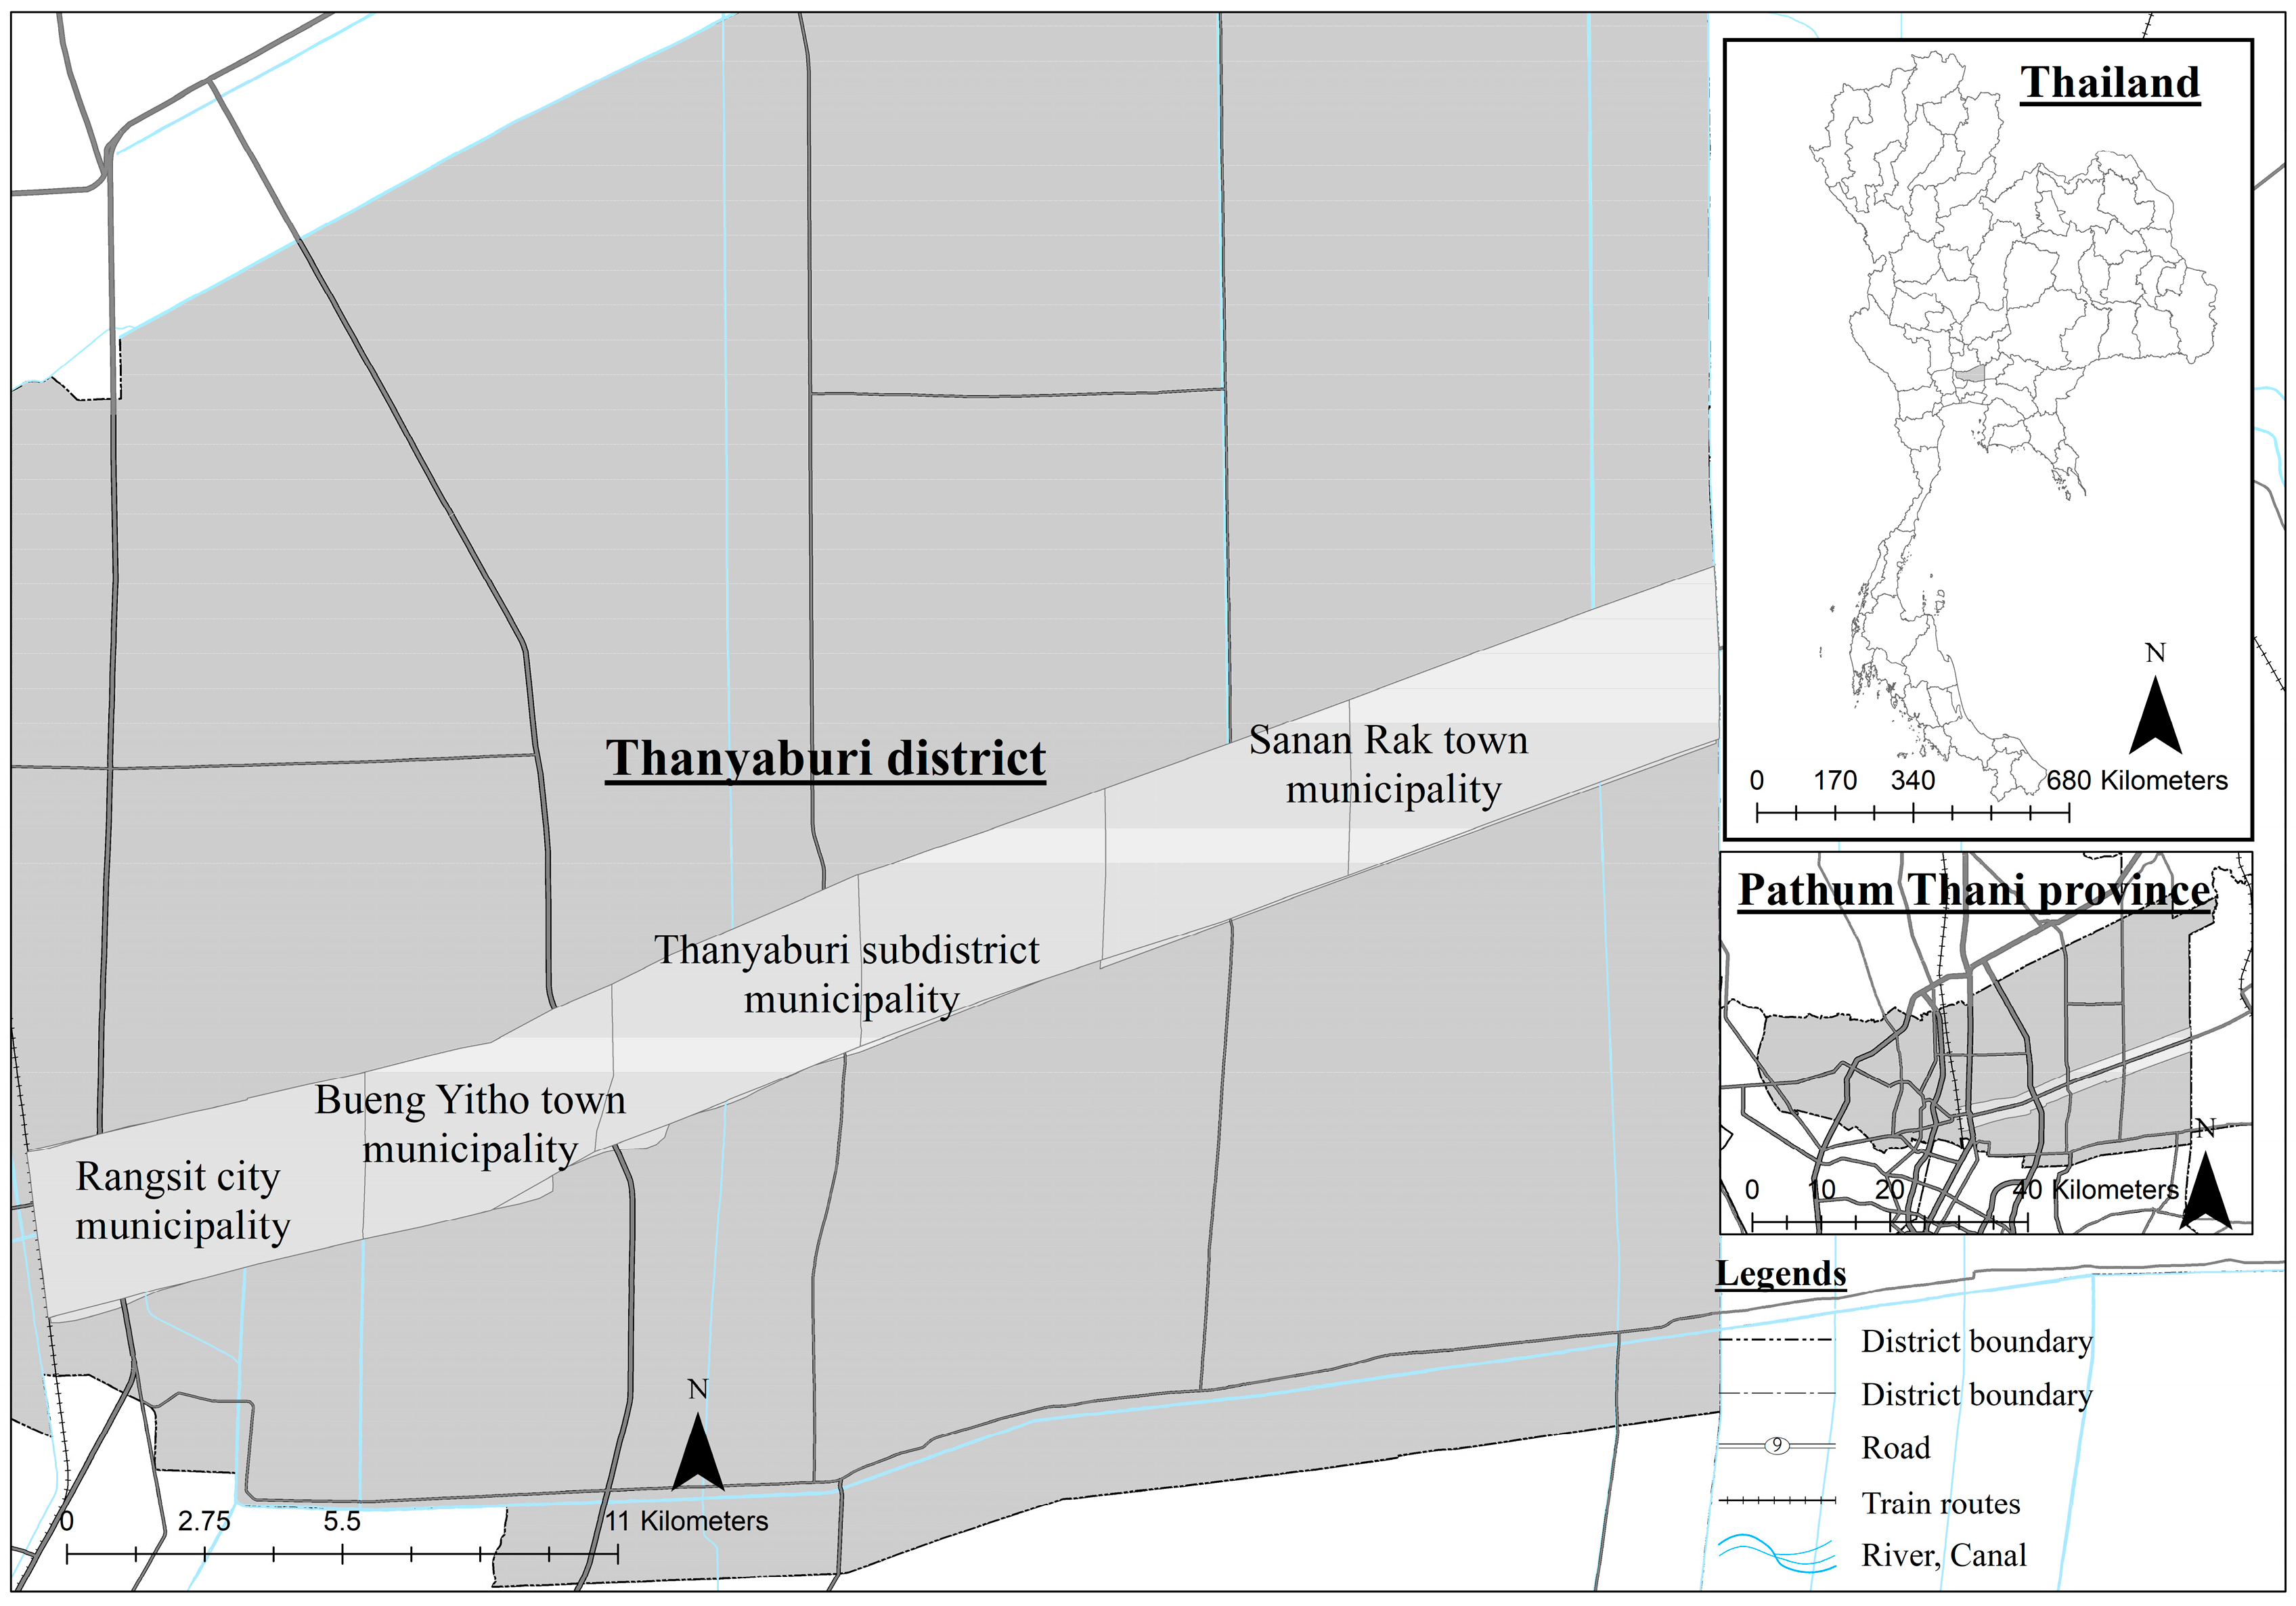
Figure 1. Subdivisions of Thanyaburi district, Pathum Thani.
Sustainability 15 10791 g001
Figure 2. Location of questionnaire respondents by study area.
Sustainability 15 10791 g002
Figure 3. Research framework (source: authors).
Sustainability 15 10791 g003
Figure 4. Density and diversity of different activities in Thanyaburi district.
Sustainability 15 10791 g004
Figure 5. Urban centrality scores of each the Thanyaburi municipalities. (a) Spatial analysis of centrality of Thanyaburi district. (b) Distribution of centrality level in different municipalities.
Sustainability 15 10791 g005
Figure 6. Access to the different types of learning activities.
Sustainability 15 10791 g006
Figure 7. Learning activity participation rates by Thanyaburi municipalities.
Sustainability 15 10791 g007
Figure 8. Centrality score and activities by municipality.
Sustainability 15 10791 g008
Figure 9. Centrality index scores and accessibility of learning activities of each area.
Sustainability 15 10791 g009
Table 1. Social aspect at the municipality level, district level and provincial level.
Variables/SourceAttributesUnitMunicipalityDistrictProvince
123456
Gender (registered population)
/Municipality office
MalePerson39,15815,38530,54615,444100,533568,877
FemalePerson45,38618,32933,87917,334114,928632,655
OthersPerson------
Gender/
Survey
MalePerson91255641213380
FemalePerson64306123178299
OtherPerson4-23921
Religion/
Survey
BuddhistPerson1495511859381655
ChristianPerson5-13918
IslamPerson3--5824
OthersPerson2---23
Marital status/
Survey
MarriedPerson68319025214326
SinglePerson287151767138
DivorcePerson57161323109209
OthersPerson61121027
Age structure/Municipality officePopulationPerson84,54433,71464,42532,778215,4611,201,532
Number of householdsUnit57,30716,22434,45817,903125,892677,046
Family sizePerson/Unit1.4752.0781.8701.8311.8701.775
Male elderlyPerson603722334373255615,19983,888
Female elderlyPerson872532116004318721,127111,694
ElderlyPerson14,762544410,377574336,326195,582
%ElderlyPercent17.516.116.117.533.516.278
Age/
Survey
Less than 25Person41411662118
25–35Person37132628104216
36–45Person49124114116199
46–55Person231435678114
56–65Person581022531
More than 65Person44611522
AllAverage364446344038
Note: 1 = Rangsit city municipality; 2 = Bueng Yitho town municipality; 3 = Thanyaburi subdistrict municipality; 4 = Sanan Rak town municipality; 5 = Thanyaburi district; 6 = Pathum Thani province.
Table 2. Economic aspect at the municipality level, district level and provincial level.
Variables/SourceAttributesUnitMunicipalityDistrictProvince
123456
WorkforceMale workforcePerson26,14610,49020,11310,10040,703381,998
Female workforcePerson30,38512,59222,57711,55446,723425,490
Total workforcePerson56,53123,08242,69021,65487,426807,488
Income and expenditure/Municipality officeIncomeTHB/Month38,972.0256,206.8848,945.1947,784.4150,978.8339,506.99
ExpenditureTHB/Month25,995.0036,725.0028,718.0020,831.0028,758.0031,639.92
Higher educationEducation Person3126143224662190921452,922
(Higher education: university)
Education level/SurveyPrimary schoolPerson68801622
Junior high schoolPerson145631428
High schoolPerson35822114176
Vocational collegePerson27822134370
Bachelor’s degreePerson58255930114172
PostgraduatePerson1921382342
Occupation/SurveyGovernment Person1921382342
Private agency Person4120301969110
Students Person2831101442
Personal businessPerson4919482087136
General employeePerson1741973047
Farming/gardenPerson005166
OtherPerson57321217
Average income, baht/SurveyLess than 5000Person106421222
5001–10,000Person174741532
10,001–15,000Person31919214980
15,001–20,000Person39926124786
20,001–25,000Person1483284862
25,001–30,000Person2151542445
30,001–35,000Person13111342841
35,001–40,000Person6305814
More than 40,000Person80371018
Note: 1 = Rangsit city municipality; 2 = Bueng Yitho town municipality; 3 = Thanyaburi subdistrict municipality; 4 = Sanan Rak town municipality; 5 = Thanyaburi district; 6 = Pathum Thani province.
Table 3. Built environmental aspect at the municipality level, district level and provincial level.
Variables/SourceAttributesUnitMunicipalityDistrictProvince
123456
Land classification/GIS dataArea boundarysq.km21.7716.4233.9342.81115.171518.23
Urbanized areasq.km.16.828.8916.598.0349.86462.77
Agricultural areasq.km1.05 2.41 6.67 2.38 33.95 825.78
Water body sq.km1.08 0.50 2.00 1.34 0.52 63.46
Miscellaneoussq.km2.86 4.58 8.63 9.41 26.14 168.43
Number of buildings/GIS dataResidentNo. of unit31,704 13,490 29,485 16,708 91,387 622,474
CommercialNo. of unit1816 860 1207 584 4467 33,093
IndustryNo. of unit738 396 325 218 1677 23,300
Mixed useNo. of unit1864 725 1546 834 4969 32,949
UtilityNo. of unit52 44 72 23 191 2079
EducationNo. of unit337 109 228 147 821 6375
ReligionNo. of unit115 115 147 118 495 9059
GovernmentNo. of unit210 45 914 99 1268 4827
RecreationNo. of unit34 31 50 17 132 677
AgricultureNo. of unit1 2 -17201168
Residential period, years/Survey1–10 Person9824313994192
11–20 Person3119401675106
21–30Person1671652844
31–40 Person711552128
41–50 Person531221722
More than 51 Person215068
Disclaimer/Publisher’s Note: The statements, opinions and data contained in all publications are solely those of the individual author(s) and contributor(s) and not of MDPI and/or the editor(s). MDPI and/or the editor(s) disclaim responsibility for any injury to people or property resulting from any ideas, methods, instructions or products referred to in the content.