Article

Decoupling Economic Growth from Embodied Water–Energy–Food Consumption Based on a Modified MRIO Model: A Case Study of the Yangtze River Delta Region in China

Business School, Hohai University, Nanjing 211100, China
*
Author to whom correspondence should be addressed.
Sustainability 2023, 15(14), 10779; https://doi.org/10.3390/su151410779
Submission received: 18 May 2023 / Revised: 25 June 2023 / Accepted: 29 June 2023 / Published: 10 July 2023

Abstract

:
Water, energy, and food are indispensable resources for socioeconomic development, and are highly interwoven in urban activities. Clarifying spatial differences in resource consumption is of great significance for coordinated management. However, there is still a lack of a unified assessment for water–energy–food (WEF) nexus flow analysis. This study proposes a comprehensive framework to investigate WEF utilization based on a modified multi-regional input–output (MRIO) analysis. Taking the case of the Yangtze River Delta region, we first inventoried embodied water–energy–food consumption from 2012 to 2017. Then, decoupling analysis and the Logarithmic Mean Divisia Index (LMDI) method were applied to explore decoupling states and identify driving factors. The results show that overall embodied WEF consumption experienced a downward trend from 2012 to 2017, and different provinces varied significantly. Jiangsu had the largest consumption of water and energy, while Anhui contributed a big chunk to food consumption. The manufacturing sector heavily relied on WEF resources and had a great impact on the ecological environment. The decoupling performance indicated a general trend of weak decoupling and strong decoupling in most provinces, with the mining, electricity, and gas supply sectors contributing most to positive decoupling, and the service sectors devoting the most to negative decoupling. As for resource type, water ecological footprint decoupled more than energy and food ecological footprints. Technology level and industrial structure had a major effect on the realization of decoupling, while economic output and population scale were the main restraining factors. Finally, we provide some differentiated policy recommendations for coordinated resource management.

1. Introduction

Water, energy, and food are essential resources for human survival and socioeconomic development. By 2050, global demands for water, energy, and food are projected to increase by 55%, 80%, and 60%, respectively, posing significant pressure for sustainable resources supply and consumption security [1]. To address this challenge, the 2011 Bonn conference proposed a water–energy–food (WEF) nexus concept to investigate the complex interactions and trade-offs among different resource systems [2]. After that, the United Nations adopted 17 sustainable development goals (SDGs) in 2012, of which SDG2 (zero hunger), 6 (clean water and sanitation), and 7 (affordable and clean energy) were directly related to WEF systems [3]. While economic growth has generated many benefits, such as raising living standards and improving people’s quality of life, it has also exacerbated WEF scarcity and environmental degradation [4]. As a result, it is crucial for different regions to uncover the intrinsic linkages between WEF consumption and economic growth, and to propel the transition of production and consumption toward a circular and sustainable pattern.
The Yangtze River Delta region plays a pivotal role in national economic development, and it is a typical area of urbanization as well as resources and environment overload [5]. In 2020, this area provided 3.74% of the total geographical area, 14.91% of the total people, and contributed 24.09% of China’s annual GDP (Figure 1). However, as urbanization and economic expansion progresses, so does the demand for WEF resources. Between 1990 and 2018, the urbanization rate of the Yangtze River Delta increased from 21.4% to 66.8%, with water use rising by 19.04% and food consumption increasing by 201.31% [6]. Meanwhile, energy production only accounted for about 21% of the total energy supply, and coal-dominated energy use led to massive carbon emissions, which worked against meeting the goals of a green and low-carbon economy [7]. With the release of “The Outline of Regional Integrated Development Plan of the Yangtze River Delta”, high-quality development and ecological protection have emerged as crucial regional development goals. As a consequence, there is a need to coordinate economic growth and WEF resource use, thus gradually reducing the dependence of economic development on resources. So far, few studies have explored the characteristics of WEF consumption in the Yangtze River Delta region, as well as its interactions with economic development. Therefore, it is necessary to research how economic expansion and the usage of WEF resources are decoupled in the Yangtze River Delta.
Many studies have attempted to explore embodied WEF consumption to reveal the resource requirement of a product or service in a life cycle. For example, Owen et al. [8] calculated the UK’s water, energy, and food utilization and suggested that the final products embodied with high WEF resources and low socioeconomic value should be preferentially reduced. White et al. [9] explored the features of WEF consumption in East Asia, revealing a mismatch between resource availability and the corresponding final consumption. Zhang et al. [10] proposed an interactive framework for WEF footprint accounting and systematically inventoried sectoral WEF consumption in the Greater Bay Area for coordinated resource management. The above results indicated that WEF resource utilization differed greatly at multiple scales. In these studies, a multi-regional input–output analysis was widely used in environmental impact studies of supply chains [11,12,13]. Nevertheless, most studies calculated the values of WEF nexus flows in different units of measurement, such as the energy–water–land nexus in four municipalities of China [14] and the embodied water–energy–carbon nexus of China [15], with different resources being calculated separately. Some research has investigated the energy–water nexus of wind power generation systems by normalizing water and energy flows in Joules, which helps policymakers to gain a holistic view of effective nexus resource management [16]. Zhang and Li [17] applied global average footprints to evaluate the environmental impacts of various diets, revealing an increasing consumption of phosphorus and nitrogen as well as blue water use in China due to its high consumption of rice, vegetables, and pork. However, a unified framework is still lacking in the WEF nexus assessment.
Emergy, defined as “the energy of one type required in transformations to generate a flow and storage”, can measure various types of resources in a uniform unit (i.e., solar emergy emjoules) and has been widely used in sustainability evaluation, environmental impact assessment, and ecological footprints accounting [18,19]. Previous research primarily focused on a single resource, such as food [20], energy [21], and water [22], and the findings revealed that rising WEF consumption has increased carbon emissions and generated substantial ecological footprints, threatening the regional ecological environment. Also, progress in integration by combining emergy accounting with input–output analysis was made in some studies to explore the environmental impact of economic activities at the sectoral level. In the work of Ukidwe and Bakshi [23], a novel thermodynamic accounting method was proposed to evaluate sectoral environmental burdens, and the result indicated that sectors had high natural capital input disproportionate to their economic contribution. Later, some scholars used China’s input–output table to determine sector-specific resource intensities and discovered that industries with high energy consumption had the most impact on the ecological environment [24]. From the nexus perspective, a study on energy–water consumption in Beijing was conducted to reveal economic sectors’ reliance on energy–water nexus systems [25]. However, few studies have investigated WEF consumption by combining emergy accounting and the MRIO model.
As China’s economic growth is transforming from an extensive mode to a sustainable and green development one, it is necessary to decouple economic growth from resource utilization so that ecological degradation can be mitigated. Most studies focused on single-resource decoupling, such as via water [26,27,28,29], energy [30,31], carbon emissions [32,33,34], and food [35,36,37]. A few studies have attempted to explore the decoupling states between economic growth and multiple resource utilization. For example, Anser et al. [38] explored the decoupling states between WEF resources and carbon emissions in Pakistan and suggested reducing the ecological cost through cleaner production technologies, green energy, and strict environmental regulations. In China, Ma et al. [39] evaluated the decoupling levels of industrial energy–water consumption to uncover the temporal and spatial features of resource utilization. Wang et al. [40] explored the coupling mechanism of the WEF system in the Yellow River Basin. Gao and Yang [41] analyzed the decoupling relationship between energy and food-related water footprint pressure and green development. To further investigate the driving factors behind resource use, decomposition analysis has been widely used at the regional level [42,43] and sectoral level [44,45]. It can be concluded from these studies that technological level and industrial structure have significant effects on resource consumption, while other drivers (e.g., population, economic activity) vary in different areas [46]. To date, few studies have examined the decoupling of WEF consumption from economic growth in the Yangtze River Delta and identified the factors influencing the decoupling states.
To fill the gap, this study aimed to establish a unified assessment framework for WEF consumption at the regional level by combining emergy accounting and the MRIO model. Then, we extended the LMDI decomposition model to decompose the decoupling index into five influencing factors by fully considering both resource and economic attributes, focusing on examining the impacts of technology effect, industrial structure effect, economic scale effect, resource-saving capacity effect, and population size effect on the decoupling state of economic sectors in the Yangtze River Delta region. This research contributes to proposing an emergy-based framework for assessing the WEF nexus and addressing the decoupling of WEF systems from economic development in the Yangtze River Delta, which could help formulate differentiated policies for regional WEF management. The remainder of this paper is organized as follows. Section 2 describes research methods and data. Section 3 and Section 4 present the results and discussion, respectively. Section 5 provides conclusions and policy implications based on the results.

2. Materials and Methods

2.1. Framework and Structure

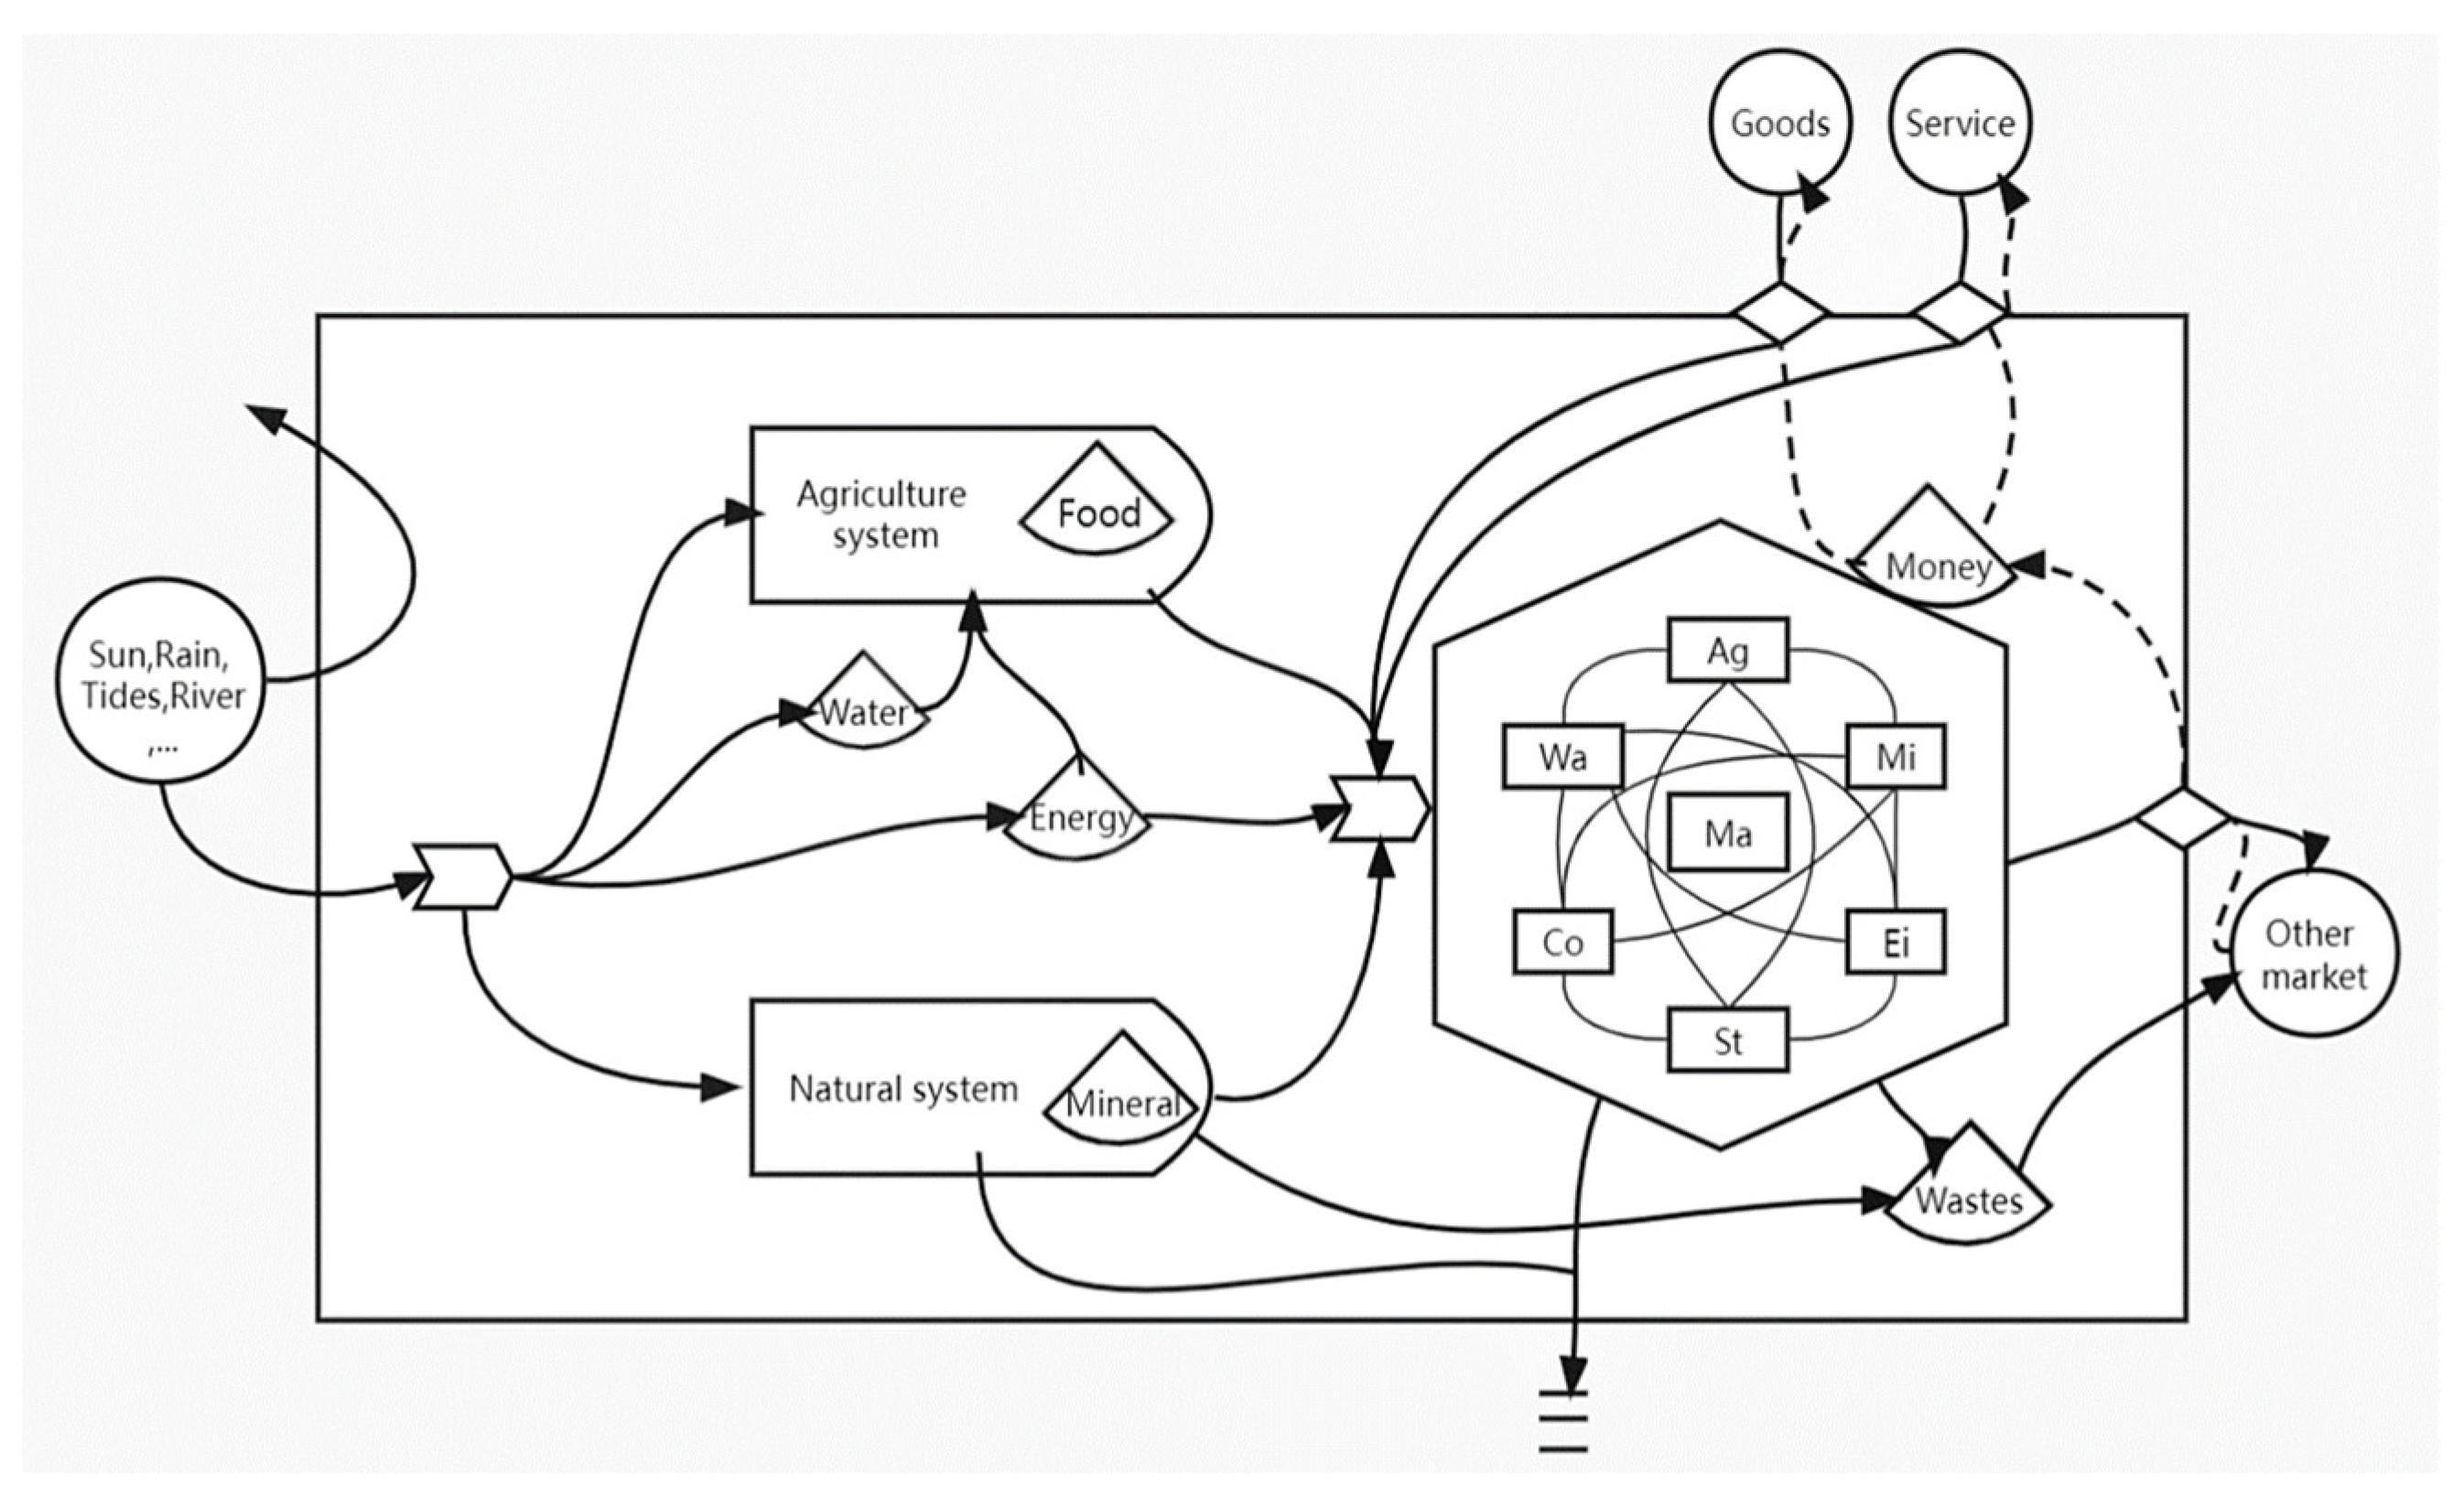
The urban WEF nexus system is composed of both the economy and the supporting environment. As shown in Figure 2, the economy includes seven aggregated economic sectors including Agriculture (Ag), Mining (Mi), Manufacturing (Ma), Electricity and gas supply (Ei), Water supply (Wa), Construction (Co), and Transport and services (St). The supporting environment comprises various types of natural resources, such as water, fossil energy, renewable energy, and biological assets. In order to meet residents’ living demands and social-economic development, water, energy, and food are extensively used in the production and consumption processes. Water is used for urban energy production and supply, while water extraction, delivery, and treatment also require a significant amount of energy. Meanwhile, food production, processing, and storage require adequate water and energy supply. As a result, water, energy, and food are interwoven from the suppliers to end users to drive the regional economic system.
In this study, a variety of methods were adopted to analyze the urban WEF system. First of all, the MRIO analysis was used to quantify direct WEF use and the embodied WEF consumption at the sectoral level, so as to track water, energy, and food flows across sectors and regions. Then, the sectoral WEF flows were converted into equivalent flows using emergy analysis. On this basis, the Tapio model was applied to investigate the decoupling of the embodied WEF consumption from economic growth, revealing the level of coordinated development between ecological pressure and economic development from the WEF nexus perspective. In addition, the LMDI decomposition method was employed to uncover the dynamic influencing factors behind WEF consumption.

2.2. WEF Footprint Accounting

In this study, we first inventoried direct and nexus-oriented WEF consumption through economic sectors. Different types of WEF nexus have been identified for illustrating inter-regional consumption. Direct water was calculated as the sum of all water types (i.e., surface water, groundwater, and desalinated water) [47]. Direct energy comprised various types of energy consumption (e.g., coal, gasoline, diesel, natural gas, and electricity) [48]. Direct food mainly referred to the physical consumption of grains, legumes, edible oil, meats, eggs, dairy, and aquatic products [8], as shown in Equation (1). To standardize the data, energy and food products were converted into consistent units by using the standard coal-equivalent coefficient and feed conversion ratio, respectively. The accounting of nexus-oriented consumption enables a unified evaluation of the WEF nexus, which can be calculated by multiplying direct WEF and the corresponding consumption coefficient [49], as shown in Equation (2). Water-related energy (W-energy) refers to energy consumption for water abstraction, supply, and treatment. Energy-related water (E-water) refers to water requirements for energy production, transportation, and consumption. F-related water (F-water) and F-related energy (F-energy) consider water and energy consumption in food irrigation, processing, manufacturing, and edible processes. Water-related food and energy-related food were not considered because they lack the corresponding consumption coefficient and relevant data [10].
f r ,   i   a = 1 m a r ,   i m
f r ,   i   b = 1 m b r ,   i m   ×   β r ,   i b
where  f r ,   i   a  and  f r ,   i   b  are direct and nexus-oriented WEF flows from sector i in region r. m represents resource type (i.e., water, energy, food, and nexus-oriented flows).  a r ,   i m  and  b r ,   i m  represent the direct and nexus-oriented consumption for mth type.  β r ,   i b represents the consumption coefficient of the corresponding nexus-oriented flows. r and i represent the region and the sector, respectively. Next, the WEF consumption triggered by final demand categories was inventoried to investigate the indirect relationships among sectors from a consumption perspective. The WEF-related emergy intensity in terms of the emergy-based economic output of sector i m , i    is expressed as:
m , i = f r , i   m   ×   τ m , i x m , i   ×   τ r , i
where m and r denote resources type and region, and  f r , i   m  refers to the amount of direct water, energy, or food use.  τ m , i  is the emergy transformity of mth resources.  x m , i represents water, energy, or food intensity in terms of the economic output of sector i, and  τ r , i  refers to specific transformity for sector i. Based on the Leontief inverse matrix, the WEF flows of urban sectors triggered by the final demand categories can be calculated, as shown in Formulas (4) and (5):
A = t i , j r , s X j s n × n
P = m ,   n × n   diag   I     A   - 1 F
where  m ,   n × n     diag  is a diagonal matrix transformed from  m , i ; A is the coefficient matrix calculated by inter-regional and inter-sectoral monetary flows  t i , j r , s  divided by the corresponding economic output  X j s  in the MRIO table. (I − A)−1 is the Leontief inverse matrix in which I is an identity matrix; F represents the vector of embodied resource consumption triggered by the final demand categories.

2.3. Hybrid Emergy–MRIO Modeling

Multi-regional input–output analysis has been widely used for quantifying the relationships between pairs of industrial components and tracking the resource and material flows across nations [9,50], regions [51,52], and cities [53,54]. By adding extra satellite accounts and a complementary physical matrix to the monetary MRIO model [55], environmentally extended MRIO (EE-MRIO) can be constructed, and the WEF consumption triggered by the final demand was inventoried to analyze the direct and indirect nexus pathways. In our study, the original 42 economic sectors were grouped into seven larger sectors (agriculture, mining, manufacture, electricity and gas supply, water supply, construction, and transport and services) based on the common activities in the industry, as shown in Table 1. In combination with emergy analysis, the sector-specific emergy transformities were calculated based on Ukidwe, Bakshi and Hau’s work [23,56]. The specific transformities for the aggregated seven sectors were calculated as derived from the specific transformities for the original 42 sectors, as shown below:
p i , r = I i , r S r
T j , r = 1 j T i , r   ×   p i , r
where  p i , r denotes the proportion of the input from sector i out of the total input in the economic input–output table.  I i , r represents economic input for sector i from region r.  S r represents total economic input in region r.  T i , r  is the transformity for sector i within the original 42 sectors.  T j , r  is the specific transformity for sector j within the aggregated seven sectors. The emergy transformity for energy consumption can be calculated based on the proportions of different types of energy consumption and their corresponding emergy transformity, as shown below:
ES d = C d T d
T e = 1 k   1 k ES d   ×   T ed
where  ES d  denotes the energy structure.  C d  is the equivalent amount of dth type of energy use;  T d  is total equivalent amount of energy consumption.  T ed  is the emergy transformity of dth energy consumption.  T e  is the emergy transformity for sectoral energy consumption.
Then, the WEF resource flows among sectors can be converted to emergy-based flows via emergy transformities, as below:
  e i j m = f i j m × T m
where    e i j m  represents the emergy-based resource flow.  f i j m  denotes resource flows among sectors. Tm represents the emergy transformity for mth type of resource.

2.4. Tapio Decoupling Model

Decoupling implies economic growth and resource consumption increases that are not synchronized. There are two main decoupling methods used to evaluate decoupling states, including OECD and Tapio models, in which the former model is based on the beginning and end values [57] while the latter model considers the elastic coefficient [58]. Since the Tapio model can reduce deviation caused by the high sensitivity of the base year and further refine the decoupling state to make the result more accurate, it is more widely used in the research of resources and environment. This study selected the Tapio model to evaluate the decoupling relationship between embodied WEF resources and regional economic growth. The calculation formula is as follows:
T = Δ E i r / E i 0 r Δ G i r / G i 0 r = ( E it r - E i 0 r ) / E i 0 r ( G it r - G i 0 r ) / G i 0 r
where T is the decoupling index;  Δ E i r  and  Δ G i r  represent the difference in WEF utilization and GDP value of sector i in region r, respectively; subscripts 0 and t refer to the base year and the reporting year. The coordination degree between embodied WEF resources consumption and economic development across regions can be further calculated by using Equation (12):
T rs = Δ E rs / E rs Δ G s / G s
where  Δ E rs  and  Δ G s  represent the change in WEF consumption of region r caused by final demand in region s and GDP of region s.  E rs  and  G s  refer to the WEF consumption and regional GDP (GRDP) in the base year.
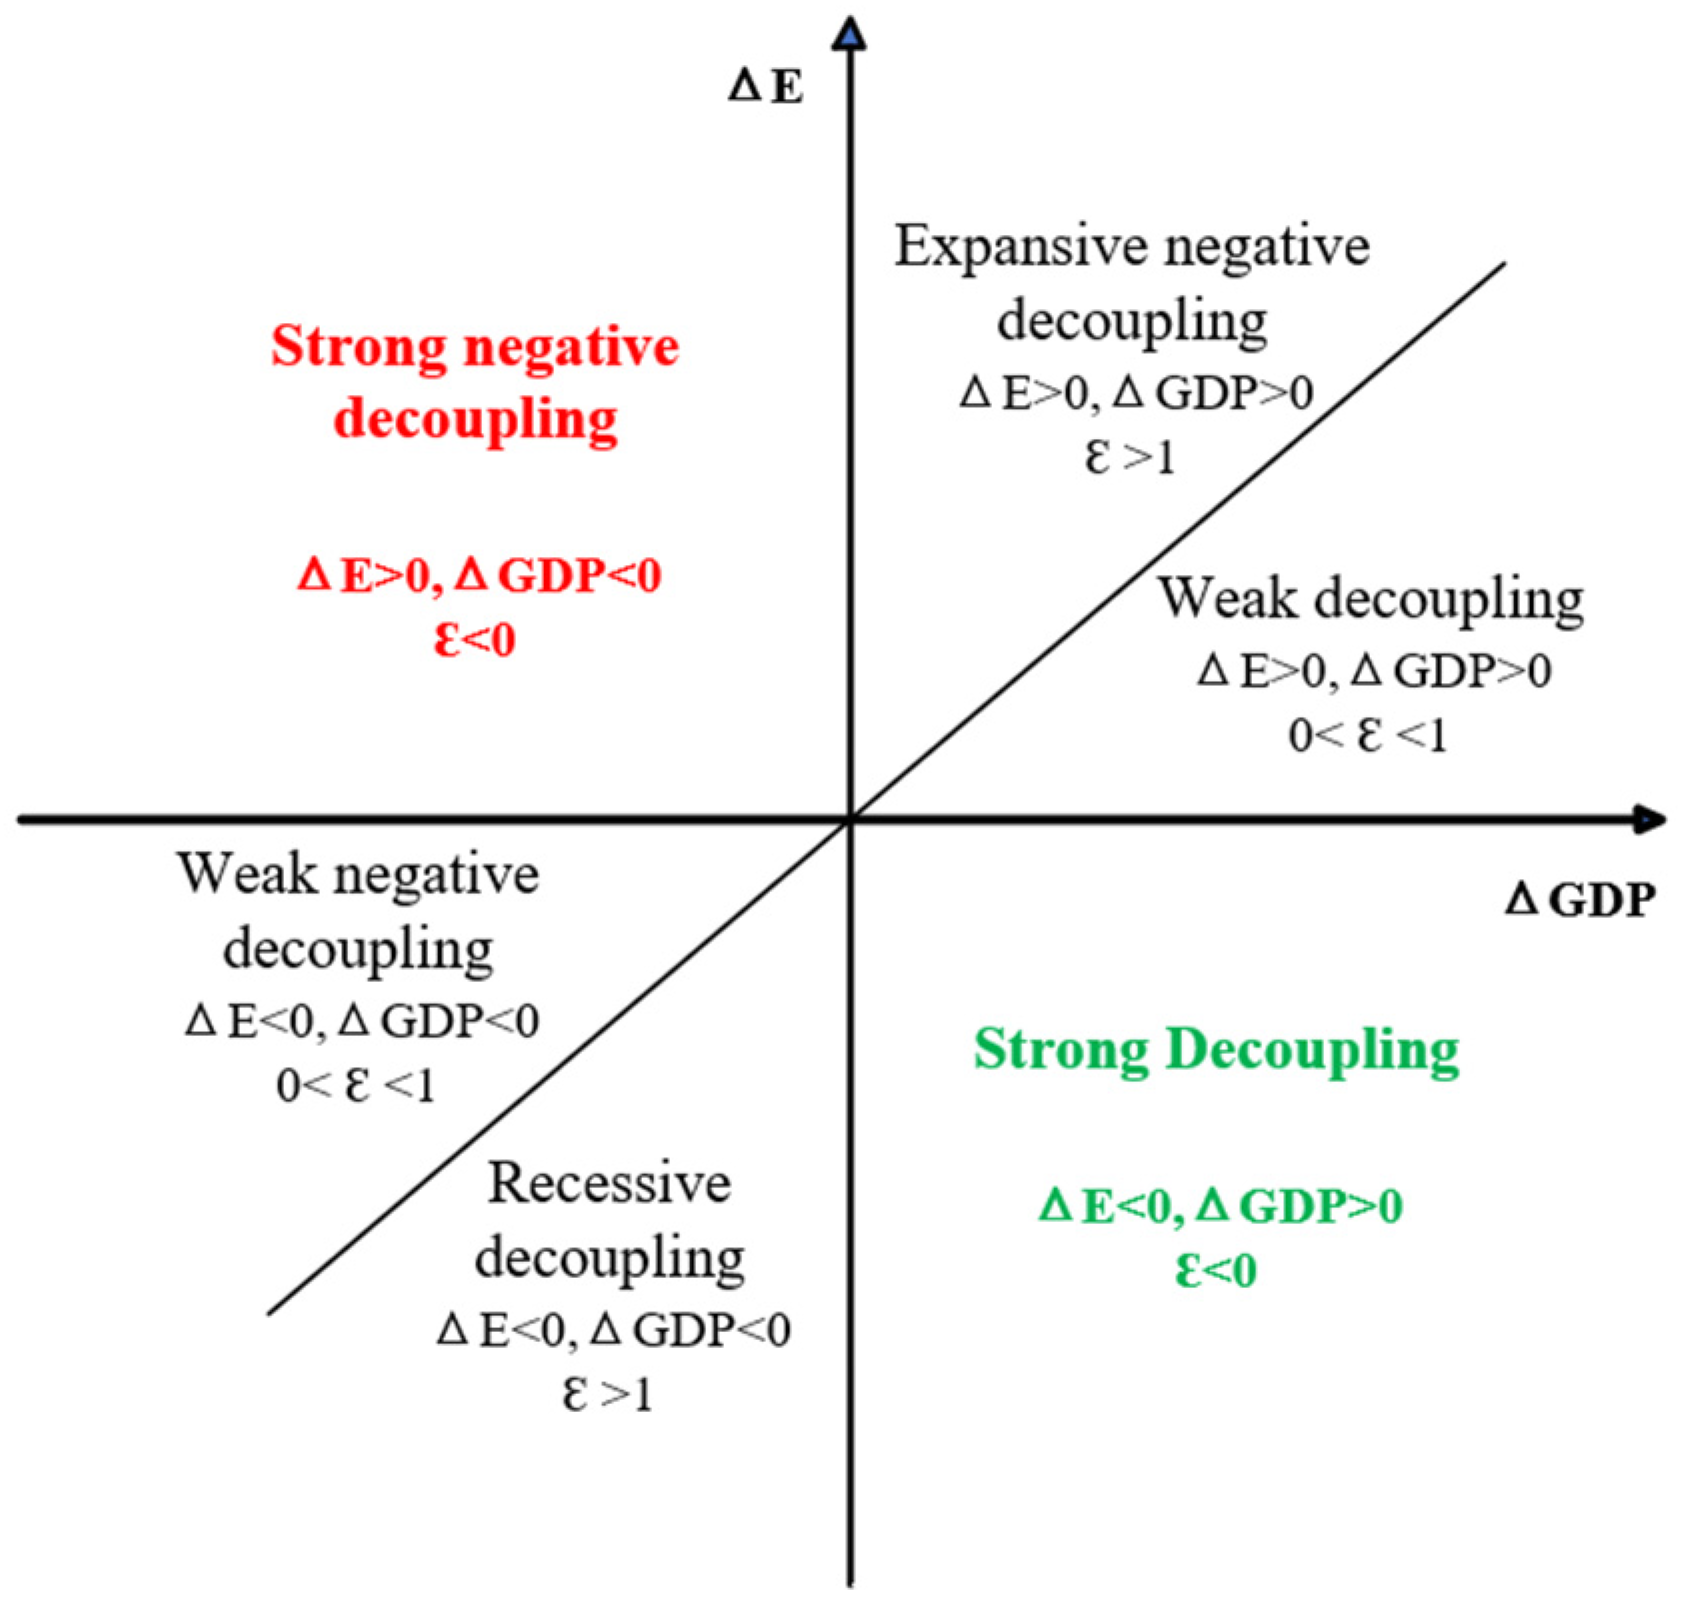
Tapio mainly divides decoupling states into three categories, coupling, decoupling, and negative decoupling, based on the value of T, as shown in Figure 3. Specifically, strong decoupling is the most desirable state, indicating that the economy increases while resource consumption decreases. Weak decoupling represents the increasing rate of resource consumption being obviously smaller than the economy. Recessive decoupling is a decline in the rate of resource consumption that is clearly faster than the economy. All three states above indicate rising resource productivity, which is regarded as positive decoupling. In contrast, negative decoupling includes three states: expansive negative decoupling, weak negative decoupling, and strong negative decoupling. Strong negative decoupling is the least ideal state, implying negative economic growth while resource use increases. Expansive negative decoupling means that the increased pace of resource consumption is obviously bigger than the economy. Weak negative decoupling means that the decrease pace of resource consumption is clearly smaller than the economy. In general, the closer to a strong decoupling, the higher the level of coordination between resource consumption and economic growth. On the other hand, the closer to a strong negative decoupling, the worse the level of coordination between resource consumption and economic growth.

2.5. LMDI Decomposition

There are two main types of decomposition analysis to investigate drivers behind resource consumption, namely index decomposition analysis (IDA) and structural decomposition analysis (SDA) methods. The former method is easier for interpreting results and has fewer requirements for data compared with the latter [59]. Among all IDA methods, the LMDI method can completely decompose the residual value and has small requirements for original data, which has been widely applied in the field of resources and environment [24]. Therefore, this study applied the LMDI model to identify the driving factors and classify resource consumption into four indicators in which both resources and economic attributes were considered. The specific driving factors are explained in Table 2. Based on kaya identity, the specific formula is shown below:
E = i E i , n = i E i , n G i , n   × G i , n G n   ×   G n R n   × R n   P n   ×   P n
      = i ( T e c i , n   ×   S t r i , n   ×   I n c i , n   ×   R e s n   ×   P o p n )
where i and n represent different sectors and the target year, respectively;  E i , n  is the embodied WEF consumption of the i th sector in year n;  G i , n  is the total produced value added from sector i in year n;  G n  is the GRDP in year n;  R n  is the per capita resource use in year n;  P n  denotes the residential population. Subsequently, the formula can be rewritten to obtain the parameters  T e c i , n S t r i , n I n c i , n R e s n , and  P o p n , which refer to technology effect, industrial structure, economic scale, resource-saving capacity, and population size, respectively.
Then, the LMDI method is used to decompose these driving indicators into four effects and the Formula (15) can be further derived as follows:
Δ E = Δ E T e c + Δ E S t r + Δ E I n c + Δ E R e s + Δ E P o p
Δ E T e c = i E i , n   -   E i , 0 lnE i , n   -   lnE i , 0 ln Tec i , n Tec i , 0
Δ E S t r = i E i , n   -   E i , 0 lnE i , n   -   lnE i , 0 ln Str i , n Str i , 0
Δ E I n c   = i E i , n   -   E i , 0 lnE i , n   -   lnE i , 0 ln Inc i , n Inc i , 0
Δ E R e s   = i E i , n   -   E i , 0 lnE i , n   -   lnE i , 0 ln Res i , n Res i , 0
Δ E P o p   = i E i , n   -   E i , 0 lnE i , n   -   lnE i , 0 ln Pop i , n Pop i , 0
where n and 0 represent the reporting year and the base year, respectively. ∆ETec, ∆EStr, ∆EInc, ∆ERes, and ∆EPop denote the change in WEF resources caused by the four driving factors. Combined with the above formulas, a decomposition model for decoupling resources’ utilization from economic development can be expressed as follows:
e = G E Δ G Δ E T e c   + G E Δ G Δ E S t r + G   E Δ G Δ E I n c + G E Δ G Δ E R e s + G E Δ G Δ E P o p
    = e T e c + e S t r + e I n c + e R e s + e P o p
where  e T e c  denotes technology effect,  e S t r  represents industrial structure effect,  e I n c  represents economic output effect,  e R e s  is the resource-saving capacity effect, and  e P o p  is population scale effect.

2.6. Data Sources

This research explores the relationship between WEF consumption and economic growth in the Yangtze River Delta region. The research period ranges from 2012 to 2017 and the input–output data used in this calculation were derived from the China Statistical Bureau and China Accounts and Datasets (CEADs). Raw data on water, energy, and food were collected from the Water Resources Bulletin, China Environmental Statistics Yearbook, China’s Energy Statistical Yearbook, and China Agriculture Yearbook. Nexus-oriented consumption was calculated based on direct consumption and the corresponding consumption coefficient. The emergy transformity of different resources was obtained from relevant studies. A specific description is stated in Table 3. Since the water consumption data of sub-sectors were not officially disclosed, we estimated the water consumption of sub-sectors based on the proportion of the value-added output of each industry provided in the 2008 China Economic Census Yearbook. Moreover, ecological water was included in tertiary industry water usage. Multiple types of energy and food were converted into uniform measurements of solar emergy values. Economic data were obtained from statistical yearbooks and were deflated at constant 2015 prices.

3. Results

3.1. Characteristics of Embodied WEF Consumption

Figure 4 illustrates the characteristics and disparities of embodied WEF consumption. Dominated WEF footprints embodied in final consumption differed in the Yangtze River Delta region. On average, embodied water (8.82 × 10¹⁶ sej) and energy (3.71 × 10²³ sej) footprints were greater in Jiangsu than the other three regions. Anhui(AH) was the highest province for food consumption, with an average of 2.25 × 10²³ sej. In terms of sectoral consumption, the construction sector contributed to a decrease in embodied WEF consumption while the transport and services sector saw an increase in all the investigated provinces. Specifically, Jiangsu’s manufacturing sector accounted for the largest proportion in the water, food-related water, and energy networks, with an average consumption of 1.86 × 10¹⁶ sej, 9.87 × 10¹⁶ sej, and 1.18 × 10²³ sej, respectively. Anhui’s manufacturing industry had the largest ecological footprint in the food network, with an average of 1.41 × 10²³ sej. As for the transport and services sector, Jiangsu experienced a surge increase from 7.65× 10²² sej to 1.87 × 10²³ sej during the study period in the energy network. Aside from that, the mining industry and the water supply department accounted for merely a small proportion of WEF consumption. Regarding resource types, environmental impact due to energy consumption accounted for the majority of the total impact of economic activities, followed by food consumption. These results were closely related to resources endowment and the industrial structure of the four regions. Shanghai is a consumer-type region and the service sectors are rapidly developing, contributing to a large demand for embodied WEF products. Jiangsu (JS) and Zhejiang (ZJ) have a complete supply chain in the secondary industry, which requires more resources to keep the whole industry chain running. Anhui’s primary sector is relatively developed and has the advantage of exporting water-intensive food products to other areas.
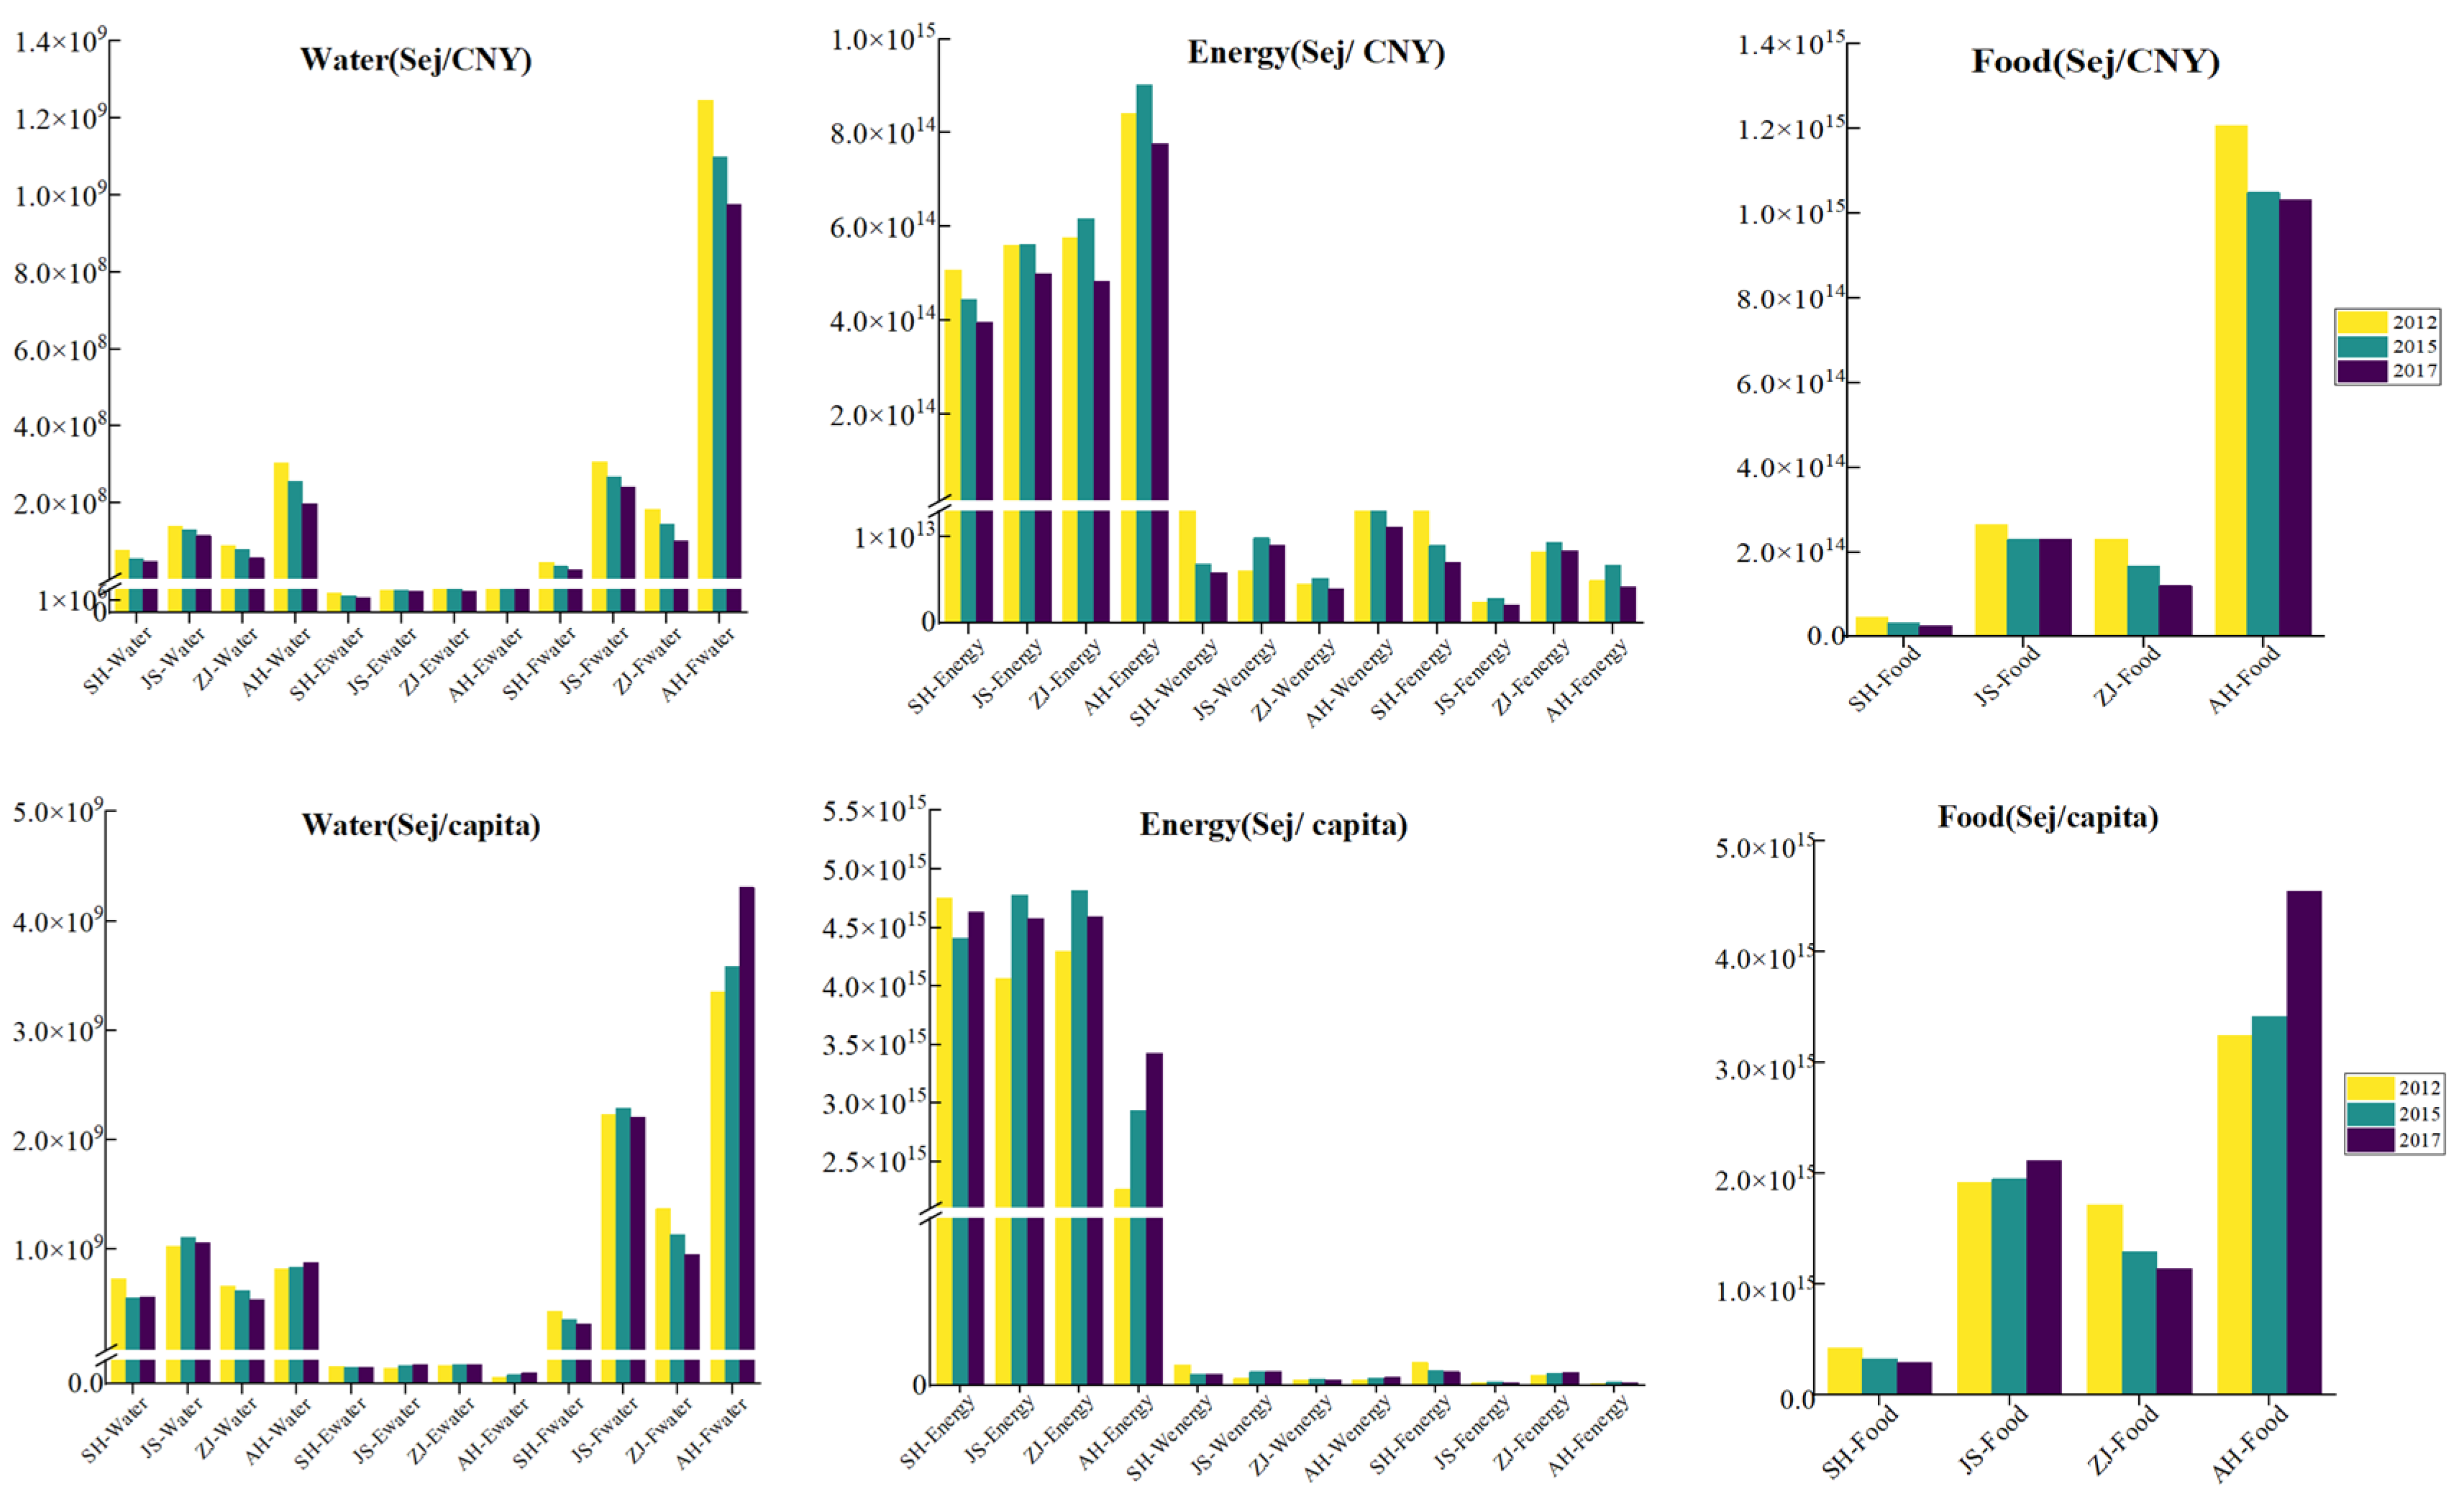
Figure 5 further shows the per unit GDP and per capita WEF utilization in the Yangtze River Delta region. The former indicator describes the amount of WEF footprints consumed per unit of GRDP, and the latter indicator illustrates resource consumption divided by the regional resident population, which can reflect the resource utilization efficiency better. In general, per unit GDP water and food-related water consumption decreased from 2012 to 2017, especially in Anhui province. Per unit GDP energy and food-related energy consumption first increased and then decreased in most provinces, except Shanghai, which continuously decreased during the observed period. Per unit GDP food consumption declined in most areas. In terms of per capita resource use, there was a fluctuating and slight decrease in per capita water and food-related water consumption in Shanghai, Jiangsu, and Zhejiang. On average, per capita water consumption in the three regions was 6.17 × 10⁸ sej/capita, 1.06 × 10⁹ sej/capita, and 6.06 × 10⁸ sej/capita, respectively, from 2012 to 2017. In contrast, per capita water and food-related water use in Anhui increased continuously, with an average value of 2.53 × 10⁸ sej/capita. As for energy, Anhui had the lowest per capita energy consumption, with a mean value of 2.88 × 10¹⁵ sej/capita. Per capita energy consumption fluctuated in the other three regions. Furthermore, Shanghai and Zhejiang showed a decrease in per capita food consumption, while Jiangsu and Anhui saw an increase.

3.2. Analysis of Decoupling States

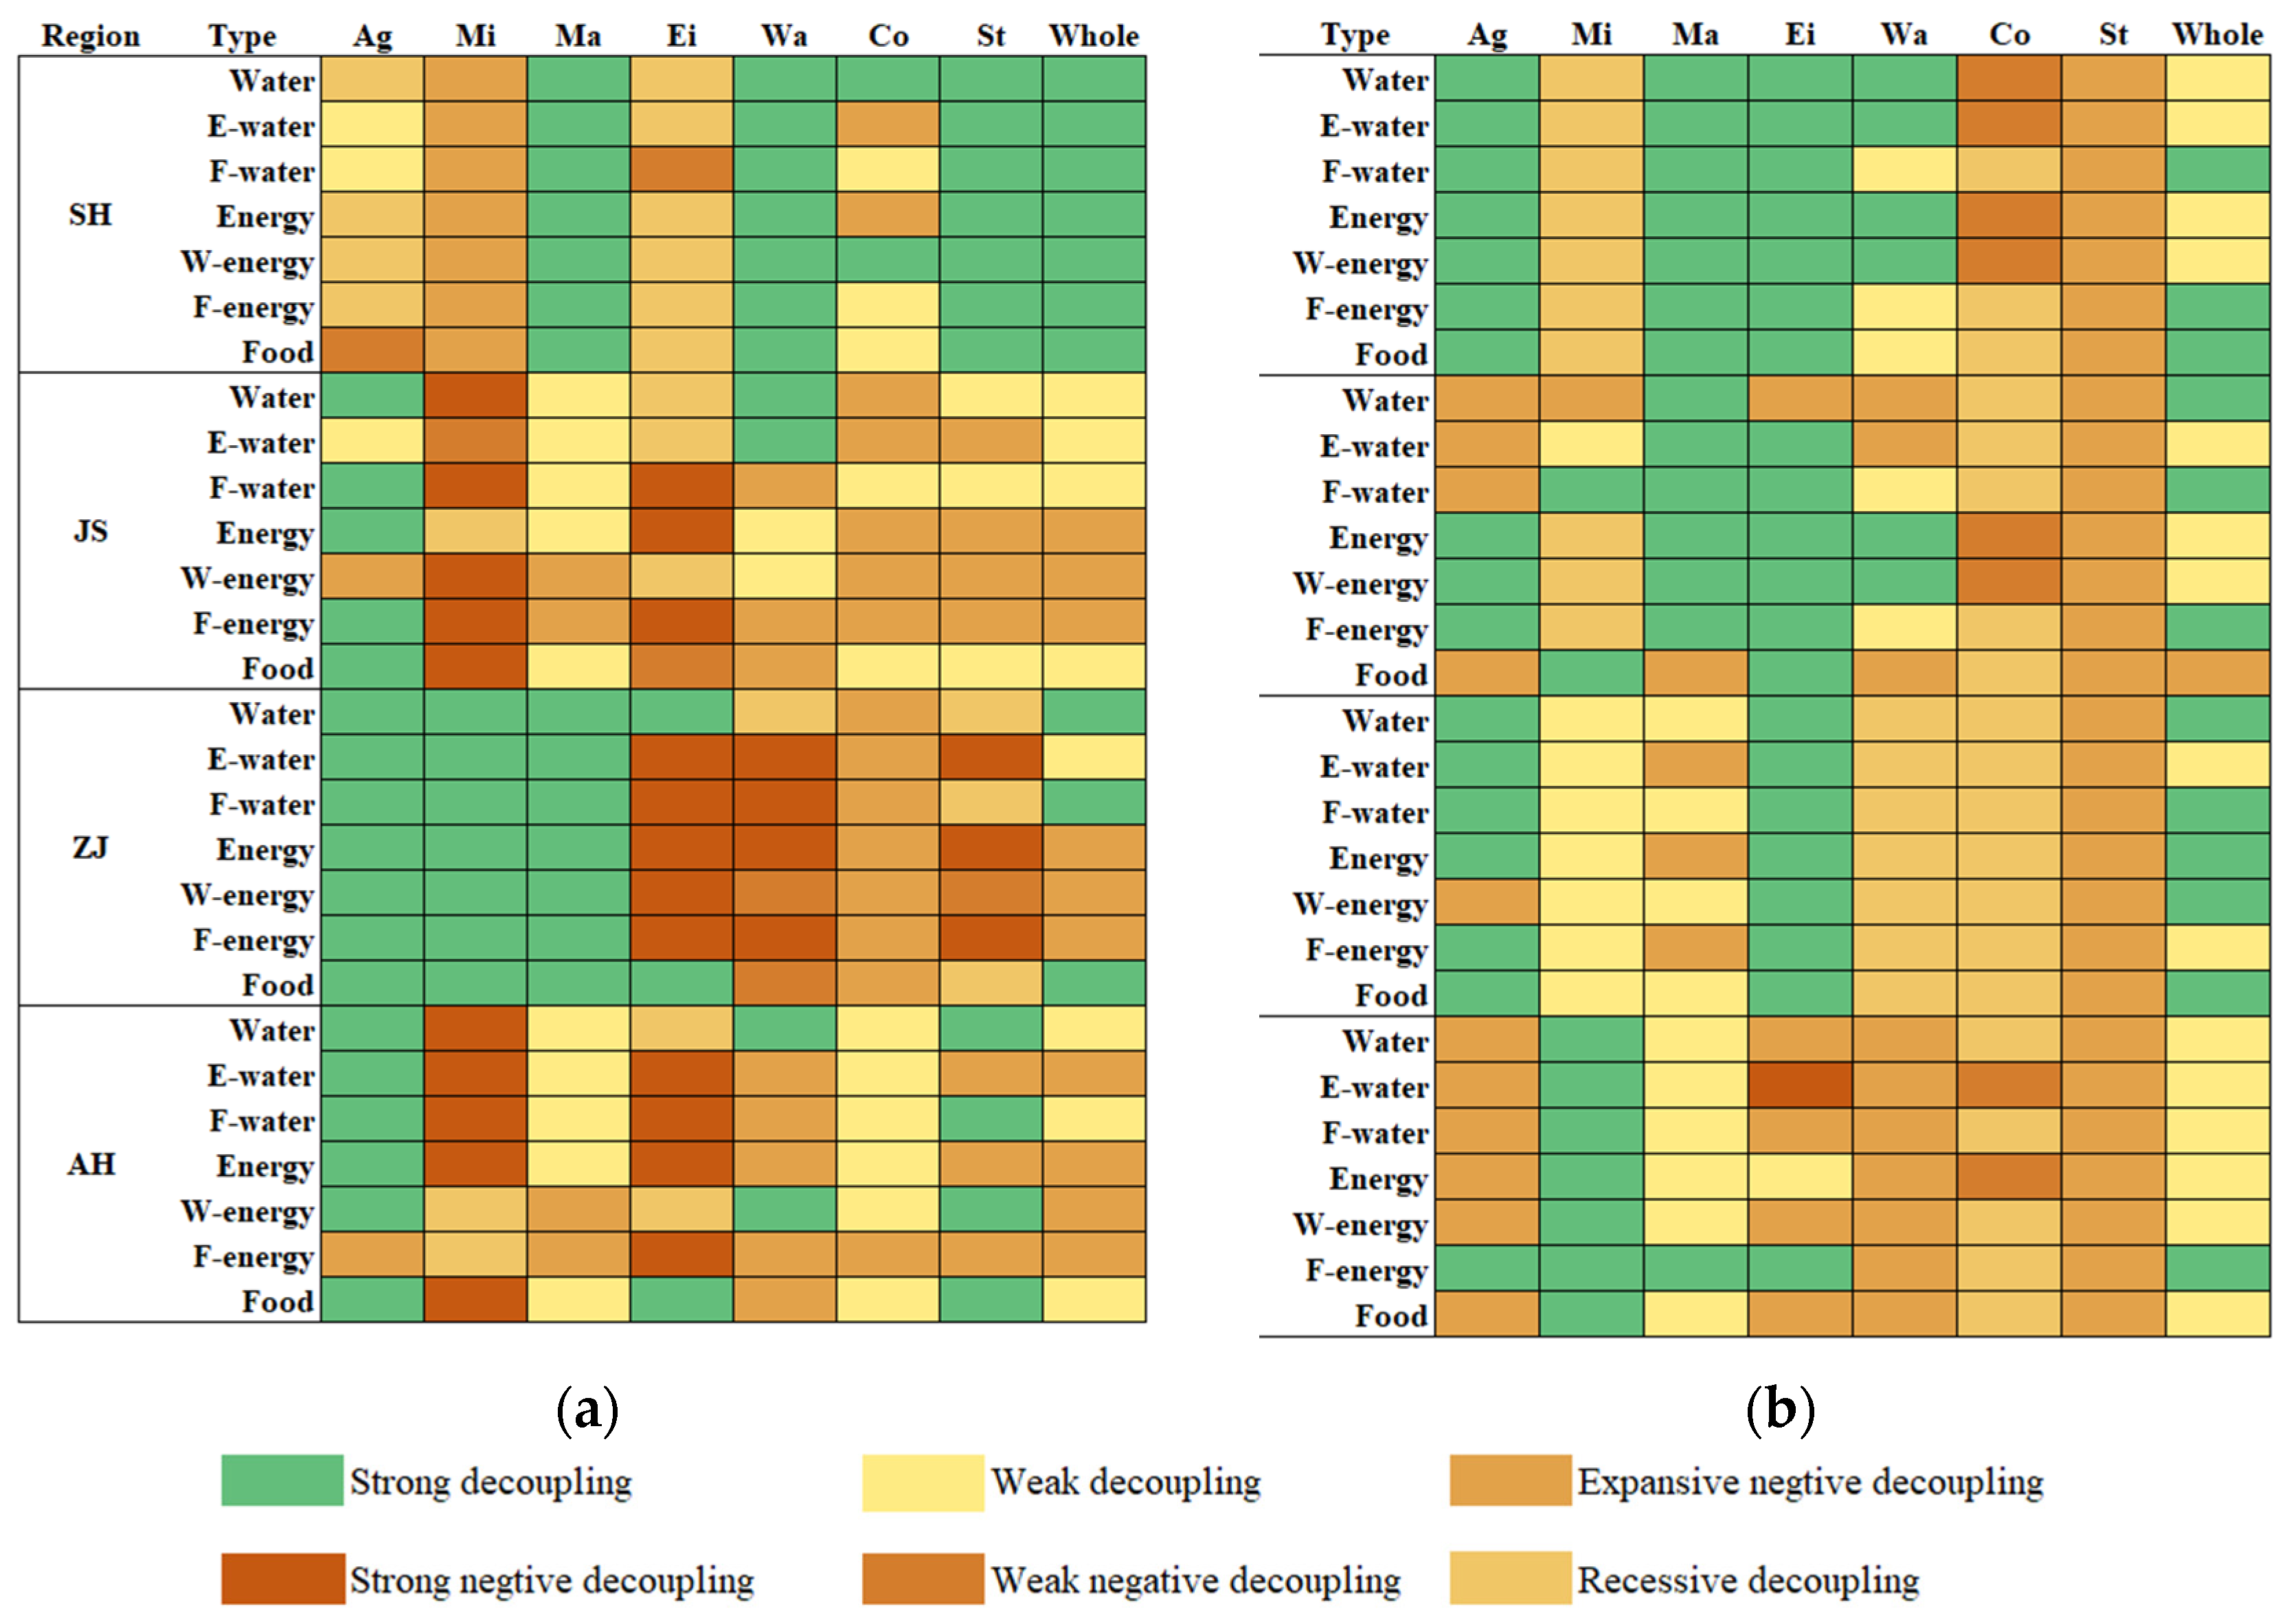
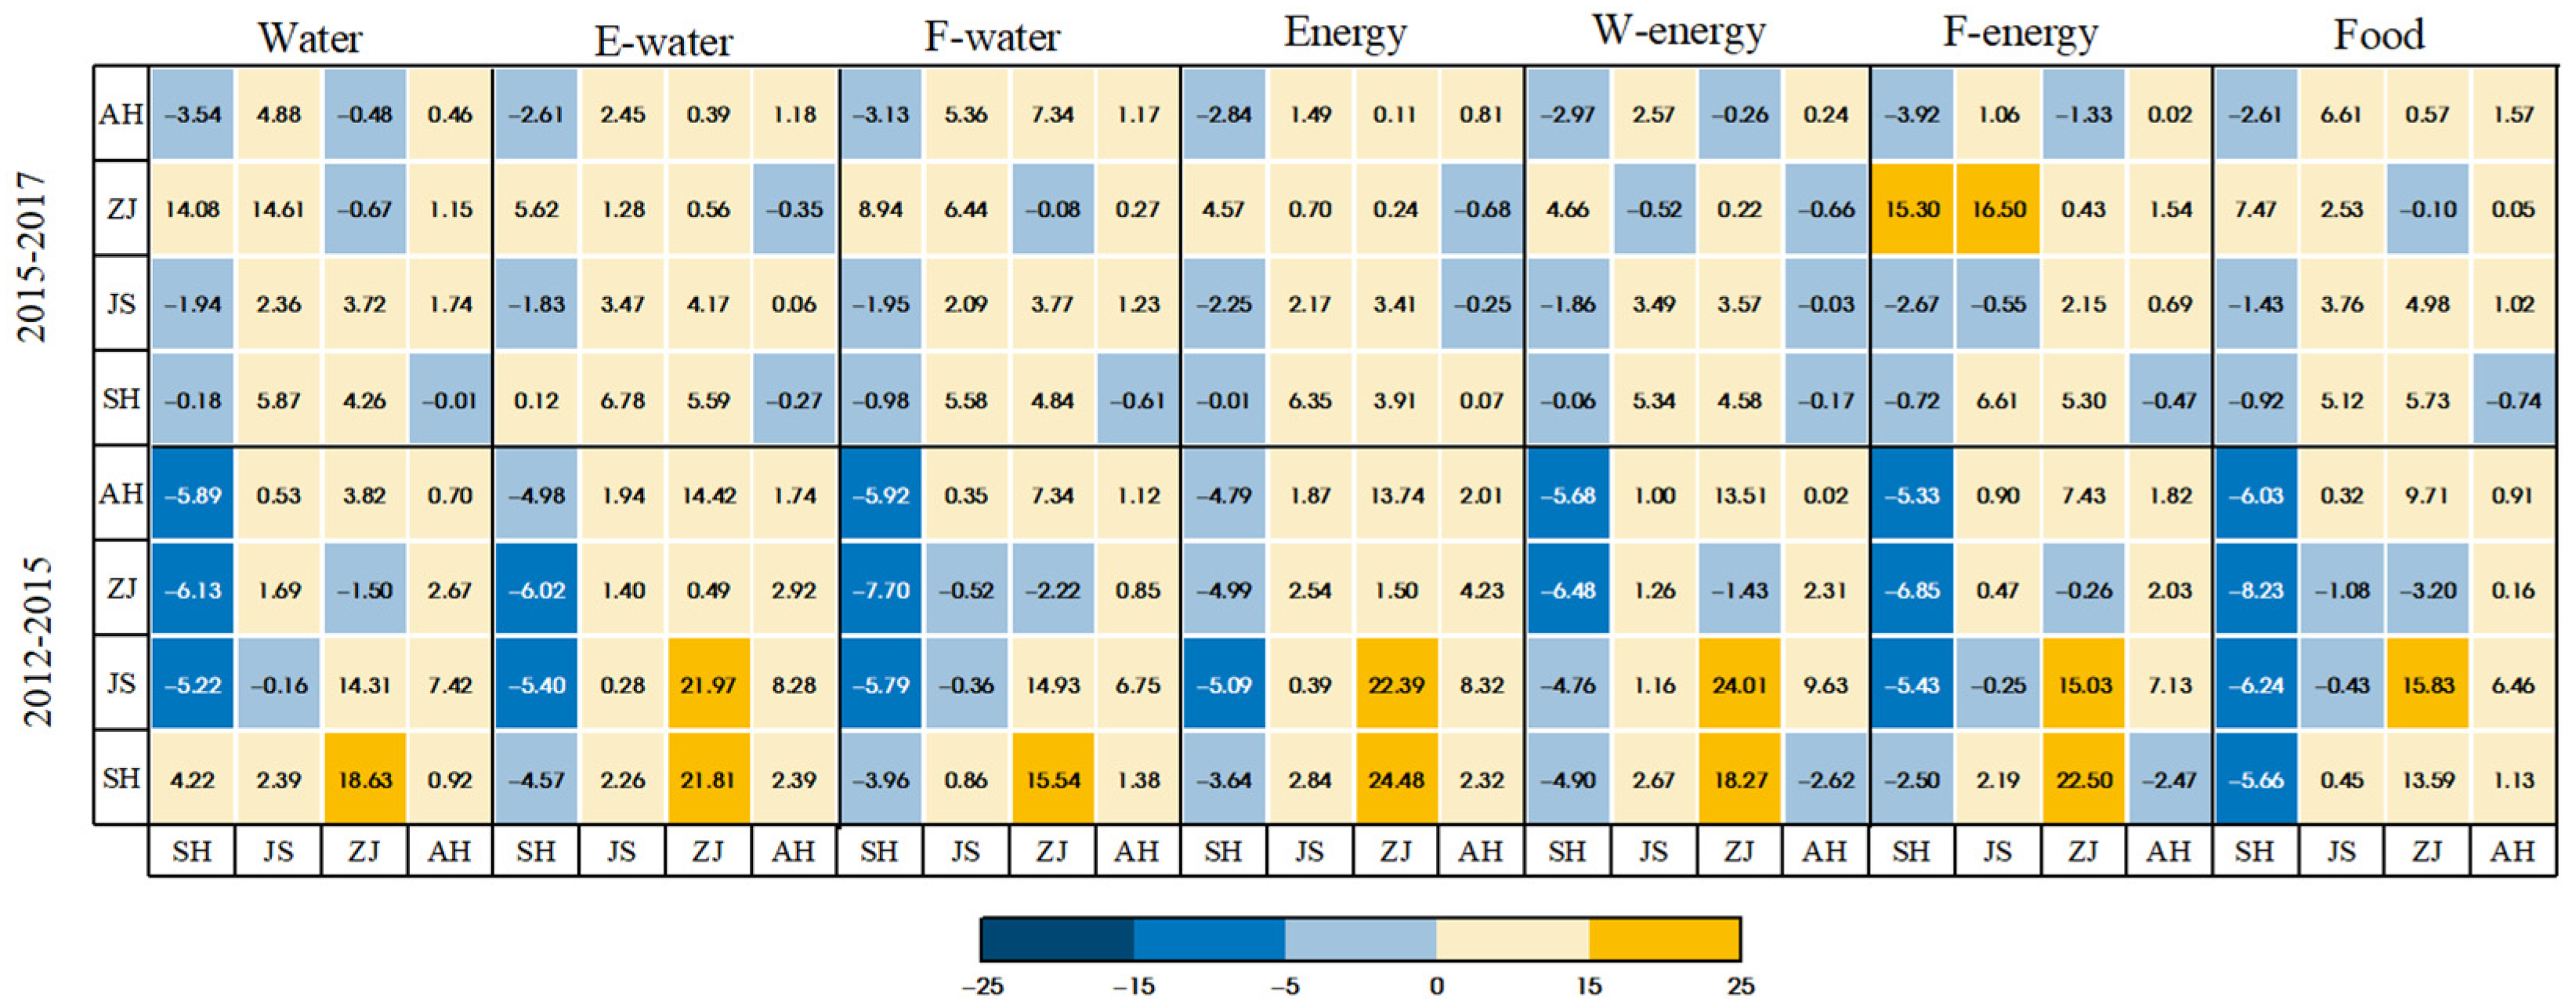
An analysis of the decoupling between WEF utilization and economic growth for different sectors can deeply reflect the sustainable use of WEF resources and assist in specific resource policy-making. Figure 6 shows the decoupling states between economic growth and WEF consumption from 2012 to 2017. In general, the decoupling state between WEF ecological footprints and GDP was manifested as weak decoupling and expansive negative decoupling in 2012–2015, while in 2015–2017 weak decoupling and strong decoupling occurred in most provinces, representing huge progress in resource utilization efficiency. From the perspective of sectors, the mining sector and the electricity and gas supply sector transformed from negative decoupling to decoupling, reflecting an overall positive decoupling performance. In contrast, the transport and service sectors went from strong decoupling and weak decoupling to expansive negative decoupling, indicating that the sector’s economic growth became more dependent on WEF utilization. Moreover, sectoral economic output in Jiangsu and Anhui’s agriculture became negatively decoupled from water consumption, indicating an increasing water demand. In terms of resource type, water ecological footprint had a higher level of decoupling than energy and food. More specifically, the decoupling of food-related water consumption from economic growth was stronger than that of energy-related water consumption. The decoupling of food-related energy consumption from economic growth was stronger than that of water-related energy consumption.
With interregional economic linkages, the embodied resources consumption in one region is usually driven by the final demand in other regions. Figure 7 explores the decoupling states between embodied WEF footprints and economic growth across regions. Overall, embodied WEF consumption in horizontal areas caused by the final demand in vertical regions was mainly negatively decoupled from its economic growth during the study period. Among the investigated regions, Shanghai’s embodied WEF consumption provided by other regions was decoupled from its economic growth. In Jiangsu, decoupling in states between embodied WEF footprints imported from other regions and their economic growth was manifested as expansive negative decoupling. As for Zhejiang and Anhui, the decoupling level dramatically improved from 2015 to 2017.

3.3. Identification of Key Driving Factors

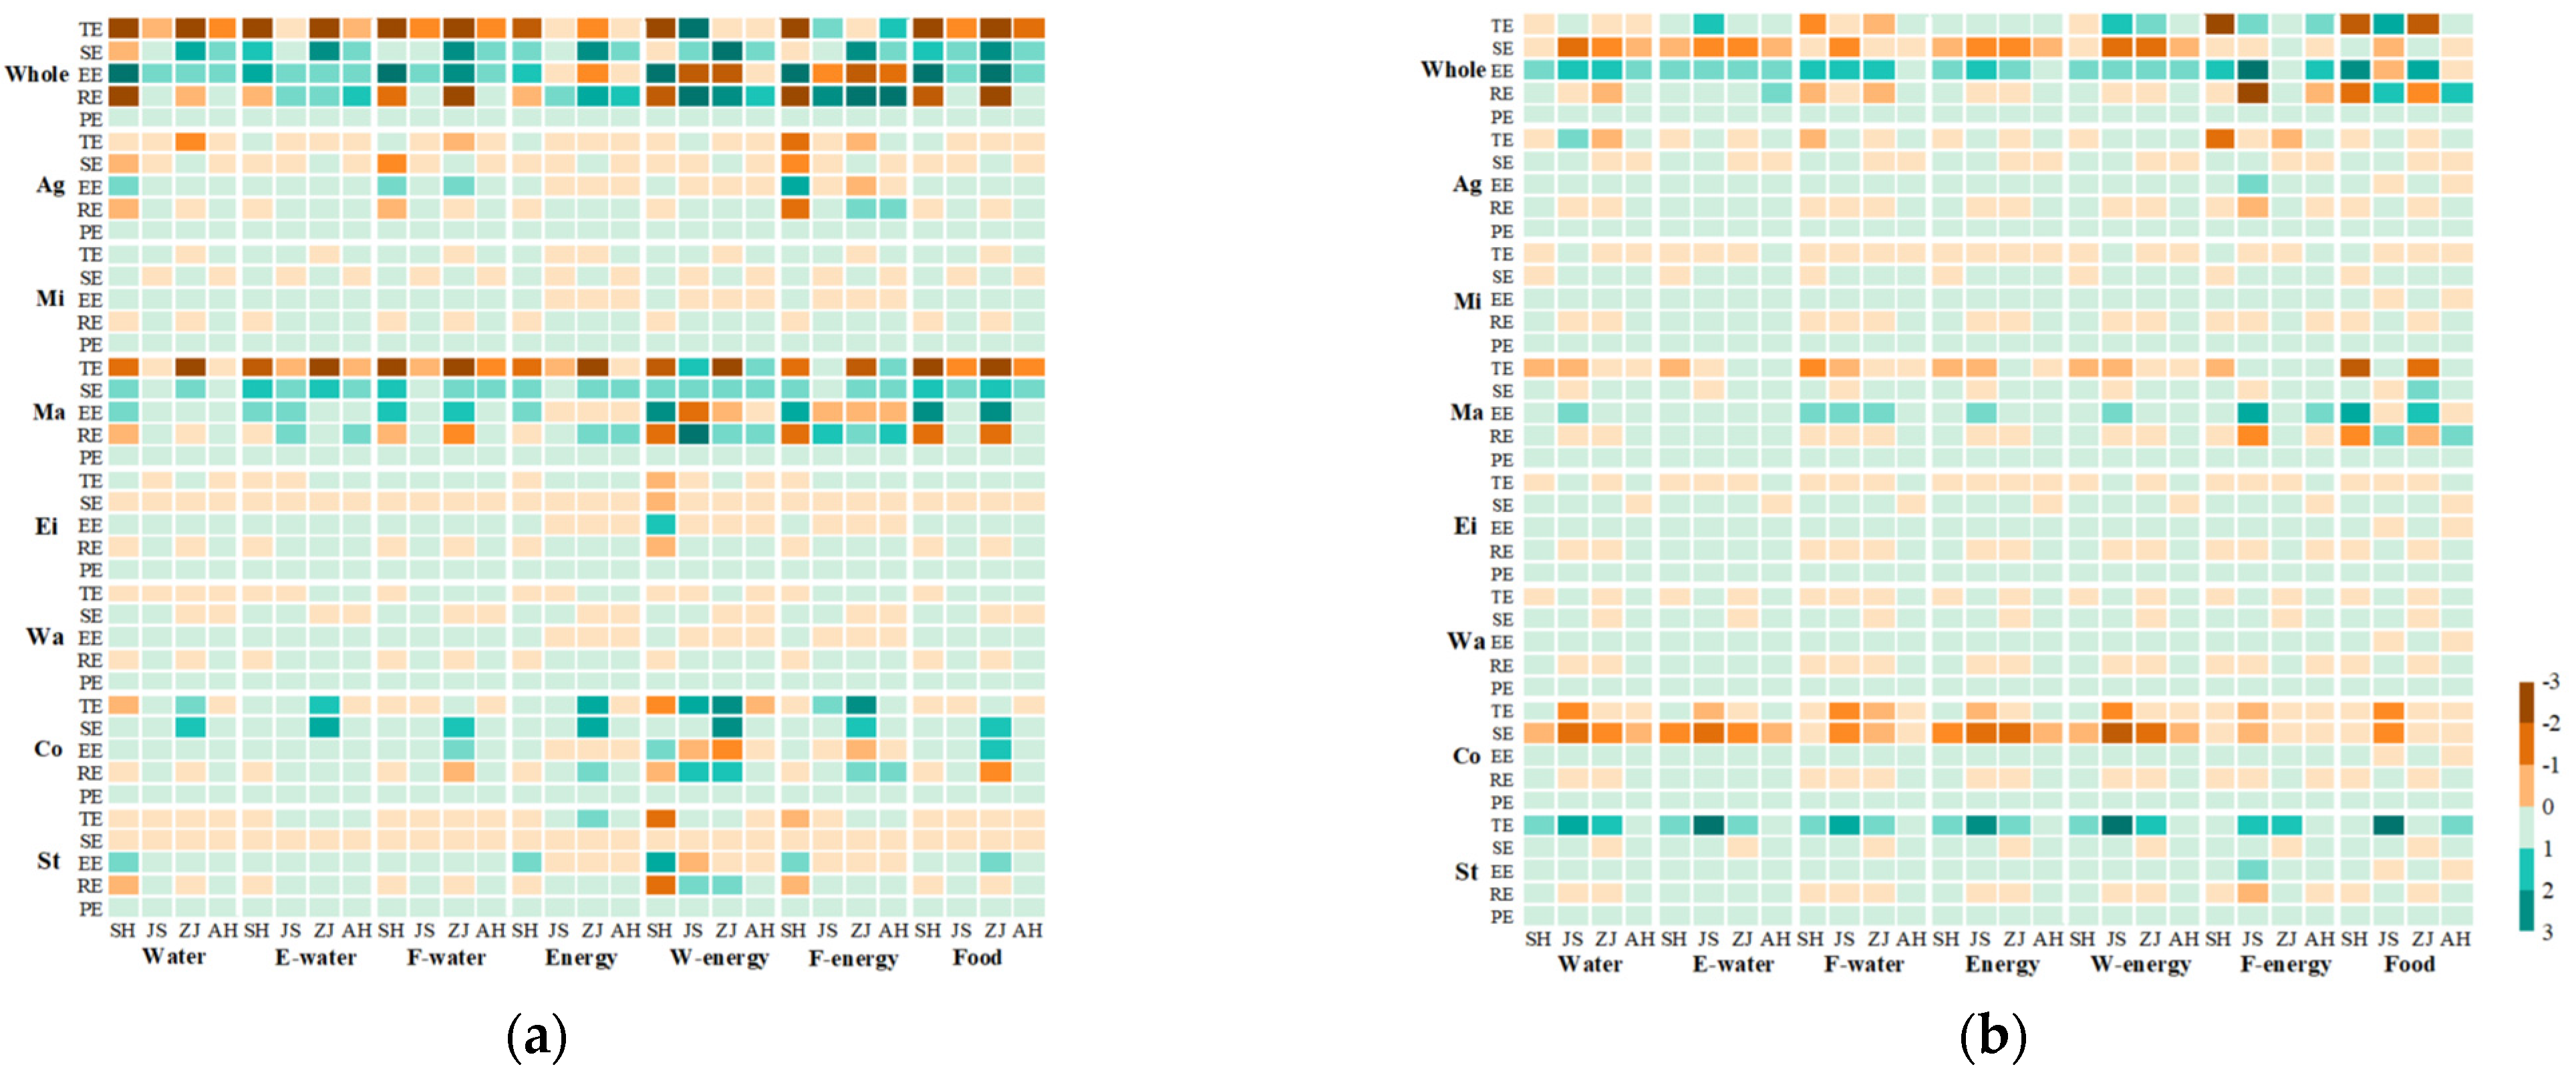
To further study the driving factors behind resource consumption, the LMDI method was adopted to fully explore the contributions of socioeconomic attributes that impact the decoupling between WEF consumption and economic growth. As illustrated in Figure 8, the impact of the driving factors was volatile from period to period. Specifically, the darker the cell, the greater the relative contribution of each effect, and the stronger the promotion effect on resource decoupling. Conversely, the greener the color, the stronger the inhibitory effect of each effect on resource decoupling.
Technology effect (TE) was the major factor in reducing WEF consumption during the first period (2012–2015), and it was highly conducive to promoting decoupling in most regions. The average annual reduction in water, energy, and food consumption in the Yangtze River Delta region was 9.32 × 10¹⁵ sej, 1.72 × 10²² sej, and 3.71 × 10²² sej, respectively. Among the provinces, Zhejiang had the best decoupling effect in terms of water and food consumption, while Shanghai contributed most to energy reduction. However, this effect was reversed and constrained decoupling during the second period (2015–2017) in most areas, with an average annual increase of 8.20 × 10¹⁴ sej, 1.59 × 10²² sej, and 2.95 × 10²¹ sej in water, energy, and food consumption, respectively. Such results indicate that technology advances can, to some degree, improve the efficiency of WEF utilization and therefore decrease WEF consumption per unit of GDP. However, benefits from technology could make resources cheaper and generate new demand, thereby gradually offsetting the impact of technology progress and creating a “rebound effect” [68].
The impact of industrial structure (SE) on resources use changed from positive to negative, which inhibited resource consumption. Specifically, the decoupling index of SE in 2015–2017 was smaller than in 2012–2015, exhibiting that the optimization of the industrial structure had suppressed embodied WEF consumption and strengthened the decoupling effect, especially in terms of energy consumption, with an average decrease of 5.83 × 10²² sej per year. This could be attributed to industrial transformation and upgrading. During the “12th Five-Year Plan” and “13th Five-Year Plan” periods, the industrial structure of the Yangtze River Delta region became reasonable. The tertiary industry continued to grow at a faster rate of 13.4%, and contributed 51.8% of GRDP growth on average. In contrast, the proportion of the first and secondary industries declined and stabilized at about 5.8% and 51.8% of GRDP, respectively. It can be seen that industrial optimization with low-resource consumption and environmentally friendly industries can be conducive to WEF resources’ reduction. At the regional level, the decoupling indexes of water, energy-related water, food-related water, and food consumption in Jiangsu were smaller than in other regions, showing a stronger driving effect. In addition, Zhejiang contributed most to energy and water-related energy savings, with an average annual reduction of 2.33 × 10²² sej and 2.48 × 10²⁰ sej. Although the industrial structure effect was not as strong as the technology effect, it was still the secondary negative factor for decreasing WEF consumption.
The impact of economic scale (EE) remained significant during the research period, which represents the economic benefit per unit of WEF consumption. Generally, rapid economic growth led to an increase in embodied water and food consumption in both periods, especially for Shanghai, which had a strong inhibitory effect on decoupling. As for energy consumption, the decoupling index of EE became larger in 2015–2017 than in 2012–2015, indicating that economic growth became more dependent on energy. At the sectoral level, the manufacturing sector significantly affected the decoupling performance during the whole period. It is worth considering that when affected by factors such as technical bottlenecks, path dependence, and excess capacity of low-end manufacturing [69], the transformation and upgrading of the manufacturing industry may become difficult, which is not conducive to resource savings and regional sustainable development.
The impact of resources-saving capacity (RE) was volatile in both periods. This effect had a greater impact on energy consumption than water and food consumption, showing that a reduction of per capita energy use has a stronger driving effect on decoupling. The impact of population scale (PE) was not significant and led to a slight increase in resource utilization, with an average contribution of 2%. Since the permanent population growth in this area dropped from 0.8% in 2012 to 0.5% in 2017, the impact of population size on WEF consumption gradually weakened. However, it was still necessary to strengthen residents’ awareness of resource conservation and public education to ensure the sustainability of resources and the environment.

4. Discussion

4.1. Differentiated Management for WEF Resources Consumption

As the results disclosed, the WEF consumption in the four regions was different and complex. In general, embodied WEF consumption in Shanghai and Zhejiang showed a decreasing trend, while Anhui had an increasing demand for WEF resources. Meanwhile, embodied WEF utilization in Jiangsu was greater than in other regions. Manufacturing, transport, and service sectors contributed a larger share in most regions and resource types. This was similar to the findings of previous studies [24,70], which found that the manufacturing industry and service sector in coastal regions required more embodied natural resources (e.g., fossil energy and biomass), and Jiangsu was the main resource utilization province due to its high fossil energy consumption. From the nexus perspective, the trend of water-related energy consumption was basically in line with water consumption, while energy and energy-related water consumption showed an inconsistent trend. The main reason can be explained through different types of energy use. For example, although energy consumption in Jiangsu declined with an annual rate of 6.23% during 2015–2017, coal use accounted for a big chunk (>57%) and witnessed an increasing consumption trend, leading to growing energy-related water utilization. In addition, the energy-related nexus (i.e., water-related energy, food-related energy) footprints contributed a meager share of total energy footprints, whereas the food-related water footprint contributed most to the total water footprints, which was largely consistent with the composition in the Greater Bay Area [10]. Also, the results of per unit GDP and per capita WEF resources’ utilization showed that economic benefits induced by WEF resources should be further improved in Anhui due to its increasing urbanization and relatively low level of economic development [5]. The gap between food-related water intensity and direct water intensity implies that less attention has been paid to the management of nexus flows than direct flows. Thus, WEF resources management needs a shift toward a nexus paradigm, which can help achieve SDGs 2, 5, and 7, which target adequate food, clean water, and green energy.

4.2. Decoupling of Embodied WEF Consumption and Economic Development

Decoupling performances reflect to what extent an economy relies on WEF resources. Traditional production-based decoupling analyses mostly neglect resource stress shift between regions and underestimate actual resource use, while consumption-based decoupling performances take into account an economy’s off-site resource use triggered by cross-regional trade [30]. Overall, the decoupling states between WEF resources and economic growth in the Yangtze River Delta region have shown a good trend (mainly from expansive negative decoupling to weak decoupling), which is partially consistent with the findings of Yuan’s study regarding China’s Beijing–Tianjin–Hebei region [71,72]. To achieve SDGs and promote all-round green transformation, the Chinese government has promulgated a series of environmental and resource policies, such as the action plan for controlling total and intensity of energy consumption (2011), the most stringent water resource management system (2012), Outlines of National Agricultural Water-Saving Program (2012), and the Environmental Protection Law of the People’s Republic of China [73,74], which have alleviated resource pressure and environmental impact to some extent [75]. However, strong decoupling has not been achieved and decoupling performance differs from region to region, and is closely related to resource endowments and economic development. Both Jiangsu and Anhui have more abundant freshwater resources and land available for use, resulting in resource advantages in making products with high WEF footprints. In 2017, the total water resources in Jiangsu and Anhui were 11 and 23 times that of Shanghai, respectively, while the aggregated arable area of these two provinces was 5 times larger than that of Shanghai and Zhejiang. In contrast, Shanghai has formed an industrial structure dominated by the service economy, and the digital economy in Zhejiang was well developed, with technology-intensive industries becoming dominant, resulting in a relatively low dependence on WEF resources. Therefore, policy adjustments and industrial upgrading have contributed to further decoupling between WEF ecological footprints pressure and economic growth.

4.3. Factors Influencing the Sustainable Development of the Yangtze River Delta Region

Concerning the decomposition results, technology effect and industrial structure played a major role in decoupling between WEF resources use and economic growth, while economic scale contributed most to the increase in WEF consumption. This is in line with some previous studies exploring the factors influencing the decoupling of water [29,76], energy [31,44], and food consumption [35]. The results showed that the industrial structure factor had a greater impact on the decoupling in 2015–2017 than in 2012–2015, especially in terms of energy consumption. This indicates that with the implementation of environmental regulations and resource policies, industrial structure has become reasonable, and the tertiary industry has gradually replaced the dominant position of the secondary industry, implying the government’s efforts to optimize the industrial layout and mitigate ecological stress. In contrast, the technology effect showed the opposite results, with a declining impact on decoupling. The main reason was that resource savings caused by technical improvement were roughly offset by the cumulative effect of other factors, such as economic scale and resource-saving capacity. Therefore, it is necessary to consider all the driving factors for the effective control of resource conservation. With a transition from quantity to quality in economic development, economic restructuring and upgrading made the economic growth rate slow down, which was conducive to resource reduction. Considering environmental carrying capacity, population overloads should be avoided in those regions with high levels of urbanization and appropriate population concentrations should be maintained [26].

5. Managerial Implications and Conclusions

5.1. Managerial Implications

Based on the results, this paper proposes some policy implications to promote sustainable WEF resources management and economic growth, as below.
(1)
According to the characteristics of WEF consumption, differentiated development strategies among provinces should be taken into account. For Jiangsu and Zhejiang, high water- and energy-intensive industries should be phased out and upgraded. Coal and other fossil fuels need to be restricted and replaced by renewable energy, especially in terms of the manufacturing sector. Since both of the two provinces are adjacent to the shore, they can benefit from coastal resources to increase their sources of water, energy, and food. For instance, sea rice cultivation could be a promising option for sustainable food demand while improving soil function and the ecological environment, which has been implemented in some parts of Jiangsu Province. Offshore wind power and tidal power could help provide clean electricity and a sustainable energy supply. For Anhui, developing advanced water techniques in agricultural production and processing should be encouraged to improve water use efficiency. For Shanghai, it is necessary to enhance public awareness of water and energy conservation, as well as food waste reduction. The government should encourage sustainable consumption behavior, green purchasing, and frugal habits by way of organizing regular popularization and publicity activities.
(2)
The transport and service sectors exhibit non-ideal decoupling states in the Yangtze River Delta. Therefore, it is necessary to promote green transport systems and clean energy vehicles. Furthermore, shifting from a traditional service industry (i.e., catering and hotel) to a modern service industry could decrease resource ecological footprints. Furthermore, due to interregional trade, decoupling in one region may be achieved at the cost of negative decoupling in other regions, leading to environmental burdens and social inequality. Therefore, a comprehensive policy synergistic mechanism should be established to enhance cooperation and communication between industrial sectors and regions. Through economic instruments such as finance, taxation, and pricing policy, sustainable production and consumption can be achieved by reducing products embodied with high water and energy footprints.
(3)
Reducing the intensity of WEF consumption and promoting industrial upgrades are the main factors that promote decoupling resource use from economic development. Thus, it is necessary to develop resource-saving technologies and accelerate the industrial transformation from traditional-based industries to advanced manufacturing and modern services, thereby promoting green and sustainable development. Sprinkler irrigation and low-pressure pipeline water transfer techniques can be aggressively promoted in agriculture, whereas wastewater treatment and carbon capture and storage technology contribute to sustainable production. Meanwhile, efforts should be made to optimize and upgrade the urban industrial structure, moving from resource-intensive to high value-added and environmentally friendly industries.
In the context of China’s economy, which is transitioning from a high-speed growth stage to a high-quality development stage, it is of great significance to decouple WEF consumption from economic growth. On the production side, developing resource-saving technologies and accelerating industrial upgrading could contribute to a low-carbon economy and high-quality development. On the consumption side, it is necessary to raise public awareness of resource conservation and encourage sustainable ways of living.

5.2. Conclusions

In this study, we proposed a unified assessment framework for inventorying WEF nexus consumption based on MRIO analysis and emergy accounting in the Yangtze River Delta region from 2012 to 2017. Both the Tapio analysis and the LMDI method were applied to uncover decoupling states and identify driving factors. The results of this research can provide empirical support for urban resources management in the future to ensure balanced and sustainable economic development. Specific conclusions are as follows.
(1)
The total WEF consumption in the Yangtze River Delta had an overall downward trend from 2012 to 2017. However, the performance of WEF utilization varied significantly in different provinces, showing spatial heterogeneity. Jiangsu accounted for the largest proportion of water, energy, and the corresponding nexus consumption, while Anhui contributed most to the food and food-related water footprints. The manufacturing sector was the most active in all types of WEF consumption, and can therefore be the critical point, with high dependence on WEF resources and environmental supports. In terms of resource type, energy consumption had a greater environmental impact due to its high emergy contents. In addition, Jiangsu’s per unit GDP energy use was larger than other regions, while per capita food consumption was high in Anhui.
(2)
The decoupling performance in the Yangtze River Delta region improved during 2012–2017, showing a general trend of “weak decoupling, strong decoupling” in most provinces. In terms of sector decoupling, the mining sector and the electricity and gas supply sector contributed most to the improvement of decoupling performance, while the transport and service sector weakened the decoupling. From the interregional trade perspective, the coupling state was strengthened between Shanghai and Zhejiang, while Anhui had less reliance on other regions, indicating its self-supply ability for WEF resources. Jiangsu’s WEF resources imported from other regions were negatively decoupled from its economy.
(3)
The technology effect has a major positive effect on the realization of decoupling in the Yangtze River Delta region, especially for manufacturing and agricultural sectors. The inhibitory effect of industrial structure on WEF consumption in most regions was strengthened during the 13th Five-Year Plan period. Moreover, economic output and population scale were the main factors restraining the occurrence of decoupling. The effect of resources-saving capacity was volatile and varied significantly across regions, indicating considerable room for improvement in the future. The difference in these factors could be attributed to unbalanced resource endowment and economic development.
In this study, the MRIO model and emergy accounting were creatively combined to provide a unified base for embodied WEF resources calculation. In addition, consumption-based decoupling analysis could take both direct and indirect resource use into account, thereby reflecting the actual WEF consumption of the investigated regions. However, some limitations remain to be solved in future research. First, we merged the forty-two economic sectors into seven large components, which may not fully reveal the differences among the industries and their WEF flow processes. A more detailed analysis would be possible to minimize the potential errors associated with sector aggregation. Second, studying changes between two periods cannot fully reflect the decoupling relationship among the regions and sectors; it is necessary to extend the research period to cover a much longer time span as more data become available.

Author Contributions

Methodology, Y.H.; formal analysis, Y.H. and D.H.; data curation, Y.H.; writing—original draft preparation, Y.H.; writing—review and editing, D.H.; funding acquisition, D.H. All authors have read and agreed to the published version of the manuscript.

Funding

This research was funded by the National Social Science Foundation of China, grant number 19ZDA084.

Institutional Review Board Statement

Not applicable.

Informed Consent Statement

Not applicable.

Data Availability Statement

The dataset was sourced from the statistical yearbooks of China’s provinces and cities, the China environmental statistics yearbook, China’s Energy Statistical Yearbook, the China Agriculture Yearbook, and statistical documents of water conservancy departments among provinces and cities in China. Detailed data used to support the findings of this study are available from the corresponding author upon request.

Conflicts of Interest

The authors declare no conflict of interest.

References

  1. Zhang, Z.; Liu, J.; Wang, K.; Tian, Z.; Zhao, D. A review and discussion on the water-food-energy nexus: Bibliometric analysis. Chin. Sci. Bull. 2020, 65, 1569–1580. [Google Scholar] [CrossRef]
  2. Hoff, H. Understanding the Nexus. In Proceedings of the Bonn 2011 Conference: The Water, Energy and Food Security Nexus, Stockholm, Sweden, 16–18 November 2011. [Google Scholar]
  3. United Nations. Report of the World Commission on Environment and Development: Our Common Future. In Proceedings of the United Nations Sustainable Development Summit, New York, NY, USA, 25–27 September 2015. [Google Scholar]
  4. Brears, R.C. The Green Economy and the Water-Energy-Food Nexus; Palgrave Macmillan: London, UK, 2018; ISBN 978-1-137-58364-2. [Google Scholar]
  5. Zhang, Z.; Sun, S.; Gao, J. Evolution characteristic and influencing mechanism of water-energy-food stress in Yangtze River Delta Urban Agglomeration. J. Nat. Resour. 2022, 37, 1586. [Google Scholar] [CrossRef]
  6. National Bureau of Statistics. China Statistical Yearbook; China Statistics Press: Beijing, China, 2021; ISBN 978-7-5037-9950-1.
  7. Ye, C.; Zhu, J.; Li, S.; Yang, S.; Chen, M. Assessment and Analysis of Regional Economic Collaborative development within an Urban Agglomeration: Yangtze River Delta as a Case Study. Habitat Int. 2019, 83, 20. [Google Scholar] [CrossRef]
  8. Owen, A.; Scott, K.; Barrett, J. Identifying Critical Supply Chains and Final Products: An Input-Output Approach Exploring the Energy-Water-Food Nexus. Appl. Energy 2018, 210, 632–642. [Google Scholar] [CrossRef]
  9. White, D.J.; Hubacek, K.; Feng, K.; Sun, L.; Meng, B. The Water-Energy-Food Nexus in East Asia: A Tele-connected Value Chain Analysis Using Inter-Regional Input-Output Analysis. Appl. Energy 2018, 210, 550–567. [Google Scholar] [CrossRef] [Green Version]
  10. Zhang, P.; Cai, Y.; Zhou, Y.; Tan, Q.; Li, B.; Li, B.; Jia, Q.; Yang, Z. Quantifying the Water-Energy-Food Nexus in Guangdong, Hong Kong, and Macao Regions. Sustain. Prod. Consum. 2022, 29, 188–200. [Google Scholar] [CrossRef]
  11. Lin, J.; Hu, Y.; Zhao, X.; Shi, L.; Kang, J. Developing a City-Centric Global Multiregional Input-Output Model (CG-MRIO) to Evaluate Urban Carbon Footprints. Energy Policy 2017, 108, 460–466. [Google Scholar] [CrossRef]
  12. Zhang, Y.; Zheng, H.; Yang, Z.; Su, M.; Liu, G.; Li, Y. Multi-Regional Input–Output Model and Ecological Network Analysis for Regional Embodied Energy Accounting in China. Energy Policy 2015, 86, 651–663. [Google Scholar] [CrossRef]
  13. Liu, Y.; Hu, Y.; Su, M.; Meng, F.; Dang, Z.; Lu, G. Multiregional Input-Output Analysis for Energy-Water Nexus: Case Study of Pearl River Delta Urban Agglomeration. J. Clean. Prod. 2020, 262, 121255. [Google Scholar] [CrossRef]
  14. Meng, F.; Wang, D.; Meng, X.; Li, H.; Liu, G.; Yuan, Q.; Hu, Y.; Zhang, Y. Mapping Urban Energy–Water–Land Nexus within a Multiscale Economy: A Case Study of Four Megacities in China. Energy 2022, 239, 122038. [Google Scholar] [CrossRef]
  15. Wang, X.-C.; Klemeš, J.J.; Ouyang, X.; Xu, Z.; Fan, W.; Wei, H.; Song, W. Regional Embodied Water-Energy-Carbon Efficiency of China. Energy 2021, 224, 120159. [Google Scholar] [CrossRef]
  16. Yang, J.; Chen, B. Energy–Water Nexus of Wind Power Generation Systems. Appl. Energy 2016, 169, 1–13. [Google Scholar] [CrossRef]
  17. Zhang, J.; Li, C. Trade-off between Human Health and Environmental Health in Global Diets. Resour. Conserv. Recycl. 2022, 182, 106336. [Google Scholar] [CrossRef]
  18. Zhao, S.; Li, Z.; Li, W. A Modified Method of Ecological Footprint Calculation and Its Application. Ecol. Model. 2005, 185, 65–75. [Google Scholar] [CrossRef]
  19. Jawad, H.; Jaber, M.Y.; Bonney, M. The Economic Order Quantity Model Revisited: An Extended Exergy Accounting Approach. J. Clean. Prod. 2015, 105, 64–73. [Google Scholar] [CrossRef]
  20. Apaiah, R.K.; Linnemann, A.R.; Van Der Kooi, H.J. Exergy Analysis: A Tool to Study the Sustainability of Food Supply Chains. Food Res. Int. 2006, 39, 1–11. [Google Scholar] [CrossRef]
  21. Zhang, G.; Long, W. A Key Review on Emergy Analysis and Assessment of Biomass Resources for a Sustainable Future. Energy Policy 2010, 38, 2948–2955. [Google Scholar] [CrossRef]
  22. Siche, R.; Pereira, L.; Agostinho, F.; Ortega, E. Convergence of Ecological Footprint and Emergy Analysis as a Sustainability Indicator of Countries: Peru as Case Study. Commun. Nonlinear Sci. Numer. Simul. 2010, 15, 3182–3192. [Google Scholar] [CrossRef]
  23. Ukidwe, N.U.; Bakshi, B.R. Thermodynamic Accounting of Ecosystem Contribution to Economic Sectors with Application to 1992 U.S. Economy. Environ. Sci. Technol. 2004, 38, 4810–4827. [Google Scholar] [CrossRef]
  24. Zhuang, M.; Gao, Z.; Geng, Y.; Xiao, S. Spatial Distribution Pattern of Embodied Natural Resources Use in China and Its Relationship with Socioeconomic Development: From an Exergetic Perspective. Resources Policy 2022, 79, 103090. [Google Scholar] [CrossRef]
  25. Wang, S.; Cao, T.; Chen, B. Urban Energy–Water Nexus Based on Modified Input–Output Analysis. Appl. Energy 2017, 196, 208–217. [Google Scholar] [CrossRef]
  26. Zhang, Y.; Sun, M.; Yang, R.; Li, X.; Zhang, L.; Li, M. Decoupling Water Environment Pressures from Economic Growth in the Yangtze River Economic Belt, China. Ecol. Indic. 2021, 122, 107314. [Google Scholar] [CrossRef]
  27. Kong, Y.; He, W.; Yuan, L.; Shen, J.; An, M.; Degefu, D.M.; Gao, X.; Zhang, Z.; Sun, F.; Wan, Z. Decoupling Analysis Water Footprint and Economic Growth: A Case Study of Beijing–Tianjin–Hebei Region from 2004 to 2017. Int. J. Environ. Res. Public Health 2019, 16, 4873. [Google Scholar] [CrossRef] [Green Version]
  28. Kong, Y.; He, W.; Yuan, L.; Zhang, Z.; Gao, X.; Zhao, Y.; Mulugeta, D.D. Decoupling Economic Growth from Water Consumption in the Yangtze River Economic Belt, China. Ecol. Indic. 2021, 123, 107344. [Google Scholar] [CrossRef]
  29. Lu, N.; Zhu, J.; Tang, Z.; Zhang, J.; Chi, H. Decreasing Water Dependency for Economic Growth in Water-Scarce Regions by Focusing on Water Footprint and Physical Water: A Case Study of Xi’an, China. Sustain. Cities Soc. 2022, 85, 104092. [Google Scholar] [CrossRef]
  30. Kan, S.; Chen, B.; Chen, G. Worldwide Energy Use across Global Supply Chains: Decoupled from Economic growth? Appl. Energy 2019, 250, 1235–1245. [Google Scholar] [CrossRef]
  31. Zhang, Y.-J.; Da, Y.-B. The Decomposition of Energy-Related Carbon Emission and Its Decoupling with Economic Growth in China. Renew. Sustain. Energy Rev. 2015, 41, 1255–1266. [Google Scholar] [CrossRef]
  32. Shuai, C.; Chen, X.; Wu, Y.; Zhang, Y.; Tan, Y. A Three-Step Strategy for Decoupling Economic Growth from Carbon Emission: Empirical Evidences from 133 Countries. Sci. Total Environ. 2019, 646, 524–543. [Google Scholar] [CrossRef]
  33. Rao, G.; Liao, J.; Zhu, Y.; Guo, L. Decoupling of Economic Growth from CO2 Emissions in Yangtze River Economic Belt Sectors: A Sectoral Correlation Effects Perspective. Appl. Energy 2022, 307, 118223. [Google Scholar] [CrossRef]
  34. Zhang, S.; Li, Y.; Liu, Z.; Kou, X.; Zheng, W. Towards a Decoupling between Economic Expansion and Carbon Dioxide Emissions of the Transport Sector in the Yellow River Basin. Sustainability 2023, 15, 4152. [Google Scholar] [CrossRef]
  35. Wang, L.; Dai, S.; Wang, C. On the Change and Effect of Urbanization on the Ecological Footprint of Residents’ Food Consumption in China. J. Guangdong Univ. Financ. Econ. 2021, 36, 77–92. [Google Scholar]
  36. Cao, W.; Sun, C.; Yang, X.; Cui, Y. Analysis of man-land relationship in Changshan Archipelago based on emergy Ecological footprint. Acta Ecol. Sin. 2020, 40, 89–99. [Google Scholar] [CrossRef]
  37. Sun, C.; Liu, S. Analysis of regional differences and driving factors on the ecological footprint of urban food consumption in China. Yellow River 2017, 39, 39–45+50. [Google Scholar]
  38. Anser, M.K.; Yousaf, Z.; Usman, B.; Nassani, A.A.; Qazi Abro, M.M.; Zaman, K. Management of Water, Energy, and Food Resources: Go for Green Policies. J. Clean. Prod. 2020, 251, 119662. [Google Scholar] [CrossRef]
  39. Ma, H.; Li, Q.; Pang, Q. Spatial Difference and Decoupling Analysis of Industrial Energy-water Consumption Coefficients in China. China Popul. Resour. Environ. 2019, 29, 62–70. [Google Scholar]
  40. Wang, Y.; Song, J.; Sun, H. Coupling Interactions and Spatial Equilibrium Analysis of Water-Energy-Food in the Yellow River Basin, China. Sustain. Cities Soc. 2023, 88, 104293. [Google Scholar] [CrossRef]
  41. Gao, T.; Yang, X. A Study on the Decoupling Relationship between Grain and Energy Water Footprint Pressure and Green Development in the Yellow River Basin. Water Sav. Irrig. 2021, 10, 24–29+35. [Google Scholar]
  42. Wang, Q.; Wang, S. Decoupling Economic Growth from Carbon Emissions Growth in the United States: The Role Research and Development. J. Clean. Prod. 2019, 234, 702–713. [Google Scholar] [CrossRef]
  43. Zhu, S.; Ding, Y.; Pan, R.; Ding, A. Analysis of Interprovincial Differences in CO2 Emissions and Peak Prediction the Yangtze River Delta. Sustainability 2023, 15, 6474. [Google Scholar] [CrossRef]
  44. Zhao, X.; Zhang, X.; Li, N.; Shao, S.; Geng, Y. Decoupling Economic Growth from Carbon Dioxide Emissions in China: A Sectoral Factor Decomposition Analysis. J. Clean. Prod. 2017, 142, 3500–3516. [Google Scholar] [CrossRef]
  45. Zha, J.; Dai, J.; Ma, S.; Chen, Y.; Wang, X. How to Decouple Tourism Growth from Carbon Emissions? A Case Study of Chengdu, China. Tour. Manag. Perspect. 2021, 39, 100849. [Google Scholar] [CrossRef]
  46. Yu, J.; Wang, Y.; Yu, F.; Luo, J.; Lai, W. Decoupling between resources and environment and economic growth in Fujian Province, China from the perspective of “water-energy-carbon” consumption. Chin. J. Appl. Ecol. 2021, 32, 3845–3855. [Google Scholar] [CrossRef]
  47. Chen, S.; Chen, B. Urban Energy–Water Nexus: A Network Perspective. Appl. Energy 2016, 184, 905–914. [Google Scholar] [CrossRef]
  48. Chen, S.; Chen, B. Urban Energy Consumption: Different Insights from Energy Flow Analysis, Input–Output analysis and Ecological Network Analysis. Appl. Energy 2015, 138, 99–107. [Google Scholar] [CrossRef]
  49. Xiang, X.; Jia, S. Estimation and trend analysis of water demand of energy industry in China. J. Nat. Resour. 2016, 31, 114–123. [Google Scholar]
  50. Steen, O.K.; Weinzettel, J.; Cranston, G.; Ercin, A.E.; Hertwich, E.G. Carbon, Land, and Water Footprint Accounts for the European Union: Consumption, Production, and Displacements through International Trade. Environ. Technol. 2012, 46, 10883–10891. [Google Scholar] [CrossRef]
  51. Wang, S.; Chen, B. Energy–Water Nexus of Urban Agglomeration Based on Multiregional Input–Output Tables and Ecological Network Analysis: A Case Study of the Beijing–Tianjin–Hebei Region. Appl. Energy 2016, 178, 773–783. [Google Scholar] [CrossRef]
  52. Zhang, P.; Zhou, Y.; Xie, Y.; Wang, Y.; Li, B.; Li, B.; Jia, Q.; Yang, Z.; Cai, Y. Assessment of the Water-Energy-Food nexus under Spatial and Social Complexities: A Case Study of Guangdong-Hong Kong-Macao. J. Environ. Manag. 2021, 299, 113664. [Google Scholar] [CrossRef]
  53. Chen, P.-C.; Alvarado, V.; Hsu, S.-C. Water Energy Nexus in City and Hinterlands: Multi-Regional Physical Input-output Analysis for Hong Kong and South China. Appl. Energy 2018, 225, 986–997. [Google Scholar] [CrossRef]
  54. Chen, S.; Tan, Y.; Liu, Z. Direct and Embodied Energy-Water-Carbon Nexus at an Inter-Regional Scale. Appl. Energy 2019, 251, 113401. [Google Scholar] [CrossRef]
  55. Ewing, B.R.; Hawkins, T.R.; Wiedmann, T.O.; Galli, A.; Ertug, E.A.; Weinzettel, J.; Steen, O.K. Integrating Ecological and Water Footprint Accounting in a Multi-Regional Input–Output Framework. Ecol. Indic. 2012, 23, 8. [Google Scholar] [CrossRef] [Green Version]
  56. Hau, J.L.; Bakshi, B.R. Expanding Exergy Analysis to Account for Ecosystem Products and Services. Environ. Sci. Technol. 2004, 38, 3768–3777. [Google Scholar] [CrossRef]
  57. OECD. Sustainable Development: Indicators to Measure Decoupling of Environmental Pressure from Economic Growth; OECD: Paris, France, 2002. [Google Scholar]
  58. Tapio, P. Towards a Theory of Decoupling: Degrees of Decoupling in the EU and the Case of Road Traffic in Finland between 1970 and 2001. Transp. Policy 2005, 12, 137–151. [Google Scholar] [CrossRef] [Green Version]
  59. Song, Y.; Zhang, M.; Zhou, M. Study on the Decoupling Relationship between CO2 Emissions and Economic Development Based on Two-Dimensional Decoupling Theory: A Case between China and the United States. Ecol. Indic. 2019, 102, 230–236. [Google Scholar] [CrossRef]
  60. Jiangsu Province Water Resources Bulletin. Available online: http://jswater.jiangsu.gov.cn/col/col84437/index.html (accessed on 19 July 2022).
  61. Shanghai Water Resources Bulletin. Available online: http://swj.sh.gov.cn/szy (accessed on 19 July 2022).
  62. Zhejiang Water Resources Bulletin. Available online: http://slt.zj.gov.cn/col/col1229243017/index.html (accessed on 20 July 2022).
  63. Anhui Water Resources Bulletin. Available online: http://slt.ah.gov.cn/tsdw/swj/szyshjjcypj/119406621.html (accessed on 20 July 2022).
  64. National Bureau of Statistics, Ministry of Ecology and Environment. China Statistical Yearbook on Environment; China Statistics Press: Beijing, China, 2021; ISBN 978–752–300–075–5.
  65. Department of Energy Statistics. China’s Energy Statistical Yearbook; China Statistics Press: Beijing, China, 2017; ISBN 978–752–300–106–6.
  66. Ministry of Agriculture. China Agriculture Yearbook; China Agriculture Press: Beijing, China, 2017; ISBN 978-096-551-021-9.
  67. Lan, S.; Qin, P.; Lu, H. Emergy Analysis of Ecological Economic System; Chemical Industry Press: Beijing, China, 2002; ISBN 7-5025-3835-6. [Google Scholar]
  68. Berkhout, P.H.G.; Muskens, J.C.; Velthuijsen, J.W. Defining the Rebound Effect. Energy Policy 2000, 28, 425–432. [Google Scholar] [CrossRef]
  69. Chen, C.; Cheng, C. Research on the New Path of Transformation and Upgrading of Domestic Manufacturing Industry Led by Yangtze River Delta under the New Development Pattern. J. Soochow Univ. 2023, 44, 10–19. [Google Scholar] [CrossRef]
  70. Fang, D.; Chen, B. Linkage Analysis for Water-Carbon Nexus in China. Appl. Energy 2018, 225, 682–695. [Google Scholar] [CrossRef]
  71. Yun, Q.; He, T. Research on the decoupling synergy relationship between economy, resources and environment Beijing-Tianjin-Hebei region. Stat. Decis. Mak. 2020, 36, 79–83. [Google Scholar] [CrossRef]
  72. Wang, J.; Liu, T.; Wu, C. Study on the decoupling relationship between water resources utilization and economic development in the water-energy-food system: A case study of Hebei Province. Water Sav. Irrig. 2022, 11, 26–33. [Google Scholar]
  73. Outline of the 12th Five-Year Plan for the National Economic and Social Development of the P.R.C. Available online: https://www.gov.cn/2011lh/sewgh.htm (accessed on 25 July 2022).
  74. Outline of the 13th Five-Year Plan for the National Economic and Social Development of the P.R.C. Available online: https://www.gov.cn/xinwen/2016-03/17/content_5054992.htm?url_type=39&object_type=webpage&pos=1 (accessed on 25 July 2022).
  75. Peng, Q.; He, W.; Kong, Y.; Yuan, L.; Degefu, D.M.; An, M.; Zeng, Y. Identifying the Decoupling Pathways of Water Resource Liability and Economic Growth: A Case Study of the Yangtze River Economic Belt, China. Environ. Sci. Lut. Res. 2022, 29, 55775–55789. [Google Scholar] [CrossRef]
  76. Wang, Q.; Wang, X. Moving to Economic Growth without Water Demand Growth-a Decomposition Analysis Decoupling from Economic Growth and Water Use in 31 Provinces of China. Sci. Total Environ. 2020, 6, 138362. [Google Scholar] [CrossRef] [PubMed]
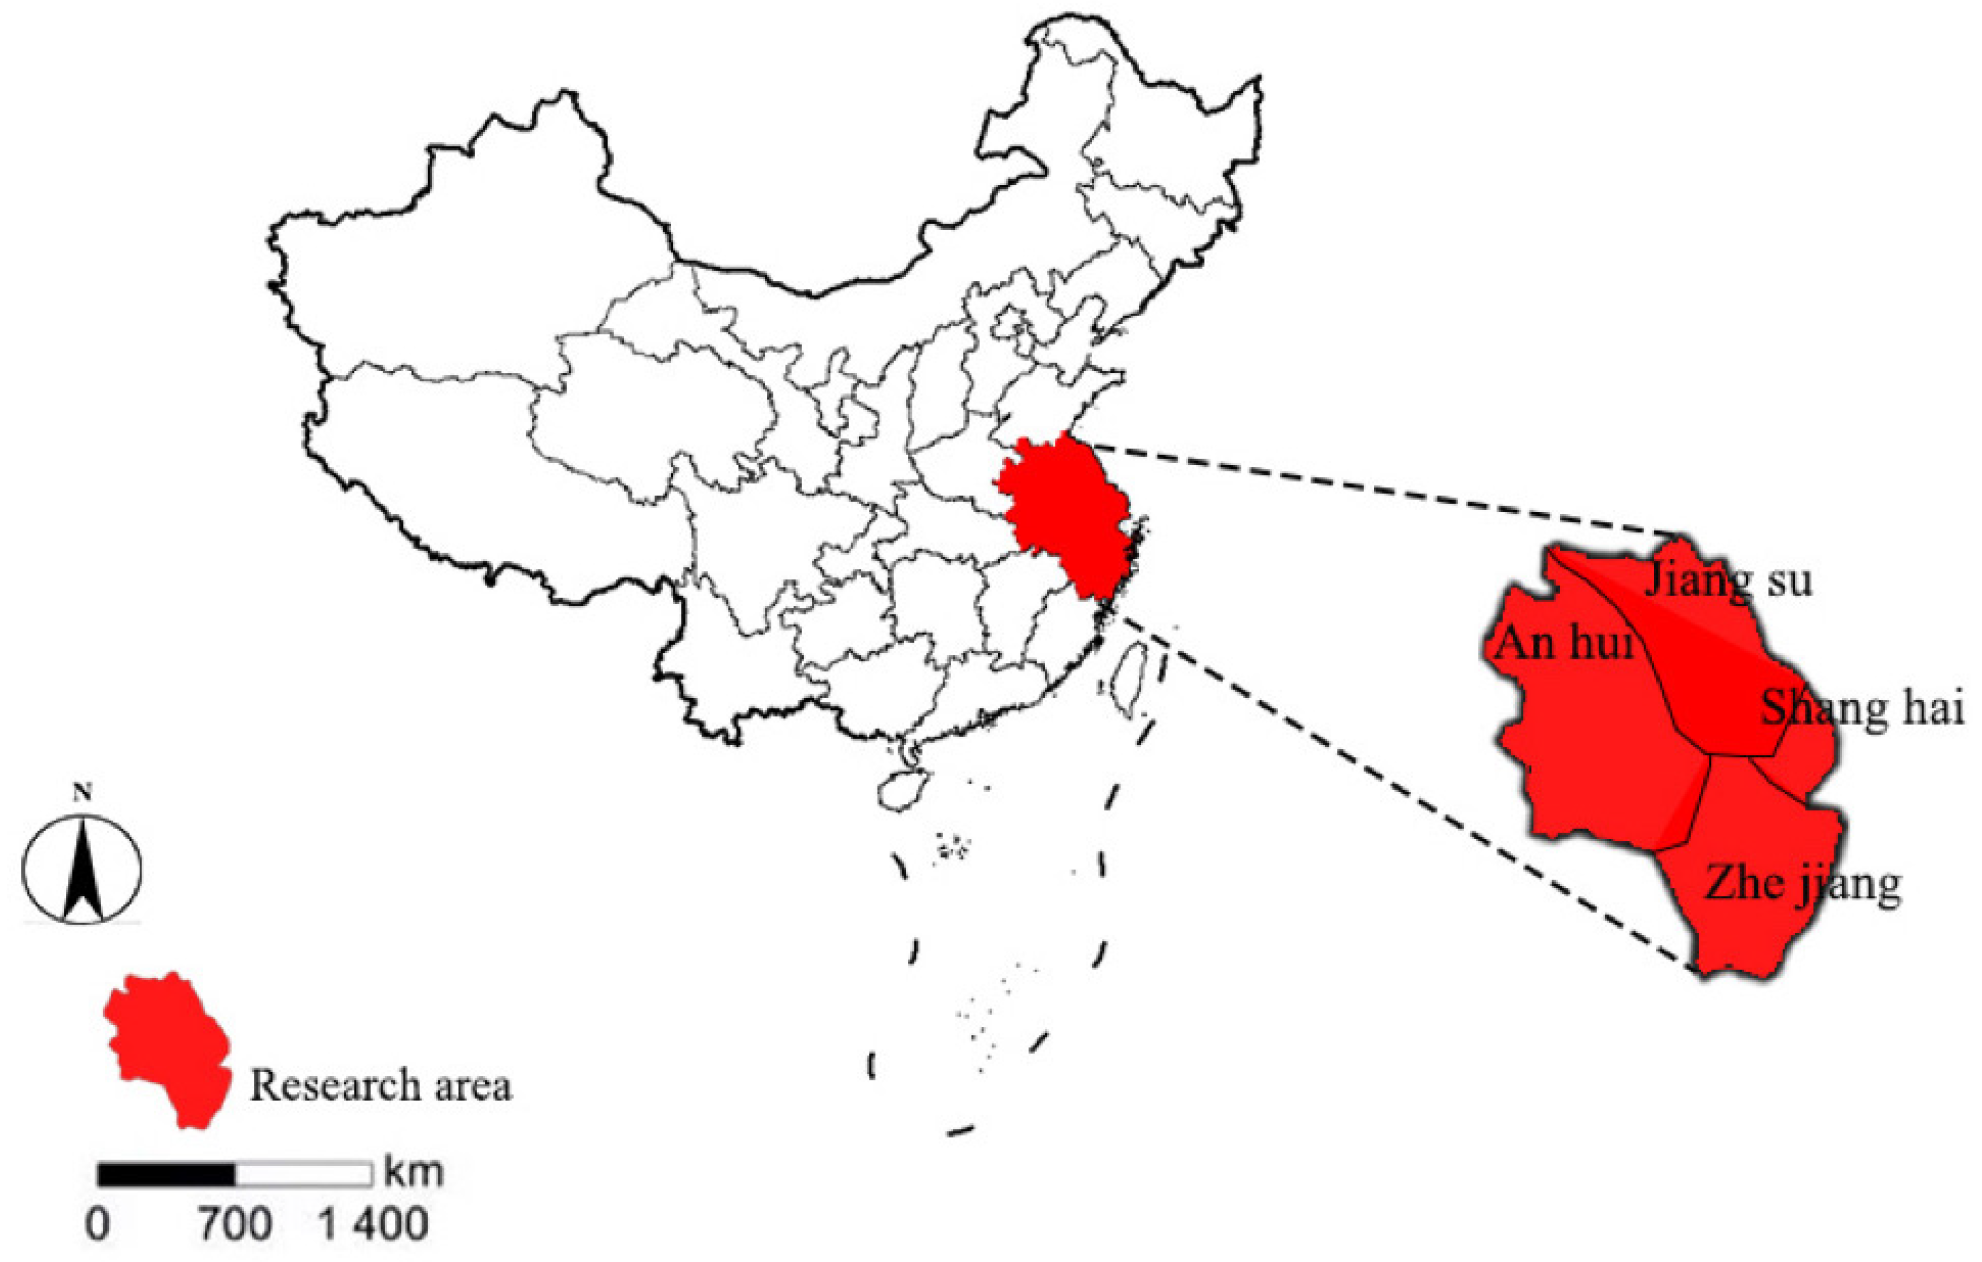
Figure 1. Location and regions of the Yangtze River Delta.
Sustainability 15 10779 g001
Figure 2. The framework of WEF nexus based on emergy and input–output analysis.
Sustainability 15 10779 g002
Figure 3. Decoupling state and decoupling indicator range. Green color represents the ideal state. Red color represents the worst state.
Sustainability 15 10779 g003
Figure 4. Embodied WEF consumption from 2012 to 2017.
Sustainability 15 10779 g004
Figure 5. Per unit GDP and per capita WEF utilization from 2012 to 2017.
Sustainability 15 10779 g005
Figure 6. Decoupling states between sectoral economic growth and WEF consumption. (a) 2012–2015, (b) 2015–2017.
Sustainability 15 10779 g006
Figure 7. Decoupling states between GDP and WEF consumption between regions.
Sustainability 15 10779 g007
Figure 8. Analysis of decoupling driving factors during 2012–2017. (a) 2012–2015, (b) 2015–2017.
Sustainability 15 10779 g008
Table 1. Compilation of sectors in the urban system.
Aggregated SectorsOriginal 42 SectorsCode
Agriculture (Ag)Agriculture, forestry, animal husbandry, and fishery1
Mining (Mi)Mining and washing of coal2
Extraction of petroleum and natural gas3
Mining and processing of metal ores4
Mining and processing of nonmetal and other ores5
Manufacturing (Ma)Food and tobacco processing6
Textile industry7
Manufacture of leather, fur, feather, and related products8
Processing of timber and furniture9
Manufacture of paper, printing, and articles for culture, education, and sport activity10
Processing of petroleum, coking, processing of nuclear fuel11
Chemical industry12
Non-metallic mineral products13
Smelting and processing of metals14
Metal products15
General purpose machinery16
Special purpose machinery17
Transport equipment18
Electrical machinery and equipment19
Communication equipment, computers, and other electronic equipment20
Manufacture of measuring instruments21
Other manufacturing and waste resources22
Repair of metal products, machinery, and equipment23
Electricity and gas supply (El)Production and distribution of electric power and heat power24
Production and distribution of gas25
Water supply (Wa)Production and distribution of tap water26
Construction (Co)Construction27
Transport and Services (St)Wholesale and retail trades28
Transport, storage, and postal services29
Accommodation and catering30
Information transfer, software, and information technology services31
Finance 32
Real estate33
Leasing and commercial services34
Scientific research 35
Polytechnic services36
Administration of water, environment, and public facilities37
Resident, repair, and other services38
Education39
Health care and social work40
Culture, sports, and entertainment41
Public administration, social insurance, and social organizations42
Table 2. Key drivers of WEF consumption and description.
DriversFormulaExplanation
Technology effect   E i , n / G i , n WEF use per unit of GDP by sector, illustrating the effect on resource-saving technologies
Industrial structure G i , n / G n The proportion of sectoral output value in regional GDP, indicating changes in industrial structure
Economic scale   G n / R n Regional GDP generated per unit of WEF consumption, representing benefits from resources use
Resource-saving capacity R n / P n Per capita WEF use, representing people’s actual capacity to save WEF resources
Population size P n The total residents in a given region
Table 3. Data collection and description.
DataSource of DataDescription
WaterWater Resources Bulletin of Shanghai, Jiangsu, Zhejiang, and Anhui (2012–2017) [60,61,62,63]
China Environmental Statistics Yearbook [64]
Agricultural water, industrial water, ecological water, and domestic water
EnergyChina’s Energy Statistical Yearbook (2012–2017) [65]Coal, petroleum, natural gas, diesel, kerosene, gasoline, electricity
FoodChina Agriculture Yearbook (2012–2017) [66]Raw grains, legumes, oil, meat, dairy, eggs, and aquatic products
Consumption coefficientLiu et al., (2020) [13];
Xiang and Jia (2016) [49]
Energy-related water, food-related water, water-related energy, food-related energy
Emergy
transformity
Ukidwe and Bakshi (2004) [23];
Lan et al. (2002) [67]
Transformity for water, energy, food
Disclaimer/Publisher’s Note: The statements, opinions and data contained in all publications are solely those of the individual author(s) and contributor(s) and not of MDPI and/or the editor(s). MDPI and/or the editor(s) disclaim responsibility for any injury to people or property resulting from any ideas, methods, instructions or products referred to in the content.