Abstract
Reasonable evaluation of the transformation efficiency of resource-based cities can provide a reliable basis for correcting factor misallocation and optimizing factor allocation. This study improves the directional distance function from the aspects of direction vector endogeneity, relative distance and exogenous weight. Based on the improved model, the data of China’s prefecture-level cities from 2003 to 2018 are used to measure and compare the transformation efficiency of resource-based cities and non-resource-based cities. By setting different exogenous weights, the transformation efficiency considering the total factor and the transformation efficiency only considering the energy factor are obtained. Further comparative analysis shows that the two transformation efficiencies of resource-based cities are lower than those of non-resource-based cities, and the two keep the same change trend. Whether it is a resource-based city or a non-resource-based city, the level of transformation efficiency that only considers energy factors is lower. Further, this study decomposes the transformation efficiency of resource-based cities according to the three dimensions of transformation efficiency and finds that the energy efficiency, output efficiency and environmental efficiency of China’s resource-based cities are different, and the transformation efficiency in the three dimensions of energy conservation, economic growth and environmental friendliness is also different.
1. Introduction
The transformation of resource-based cities is a worldwide problem. For example, Ruhr in Germany, Pittsburgh in the United States and Lorraine in France have all conducted useful explorations in the transformation of resource-based cities. In the transformation of resource-based cities, a reasonable evaluation of the transformation efficiency of resource-based cities can provide a reliable basis for correcting factor mismatches and formulating a strategic layout for optimizing factor allocation.
Most of the resource-based cities in the world have made great contributions to the development of regional economy. However, due to the limited and non-renewable natural resources on which resource-based cities rely for development, resource-based cities often experience growth, maturity, decline and transformation. Some resource-based cities not only bear the threat of traditional “urban diseases” but also face the dilemma of “resource curse” [1]. The destruction of the environment, the imbalance of industrial structure, the excess supply of low-end energy, and the low efficiency of factor use have become major bottlenecks in the development of resource-based cities [2]. Resource-based cities often need to solve these bottlenecks through transformation. Urban transformation involves all aspects of society, people’s livelihood, economy and culture [3,4,5,6], and industrial transformation plays a central role in this process [7]. Industrial transformation is not only the change of structure but also the reconfiguration of production factors and the improvement of the use process. Therefore, in the process of urban industrial transformation, the change of factor supply structure and the improvement of factor supply quality are indispensable and complementary to each other [8,9,10,11]. This is also a way for the Chinese government to propose deepening the supply-side structural reform to solve the problem of resource-based city transformation. As early as 2017, China proposed to take the supply-side structural reform as the main line under the new situation, promote the quality change, efficiency change and power change of economic development and improve the total factor productivity, so as to inject innovation and competitiveness into the economic development of cities. In 2021, China issued the 14th Five-Year Plan for Promoting the High-Quality Development of Resource-Based Regions, pointing out that it is necessary to further improve the adaptability of regional resource and energy supply and reconstruct the resource and energy reserve, supply and guarantee system, so as to further promote the high-quality green development of resource-based regions in the new development period. Therefore, taking the supply-side structural reform as the main line, correcting the misallocation of factors and optimizing the allocation of factors provide new ideas for solving the dilemma of industrial transformation in resource-based cities [12,13,14]. In this study, the optimization of factor allocation is used to solve the problem of resource-based city transformation. Under the background of global green transformation and carbon neutrality, the transformation efficiency of resource-based cities and the calculation of energy, output and environmental efficiency after decomposition are realized in multiple dimensions from the direction of energy conservation, economic growth and environmental friendliness through the optimized direction distance function. We hope that the optimized efficiency evaluation model can provide a quantitative basis for the transformation of resource-based cities and a new way for the evaluation of green transformation efficiency of resource-based cities around the world.
With the “Paris Agreement” setting the world carbon neutrality target, countries around the world are actively carrying out urban green transformation, and realizing green transformation and development has become an irreversible trend. In the process of urban green transformation, resource-based cities are facing the dual pressures of economic transformation and green low-carbon requirement. Therefore, exploring how resource-based cities can improve the transformation efficiency under the constraint of “carbon neutrality” target and constructing a green low-carbon development path will help to improve the sustainable development theory, resource-based city transformation development theory, resource mismatch theory and other important theories and help the resource-based cities around the world to improve the efficiency of urban transformation. It is of great theoretical and practical significance to grasp the direction and adjust the path in the process of green transformation.
In previous studies, the measurement of urban green transformation efficiency is mainly carried out from two perspectives. One is from an exploratory perspective. Through the measurement of transformation efficiency, the influence of different factors is found. Based on the IPAT-E model and DEMATEL-ISM method, Yin et al. [15] identified and extracted four influencing factors: population, affluence, technology and energy. A multi-level system structure model of influencing factors is established, and the influence of various factors on the transformation efficiency of resource-based cities is analyzed through a multi-level structure model. Deng [16] used analytic hierarchy process and DEA analysis to analyze the main factors affecting the transformation efficiency of coastal cities. By quantifying and weighting each index, a multi-dimensional and multi-level evaluation system combining qualitative and quantitative evaluation was established, and the impact of different indicators on the transformation efficiency was analyzed. Based on the panel data of 285 prefecture-level cities in China from 2005 to 2016, Ma et al. [17] used remote sensing data and socioeconomic data to establish a green growth efficiency analysis database. At the same time, TOPSIS model, ultra-efficient SBM model and exploratory spatial analysis method supported by entropy technology are used to test and analyze the input-output index, comprehensive evaluation index, spatial and temporal pattern of green growth efficiency and spatial correlation effect. Finally, it is found that the conversion rate of urban resources in China is low, and the conversion rate between different regions is also very different. Tao et al. [18] used the global Malmquist–Luenberger productivity index to measure and decompose the green productivity growth of China’s three major urban agglomerations from 2003 to 2013 and found that technological progress rather than efficiency improvement is the main contributor to green productivity growth.
Secondly, from a descriptive point of view, the corresponding transformation efficiency is measured by specifying the measurement objectives and systems. Sun et al. [19] used the comprehensive direction distance function and the slack-based measure (DDF-SBM) model to evaluate the efficiency level of inclusive green transformation in 285 cities in China from 2003 to 2015. The author found that technology and region are two important factors affecting the level of transformation. Among these two factors, the scope of technological change is the main obstacle to improve the level of transformation. Zhao [20] used the meta-frontier DEA model to analyze the green transformation capacity of 286 sample cities in China in 2013, evaluated their efficiency gaps and found that cities of different sizes and different regions have different green transformation efficiency. Based on the panel data of 278 Chinese cities, Lin and Zhu [21] used the quasi-difference-in-differences framework to analyze the impact of policies on clean air action based on the efficiency of green transformation. Finally, it was found that clean air action had a significant positive impact on the green transformation of cities and showed a trend of increasing efficiency over time, especially for cities with high emission reduction targets and rich resource endowments. Wang et al. [22] constructed a green transformation evaluation index system by using multi-level evaluation method and entropy method at the same time and evaluated the green transformation level of nine cities in the Pearl River Delta of China in 2015. It was found that Shenzhen, Zhuhai and Guangzhou had a higher level of green transformation, and other cities were relatively backward. Wang et al. [23] used the stochastic frontier analysis (SFA) based on the Translog production function hypothesis to evaluate the CIE eco-efficiency and promotion potential of 28 typical coal mining cities in China. Finally, it is found that ownership structure and environmental regulation have a significant inhibitory effect on the improvement of ecological efficiency, while marketization level, technological innovation and energy price have a significant positive impact. Yang et al. [24] constructed a comprehensive GDL evaluation index system from the social, economic and environmental perspectives. The entropy method and analytic hierarchy process are used to empower the indicators, and then the GM (1,1) model is used to predict the green development level of each city. The comprehensive green development level of each city in the time series from 2006 to 2020 is determined by the weighting method. Finally, it is found that the green development level of mineral resource-based cities gradually decreases from east to west.
In summary, the efficiency evaluation methods currently used in urban green transformation are mainly as follows: DEA method [16], TOPSIS model [17], SFA [23], global Malmquist–Luenberger productivity index [18], analytic hierarchy process and entropy method [24] and multi-level evaluation method and entropy method [22]. Among them, the analytic hierarchy process needs subjective evaluation, which is easy to cause subjective deviation. The TOPSIS model will be difficult to select quantitative indicators. The SFA model is too demanding for function and distribution assumptions. As a non-parametric method, the DEA method is proposed by Charnes et al. (1978) [25] based on the research of Farrell (1957) [26]. Compared with other methods, DEA can not only effectively overcome the defects of subjective setting errors and limited assumptions on the overall distribution but also is more suitable for solving the problem of “multi-input and multi-output”. Therefore, it is commonly used in the evaluation of urban transformation efficiency.
However, in the research on the transformation efficiency of resource-based cities, on the output side, most studies only consider the expected economic output and ignore the investigation of undesirable output, which is the main defect of the existing research. In the industrial transformation of resource-based cities, undesired output is often the output of pollutants. Because the treatment of pollutants requires the cost of pollution control, this part of the cost should be eliminated in the output to reflect the real economic growth. However, the cost of pollutant treatment is usually uncertain, so traditional methods cannot directly deal with it. Therefore, how to incorporate energy consumption and pollution emissions into the same DEA model is a key issue.
The traditional DEA model has two problems in the technical treatment of undesired output: (1) The traditional DEA model only allows us to increase output and reduce input, which limits the reduction of undesired output. In the literature, undesirable outputs are usually used as inputs, or data conversion methods are used to overcome this problem. (2) The traditional DEA model assumes that the input and output are strong (free) disposal. However, in the actual production process, the reduction of undesired output requires a higher cost. The distance function can simultaneously deal with energy input and pollutant reduction. Generally, the distance function is divided into Shephard distance function (SDF) and directional distance function (DDF). The Shepard distance function assumes that the expected output and undesired output expand or shrink in the same proportion, which cannot guarantee energy conservation and pollution reduction under the premise of expected output expansion. Based on the Shepard distance function, Chung and other scholars have constructed a directional distance function (DDF) [27] to deal with the problem of undesired output. Its advantage is that it can increase the expected output and reduce the undesired output within the scope of technical feasibility and permission, which is the key and core of the transformation and upgrading of resource-based cities under the new concept of energy reform and green development. Therefore, the directional distance function is more suitable for studying the transformation efficiency of resource-based cities than the Shepard distance function. Therefore, this study chooses the direction distance function (DDF) to measure the industrial transformation efficiency of resource-based cities.
Although the directional distance function (DDF) has certain advantages in measuring the transition rate, its model hypothesis still has drawbacks, that is, limiting the increase of expected output and the reduction of factor input and undesired output in the same proportion. This assumption can easily lead to “slack bias”. In view of the existing irrationality, this study further attempts to improve three aspects: (1) Direction vector endogeneity through the model to solve the endogenous decision variables, rather than through preliminary artificial setting. The direction vector of different decision-making units may be different; therefore, the industrial transformation and upgrading direction of each resource-based city is different, which is more realistic. (2) Absolute distance is transformed into relative distance. The relaxation amount (i.e., absolute distance value) in each direction of the objective function is divided by the actual value in this dimension and converted into a relative distance, and the relative distances in different directions are different. (3) By introducing exogenous weights, different weight combinations represent different constraints and objectives, so as to reflect the different importance of each dimension. Finally, this study uses this optimized directional distance function to measure the transformation efficiency of resource-based cities.
Based on the above analysis, in order to better highlight the changes in the transformation efficiency of resource-based cities, the operation data set is also selected into the relevant index data of non-resource-based cities for comparison. This study finally regards each prefecture-level city in China as a complex input-output system. Referring to previous studies [15,23,24], the input-output efficiency of each prefecture-level city in the process of industrial transformation and upgrading is evaluated under the consideration of energy and environmental factors, that is, the fastest economic growth and environmental friendliness are achieved with the smallest capital, labor and energy inputs, and the economy is maintained under the goal of energy conservation and emission reduction. Steady growth. As far as resource-based cities are concerned, energy is the most important endowment condition [15,23]. As far as the current situation of energy use is concerned, the proportion of input is relatively large, and the emission of pollutants also increases accordingly. The transformation efficiency calculated by giving greater weight to energy input is lower than that calculated by giving the same weight to capital, labor and energy. Therefore, this study gives three different weights to examine the transformation efficiency of China’s resource-based cities under different factor input ratios. According to the idea of directional distance function, if a resource-based city wants to achieve the transformation and development goals of resource security, environmental protection and economic development, it needs to move towards the production frontier along the three directions of stable economic growth, energy conservation and emission reduction. The greater the distance moving in a certain direction, the greater the gap between the actual value and the target value of transformation and upgrading in this direction. Further, the greater the ratio of the target value in a certain direction to its own actual value, the worse the existing situation in this regard, the more obvious the gap with the ideal state, and the lower the transformation efficiency. According to this logic, in theory, the energy efficiency, output efficiency and environmental efficiency of resource-based cities in the process of transformation and upgrading refer to the ratio of actual value to target value in the three directions of energy conservation, economic growth and environmental friendliness. The smaller the ratio is, the more obvious the gap between the actual value and the target value of transformation and upgrading is, and the lower the energy efficiency, output efficiency and environmental efficiency are.
There are three main innovations in this study: (1) From the three dimensions of economic output, energy consumption and pollution emissions, the connotation of industrial transformation of resource-based cities is enriched, and the industrial transformation efficiency of resource-based cities is calculated by using the improved direction distance function and further decomposed into output efficiency, energy efficiency and environmental efficiency. (2) The direction vector endogeneity, through the model to solve the endogenous decision variables, rather than through preliminary artificial setting, makes the direction vector possibility of different decision-making units different; therefore, the transformation and upgrading of resource-based cities have different directions, which makes this model more realistic. (3) The introduction of exogenous weights and different weight combinations representing different constraints and objectives can specifically reflect the importance of different dimensions.
2. Materials and Methods
2.1. Calculation Model of Transformation Efficiency
Under the logic of the above theoretical framework, this study uses the DDF method to measure the transformation efficiency of resource-based cities. Each city is regarded as a production decision-making unit. Each decision-making unit has three inputs: labor, capital and energy. It also has two outputs: expected and unexpected. Therefore, the set of production possibilities is expressed as follows:
where capital , labor and energy are input factors, GDP is expected output, and pollution emission is undesired output. According to the research of Färe et al. (2006) [28], production technology should satisfy the following basic assumptions: (1) The expected output and undesired output have null-jointness. (2) Both factor input and expected output are highly disposable. (3) Undesirable outputs have weak disposability. For DMU of n cities, the general model of direction distance function can be expressed as follows:
where is the weight of each decision making unit, indicates that the sum of the weight variables is 1, which means that the production technology is variable returns to scale (VRS). Without this restriction, it means that the return to scale is constant (CRS). The objective function is the inefficiency value, and is the efficiency value.
Although the directional distance function (DDF) has been applied in the process of measuring productivity, its model assumption has drawbacks, that is, the increase of expected output and the decrease of factor input and unexpected output are limited to the same proportion. This assumption can easily lead to “relaxation bias”. In view of the existing irrationality, this study attempts to improve three aspects: (1) Direction vector endogeneity. The direction vector is a unit vector. Let and be nonnegative. Through the model to solve the endogenous decision variables, rather than through artificial setting in advance, the direction vector of different decision making units may be different, so that the transformation and upgrading direction of each resource-based city is different, which is more realistic. (2) Transformation of absolute distance into relative distance. The relaxation amount (i.e., absolute distance value) in each direction of the objective function is divided by the actual value in this dimension and converted into a relative distance, and the relative distances in different directions are different. (3) Introducing exogenous weight (). Different weight combinations represent different constraints and objectives, reflecting the different importance of each dimension.
After improvement, the directional distance function for measuring the transformation efficiency is as follows:
Since the objective function and the direction vector are variables that require solutions, and the two are in the product form, the model (3) is a nonlinear programming, which may produce a nonglobal optimal solution or no solution. According to the conclusions of [27,28], let , , , , transform model (3) into linear programming as follows:
The values of , , , and can be obtained by solving (4) by linear programming. Let and , then:
Therefore, , , , and can be obtained. is the maximum distance from the decision point to the production frontier. The distance is different in the size of the direction vector in each dimension, so the distance projected to each dimension is also different. Further, the inefficiency value of the objective function is obtained by solving the model, and then the final transformation efficiency is obtained by deducting the target value from 1. When the decision making unit is located on the production frontier, the target value is 0, and the transformation efficiency value is 1.
In summary, this study measures and compares the transformation efficiency of China’s prefecture-level cities (including resource-based cities and non-resource-based cities) based on Model (4) and uses the setting of exogenous weight differentiation to focus on the transformation efficiency of resource-based cities under the transformation goal.
2.2. Decomposition of Transformation Efficiency
Model (4) measures the transformation efficiency of each prefecture-level city under the five dimensions of labor, capital and energy input, expected output and undesired output. According to the definition of the connotation of the transformation and upgrading of resource-based cities in this study, the transformation and upgrading goals of resource-based cities mainly include resource security, environmental protection and economic development. Based on the measurement framework of transformation efficiency, on the premise of fixed input of labor and capital factors, the transformation efficiency of resource-based cities in these three aspects is measured by three dimensions of energy input, expected output and undesired output.
Based on the improved calculation method, the decrease of energy input, the increase of expected output and the decrease of undesired output correspond to the three dimensions of the transformation efficiency of resource-based cities. Therefore, the capital and labor input are fixed, and the calculation model of the transformation efficiency of resource-based cities can be obtained:
By solving Model (6), the energy consumption that a resource-based city can save, the increased GDP is , and the reduced environmental pollution emissions is obtained. Let and , then we have the following:
Further, the optimal solutions of and are obtained: ; , , . is the maximum distance between a city and the frontier. Because the direction vector is different, the distance projected to the direction of energy consumption, GDP and pollution emission is also different. Therefore, in the three directions of energy conservation, economic growth and environmental friendliness, the ratio of the distance value to the actual value can be expressed as follows:
Further, the ratio of the distance value to the actual value in the three directions is subtracted by 1, which is the energy efficiency, output efficiency and environmental efficiency of the resource-based city, which can be expressed as follows:
Among them, is energy efficiency, is output efficiency, and is environmental efficiency.
2.3. Data and Processing
In 2011, the State Council of China approved the abolition of Chaohu City in Anhui Province, upgraded Bijie and Tongren in Guizhou Province to prefecture-level cities and established Sansha City in Hainan Province. Because the research time span of this study is 2003–2018, in order to unify the caliber, this study excludes Chaohu, Bijie, Tongren and Sansha. In addition, Pu’er City, Lhasa City, which have seriously missing data, and Haikou City and Sanya City, which are quite different from other cities, are also excluded. In addition, in order to unify the city level and volume, this study also excludes Beijing, Tianjin, Shanghai and Chongqing. In this way, 278 cities (including 114 resource-based cities and 164 non-resource-based cities) except Beijing, Tianjin, Shanghai, Chongqing, Chaohu, Bijie, Tongren, Pu’er, Haikou, Sanya, Sansha and Lhasa are taken as the sample population.
Secondly, we determine the source of input-output data. In addition to labor and capital investment, this study specifically selected the amount of energy input to examine the efficiency of energy use in cities. In terms of output, the pollution emission index is selected as the undesirable output, and GDP is used as the expected output. The variable selection process is as follows:
Labor input: For the actual labor input of prefecture-level cities in China, the indicators of labor input in the existing literature are mainly the number of employees, the duration of labor input and the level of wages. In view of the limitations of urban-level data, this study selects the average number of on-the-job workers as an indicator to measure the input of labor factors.
Capital investment: Since fixed asset investment is the main means of social fixed asset reproduction, in order to study the change of capital investment in resource-based cities, this study chooses fixed asset investment as capital investment. In the existing research, there are two main methods for measuring capital stock. One is to directly use the relevant statistical data estimation value as the capital stock [29,30], and the other is the perpetual inventory method [31,32]. This study uses the perpetual inventory method commonly used in academia to estimate the capital stock of each prefecture-level city. The formula is as follows:
In this formula, represents the capital stock of city i in period t, represents the capital stock of city i in period t − 1, represents the fixed asset investment of city i in period t, and represents the fixed asset depreciation rate of city i in period t. Regarding the determination of the initial capital stock, this study refers to the method of the existing literature [33], using the total fixed asset investment in 2003 divided by 10% as the base period capital stock. With reference to Perkins (1988) [34] and Wang and Yao (2003) [35], the asset depreciation rate is set to 5%, and 5% is selected as the asset depreciation rate in this study. In view of the fact that the urban statistical yearbook does not subdivide the fixed asset price index of each city, this study uses the fixed asset price index of each province in the China Statistical Yearbook to replace the fixed asset price index of each city to deflate the fixed asset investment of each city.
Energy input: In previous studies on urban productivity, many scholars selected electricity consumption as an indicator of energy input (Wei and Song, 2012) [36]. On the one hand, because the GDP elasticity of electricity demand is very close to the GDP elasticity of energy demand, electricity has become the main form of energy consumption in China (Lin and Peng, 2017) [37]. On the other hand, the supply and demand of coal and oil are significantly underestimated in China’s total energy production and consumption. In contrast, the electricity consumption data directly read by the computer is more accurate. Therefore, this study selects industrial electricity consumption as a measure of energy input.
Expected output: Combined with the previous reasoning, this study takes real GDP as the expected output. This study uses the GDP deflator over the years to deflate nominal GDP to obtain real GDP to measure whether the transformation goal of economic growth is achieved.
Unexpected outputs: Combined with the previous review, this study chooses the industrial sewage discharge of resource-based cities as the measurement index in the non-expected output part. Unexpected outputs in industrial production include air pollution, water pollution, solid waste pollution, land pollution, heavy metal pollution, etc. Due to the lack of data such as land pollution and heavy metal pollution, it is difficult to quantify. In this study, the emissions of industrial wastewater, industrial sulfur dioxide and industrial soot are selected as undesirable outputs. However, under the DEA analysis framework, the inclusion of multiple pollutants as a variety of undesirable outputs will show a very low convergence rate and then there is a certain degree of inoperability, which is difficult to measure the environmental efficiency in the environmentally friendly direction. Therefore, this study uses the entropy method to non-dimensionalize the “three industrial wastes”, calculates the weight coefficient of each pollutant in each year and obtains the comparable comprehensive pollution emission index of each city in 2003 as the base period according to the numerical proportion of the three pollutants in each year.
Due to the large differences in the discharge of wastewater, exhaust gas and solid waste in various prefecture-level cities and the different properties and units of wastewater, exhaust gas and solid waste, it is not possible to simply sum up the three pollution emissions. Based on the previous literature, this study removed different units from the three pollutants by standardized treatment and obtained the weights of the three pollutants by calculating the entropy value and difference coefficient of each pollutant and finally added them according to the weights. Firstly, the dimensionless treatment of wastewater, waste gas and solid waste is carried out to calculate the ratio of the emission of a certain pollutant to the total emission of each prefecture-level city, that is, the dimensionless value. Then the entropy values of the three pollutants are calculated respectively, and the difference coefficient of each pollutant is calculated by the entropy value. The smaller the entropy value, the greater the difference coefficient, that is, the greater the role of the pollutant in the overall evaluation, indicating that the pollution emission of the prefecture-level city mainly comes from the pollutant. Finally, the objective weight of each pollutant is calculated according to the difference coefficient, and the comprehensive pollution index is further weighted. The larger the value is, the larger the pollution emission of the prefecture-level city is, and the higher the pollution degree to the environment is.
The weights of wastewater, waste gas and solid waste in China’s prefecture-level cities from 2003 to 2018 were calculated. It can be seen from Figure 1 that the weight of exhaust gas is the lowest, with an average of 23%, and there is a trend of decreasing first and then increasing. The average weight of wastewater was 37%, showing an upward trend from 2003 to 2009 and then rising again from 2015 after repeated fluctuations. The average weight of solid waste was 39%. From 2003 to 2010, it fluctuated around 30%. In 2011, it increased sharply to 64% and then showed a wave-like trend.

Figure 1.
The weights of wastewater, exhaust gas and solid waste.
Through the selection and processing of input and output variables, the measured sample data includes 278 prefecture-level cities (including 114 resource-based cities and 164 non-resource-based cities) from 2003 to 2018. The capital factor input, labor factor input, energy factor input, real GDP and environmental pollution composite index. The data are derived from the “China Statistical Yearbook” and “China Urban Statistical Yearbook” from 2003 to 2018. The descriptive statistics of the main variables are shown in Table 1.

Table 1.
Descriptive statistics of the sample data.
3. Results
Under the weight setting of and , this paper calculates the transformation efficiency of prefecture-level cities in China from 2003 to 2018 and compares and analyzes the differences and interval characteristics of the transformation efficiency of resource-based cities and non-resource-based cities. Further, this study grouped resource-based cities according to growth stages, geographical regions and dominant resources to discuss the differences and trend characteristics of transformation efficiency.
3.1. The Calculation Results of Transformation Efficiency
3.1.1. A Comparative Analysis of Resource-Based Cities and Non-Resource-Based Cities
Based on the model (4), this study sets different exogenous weights and calculates the transformation efficiency values of 278 prefecture-level cities (including 114 resource-based cities and 164 non-resource-based cities) from 2003 to 2018 under two different exogenous weights. The first is to set exogenous weight , that is, to consider the input and output factors of capital, labor and energy factors when measuring the transformation efficiency. It is considered that factor input is as important as expected output and undesired output. Each factor accounts for , since there are three input factors, the proportion of each input factor is . The second setting weight focuses on energy input, economic output and environmental output efficiency, without considering capital and labor input. In this study, the annual average values of the two efficiency values of the two types of cities are drawn into a line chart (Figure 2a,b) to compare the differences between resource-based cities (RCs) and non-resource-based cities (NRCs) at the two efficiency levels.
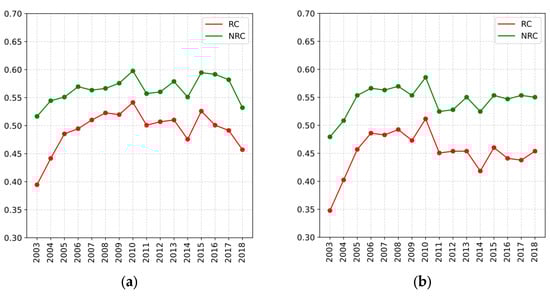
Figure 2.
The comparison of the transformation efficiency between RCs and NRCs.
Figure 2a shows the total factor transformation efficiency of China’s prefecture-level cities from 2003 to 2018 under the condition of setting exogenous weight at . In general, from the position of productivity distribution, the transformation efficiency of resource-based cities is mainly concentrated between 0.4 and 0.5, which is significantly lower than that of non-resource-based cities (0.5–0.6), indicating that there is a certain gap between resource-based cities and non-resource-based cities in transformation efficiency. From the perspective of change trend, the trend of resource-based cities and non-resource-based cities over the years is relatively consistent. In the two periods of 2003–2010 and 2014–2015, the transformation efficiency of resource-based cities and non-resource-based cities improved. In contrast, the transformation efficiency of resource-based cities and non-resource-based cities declined significantly in 2010–2014 and 2015–2018.
Figure 2b shows the energy factor transformation efficiency of China’s prefecture-level cities from 2003 to 2018 under the condition of setting exogenous weight at . In general, from the position of productivity distribution, the transformation efficiency of resource-based cities is mainly concentrated between 0.3 and 0.5, which is significantly lower than the transformation efficiency level of non-resource-based cities (0.5–0.6), indicating that in the case of increasing the weight of energy input, there is still a certain gap between resource-based cities and non-resource-based cities in transformation efficiency. From the perspective of change trend, the trend of resource-based cities and non-resource-based cities over the years is relatively consistent. In the two periods of 2003–2010 and 2014–2015, the transformation efficiency of resource-based cities and non-resource-based cities improved. In contrast, the transformation efficiency of resource-based cities and non-resource-based cities declined significantly in 2010–2014.
Comparatively speaking, no matter resource-based cities or non-resource-based cities, the average transformation efficiency considering only energy input is significantly lower than that considering capital, labor and energy at the same time. In the transformation efficiency only considering energy input, the efficiency gap between resource-based cities and non-resource-based cities is more obvious, indicating that when only considering energy input, the efficiency of resource-based cities is lower, reflecting that although resource-based cities have advantages in resource endowment conditions, they do not form more economic output. On the contrary, due to the increase of undesired output caused by relying on resource industries, the transformation efficiency is greater than that of non-resource-based cities. Therefore, this study takes the transformation efficiency considering only energy input as an example in the following comparative analysis.
In order to further explore the differences in the distribution of transformation efficiency between resource-based cities and non-resource-based cities, this study divides the two types of cities into three intervals according to the level of transformation efficiency to analyze the interval characteristics. Among them, 0.70–1.00 is the high efficiency area, 0.30–0.70 is the medium efficiency area, and below 0.30 is the low efficiency area (see Figure 3 and Figure 4). Comparatively speaking, the proportion of resource-based cities distributed in the high-efficiency transformation areas over the years is significantly smaller than that of non-resource-based cities, while the proportion of resource-based cities distributed in the low-efficiency transformation areas is far greater than that of non-resource-based cities. Specifically, over the years, more than 80% of China’s resource-based cities were concentrated in medium- and low-efficiency areas, especially in 2003, accounting for as high as 91%, indicating that the transformation efficiency of China’s resource-based cities considering energy and environmental factors is generally not high, and the space for future transformation and upgrading is enormous. In addition, the three efficiency intervals of resource-based cities fluctuate with time, reflecting the repeated development of transformation and not showing a steady upward trend.

Figure 3.
The interval distribution of transformation efficiency in resource-based cities.
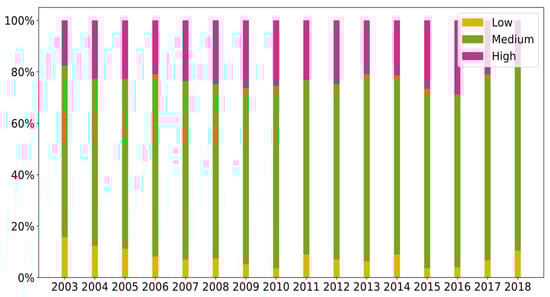
Figure 4.
The interval distribution of transformation efficiency in non-resource-based cities.
3.1.2. Comparative Analysis of Transformation Efficiency of Resource-Based Cities in Different Growth Stages
According to the “National Sustainable Development Plan for Resource-Based Cities (2013–2020)” issued by the State Council in November 2013, this study divides 114 resource-based cities in the sample into growing resource-based cities (14), mature resource-based cities (62), declining resource-based cities (23), and regenerating resource-based cities (15) and then analyzes the characteristics and trends of the transformation efficiency of the four types of resource-based cities (see Figure 5).

Figure 5.
The comparison of transformation efficiency grouped by growth stage.
From the mean point of view, the transformation efficiency of the growing resource-based cities is the highest (0.61), followed by the regeneration type (0.47), and the transformation efficiency of the recession type and the mature type is lower, 0.45 and 0.42, respectively. From the trend of change, the trend of growing, regenerating and mature resource-based cities is similar, indicating that resource-based cities at different growth stages do not show a relatively stable trend of change, and the transformation and upgrading did not achieve significant results. The transformation efficiency of the recession type increased rapidly from 2003 to 2010 and then decreased slightly.
3.1.3. A Comparative Analysis of the Transformation Efficiency of Resource-Based Cities in Different Geographical Regions
China’s resource-based cities are widely distributed, and resource-based cities in different regions have their own development history and characteristics. According to the division method of China’s geographical distribution by the State Council, this study divides 114 resource-based cities into eastern (20), central (37), western (33) and northeastern (24) provinces and examines the characteristics and differences of transformation efficiency of resource-based cities in different geographical locations (see Figure 6).

Figure 6.
The comparison of transformation efficiency grouped by geographical region.
From the average point of view, the average transformation efficiency of the four groups of regions is not high. The transformation efficiency of resource-based cities in the northeast and western regions significantly improved, and the eastern and central regions did not achieve significant improvement. The transformation efficiency of resource-based cities in the western region is the highest (0.55), followed by the northeast (0.51) and the east (0.40), and the transformation efficiency of the central region is the lowest (0.36). From the perspective of the changing trend, the curve fluctuations of the four groups of regions are basically the same, and there were obvious inflection points in 2010 and 2014. From 2008 to 2010, the transformation efficiency of all regions showed an upward trend. The northeast, central and western regions rose more obviously, while the eastern region rose less. In terms of transformation efficiency, the resource-based cities in the west were leading, followed by the cities in the northeast, east and central regions in that order. From 2010 to 2014, the level of transformation efficiency showed a significant downward trend, and the transformation efficiency of resource-based cities in the central and northeastern regions decreased greatly. From 2014 to 2018, the transformation efficiency of the four groups of regions significantly improved, with a greater increase in the eastern and western regions.
3.1.4. A Comparative Analysis of the Transformation Efficiency of Resource-Based Cities with Different Dominant Resources
According to the dominant resource types of each resource-based city, 114 resource-based cities were divided into coal (41), non-metal (10), metal (18), oil and gas (11), comprehensive (29) and forest industry (5) categories to further explore the impact of the attributes and characteristics of dominant resources on the transformation efficiency of resource-based cities.
It can be seen from Figure 7 that only the resource-based cities in the forest industry (0.62), oil and gas (0.60) and non-metal (0.58) categories have an average transformation efficiency of more than 0.5, and the other three types are located in the range of 0.3–0.5. The overall level is in the medium efficiency area and needs to be further improved. The resource-based cities in the forest industry category have the highest average transformation efficiency which is 1.5 times that of the resource-based cities in the metal category with the lowest ranking. From the perspective of change trend, the transformation efficiency of resource-based cities with different dominant resources changes in a wave-like manner, and the direction of fluctuation is basically the same. Except for the resource-based cities of the forest industry and oil and gas categories, the transformation efficiency of the other four categories fluctuates more smoothly.
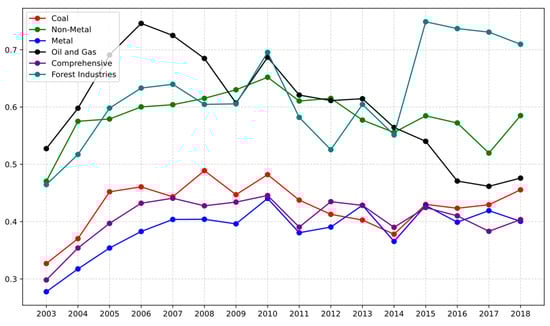
Figure 7.
The comparison of transformation efficiency grouped by dominant resource.
3.2. Decomposition and Comparison of Transformation Efficiency of Resource-Based Cities
3.2.1. Comparison of Resource-Based Cities and Non-Resource-Based Cities
Based on the model (8)–(10), this study decomposes the transformation efficiency of 114 resource-based cities and 164 non-resource-based cities and further obtains the efficiency of resource-based cities and non-resource-based cities in the three dimensions of energy consumption, economic growth and environmental friendliness from 2003 to 2018, namely energy efficiency, output efficiency and environmental efficiency.
Figure 8a–c show the trends of energy efficiency, output efficiency and environmental efficiency of resource-based cities, respectively. From the average value, the average values of energy efficiency, output efficiency and environmental efficiency of resource-based cities are 0.62, 0.42 and 0.33, respectively, which are smaller than those of non-resource-based cities (0.71, 0.55 and 0.38). It shows that there is a certain gap between resource-based cities and non-resource-based cities in the three directions of energy conservation, economic growth and environmental friendliness, especially in the direction of economic growth. At the same time, it can also be seen that both resource-based cities and non-resource-based cities, in the three aspects of efficiency, energy efficiency is relatively high, while environmental efficiency is relatively low. From the perspective of the changing trend, the energy efficiency, output efficiency and environmental efficiency of resource-based cities and non-resource-based cities are more consistent over the years. Resource-based cities fluctuate greatly in economic efficiency, reflecting that resource-based cities did not form stable economic growth. In addition, the energy efficiency and economic efficiency of resource-based cities have shown an obvious upward trend in recent years, indicating that the transformation and upgrading of resource-based cities achieved certain results, but the environmental efficiency was not improved.
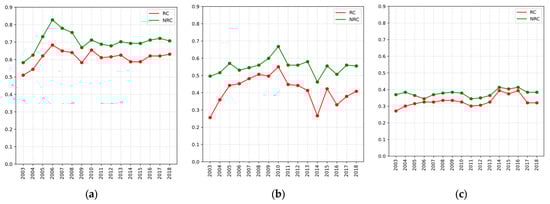
Figure 8.
The comparison of energy efficiency, economic output efficiency and emissions efficiency between RCs and NRCs.
3.2.2. Comparative Analysis of Resource-Based Cities in Different Growth Stages
In order to better compare the efficiency of resource-based cities in different growth stages in the three dimensions of energy conservation, economic growth and environmental friendliness, this study divides resource-based cities into growth, maturity, decline and regeneration types according to different growth stages and examines the performance of four types of resource-based cities in different growth stages in terms of energy, economic output and environment.
From Table 2, it can be seen that in terms of energy efficiency, the average efficiency of growing resource-based cities is the largest (0.75), and the average efficiency of declining and regenerating resource-based cities is the smallest (0.58). In terms of output efficiency, the average efficiency of growing and regenerating resource-based cities is larger, 0.58 and 0.52, respectively, while the average efficiency of mature and declining resource-based cities is smaller, 0.35 and 0.44, respectively. In terms of environmental efficiency, the average efficiency of growing resource-based cities is significantly greater than that of the other three types of cities, reaching 0.50, while the average efficiency of the other three types is about 0.30. From the perspective of the changing trend, the average values of energy, output and environmental efficiency show a wave-like changing trend, indicating that the changes of the three efficiencies of resource-based cities are unstable.
Table 2.
Averages and trends in energy, economic output and emission efficiency by growth stage.
In general, the growing resource-based cities have abundant resource reserves in the early stage of resource exploitation, and the efficiency of resource utilization and transformation of resource primary products is high. At the same time, the environment is not affected by resource exploitation, so the environmental efficiency is also high. The resource exploitation of mature resource-based cities reached a certain scale, but due to excessive dependence on the resource industry, the expansion of energy input was unable to bring economic growth, and output and energy efficiency began to decline, accompanied by serious environmental pollution problems. However, due to the depletion of resources in declining resource-based cities, the development of alternative industries is still short, and the problems of energy, output and environment are serious, so the three efficiency values are low. The alternative industries of renewable resource-based cities have developed well and the economic growth is rapid. However, some resource industries have not completely withdrawn, and the pollution emission problem has not been significantly alleviated. Therefore, the output efficiency is high and the environmental efficiency is low.
3.2.3. Comparative Analysis of Resource-Based Cities in Different Geographical Regions
In order to better compare the efficiency of resource-based cities in different geographical regions in the three dimensions of energy conservation, economic growth and environmental friendliness, this study divides resource-based cities into eastern, central, western and northeastern regions according to different geographical regions and examines the performance of resource-based cities in energy, output and environment in different geographical regions.
From Table 3, it can be seen that the energy efficiency of resource-based cities in the eastern and northeastern regions is higher, with an average energy efficiency of 0.58 and 0.52, respectively. The energy efficiency of resource-based cities in the central region is the lowest, only 0.35. The output efficiency of resource-based cities in the northeastern and western regions is relatively high, 0.53 and 0.5, respectively, while the output efficiency of resource-based cities in the central region is the lowest, only 0.26. The environmental efficiency of resource-based cities in the western region is higher (0.45), and the environmental efficiency of resource-based cities in the other three regions is lower.
Table 3.
Averages and trends in energy, economic output and emission efficiency by geographical region.
From the perspective of change trend, from 2003 to 2018, the energy efficiency and output efficiency of resource-based cities in the western region increased the most, by 5 times and 1 times, respectively, indicating that the problem of energy waste in resource-based cities in the western region significantly improved, and the GDP showed a rapid growth. The energy efficiency of the eastern region nearly doubled, while economic and environmental problems did not improve significantly. The output efficiency of resource-based cities in the northeastern region relatively improved, while the efficiency of the central region in the three aspects did not improve significantly.
3.2.4. A Comparative Analysis of Resource-Based Cities with Different Dominant Resources
In order to better compare the efficiency of resource-based cities with different dominant resources in the three dimensions of energy conservation, economic growth and environmental friendliness, this study divides resource-based cities into six categories (coal, metal, non-metal, oil and gas, comprehensive and forest industry according to different dominant resources) and examines the transformation efficiency of resource-based cities with different dominant resources in energy, economy and environment.
According to the results of Table 4, the largest average energy efficiency is shown by the resource-based cities in the oil and gas and forest industry categories, with an average efficiency of 0.74, while the smallest average energy efficiency is shown by the resource-based cities in the metal category, with an average efficiency of only 0.53. The top three categories of resource-based cities in the average output efficiency are non-metal, forest industry and oil and gas, with the average values of 0.65, 0.62 and 0.58, respectively, while the last three are metal, comprehensive and coal categories, with the average values of 0.39, 0.36 and 0.35, respectively. The top three categories of resource-based cities in terms of environmental efficiency are forest industry, oil and gas and non-metal, with average values of 0.50,0.48 and 0.44, respectively. The last three categories are coal, comprehensive and metal, with average values of 0.31, 0.29 and 0.25, respectively. From the mean point of view, the resource-based cities of metal, comprehensive and coal categories rank the bottom three in the three efficiency levels, indicating that these three categories of resource-based cities have a large gap with the frontier in the three dimensions of energy conservation, economic growth and environmental friendliness, and the effect of transformation is not good.
Table 4.
Averages and trends in energy, economic output and emission efficiency by dominant resource.
From the perspective of change trend, from 2003 to 2018, the largest increase in energy efficiency was in the resource-based cities of the forest industry and coal categories, which increased by 44% and 37%, respectively, while the energy efficiency of resource-based cities in the oil and gas category decreased by 12%. The output efficiency of resource-based cities in the metal category greatly improved by 1.5 times, and the output efficiency of resource-based cities in the oil and gas category had the smallest change. The environmental efficiency of resource-based cities in the forest industry category greatly improved, while the environmental efficiency of oil and gas resource-based cities declined, and the pollution emission problem worsened.
4. Conclusions and Discussion
Accurate measurement of the transformation efficiency of resource-based cities can provide a reliable basis for the transformation of resource-based cities. In the past, most of the studies on the transformation efficiency of resource-based cities only considered the expected economic output and ignored the investigation of undesired output, which often had some endogenous problems. Moreover, there may be an abnormal causal relationship between the factor misallocation and the transformation efficiency of resource-based cities. That is, in order to develop, resource-based cities with low transformation efficiency may strengthen their dependence on a certain factor and further aggravate the degree of factor misallocation. However, the overall transformation efficiency may be improved. This study aims to solve these problems. Firstly, based on the direction distance function, the direction distance function is improved from the aspects of direction vector endogeneity, introduction of relative distance and exogenous weight. The endogenous decision variables are solved by the model, rather than artificially set in advance. Finally, the direction vector possibility of different decision-making units is different, so that the transformation and upgrading direction of each resource-based city is different, which is more in line with reality. At the same time, by introducing exogenous weights, different weight combinations represent different constraints and objectives, which can specifically reflect the different importance of each dimension. Finally, based on the improved direction distance function model, the data of prefecture-level cities in China from 2003 to 2018 are calculated, and the transformation efficiency of resource-based cities and non-resource-based cities is compared. By setting different exogenous weights, the transformation efficiency considering the total factor and the transformation efficiency only considering the energy factor are obtained. Further comparative analysis shows that the two transformation efficiencies of resource-based cities are lower than those of non-resource-based cities, and the two keep the same change trend. Whether it is a resource-based city or a non-resource-based city, the level of transformation efficiency that only considers energy factors is lower. Further, this study decomposes the transformation efficiency of resource-based cities according to the three dimensions of transformation efficiency. It is found that the energy efficiency, output efficiency and environmental efficiency of China’s resource-based cities are different, and the transformation efficiency of resource-based cities with different growth stages, geographical regions and dominant resources is also different in the three dimensions of energy conservation, economic growth and environmental friendliness.
Through this study, there are three findings:
- Whether it is a resource-based city or a non-resource-based city, the average transformation efficiency considering only energy input is significantly lower than that considering capital, labor and energy at the same time. In the transformation efficiency only considering energy input, the gap between the transformation efficiency level of resource-based cities and non-resource-based cities is more obvious, and in the direction of energy efficiency, the energy efficiency of resource-based cities is lower than that of non-resource-based cities. In general, in the process of transformation of resource-based cities in China, there is a general situation that energy efficiency is greater than output transformation efficiency and environmental transformation efficiency. In different stages, different regions and different resource-based cities, the change trend of energy efficiency is basically similar, but the energy efficiency of resource-based cities in the growth stage is relatively high, and the energy efficiency of resource-based cities in other development stages is relatively low. Moreover, the energy efficiency and environmental efficiency of resource-based cities based on oil and gas resources show a decreasing trend, indicating that the development process of resource-based cities may be limited by the defects of industrial singularity and monotonicity of production capacity. There is a law of diminishing marginal utility, which leads to a low or negative increase in energy efficiency.
- In the process of transformation of resource-based cities of different regions, different development stages and different resource bases, the change of output efficiency is mostly lower than that of energy efficiency and higher than that of environmental efficiency, indicating that the output efficiency of resource-based cities still has room for improvement. Among them, the change value of output efficiency of renewable resource-based cities, resource-based cities in the western and northeastern regions and resource-based cities in the non-metal category is higher than the change value of energy efficiency, indicating that environmental friendliness, industrial diversification and location factors may have a greater impact on the improvement of output efficiency of resource-based cities.
- In the process of resource-based city transformation, except that the change value of environmental efficiency in the western region is higher than that of energy efficiency and lower than that of output efficiency, the change value of environmental efficiency in other resource-based cities with different regions, different growth stages and different resource bases is lower than that of energy and output efficiency. It shows that in the process of resource-based city transformation, there is still a problem of the focus on the improvement of energy efficiency and output efficiency with less attention paid to environmental efficiency. It shows that in terms of pollutant emissions, each resource-based city still needs to focus on this issue.
Based on the above findings, this study finally puts forward some policy suggestions as follows:
- For the problem of energy efficiency, mainly due to the low efficiency of factor use, resource-based cities can formulate standardized energy orderly development plans based on supply-side structural reforms, so that the output composition matches the composition of consumer demand, so as to promote the reduction of excess energy input and realize the rational allocation of energy factors. At the same time, it promotes the optimization and reorganization of industries, reduces industrial costs, strengthens inter-regional coordination, builds diversified industrial cooperation clusters, deepens the development of strategic emerging industries and modern service industries and plans the selection criteria for alternative industries. Encourage resource-based industries to extend the industrial chain and introduce advanced technology, so as to solve the problem of low efficiency of energy use through diversified industrial clusters and extended industrial chains and finally promote the city’s energy efficiency based on the further optimization of energy factor allocation and use.
- For the problems of output efficiency, resource-based cities should optimize the layout of resource development, select resource areas with good development and utilization conditions and large environmental capacity, strengthen the construction of resource in situ conversion capacity, transform resource advantages into industrial advantages and realize the improvement of output efficiency through industrial development. At the same time, we should build an industrial chain in depth to improve the utilization efficiency of resources, build a multi-industry system as a whole and improve the flexibility of resource use. On the basis of the above construction, resource-based cities should also actively seek cooperation between locations through their complementary advantages, use the linkage effect and further improve the output efficiency of resource-based cities.
- For the problem of environmental efficiency, resource-based cities should optimize the ability of sewage treatment, actively urge relevant high-emission and high-pollution enterprises to carry out industrial transformation and increase the sewage treatment process. At the same time, resource-based cities should also optimize the structure of resource use, further get rid of dependence on resources and realize the transformation from relying mainly on factor input to relying more on innovation-driven, from extensive use of energy resources to green circular low-carbon development, so as to solve the problem of low environmental efficiency.
- This study realizes the calculation of the transformation efficiency of resource-based cities through the optimized direction distance function. From the three dimensions of energy, environment and output, the calculation method of the transformation efficiency of resource-based cities is improved in multiple directions, which strongly supports the evaluation of the transformation efficiency of resource-based cities and provides a basis for resource-based cities to optimize factor allocation and adjustment measures. Furthermore, the optimized directional distance function can also be applied to other fields that need multi-dimensional and independent variable research. For the calculation of the transformation efficiency of resource-based cities, there are still some defects in the method of this study. In the use of variables, due to the impact of the new coronavirus epidemic, only the relevant data from 2003 to 2018 are selected for the calculation of the transformation efficiency of resource-based cities. In terms of energy input, labor input and undesired output, other data can be selected for further research. For example, energy input can refer to international standards, and the main energy input can be converted into tons of standard coal. The form of measurement can further improve the quality of the measurement results in terms of energy input. In terms of labor input, we can refer to the relevant energy input industry to obtain the number of labor force in the corresponding industry. For undesired output, this study only selects the emissions of industrial wastewater, industrial sulfur dioxide and industrial soot as undesired output due to the difficulty of data acquisition. Future research can further select more detailed data. In terms of methods, because the optimized directional distance function has the product form of variables, the model becomes a nonlinear programming. This study refers to the conclusions of Fare et al. and transforms the nonlinear part into a linear part by improving the dimension and finally realizes the linear programming solution. In future research, further optimization can be carried out by using other methods, such as using the gradient method for “iterative descent”, and approaching the optimal value through multiple iterations.
Author Contributions
Conceptualization, R.Y.; methodology, R.Y.; formal analysis, R.Y.; resources, R.Y.; data curation, R.Y.; writing—original draft preparation, Z.L.; writing—review and editing, Z.L. and R.Y.; visualization, Z.L.; supervision, R.Y. All authors have read and agreed to the published version of the manuscript.
Funding
This research was funded by Liaoning Social Science Planning Fund Project, grant number L22BJY011.
Data Availability Statement
Most of data can be found in China’s “National Sustainable Development Plan for Resource-Based Cities (2013–2020)”, “China City Statistical Yearbook” and “China Statistical Yearbook”. Detailed data presented in this study are available on request from the corresponding author.
Conflicts of Interest
The authors declare no conflict of interest.
References
- Ellie, P. BookReview: Sustaining Development in Mineral Economies: The Resource Curse Thesis, by Richard M. Auty. London and New York: Routledge, 1993. Crit. Sociol. 1995, 21, 158–160. [Google Scholar]
- Calligaris, S. Misallocation and Total Factor Productivity in I taly: Evidence from Firm-Level Data. LABOUR 2015, 29, 367–393. [Google Scholar] [CrossRef]
- Adams, C.; Frantzeskaki, N.; Moglia, M. Mainstreaming nature-based solutions in cities: A systematic literature review and a proposal for facilitating urban transitions. Land Use Policy 2023, 130, 106661. [Google Scholar] [CrossRef]
- Christopher, M.R.; Richard, S.; Niki, F. The role of nature-based solutions and senses of place in enabling just city transitions. Environ. Sci. Policy 2023, 144, 10–19. [Google Scholar]
- Joanna, K. Rethinking tourism-driven urban transformation and social tourism impact: A scenario from a CEE city. Cities 2023, 134, 104178. [Google Scholar]
- El-Bastawisy, M.M. Applying green urbanism during spatial urban transformation: A schematic plan, Nasr City, Cairo, Egypt. Rend. Lincei-Sci. Fis. 2023, 34, 93–110. [Google Scholar] [CrossRef]
- Zheng, Z.; Qiu, F.; Zhang, X. Heterogeneity of correlation between the locational condition and industrial transformation of regenerative resource-based cities in China. Growth Chang. 2020, 51, 771–791. [Google Scholar] [CrossRef]
- Woo, W.T. China’s soft budget constraint on the demand-side undermines its supply-side structural reforms. China Econ. Rev. 2019, 57, 101111. [Google Scholar] [CrossRef]
- Long, R.; Chen, H.; Li, H.; Wang, F. Selecting alternative industries for Chinese resource cities based on intra- and inter-regional comparative advantages. Energ. Policy 2013, 57, 82–88. [Google Scholar] [CrossRef]
- Hou, G.; Zou, Z.; Zhang, T.; Meng, Y. Analysis of the Effect of Industrial Transformation of Resource-Based Cities in Northeast China. Economies 2019, 7, 40. [Google Scholar] [CrossRef]
- Feng, R.; Shen, C.; Dai, D.; Xin, Y. Examining the spatiotemporal evolution, dynamic convergence and drivers of green total factor productivity in China’s urban agglomerations. Econ. Anal. Policy 2023, 78, 744–764. [Google Scholar] [CrossRef]
- Wang, F.; Wu, J.; Wu, M.; Zheng, W.; Huang, D. Has the Economic Structure Optimization in China’s Supply-Side Structural Reform Improved the Inclusive Green Total Factor Productivity? Sustainability 2021, 13, 12911. [Google Scholar] [CrossRef]
- Shi, Y.; Osewe, M.; Anastacia, C.; Liu, A.; Wang, S.; Latif, A. Agricultural Supply-Side Structural Reform and Path Optimization: Evidence from China. Int. J. Environ. Res. Public Health 2023, 20, 113. [Google Scholar] [CrossRef] [PubMed]
- Song, X.; Zhao, C.; Han, J.; Zhang, Q.; Liu, J.; Chi, Y. Measurement and Influencing Factors Research of the Energy and Power Efficiency in China: Based on the Supply-Side Structural Reform Perspective. Sustainability 2020, 12, 3879. [Google Scholar] [CrossRef]
- Yin, Q.; Wang, Y.; Xu, Z.; Wan, K.; Wang, D. Factors influencing green transformation efficiency in China’s mineral resource-based cities: Method analysis based on IPAT-E and PLS-SEM. J. Clean. Prod. 2022, 330, 129783. [Google Scholar] [CrossRef]
- Deng, W. Evaluating transformation efficiency of resource-based coastal cities: An AHP and DEA based analysis. J. Coastal Res. 2019, 94, 878–882. [Google Scholar] [CrossRef]
- Ma, L.; Long, H.; Chen, K.; Tu, S.; Liao, L. Green growth efficiency of Chinese cities and its spatio-temporal pattern. Resour. Conserv. Recycl. 2019, 146, 441–451. [Google Scholar] [CrossRef]
- Tao, F.; Zhang, H.; Hu, J.; Xia, X.H. Dynamics of green productivity growth for major Chinese urban agglomerations. Appl. Energy 2017, 196, 170–179. [Google Scholar] [CrossRef]
- Sun, Y.; Ding, W.; Yang, Z.; Yang, G.; Du, J. Measuring China’s regional inclusive green growth. Sci. Total Environ. 2020, 713, 136367. [Google Scholar] [CrossRef]
- Zhao, T.; Yang, Z. Towards green growth and management: Relative efficiency and gaps of Chinese cities. Renew. Sustain. Energy Rev. 2017, 80, 481–494. [Google Scholar] [CrossRef]
- Lin, B.; Zhu, J. Policy effect of the Clean Air Action on green development in Chinese cities. J. Environ. Manag. 2020, 258, 110036. [Google Scholar] [CrossRef]
- Wang, M.-X.; Zhao, H.-H.; Cui, J.-X.; Fan, D.; Zhou, G.-J. Evaluating green development level of nine cities within the Pearl River Delta, China. J. Clean. Prod. 2018, 174, 315–323. [Google Scholar] [CrossRef]
- Wang, D.; Wan, K.; Yang, J. Measurement and evolution of eco-efficiency of coal industry ecosystem in China. J. Clean. Prod. 2019, 209, 803–818. [Google Scholar] [CrossRef]
- Yang, Y.; Guo, H.; Chen, L.; Liu, X.; Ke, X. Regional analysis of the green development level differences in Chinese mineral resource-based cities. Resour. Policy 2019, 61, 261–272. [Google Scholar] [CrossRef]
- Charnes, A.; Cooper, W.W.; Rhodes, E. Measuring the efficiency of decision making units. Eur. J. Oper. Res. 1978, 2, 429–444. [Google Scholar] [CrossRef]
- Farrell, M.J. The Measurement of productive efficiency. J. R. Stat. Soc. 1957, 120, 253–281. [Google Scholar] [CrossRef]
- Chung, Y.; Fare, R. Productivity and undesirable outputs: A directional distance function approach. Microeconomics 1997, 51, 229–240. [Google Scholar] [CrossRef]
- Färe, R.; Grosskopf, S.; Pasurka, C.A. Pollution abatement activities and traditional productivity. Ecol. Econ. 2006, 62, 673–682. [Google Scholar] [CrossRef]
- Dmitry, L.; Alexander, N. Investment, capital stock, and replacement cost of assets when economic depreciation is non-geometric. J. Financ. Econ. 2021, 142, 1444–1469. [Google Scholar]
- Escribá-Pérez, F.J.; Murgui-García, M.J.; Ruiz-Tamarit, J.R. The devil is in the details: Capital stock estimation and aggregate productivity growth—An application to the Spanish economy. Port. Econ. J. 2020, 21, 1–20. [Google Scholar]
- Costas, P. Standardized capital stock estimates for the Greek economy 1948–2020. Struct. Change Econ. Dyn. 2023, 64, 236–244. [Google Scholar]
- Berlemann, M.; Wesselhöft, J. Estimating Aggregate Capital Stocks Using the Perpetual Inventory Method. Rev. Econ. 2014, 65, 1–34. [Google Scholar] [CrossRef]
- YOUNG, A. Gold into Base Metals: Productivity Growth in the People’s Republic of China during the Reform Period. J. Polit. Econ. 2003, 111, 1220–1261. [Google Scholar] [CrossRef]
- Perkins, D.H. Reforming China’s Economic System. J. Econ. Lit. 1998, 26, 601–645. [Google Scholar]
- Wang, Y.; Yao, Y. Sources of China’s Economic Growth, 1952—1999: Incorporating Human Capital Accumulation. China Econ. Rev. 2003, 14, 32–52. [Google Scholar] [CrossRef]
- Wei, W.; Song, Y. Variation decomposition of urban total factor energy efficiency under environmental constraints-empirical analysis based on three-stage DEA-malmquist index. Stat. Inf. Forum 2012, 27, 52–57. [Google Scholar]
- Lin, B.; Peng, T. Energy conservation in China’s light industry sector: Evidence from inter-factor and inter-fuel substitution. J. Clean. Prod. 2017, 152, 125–133. [Google Scholar] [CrossRef]
Disclaimer/Publisher’s Note: The statements, opinions and data contained in all publications are solely those of the individual author(s) and contributor(s) and not of MDPI and/or the editor(s). MDPI and/or the editor(s) disclaim responsibility for any injury to people or property resulting from any ideas, methods, instructions or products referred to in the content. |
© 2023 by the authors. Licensee MDPI, Basel, Switzerland. This article is an open access article distributed under the terms and conditions of the Creative Commons Attribution (CC BY) license (https://creativecommons.org/licenses/by/4.0/).