Article

A Study on the Characteristics of High-Solid-Water Filling Materials with Different Water Contents Based on the Boltzmann Superposition Principle

1
State Key Laboratory of Coking Coal Resources Green Exploitation, Pingdingshan 467000, China
2
China Pingmei Shenma Holding Group Co., Ltd., Pingdingshan 467000, China
3
School of Mechanics and Civil Engineering, China University of Mining and Technology, Xuzhou 221116, China
4
State Key Laboratory for Geomechanics and Deep Underground Engineering, China University of Mining and Technology, Xuzhou 221116, China
*
Authors to whom correspondence should be addressed.
Sustainability 2023, 15(12), 9675; https://doi.org/10.3390/su15129675
Submission received: 24 April 2023 / Revised: 3 June 2023 / Accepted: 12 June 2023 / Published: 16 June 2023

Abstract

:
High-solid-water material is a kind of soft rock-like material with significant plastic deformation characteristics, and creep performance is its important material property. In order to study the effect of creep on the properties of high-solid-water materials, this paper first conducts creep tests of high-solid-water filling materials under different loading methods, performs creep data analysis based on the Boltzmann superposition principle, carries out the creep experiment of high-solid-water materials under different water contents to analyze the creep characteristics of high-solid-water materials, and then processes the curve of graded loading based on the Boltzmann superposition principle to obtain the strain–time curve of axial creep under different constant stress. Finally, the instantaneous curve is compared with the creep stress–strain curve. It is concluded that the high-solid-water filling materials with water content of 61%, 65% and 69% meet the transportation requirements and filling requirements, and the total coagulation time increases slightly with the increase in water content. The curve treated by the Boltzmann superposition principle has the same trend in the overall creep process and the creep curve loaded separately. With the increase in loading stress, the total strain of the material gradually increases, and with the increase in the water content of the material, the rate of change in the total strain of the material also increases. The long-term strength of high-solid-water materials decreases with the increase in water content. The specimen will eventually cause irreversible failure under long-term stress during the fourth-stage loading.

1. Introduction

With the increase in mining scope, the long-term creep of filling material after strengthening surrounding rock has become the focus of research. However, currently, research on the creep behavior of materials is mainly concentrated on the aspect of rock. To be specific, scholars at home and abroad have conducted some studies on the creep characteristics and constitutive models of rocks [1,2,3]; in contrast, quite little has been carried out on the creep properties of materials with high water content, such as high-solid-water filling materials.
Comparatively, foreign scholars initialized the study on rock creep behavior earlier and obtained the creep characteristics of experimental rock mass through experiments [4,5]. Fuji et al. explored the axial, toroidal, and volumetric strain–time curves of sandstone and granite in the whole creep process under triaxial stress through experiments [6]. Gasc-Barbier et al. placed their research focus on clayey rock [7]. The creep characteristic of the filling body is close to that of soft rock; the research on this has been gradually developing both at home and abroad. Zhang Y P et al. conducted rheological experiments of soft rock in non-ferrous metal mines [8]. Shen W W et al. studied the creep characteristics of red bed soft rock experimentally [9]. L.S. Tsai et al. explored the elastic and viscoplastic behaviors of weak Mushan sandstone [10]. R.K. Dubey et al. analyzed the influence of structural anisotropy (bedding plane direction) on the compressive strength, yield strength, elastic modulus, failure strain and yield strain of rock salt [11]. Wang Y Y et al. studied the creep characteristics of deep soft rock roadway under the coupling effect of stress, temperature and chemistry [12]. Wang Y C took the mudstone of Badong Formation as the research object and carried out relevant creep mechanics tests [13]. Based on the rock characteristics under different temperature conditions, Yang Q established a creep model to reflect the mechanical properties of artificially frozen soft rock in Cretaceous strata [14]. Soft rock is featured with low strength and large deformation, and its comprehensive properties are quite different from those of high-solid-water materials. However, its research methods can provide ideas for the study of creep of high-solid-water materials [15,16,17,18]. Ermolovich studied a composite material based on water-soluble ore processing waste. To increase the strength properties of the created materials, fullerene-alin was used as a nano-modified additive [19]. Kongar-Syuryun and Khayrutdinov proposed the activation of tailings before mixing to improve strength and rheological properties. The activation treatment of the components or the addition of some activation additive is one of the methods to improve the quality of the created material [20,21].
However, there are still few studies on the creep characteristics of filling materials. This study developed a new type of high-solid-water filling material with superior mechanical properties through different ratios of high-solid-water filling materials with different water contents. A series of test methods were used to study the change rule of the creep characteristics, creep rate, long-term strength, and creep curve of high-solid-water materials with different water contents. On this basis, this study explored the characteristics of high-water-solid materials so as to develop filling materials with bearing compressibility and stability as the control indexes.

2. Creep Tests of High-Solid-Water Filling Materials under Different Loading Modes

2.1. Preparation and Basic Physical Properties of High-Solid-Water Filling Materials

In the preparation and experiment of the materials, the author refers to the preparation process and related standards of some concrete, mortar and cement. The authors formulated the following preparation scheme by reading a large amount of the relevant literature and integrating the research of predecessors on filling materials.
High-solid-water material was composed of two materials, material A and material B. Material A was mainly composed of different types of cement and fly ash, and a certain amount of retarder and suspension agent were added, and material B was composed of gypsum, quick setting agent and early strength agent. In the preparation process, the A and B materials were configured separately, and then the two materials were mixed. The mixed materials and water were weighed according to the proportion of solid water, the mixed materials were added to the water, and the mixer adopted an ordinary cement mixer. After the A and B materials were stirred evenly, they were continued to be mixed and stirred for us to determine the evaluation index of the mixture.
Among them, the test used thioaluminate cement, which is mainly composed of minerals such as dicalcium silicate (C2S) and anhydrous calcium thioaluminate. The specific composition is shown in Table 1. The main chemical component of gypsum is calcium sulfate (CaSO4), which is a typical inorganic cementitious material. Based on the gypsum molecular formula combined with water content, we understand that it can be divided into semi-hydrate gypsum (CaSO4·1/2H2O) and dihydrate gypsum (CaSO4·2H2O). In order to ensure the coagulation hardening of high-solid-water filling materials based on thioaluminate cement, this paper used gypsum dihydrate for the experiments.
The above materials were made into standard specifications by using 50 × 50 × 100 mm PVC pipes, and the basic physical properties of high-solid-water materials, including the setting time, fluidity and early strength properties of the materials, were studied.
For the high-solid-water filling material water contents of 61%, 65% and 69%, the single pulp coagulation time was more than 10 h to meet the transportation needs. After mixing, the coagulation time was between 30 min and 40 min, meeting the filling requirements. With the increase in water content, the total coagulation time of the material increased slightly, but due to the small change in water content, the condensation time did not differ much, as shown in Table 2.
For high-solid-water filling materials with water contents of 61%, 65% and 69%, the fluidity of the single slurry of the nail material decreased with the increase in time. The lower the water content, the more the fluidity loss. However, due to the role of suspension agent and retarder, material A can maintain a fluidity of more than 200 mm within 10 h, material B will not undergo hydration reaction during transportation, and the fluidity can be maintained at a high level, which can meet the transportation requirements, as shown in Table 3.
The early strength of high-solid-water filling materials increased rapidly, and basically reached more than 50% of the 28 D strength at 8 h. After the material was cured for 1 d, the strength reached about 75% of the 28 D strength, after which the hydration reaction began to slow down. The material can reach more than 90% of the strength of 28 D at 7 D. The high-solid-water filling material has high strength in the early stage and can better meet the filling needs, as shown in Table 4.

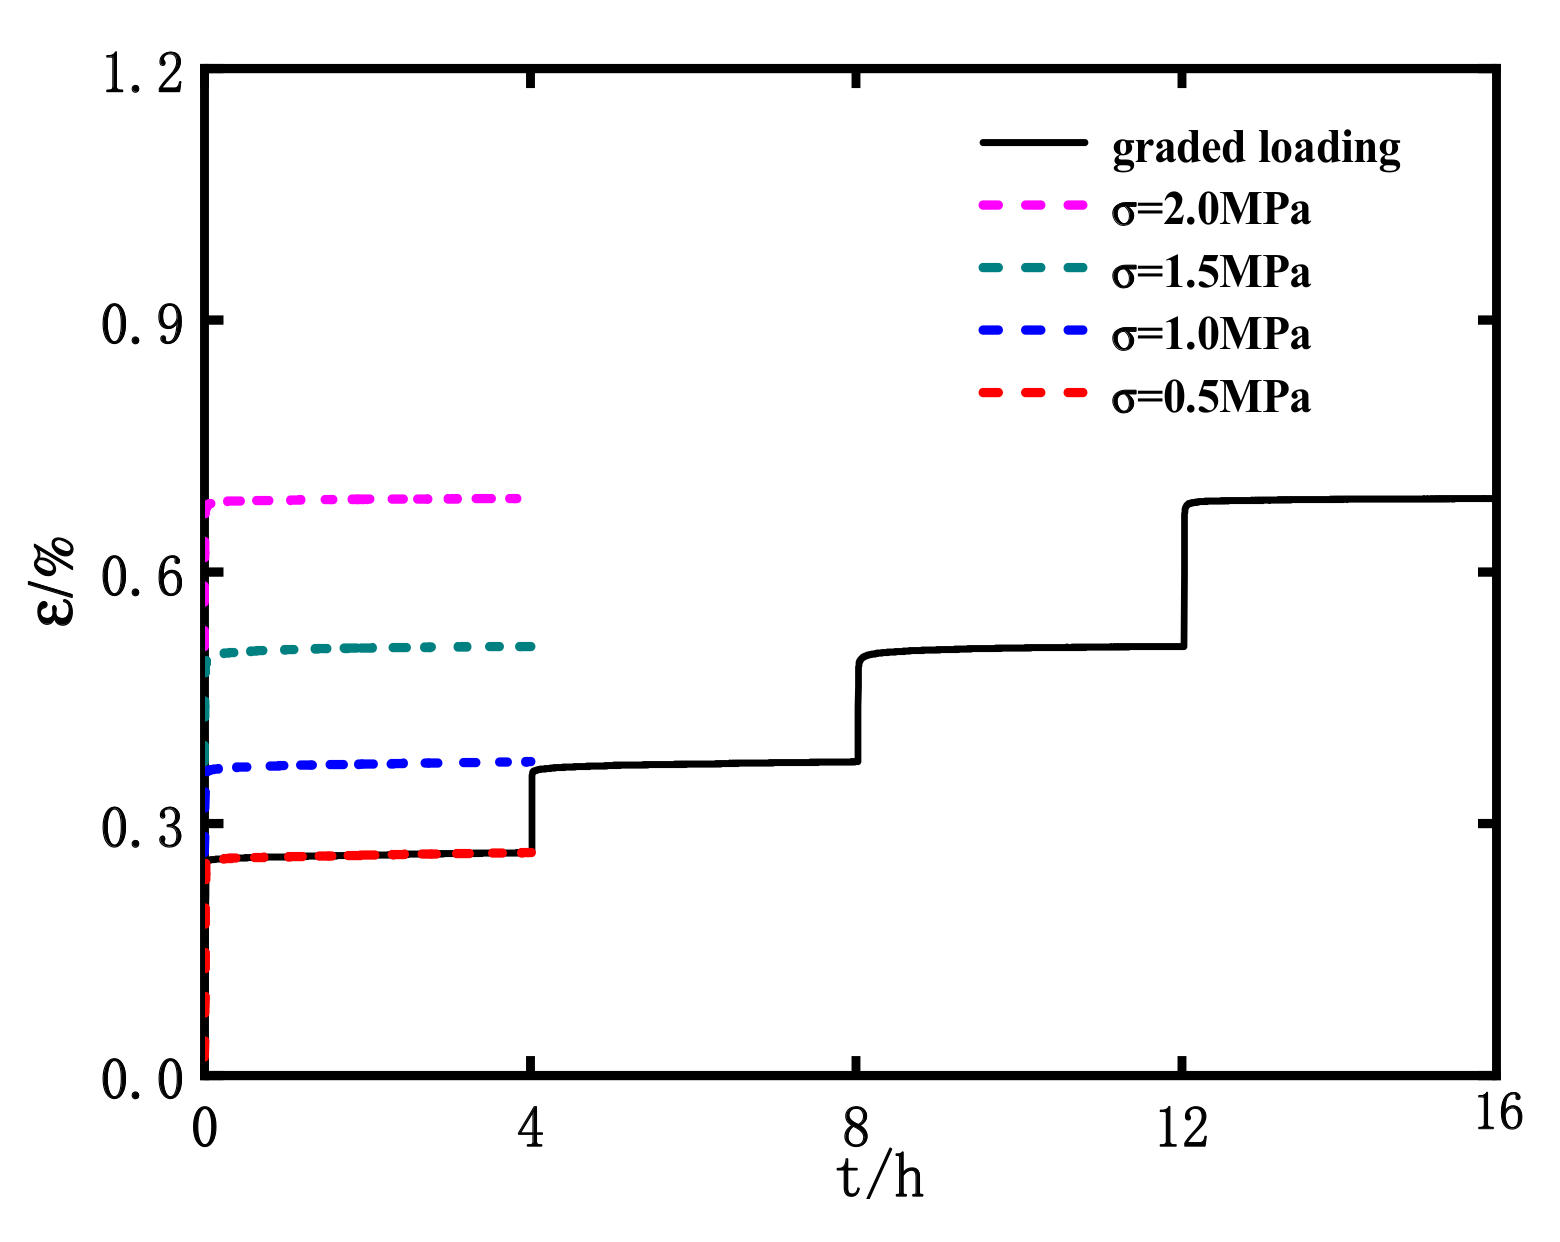
2.2. Creep Data Analysis Based on the Boltzmann Superposition Principle

The strain–time curve of material creep obtained by graded loading can reflect the basic creep properties of materials, but it cannot be directly applied to the establishment of the material creep constitutive model. It must be processed into a creep curve under one-time load. Based on comprehensive consideration, the Boltzmann superposition principle was introduced to process the strain–time curves of graded loading and the one-time loading of materials.
For the linear rheological body:
ε ( t ) = 0 t d σ ( τ ) d τ J ( t τ ) d τ
According to the Boltzmann superposition principle, for the creep behavior of a rock, the contribution of each stage loading to its creep deformation is independent, and the total creep is the linear sum of the superposition of creep stress generated by each load. Based on the Boltzmann superposition principle, the original graded loading curve is processed, as shown in Figure 1.
After the processing of the Boltzmann superposition principle, the curve can be compared with that of one-time loading more intuitively. As shown in Figure 2, the curve processed by the Boltzmann superposition principle shows a similar trend in the overall creep process as the one-time loading curve. However, due to the inhomogeneity of specimens, the instantaneous strain of materials in the early compaction process is different, so the two creep curves cannot completely coincide with each other.

3. The Creep Behavior of High-Solid-Water Materials with Different Water Contents under Graded Loading

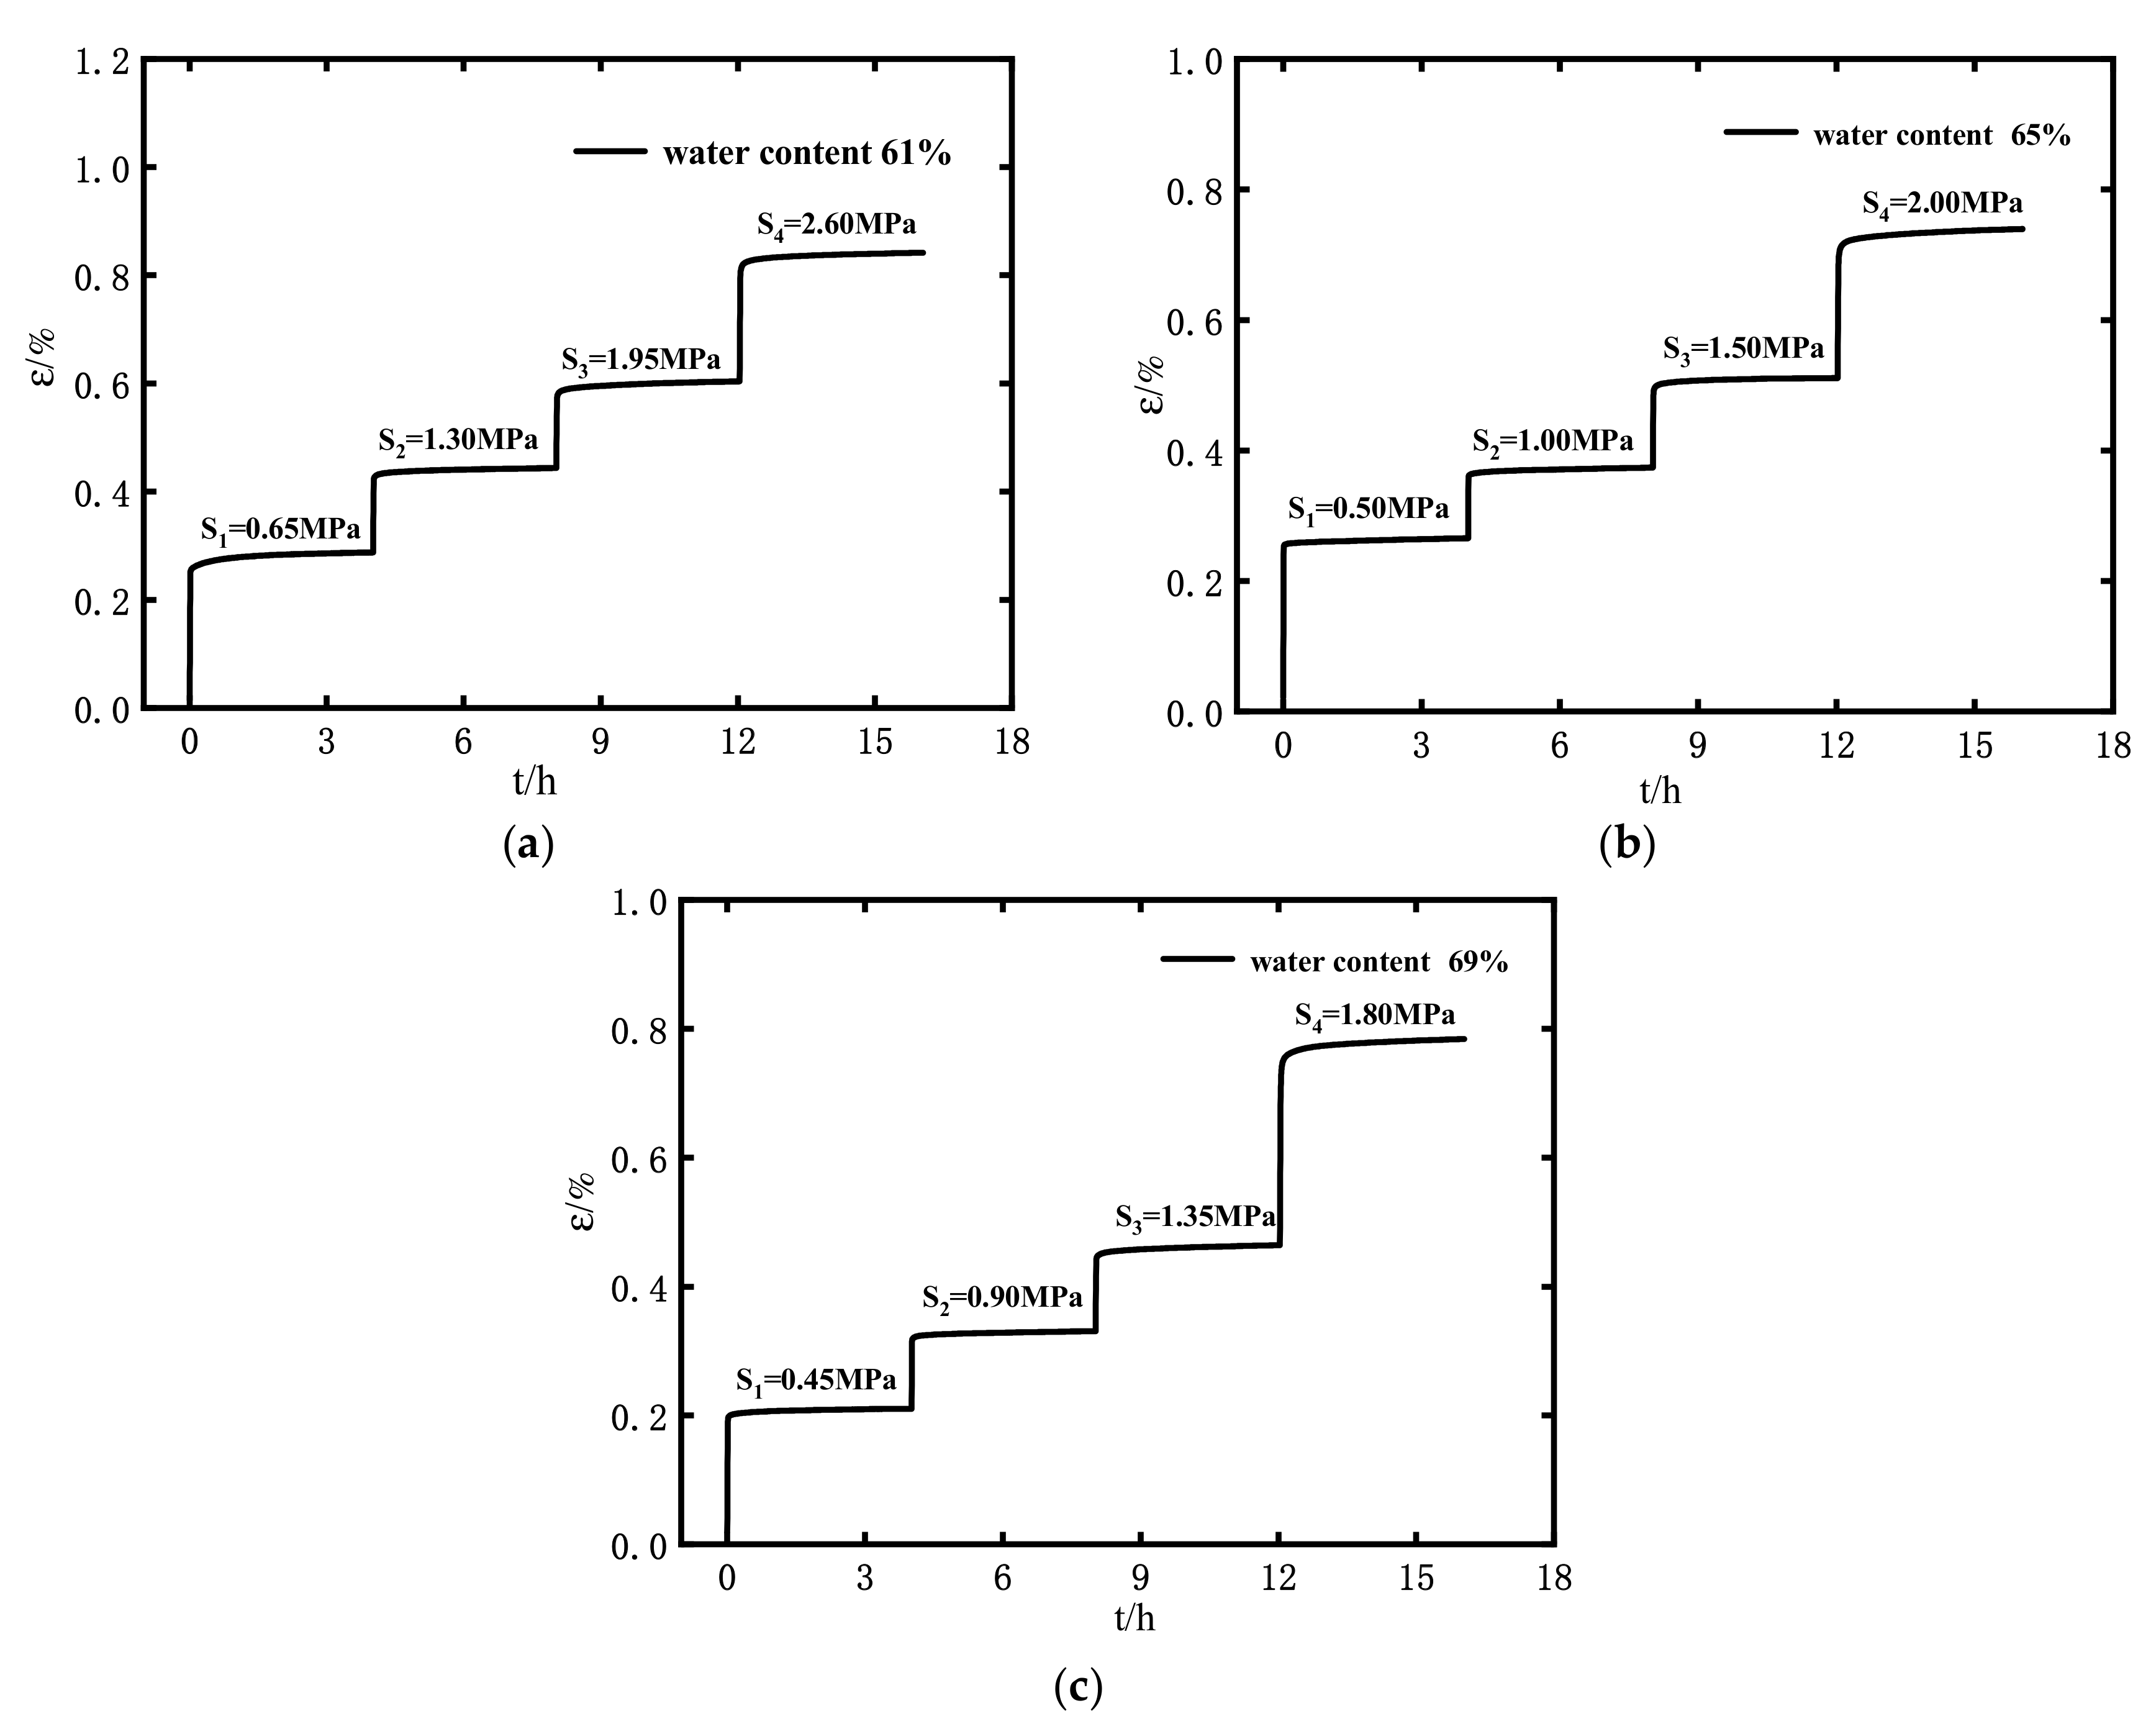
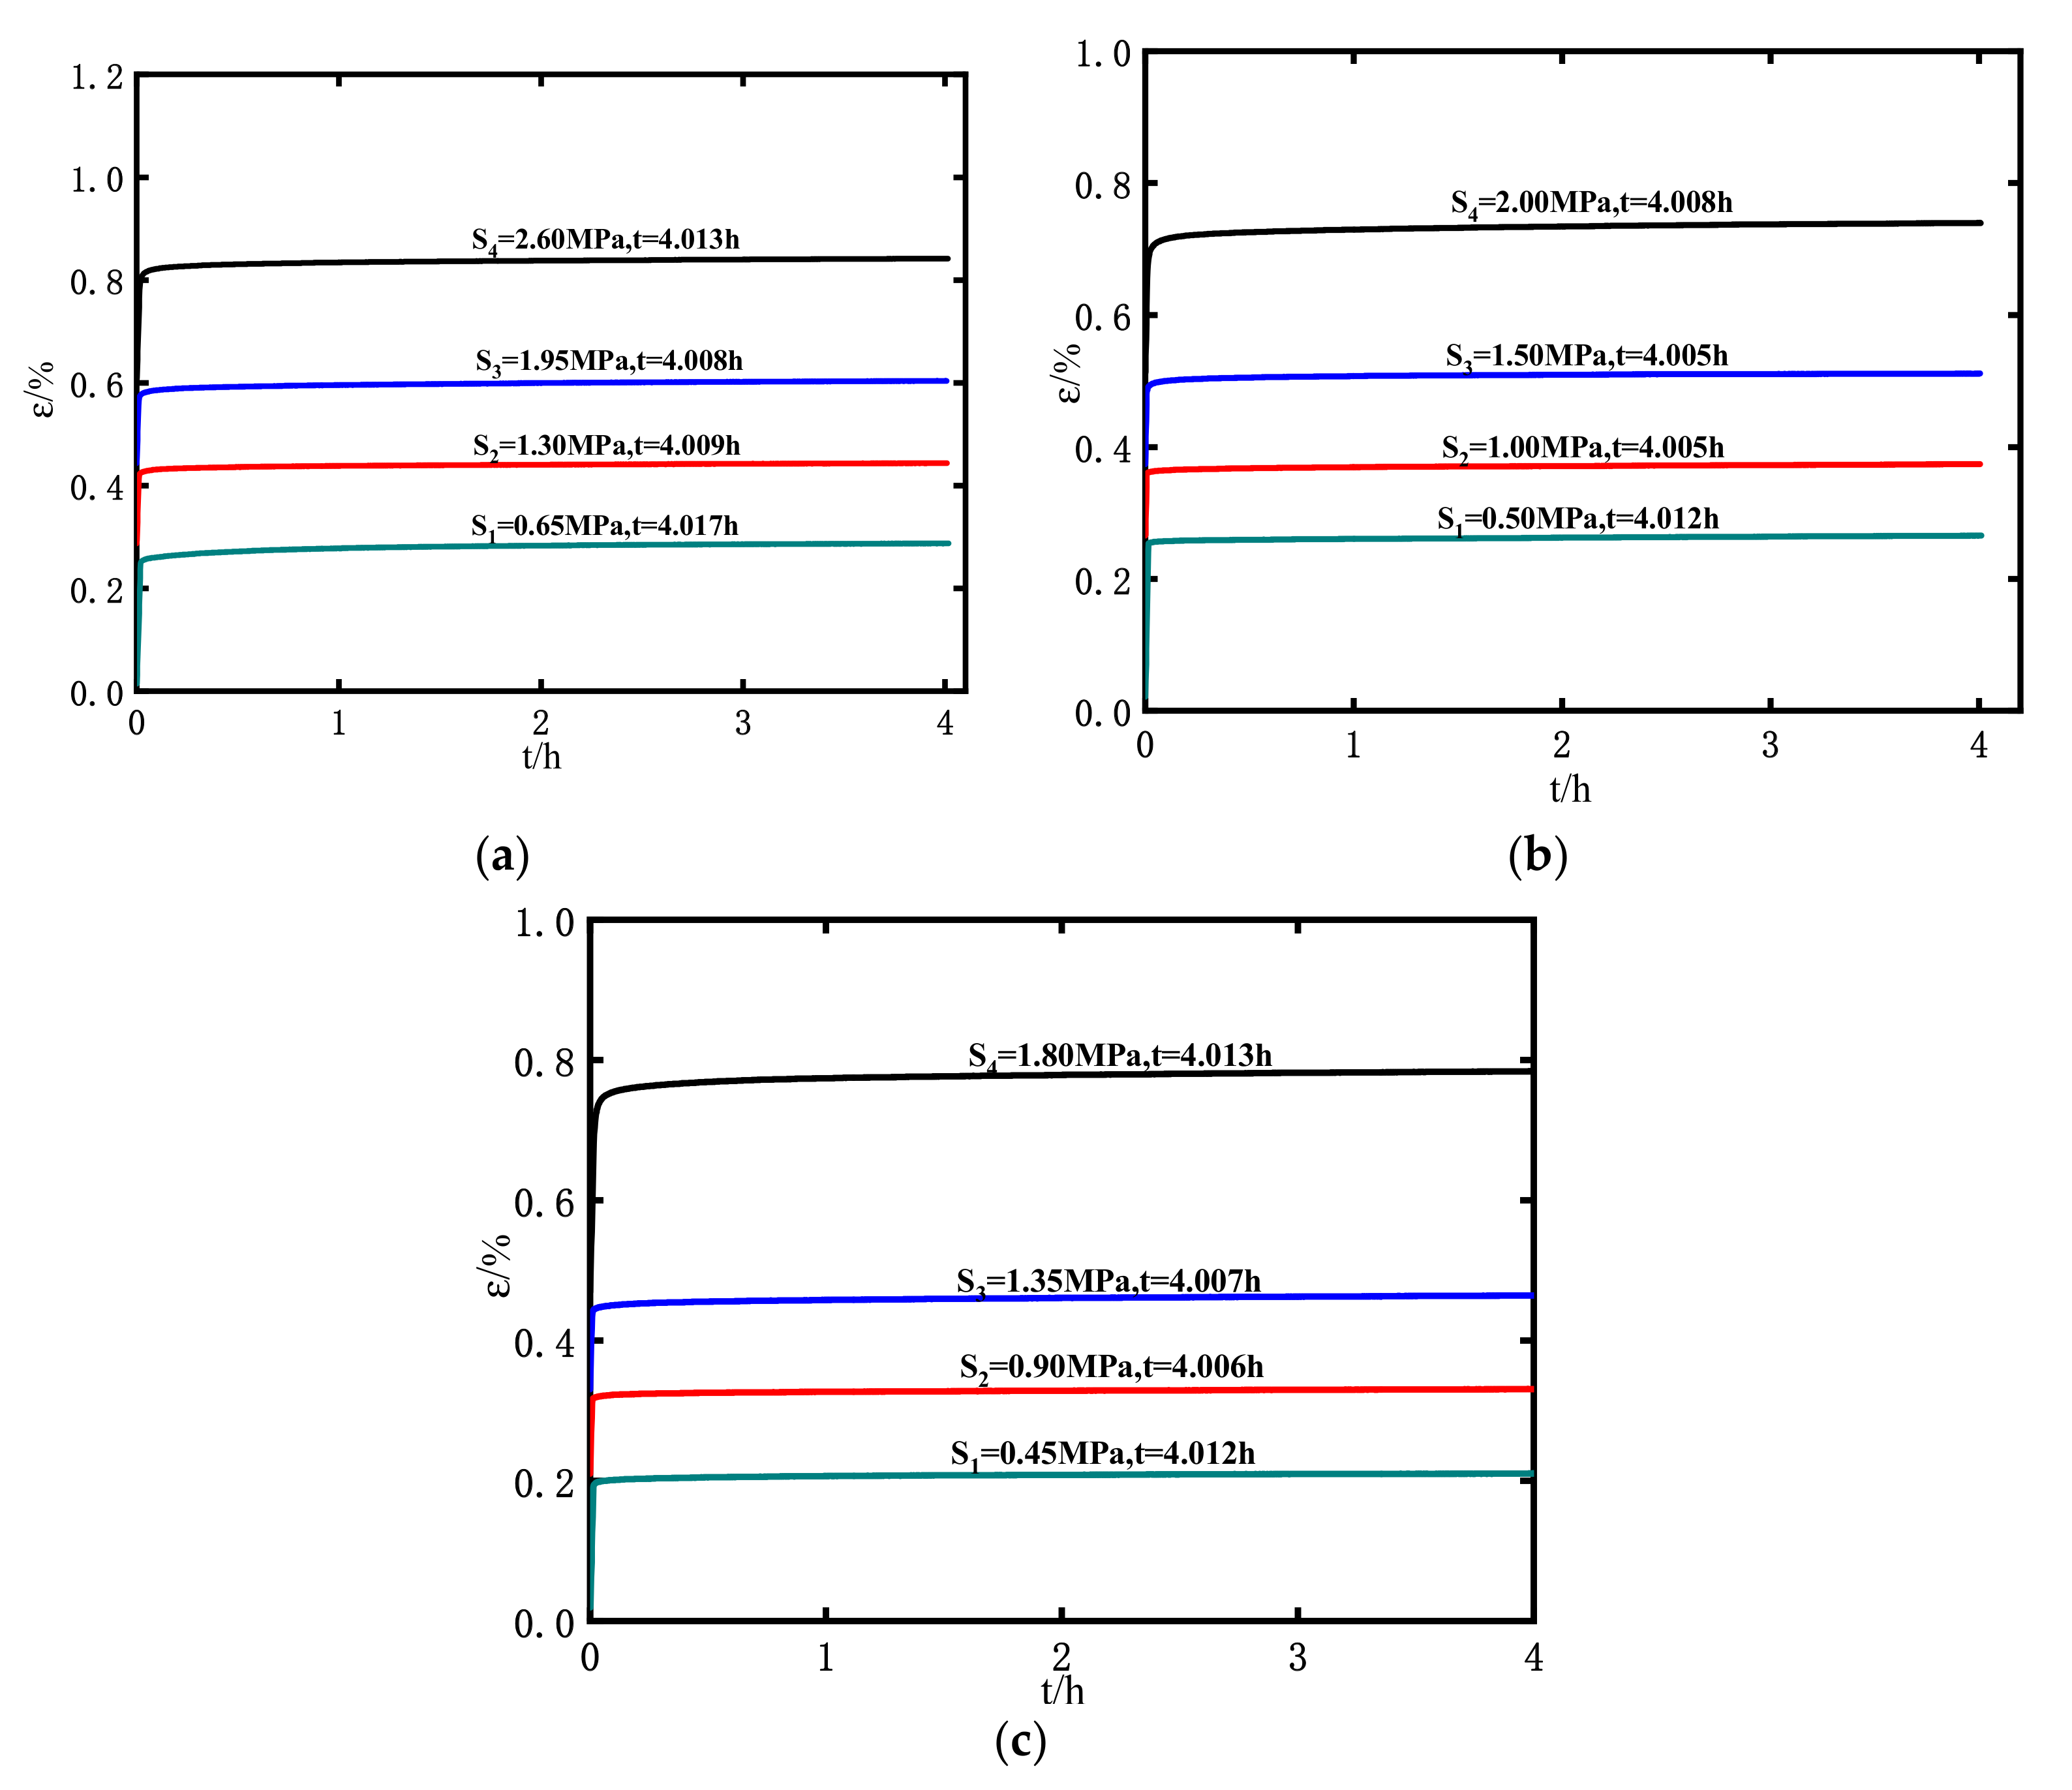
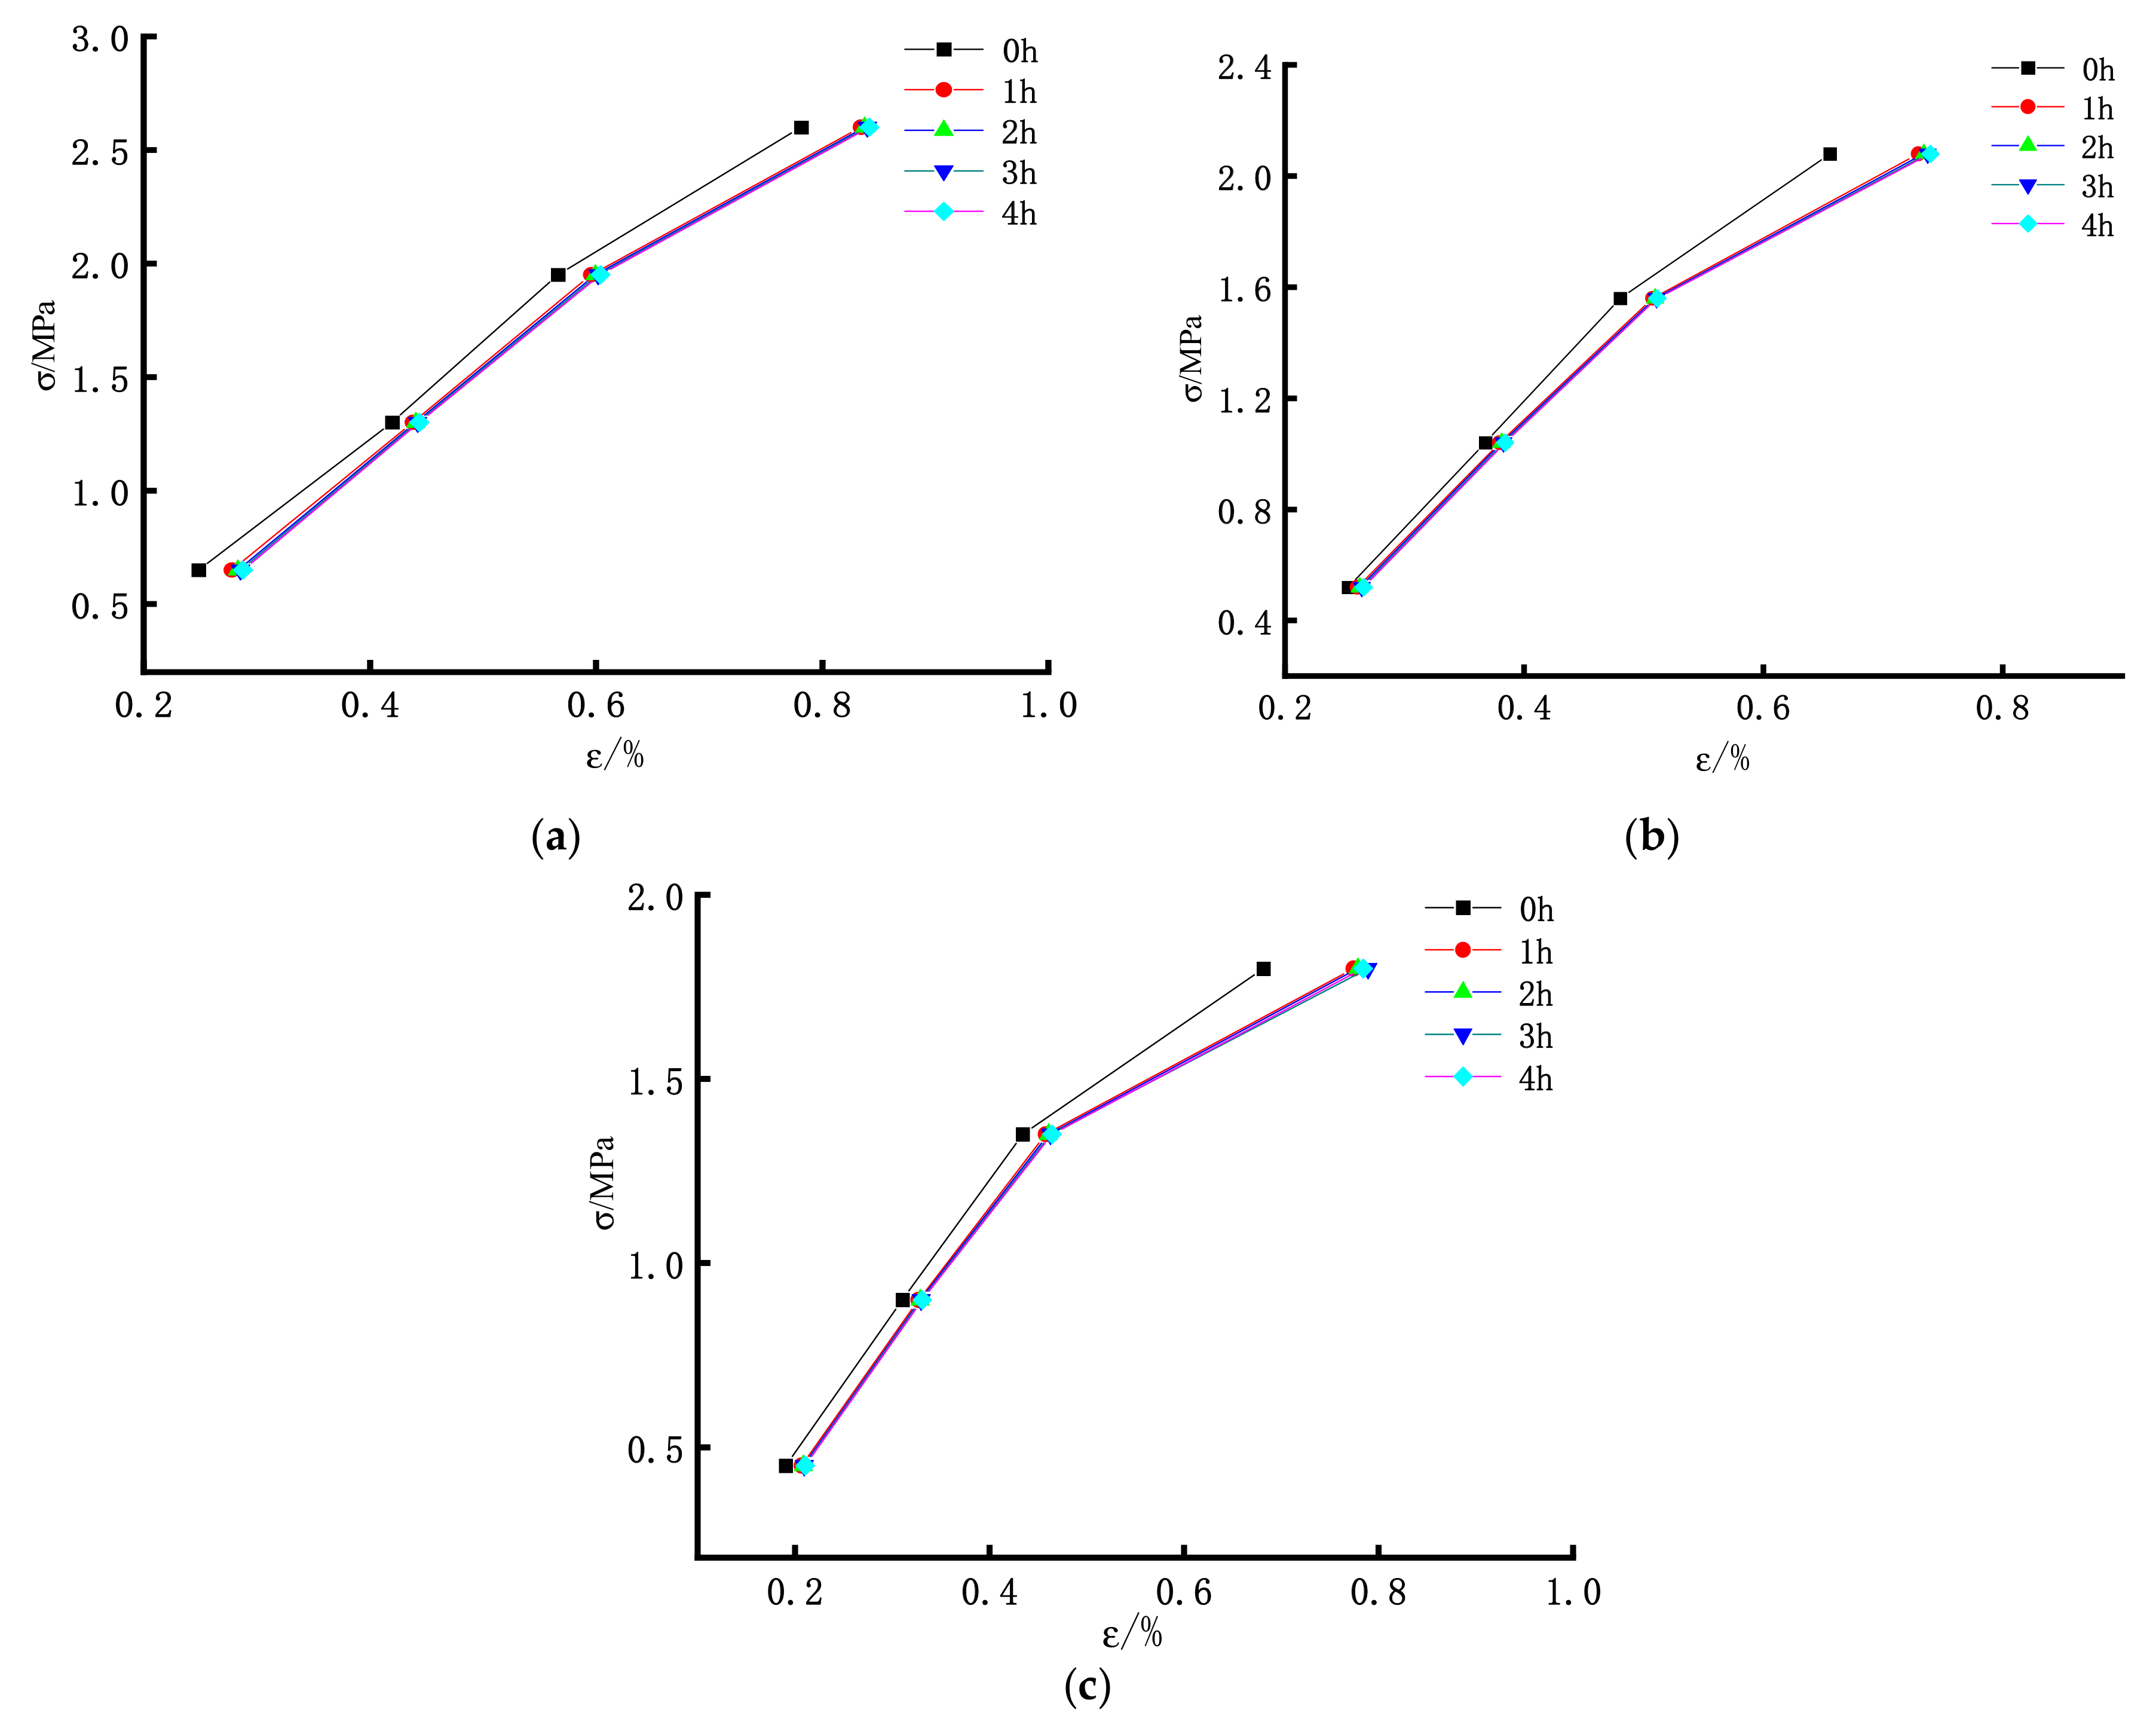
3.1. Test Scheme and Results

The creep behavior of specimens with 61%, 65% and 69% water contents were tested through graded loading. Since there was no obvious yield phenomenon of the material, the stress of graded loading was determined according to the axial stress peak corresponding to the specimens. Given that the elastic deformation of the material was relatively high, the stress was loaded by 22.5%, 45%, 67.5%, and 90% of the peak uniaxial strength of the specimens, respectively. The stress holding time of each graded loading was 4 h and the testing machine adopted the form of force load maintenance to maintain constant pressure. Table 5 shows the stress loading scheme.
Figure 3a–c display the creep strain–time curves of high-solid-water materials whose water content is 61%, 65%, and 69%, respectively, when the yield strength is 22.5%, 45%, 67.5%, and 90% of the peak uniaxial strength of the specimens, respectively. The instantaneous strain is generated by each grade loading. When the loading stress becomes constant, the strain rate of high-solid-water materials tends to be stable, and the material enters the creep strain stage.
Based on uniaxial creep tests of high-solid-water materials with different water contents, complete creep curves under four-stage loading were obtained for analyzing the change in axial creep stress variables of materials with different strengths and time, the creep rate change, the relationship between instantaneous strain and creep strain, and their respective contributions to creep.

3.2. Creep Characteristics of High-Solid-Water Materials

The creep of rock refers to the phenomenon that under the long-time action of certain stress, the rock deformation deteriorates with the increase in time. The creep performance of the rheological body is related to the size of the fixed load.
As is aforementioned, the Boltzmann superposition principle is used to process the graded loading curves. Accordingly, the strain–time curves of the axial creep of three high-solid-water materials with different water contents under different constant stresses can be obtained.
As is shown in Figure 4, no creep failure occurs in all the specimens of three high-solid-water materials with different water contents under four constant stresses. There are two possibilities for this situation: the given constant stress does not reach its threshold for creep failure, or the creep loading time is not enough to reach the failure time. Table 6 shows the relationship between instantaneous strain, creep strain, and total strain of specimens with different water contents under different constant stresses. On the whole, the proportion of creep strain increases with the increase in stress, but the proportion of instantaneous strain in total strain is always greater than that of creep strain.
As can be seen from Figure 4, the instantaneous strain of each specimen remains relatively higher at the first grade of loading. As the statistics in Table 6 show, the instantaneous strain of the specimen with 61% water content reaches 2.510 × 10⁻³ at the first grade of loading, which is far higher than that of the second grade of loading, which is 1.344 × 10⁻³. The instantaneous strain of the specimen with 65% and 69% water contents reaches 2.471 × 10⁻³ and 1.941 × 10⁻³ at the first grade of loading, which is also higher than that of the second grade of loading. This is because the stress–strain curve of the materials is not linear in an ideal sense. In the early compaction stage, the material enters the elastic stage after a period of compaction process. Therefore, the strain generated by the compaction is relatively large in the early stage of loading.
Combined with the strain–time curves of three types of materials with high water contents, it can be seen that the total strain of the materials gradually increases with the increase in loading stress, and the change rate of the total strain of the materials also increases with the increase in material water content. However, during the first three grades of loading, the increase amplitude of instantaneous strain and creep strain does not change significantly. The creep strain of the specimen with 61% water content at the second grade of loading is 0.221 × 10⁻³; this is lower than that of the first grade of loading, which is 0.364 × 10⁻³. Considering that the material should be in the elastic compression stage during the first three grades of loading, the strain presents a linear growth trend with the increase in loading stress, and the theoretical value of strain increment should be equal. However, because the material does not belong to linear elastomer, its strain increment is slightly different. Under the action of the last grade of stress, both creep strain and instantaneous strain increase significantly. This is because the material displays obvious plastic deformation characteristics during the last grade of loading, resulting in high instantaneous strain and creep strain. As the water content increases, the strain increases by a greater amplitude. As for the specimen with 61% water content, the total strain of the last grade of loading is 2.379 × 10⁻³, increasing by 48.69% compared with that of the previous grade of loading, which is 1.600 × 10⁻³. Similarly, as for the specimen with 65% water content, the total strain of the last grade of loading increases by 65.61% compared with that of the previous grade; as for the specimen with 69% water content, the total strain increases by 139.81%. The more pores there are inside the specimen, the faster the strain is generated and the higher the growth rate will be under the action of constant stress, and correspondingly, the poorer the material stability is.
With the increase in constant stress applied, the instantaneous strain and creep strain of three kinds of high solid materials with different water contents increase accordingly. As shown in Table 6, this is because with the increase in stress, the internal pores of the specimens are continuously compacted, and the instantaneous strain will increase accordingly. In the creep process, the creep strain of the specimens will be generated with the increase in time, and a higher level of constant stress will promote the generation of the creep strain.
However, the proportion of instantaneous strain to total strain decreases with the increase in constant stress, while the proportion of creep strain to total strain increases with the increase in stress. This is because in the graded loading, the variation in stress at each grade is constant. If the specimen is in the stage of elastic deformation, the instantaneous strain at each grade of loading should be the same theoretically, while the creep strain will increase with the increase in the constant stress. This in turn leads to the increase in the creep strain proportion with the increase in the constant stress.

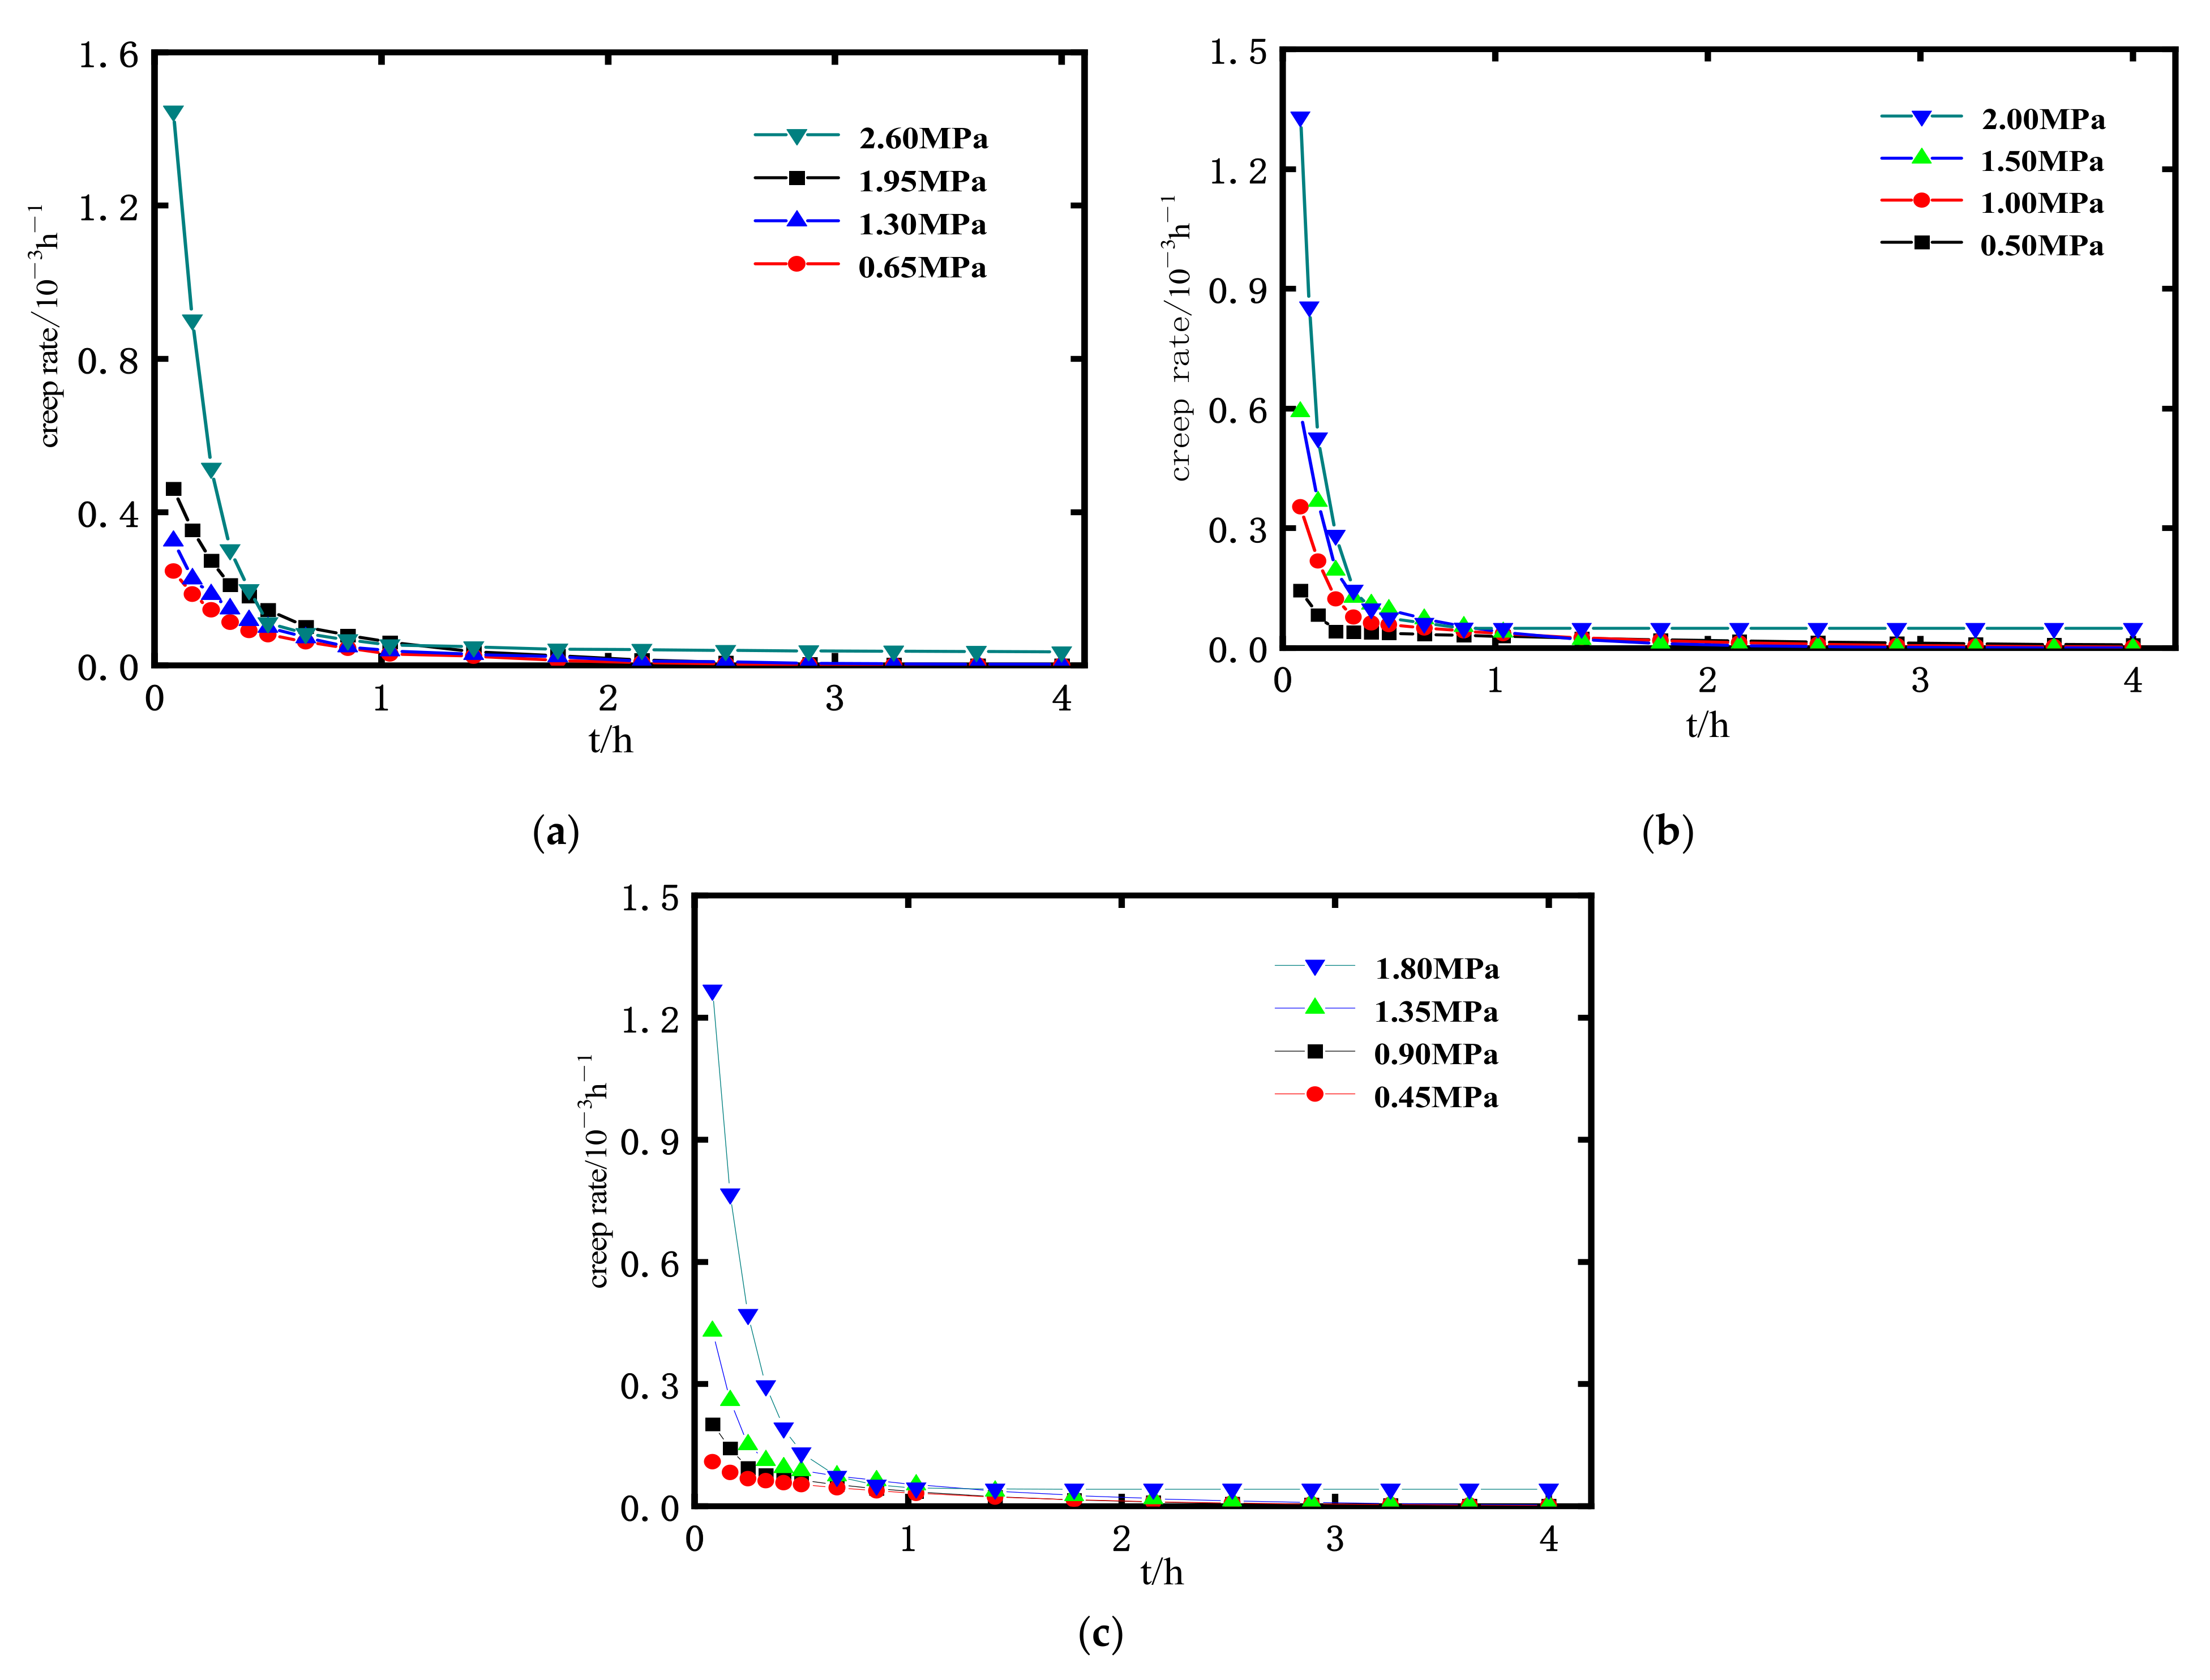
3.3. Creep Rate of High-Solid-Water Materials

The creep rate of high-solid-water materials is one crucial parameter for the assessment of creep characteristics. In this section, the stress–strain curves of the high-solid-water materials with different water contents were segmented according to the loading time. Then, the Origin least square method was used to linearly fit the segmented curves, and the slope obtained was the instantaneous creep rate of the specimens.
For the material with 69% water content, the creep rate of the first three grades of loading is significantly lower than that of the fourth grade. At the first three grades of loading, the material is basically in the elastic deformation stage. With the increase in loading stress, the creep rate also increases correspondingly. However, due to the limited applied stress, there is basically no plastic deformation inside the material, and the creep deformation rate changes little. At the fourth grade of loading, due to the large loading stress, which is about 90% of its peak strength, obvious plastic deformation appears in the material, and its internal micro-cracks also begin to expand sharply, thus showing a large creep deformation rate. The creep rate of the material increases with the increase in stress level. Obviously, the rate of pore compaction in the material increases sharply due to the increase in loading constant stress.
As can be seen from Figure 5, for the specimens with different water contents, the creep rate does not show remarkable correlation with water content during the first three grades of loading. When the loading enters the fourth grade, the creep rate declines slightly with the increase in water content. For the specimen with 61% water content, its maximum creep rate is approximately 1.44 × 10⁻³/h; the maximum creep rate of the specimen with 65% water content is approximately 1.33 × 10⁻³/h; and that of the specimen with 69% water content is 1.27 × 10⁻³/h, being the lowest among the three.
This phenomenon may be explained as follows: the creep rate of the three materials is not large in the elastic stage, with no obvious characteristics. At the last grade of loading, the plastic deformation of the material is obvious, but with the increase in water content, the viscous force brought by the internal pore water is greater, so the failure rate is smaller. In the creep process of the three types of materials, although the specimens are not damaged at the fourth grade of loading, the creep rate still maintains a large value in the late loading period. It is preliminarily speculated that if the constant stress applied continues to be loaded for a long time, the deformation will be accelerated in the creep process.

3.4. The Determination of Long-Term Strength

According to the isochronous stress–strain curve method, the inflection point on the isochronous stress–strain curve under different constant stresses denotes the long-term strength of the material. The isochronous stress–strain curves obtained in this experiment are shown in Figure 6.
By observing the isochronous stress–strain curve of the material, the range of long-term strength of the high-solid-water material can be roughly determined. For all the three types of materials, the inflection point appears after the third grade of loading. However, it is difficult to determine the specific value of the inflection point because the data of each curve are too insufficient under graded loading. According to the present test results, the stress applied at the third grade of loading can be taken as the long-term strength value of uniaxial loading. To be specific, the long-term strength of the material with 61% water content is 1.95 MPa, and that of the materials with 65% and 69% water content is 1.5 Mpa and 1.35 MPa, respectively, as shown in Table 7. However, the results obtained with this method are relatively conservative.
As for the fact that there is no failure appearing in the curve after the fourth grade of loading, it can be determined based on the creep rate characteristics depicted in Section 3.3 that this is caused by insufficient creep time. If the applied constant stress lasts long enough, creep deformation will eventually appear under the action of the 90% of peak stress.

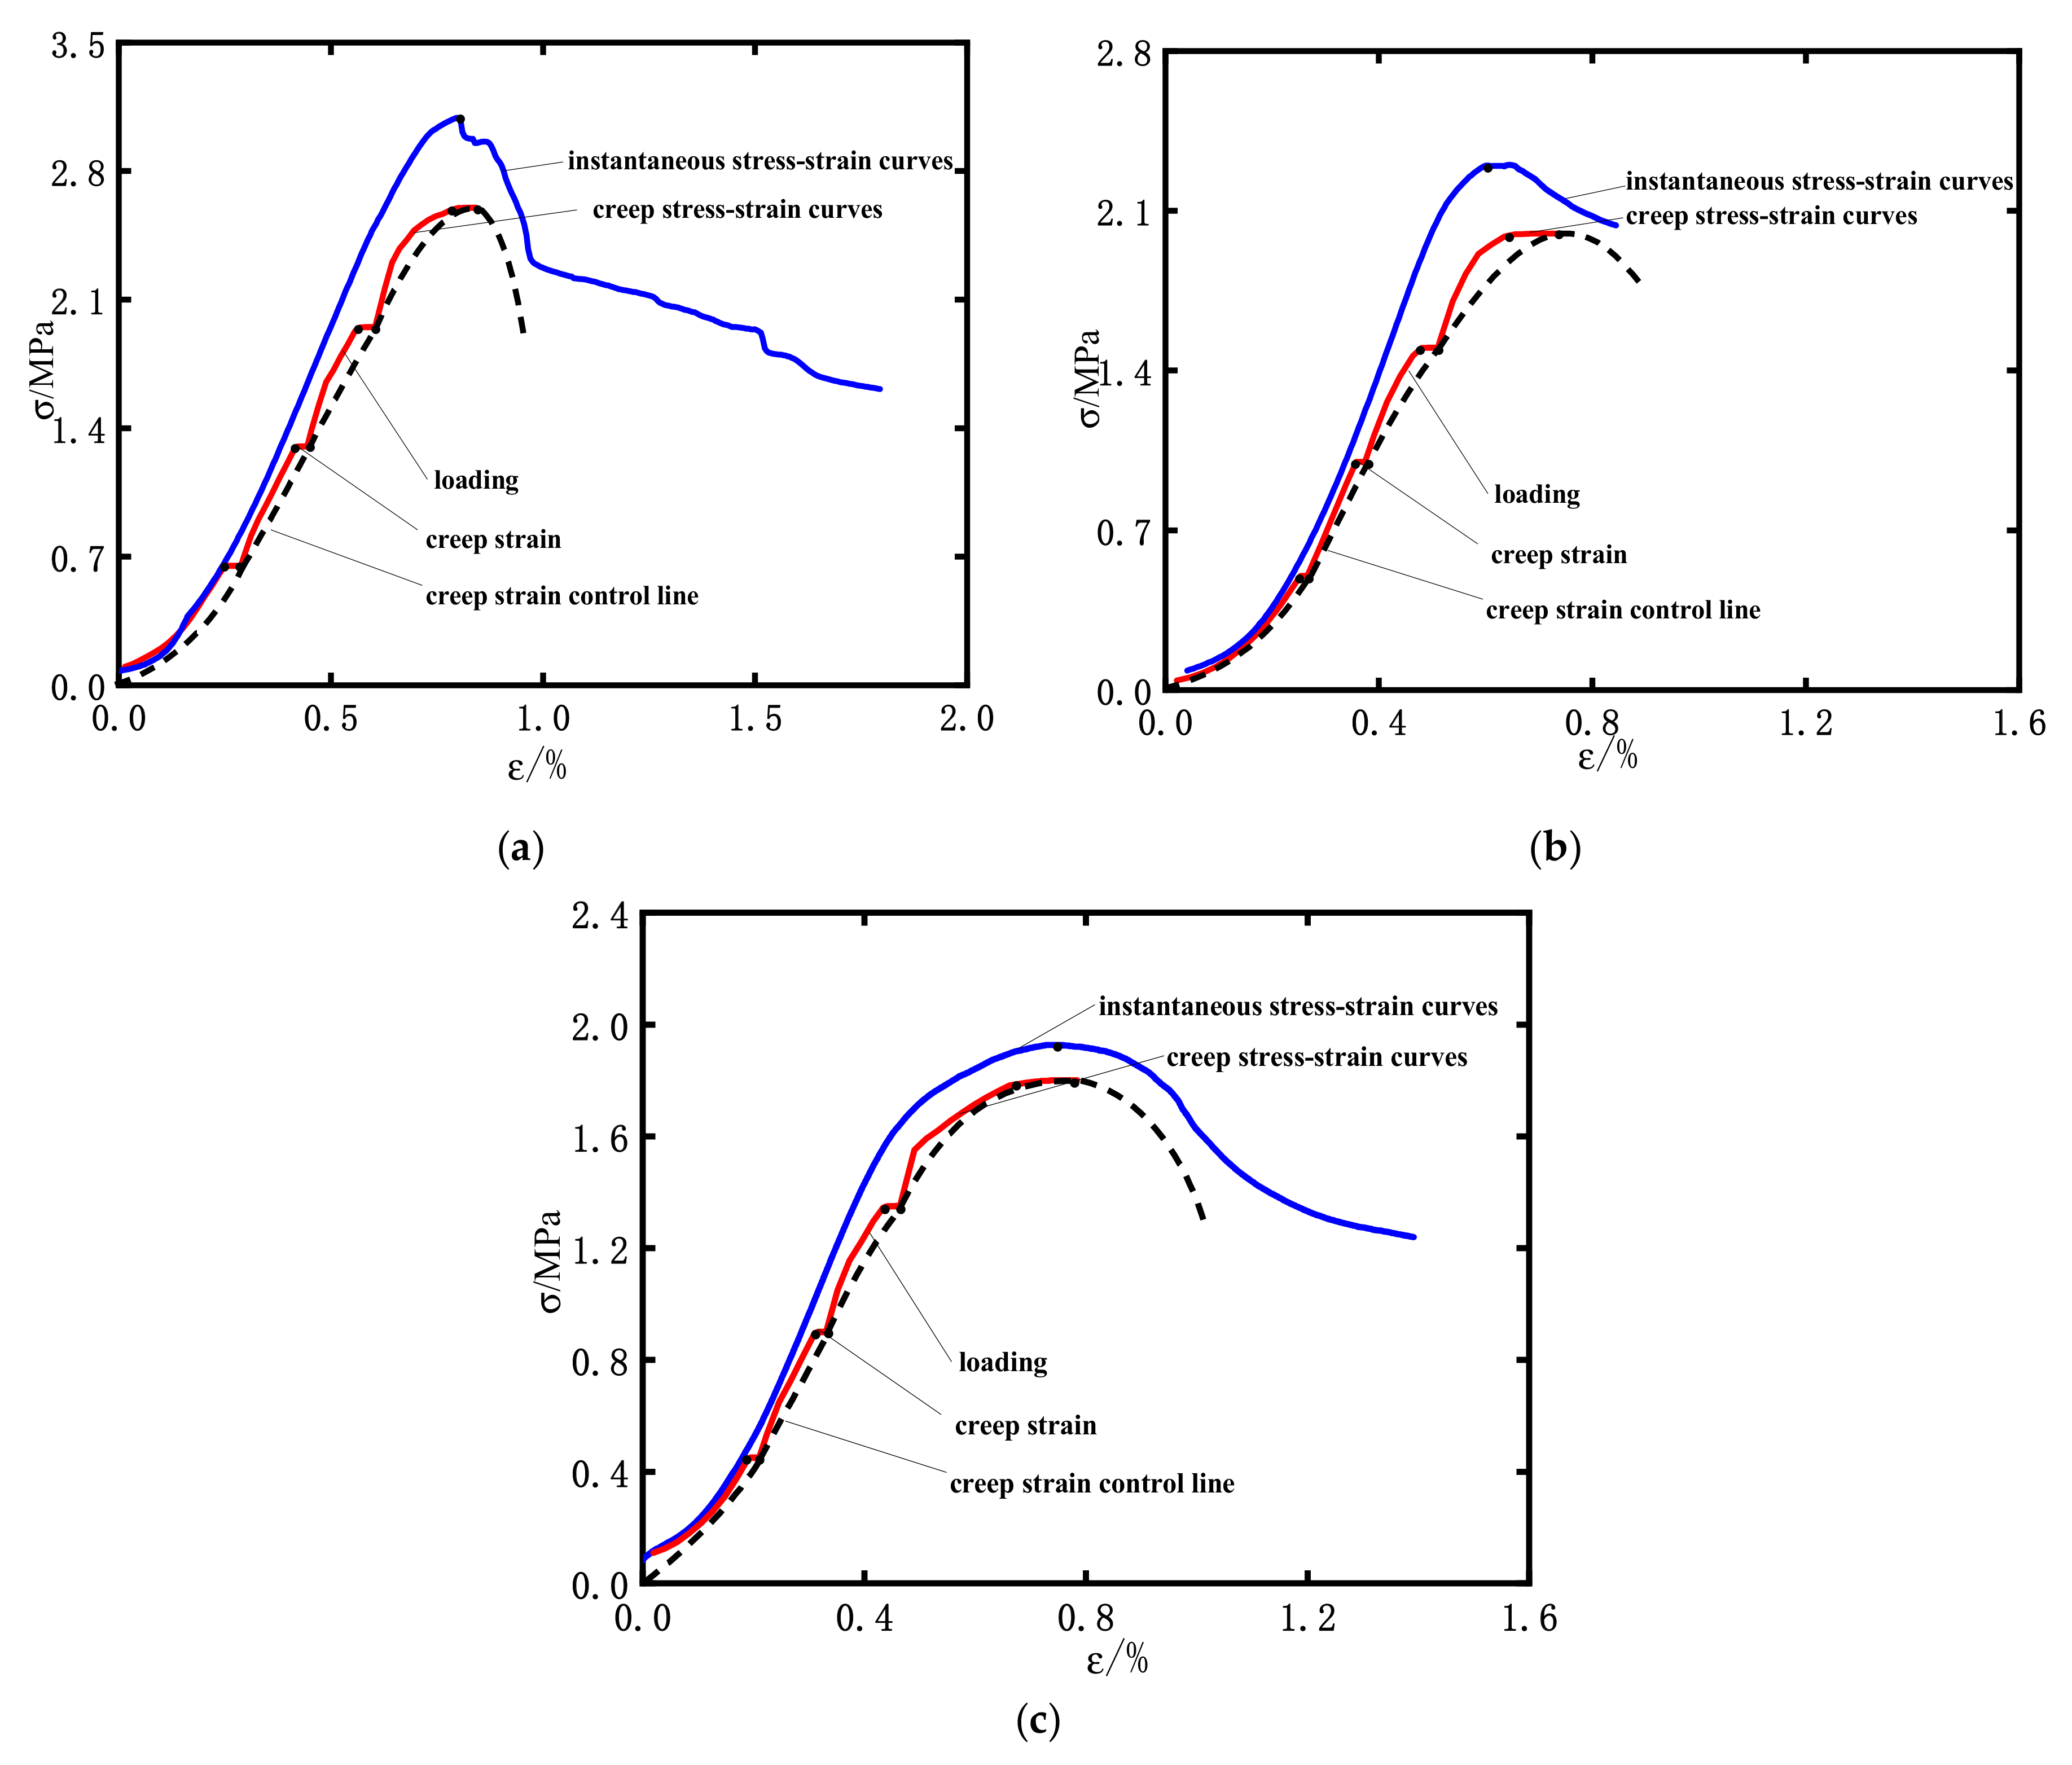
3.5. The Comparison of Instantaneous and Creep Stress–Strain Curves

Figure 7 shows the instantaneous and creep stress–strain curves of high-solid-water materials with different water contents. Although the materials do not fail during this grade of loading, it can be determined according to the isochronous stress–strain curve that the long-term strength should be between the third grade and the fourth grade, and the materials will eventually fail under the continuous action of the fourth grade of stress. Therefore, no creep test is carried out under the next grade of stress loading.
As shown in Figure 7, in the creep test, the strain of the specimens with different water contents is uniformly larger than the strain observed in the ordinary uniaxial test. All the three groups of curves share the following common characteristics:
Theoretically, when the first grade of stress is loaded, the instantaneous deformation curve should coincide with the ordinary uniaxial loading curve. Due to individual differences, the two curves differ slightly. However, according to the trend of the curve, the elastic moduli of the two curves are highly similar. Moreover, in the late stage of the first grade of stress loading, the material begins to enter the stage of elastic deformation.
At the second grade of stress loading, as can be seen from the figure, the creep stress–strain curve and uniaxial stress–strain curve do not display any obvious change, except for the difference in the overall strain; the two curves are still in the elastic deformation stage. At the third grade of stress loading, the elastic modulus of the creep curve decreases somewhat compared with that of the uniaxial compression curve. At the later stage of loading, the creep curve is no longer in the elastic stage; plastic deformation begins to appear, and the uniaxial stress–strain curve is still in the elastic compression stage. At the fourth grade of stress loading, the instantaneous strain and creep strain of the creep curve increase obviously, and plastic deformation begins to appear in the uniaxial stress–strain curve until the final failure of the material.

4. Conclusions

This article develops a new type of high-solid-water filling material with superior mechanical properties through various ratios of high-solid-water filling materials with different water contents. Through graded loading, the creep characteristics of high-solid-water filling materials under different water content conditions are studied. We have explained the creep curves of high-solid-water filling materials under different water content conditions and studied the characteristics of the materials, such as creep rate, steady-state creep rate, long-term strength and creep strain curve. The specific conclusions are as follows:
(1) The high-solid-water filling materials with a water content of 61%, 65%, and 69% have a decrease in the single slurry flowability with time; the lower the water content, the greater the loss of flowability. The early strength of high-solid-water filling materials increases rapidly, reaching over 50% of the 28 d strength in 8 h. After 1 day of material curing, the strength reaches about 75% of the 28-day strength, and then the hydration reaction begins to slow down; The material can reach over 90% of the 28-day strength at 7 days. The high-solid-water filling material has high early strength and can better meet the filling requirements.
(2) The instantaneous strain and creep strain of high-solid-water materials increase with the increase in constant stress, and the proportion of instantaneous strain decreases with the increase in constant stress. The curve treated by the Boltzmann superposition principle has basically the same change trend in the overall creep process and the creep curve under separate loading. However, due to the non-uniformity of the specimen, the instantaneous strain of the material in the early compaction process is different; this leads to the two types of creep curves, which cannot be completely coincident.
(3) The creep rate of the material increases with the increase in stress level. Due to limited applied stress, there was almost no plastic deformation inside the material during the first three stages of loading, and the creep rate was significantly lower. During the first three stages of loading, the increase in instantaneous and creep strains was not significant. However, during the fourth stage of loading, the total creep and creep strains increased significantly, indicating that only when the constant stress reached a certain level did the specimen generate significant creep strain.
(4) By using the isochronous stress–strain curve, the range of long-term strength of the material can be determined. Conservatively, the stress intensity of the third level loading can be considered as long-term strength and can be used for on-site applications. The sample will undergo irreversible failure under long-term stress during the fourth level loading. The long-term strength of high-solid-water filling materials with different water contents is of great guiding significance for goaf filling, and are key data for selecting goaf-filling materials.

Author Contributions

Conceptualization, J.Z. and Y.Z.; methodology, J.Z.; software, J.Z.; validation, J.Z.; formal analysis, Y.Z.; investigation, Y.Z.; resources, Y.Z.; data curation, J.Z.; writing—original draft preparation, J.Z.; writing—review and editing, Y.Z., J.Z., M.W. and Y.X.; visualization, Y.X. and S.L.; supervision, Y.X. and X.L.; project administration, J.Z. and Z.Y.; funding acquisition, J.Z. All authors have read and agreed to the published version of the manuscript.

Funding

This research was funded by Open Research Fund of State Key Laboratory of Coking Coal Exploitation and Comprehensive Utilization, China Pingmei Shenma Group, Grant NO. 41040220201132T, National Key R&D Program of China, Grant No. 2022YFE0129100, National Natural Science Foundation of China, Grant No. 51874289, China Postdoctoral Science Foundation, Grant No. 2022M723396.

Institutional Review Board Statement

Not applicable.

Informed Consent Statement

Informed consent was obtained from all subjects involved in the study.

Data Availability Statement

The data presented in this study are available upon request from the corresponding author.

Conflicts of Interest

The authors declare no conflict of interest.

References

  1. Luo, Z.; Li, J.; Wang, L.; Assefa, E.; Deng, H. Study on the Creep Characteristics of Sandstone under Coupled Stress-water Pressure. Period. Polytech. Civ. Eng. 2019, 63, 1038–1051. [Google Scholar] [CrossRef]
  2. Abouchakraguery, A.; Cormery, F.; Su, K.; Shao, J.; Kondo, D. A micromechanical model for the elasto-viscolastic and damage behavior of a cohesive geomaterial. Phys. Chem. Earth 2008, 33, 416–421. [Google Scholar] [CrossRef]
  3. Zhou, H.; Jia, Y.; Shao, J.F. A unified elastic-plastic and viscoplastic damage model for quasi-brittle rocks. Int. J. Rock Mech. Min. Sci. 2008, 45, 1237–1251. [Google Scholar] [CrossRef]
  4. Griggs, D.T. Creep of rocks. J. Geol. 1939, 47, 225–251. [Google Scholar] [CrossRef]
  5. Ito, H.; Sasajima, S. A thirty-year creep experiment on small rock specimens. Int. J. Rock Mech. Min. Sci. 1987, 24, 113–121. [Google Scholar] [CrossRef]
  6. Fujii, Y.; Kiyama, T.; Ishijima, Y.; Kodama, J. Circumferential strain behavior during creep tests of brittle rocks. Int. J. Rock Mech. Min. Sci. 1999, 36, 323–337. [Google Scholar] [CrossRef]
  7. Gasc-Barbier, M.; Chanchole, S.; Berest, P. Creep behavior of Bure clayey rock. Appl. Clay Sci. 2004, 26, 449–458. [Google Scholar] [CrossRef]
  8. Zhang, Y.P.; Cao, P.; Zhao, Y.L. Visco-Plastic Rheological Properties and a Non-linear Creep Model of Soft Rocks. J. China Univ. Min. Technol. 2009, 38, 34–38. [Google Scholar]
  9. Shen, W.W.; Yuan, P.B.; Liu, X.W. Study on creep properties of red-bed soft rock under step load. Chin. J. Rock Mech. Eng. 2009, 28, 3076–3081. [Google Scholar]
  10. Tsai, L.S.; Hsieh, Y.M.; Weng, M.C.; Huang, T.H.; Jeng, F.S. Time-dependent deformation behaviors of weak sandstones. Int. J. Rock Mech. Min. Sci. 2008, 45, 144–154. [Google Scholar] [CrossRef]
  11. Dubey, R.K.; Gaiola, V.K. Influence of structural anisotropy on creep of rock salt from Slimla Himalaya, India: An experimental approach. J. Struct. Geol. 2008, 30, 710–718. [Google Scholar] [CrossRef]
  12. Wang, Y.Y.; Wang, Y.C. Numerical simulation of creep law in deep soft rock tunnel under thermal-mechanical-chemical coupling effect. J. China Coal Soc. 2012, 37, 275–279. [Google Scholar]
  13. Wang, Y.C. Study on the Mechanical Properties of Mudstone Creep and Timeliness of Slope Deformation and Support in Badong Formation. Ph.D. Thesis, China University of Geosciences, Wuhan, China, 2018. [Google Scholar]
  14. Yang, Q. Creep Mechanical Properties of Artificially Frozen Sandy Mudstone in Western Cretaceous Formation. Master’ s Thesis, Xi’an University of Science and Technology, Xian, China, 2018. [Google Scholar]
  15. Sun, K.H.; Zhang, R. Experimental Study on the Characteristics of Aeolian Sand Paste-Like Stowing Material in Coal Mine. Adv. Mater. Res. 2014, 962, 1020–1024. [Google Scholar] [CrossRef]
  16. Qin, G.P.; Wen, Z.J.; Li, A.M.; Zhu, Z.W.; Sun, P.P. Experimental Research and Application of Mining with Paste Material Stowing. Appl. Mech. Mater. 2012, 121, 1416–1420. [Google Scholar] [CrossRef]
  17. Sun, H.H. Commercial scale trial of a new consolidated backfill technology of full-range tailings with high water content. Non-Ferr. Met. 1993, 45, 7–13. [Google Scholar]
  18. Wang, X.M.; Guo, J.; Zhang, Q.L.; Peng, X.C. Using high water quick cementing material as packing cementing agent—A study. Met. Mater. Metall. Eng. 1998, 18, 1–4. [Google Scholar]
  19. Ermolovich, E.A.; Ivannikov, A.L.; Khayrutdinov, M.M.; Kongar-Syuryun, C.B.; Tyulyaeva, Y.S. Creation of a Nanomodified Backfill Based on the Waste from Enrichment of Water-Soluble Ores. Materials 2022, 15, 3689. [Google Scholar] [CrossRef] [PubMed]
  20. Kongar-Syuryun, C.B.; Faradzhov, V.V.; Tyulyaeva, Y.S.; Khayrutdinov, A.M. Effect of activating treatment of halite flotation waste in backfill mixture preparation. Min. Inf. Anal. Bull. 2021, 2021, 43–57. [Google Scholar] [CrossRef]
  21. Khayrutdinov, A.; Kongar-Syuryun, C.; Kowalik, T.; Faradzhov, V. Improvement of the backfilling characteristics by activation of halite enrichment waste for non-waste geotechnology. IOP Conf. Ser. Mater. Sci. Eng. 2020, 867, 012018. [Google Scholar] [CrossRef]
Figure 1. The curve of one-time loading after the processing of the Boltzmann superposition principle.
Sustainability 15 09675 g001
Figure 2. Comparison of the curve processed by the Boltzmann superposition principle and one-time loading curve.
Sustainability 15 09675 g002
Figure 3. Creep curves of high-solid-water materials with different water contents. (a) Material with 61% water content; (b) material with 65% water content; (c) material with 69% water content.
Sustainability 15 09675 g003
Figure 4. Axial strain–time diagram at different loading grades. (a) Material with 61% water content; (b) material with 65% water content; (c) material with 69% water.
Sustainability 15 09675 g004
Figure 5. Creep rate curve of specimens with different water contents. (a) Specimen with 61% water content; (b) specimen with 65% water content; (c) specimen with 69% water content.
Sustainability 15 09675 g005
Figure 6. Isochronous stress–strain curves of specimens with different water contents. (a) Specimen with 61% water content; (b) specimen with 65% water content; (c) specimen with 69% water content.
Sustainability 15 09675 g006
Figure 7. Creep and instantaneous stress–strain curves. (a) Specimen with 61% water content; (b) specimen with 65% water content; (c) specimen with 69% water content.
Sustainability 15 09675 g007
Table 1. Main chemical composition of sulphoaluminate cement.
Chemical CompositionCaOSO3MgOAl2O3SiO2P2O5Fe2O3Loss
Content
(%)
41.8212.951.2934.246.821.021.620.24
Table 2. Setting time of high-solid-water filling material.
Water Content61%65%69%
Setting time33 min35 min39 min
Setting time of material A 12 h13.5 h16 h
Setting time of material B >24 h>24 h>24 h
Table 3. Fluidity of material A for high-solid-water filling material at different water contents.
Water ContentFluidity of Material A/mm
2 h4 h6 h8 h10 h
61%>400385340280210
65%>400395380360310
69%>400>400400385365
Table 4. Strength-curing timetable with different water contents.
Water Content8 h1 d3 d5 d7 d28 d
61%1.992.362.582.642.733.05
65%1.451.791.992.092.122.32
69%1.081.401.571.701.781.93
Table 5. Graded loading stress of high-solid-water materials in creep tests under different water content conditions.
Water ContentGraded Loading Stress/MPa
Grade 1Grade 2Grade 3Grade 4
61%0.651.301.952.60
65%0.501.001.502.00
69%0.450.90.1.351.80
Table 6. Creep statistics of high-solid-water materials under different water content conditions.
Water ContentStress/MPaTotal Strain
εt (10−3)
Instantaneous Strain εm (10−3)Creep Strain εcs (10−3)Proportion of Instantaneous Strain (%)Proportion of Creep Strain (%)
61%0.652.8742.5100.36487.3312.67
1.301.5651.3440.22185.8814.12
1.951.6001.2890.31180.5619.44
2.602.3791.8720.50778.6921.31
65%0.52.6562.4710.18593.036.97
1.01.0840.9540.13088.0111.99
1.51.3731.1510.22283.8316.17
2.02.2811.8120.47079.4420.60
69%0.452.1041.9410.16392.257.75
0.901.2051.0400.16586.3113.69
1.351.3341.0990.23582.8317.17
1.803.1992.3560.84373.6526.35
Table 7. Long-term strength of materials with different water contents.
Water ContentLong-Term Strength σm (MPa)σm/σ
61%1.9565%
65%1.5667.8%
69%1.3569.2%
Disclaimer/Publisher’s Note: The statements, opinions and data contained in all publications are solely those of the individual author(s) and contributor(s) and not of MDPI and/or the editor(s). MDPI and/or the editor(s) disclaim responsibility for any injury to people or property resulting from any ideas, methods, instructions or products referred to in the content.

