Article

Spatiotemporal Evolution and Cause Analysis of Innovation Ecosystem Niche Fitness: A Case Study of the Yellow River Basin

1
School of Economics and Management, Xi’an University of Technology, Xi’an 710054, China
2
Faculty of Culture, Tourism, Journalism and Art, Shanxi University of Finance and Economics, Taiyuan 030006, China
*
Author to whom correspondence should be addressed.
Sustainability 2023, 15(12), 9454; https://doi.org/10.3390/su15129454
Submission received: 14 April 2023 / Revised: 2 June 2023 / Accepted: 9 June 2023 / Published: 12 June 2023

Abstract

:
In this study, we explore the evolution and formation mechanism of innovation ecosystem niche fitness from three perspectives: theoretical analysis, model construction, and empirical testing. Based on the niche theory, a theoretical framework for the innovation ecosystem is constructed. Spatiotemporal analysis and qualitative comparison methods are employed to estimate the innovation niche fitness of nine provinces located in the Yellow River Basin, and their spatiotemporal characteristics and differences in terms of formation mechanism differences are then explored. The results show that: (1) temporally, from 2000 to 2017, the innovation niche fitness in the Yellow River Basin experienced minor fluctuations. However, since 2017, there has been a considerable increase. Spatially, the midstream and downstream regions, particularly in the provinces of Shandong, Henan, and Sichuan, have a higher innovation fitness. Conversely, the upstream regions of Qinghai, Ningxia, Gansu, and Inner Mongolia display a lower fitness because of the lack of advantages in innovation elements. (2) The innovation niche fitness is heavily influenced by several factors, including the number of industrial enterprises above designated size, R&D personnel, higher education institutions, scientific research institutions, expenditure for technical renovation, sales revenue of new products, total expenditure on R&D, and the total retail sales of consumer goods. (3) Four mechanisms explain high innovation niche fitness, each of which corresponds to different regions. The formation mechanisms of low innovation niche fitness can be categorized into two paths, which have an asymmetric relationship with the formation mechanisms of high innovation niche fitness. Therefore, provinces and regions should focus on these advantages to enhance the innovation niche fitness. Our research will serve as a theoretical reference to enhance the overall innovation capacity of the Yellow River Basin in the future.

1. Introduction

Innovation is imperative for a nation’s progress. Today, China’s economy has moved beyond rapid growth and into a phase of high-quality development [1]. Therefore, the approach to economic growth is shifting from traditional “input-driven” to “innovation-driven”. The 14th Five-Year Plan highlights the importance of implementing the innovation-driven development strategy, with a central focus on the nation’s overall development while building an open, inclusive, and competitive innovation ecosystem [2]. It is strategically crucial to develop a regional innovation ecosystem to enhance economic efficiency [3,4]. As the newest paradigm of innovation, the innovation ecosystem has become a research hotspot for its diversity, self-organization, adaptability, resilience, and sustainability. Scholars have interpreted the innovation ecosystem from perspectives such as system theory [5], network systems [6], and collaborative learning [7] and have studied its constituent elements and value co-creation processes.
Ecological niche, as a concept in ecology, refers to the ultimate survival unit in an ecosystem that happens to be occupied by a single species [8]. Hutchinson (1957) proposed the “N-dimensional hypervolume ecological niche,” which defines an ecological niche as a multidimensional space of environmental parameters that affect the survival of a species [9]. Li (1997) later introduced the notion of ecological niche fitness, which measures the degree of overlap between a species’ actual ecological niche and its ideal, optimum ecological niche within its habitat [10]. In an innovation ecosystem, a niche refers to the strategic positioning of innovation actors according to the available innovation resources, functions, and environmental factors in a specific spatiotemporal realm [4]. Niche fitness describes how closely the innovation ecosystem’s actual resource offerings and environmental features match the ideal and necessary resources and environmental factors for innovation practices in a specific domain [11,12]. Higher niche fitness means that innovation actors can access heterogeneous resources more effectively, which leads to higher efficacy in innovative activities [13]. In addition, an accurate evaluation of innovation ecosystem niche fitness acts as a guide to enhancing regional innovation capabilities, with scholars constructing various evaluation systems for different scales. For instance, Qin et al. (2011) assessed the innovation niche fitness of Hunan based on innovation resources, efficiency, potential, and vitality [14]. Sun and Li (2016) added innovation community and environmental dimensions to assess niche fitness and evolutionary momentum in the Beijing-Tianjin-Hebei region [15]. Villani (2021) proposed a comprehensive innovation niche framework that included 10 layers: anchor companies, growing small and medium- sized enterprises, startups, incubation environments, living labs and test beds, cluster policies and programs, research and development (R&D) activities, education, infrastructure, and innovation policy [16]. Xie and Liu (2021) characterized the ecological niche fitness of innovation ecosystems based on innovation communities, resource ecological niche, habitat ecological niche, and technology ecological niche, using the GM (1.1) model to predict the development trend of innovation ecological niche fitness in 30 Chinese provinces [17]. In summary, although previous studies have constructed evaluation index systems for innovation ecosystems from multiple perspectives, designed models according to natural ecological system theories are still lacking, resulting in the limited comprehensiveness of the data. Therefore, the intent of this study is to explore the evaluation of innovation ecosystem niche fitness from the perspective of natural ecological systems.
The Yellow River Basin is a significant region for grain production, energy enrichment, raw materials, and basic industry in China, and it plays a critical role in the economic and social development of the country [18]. In 2022, the total gross production value of the basin exceeded 30.699 trillion yuan, accounting for over a quarter of China’s national value. On 18 September 2019, General Secretary Xi Jinping announced ecological protection and high-quality development in the Yellow River Basin as a vital national strategy. However, the low-level of green development and low-carbon agricultural production, as well as the lagging development of high-tech strategic emerging industries, have led to relatively weak innovation capability in the Yellow River Basin, and an insufficient driving force for economic upgrades [19,20]. These constraints limit the continuous innovation in traditional industries and the promotion of emerging industries, which restricts the high-quality development of the region. Therefore, the transformation and upgrading of the economic system in the Yellow River Basin should be driven by innovation [21]. To achieve this goal, innovative and entrepreneurial activities must be employed to disrupt the existing innovation system and enhance regional innovation performance. This process will promote the dynamic flow of innovative resources, such as technology, talents, and funds, within the Yellow River Basin and facilitate the adjustments to industrial structure, the changes in the values of goods and services, and the increase in investment efficiency of the real economy through technological progress. Consequently, a scientific, rational, green, and safe innovation ecosystem will be established in the Yellow River Basin [22]. Notably, the demand for innovation resources in each province of the Yellow River Basin constitutes ecologic niches for innovation demands, and the existing innovation resources can also constitute corresponding resource space. The degree of fitness of existing innovation resource conditions for the development of the Yellow River Basin is reflected by the matching relationship between the two, and this requires measurement using ecological niche fitness.
Although the present literature lays a solid foundation for this study, there are some limitations that need to be considered. Firstly, under the background of innovative, coordinated, green, open and shared development, it is crucial to prioritize innovation development in the Yellow River Basin. This will enable balancing the economic growth between the north and south, consolidating achieved poverty alleviation, optimizing the ecological environment, strengthening foreign trade, and regional development coordination. Nevertheless, the existing academic research on the innovation ecosystem mainly concentrates on relatively advanced areas such as the Yangtze River Economic Belt, resulting in inadequate attention to the Yellow River Basin [11]. Secondly, the innovation ecosystem is similar to the natural ecosystem and must adhere to its formational properties and evolutionary laws during the evolutionary process. Ecological niche, as an important indicator of species in ecosystem occupation, is a more reasonable approach to evaluate the level of innovation ecosystem development in the Yellow River Basin from an ecological niche perspective. Consequently, based on the ecological niche theory, we evaluated the innovation niche fitness in nine provinces of the Yellow River Basin during 2000–2019 by constructing a regional innovation ecosystem ecological niche evaluation system. Subsequently, we identified critical influencing factors based on correlation analysis in SPSS. Finally, we analyzed the formation path of the ecosystem of innovation in the Yellow River Basin using qualitative comparative analysis (QCA). Our objective was to generate scientific recommendations for enhancing innovation capacity and promoting high-quality economic growth in the region.

2. Theoretical Foundation and Research Model

2.1. Regional Innovation Ecosystem

Analogous to natural and social ecosystems, a regional innovation ecosystem is a dynamic and balanced system consisting of innovation producers, consumers, and the environment [23]. It aims to promote the sustainable development of regions (Figure 1).
From the perspective of the innovation value chain, innovation producers in the upstream areas of the value chain are responsible for providing innovative products. Utilizing creative endeavors to transform resources furnished by the innovative environment into feasible products, they are the primary force and the cardinal entity of the innovation ecosystem [24]. Enterprises, universities, and research institutions engage in original and fundamental research to create products that meet market demands [25]. Innovation consumers in the downstream areas of the value chain act as evaluators and beneficiaries of innovation results and facilitate their transformation into benefits and market values. The demand for outcomes by innovation consumers mainly includes two aspects: the technology market and the production market [26]. Due to the difficulty in obtaining relevant data, the demand in the technology market is reflected by the technical market turnover, while the demand in the product market is measured with granted patents and new product sales revenue [26]. Innovation producers and consumers have interrelated roles and mutually impact each other. Innovation producers understand the demands and preferences of the consumer market through market operations, based on which they create new products and services to fulfill the needs of the consumer market. Innovation consumers, on the other hand, provide feedback to innovation producers on changes in market demands, which in turn promotes new ideas and technologies. Therefore, innovation producers and consumers can only achieve their common goals and interests through close cooperation and mutual listening.
The foundation for the development of innovation producers lies in the innovation environment, which includes four elements: factor environment [27], market environment [28], technology environment [29], and economic environment [30]. Among them, the factor environment includes the direct innovative resources involved in innovative activities, while the market environment refers to market conditions that have a significant impact on innovative activities. The technology environment hinges on the technical aspects that ensure the development of innovative activities, while the economic environment involves public services related to innovative activities. The innovation environment system provides innovation producers with the resources and space they need, and the consumer market impacts and optimizes various aspects of the innovation environment system through the circulation of innovative achievements. As shown in the above analysis, we developed an evaluation index system for the innovation ecosystem (Table 1).
In this study, we selected nine provinces along the Yellow River Basin in China as the research unit, namely Qinghai, Sichuan, Gansu, Ningxia, Inner Mongolia, Shaanxi, Shanxi, Henan, and Shandong. The research data are sourced mainly from the China City Statistical Yearbook and the China Statistical Yearbook on Science and Technology. The data regarding the “Penetration rate of the Internet “are from the “Statistical Report on the Development Status of the Internet in China” published by the China Internet Network Centre (http://www.cnnic.net.cn) (accessed on 25 February 2022).

2.2. Regional Innovation Ecosystem Niche Fitness

The subject of niche theory is the status of biological units [31]. In a regional innovation ecosystem, innovation units seek to find suitable niches that maximize profits effectively. As a result, these units engage in a competitive symbiosis that involves the division of labor and development to enhance the collaborative innovation and reinvention capabilities of the entire system. Essentially, innovation units can be divided into two categories based on the level of ecological niche similarity: similar and dissimilar units. Competing and cooperating activities between similar units tend to produce resource waste. On the other hand, dissimilar units derive from innovation units selecting different ecological niches, which leads to an effective division of labor [13].
The niche theory provides theoretical support for the synergistic development of the Yellow River Basin. However, excessive competition and niche overlap hinder the healthy development of the innovation ecosystem in the region [15]. Niche fitness measures the degree of the adaptation of different innovation units to their ecological environment based on the proximity between the actual values of each innovation factor and the optimal values. The niche fitness scores range between 0 and 1, with higher scores indicating better adaptation. Therefore, measuring niche fitness across various provinces in the Yellow River Basin is essential to identify the strengths and weaknesses of different innovation ecological factors. This will provide a robust scientific foundation for realizing the complementary strengths of the basin and crafting integrated development policies accordingly.
Based on the above analysis, a regional innovation ecosystem niche fitness model is constructed. We assume that X = {x1, x2, …, xn} reflect the quantitative indicators of the selected ecological factor, where xjIj (j = 1, 2, …, n). Due to the continuous and dynamic evolution of regional innovation ecosystems, the quantitative indicators of ecological factors in different regions constitute an m-dimensional ecological factor space Em, Em = [xij]m×n, where i = 1, 2, …, m, j = 1, 2, …, n. The formula for calculating the niche fitness of the innovation ecosystem is shown in Formula (1).
F i = j = 1 n ω j min x i j x a j + α max x i j x a j x i j x a j + α max x i j x a j
where Fi is the niche fitness of the innovation ecosystem in region i. ωj is the weight of ecological factor j, which is determined by the entropy method. x’ij is the standardized value of each ecological factor. x’aj is the optimal ecological niche for ecological factor j, which can be expressed by the formula x’aj = max{x’ij}. α is the model parameter, determined by Fi = 0.5 [14].

2.3. Analysis of Shaping Mechanisms on Regional Innovation Ecosystem Niche Fitness: Qualitative Comparative Analysis (QCA) Methods

The process of shaping regional innovation ecosystem niche fitness is complex and often difficult to explain with a single factor. Qualitative comparative analysis (QCA) can identify how various factors affect the outcome in combination [32]. Accordingly, in this study, we used the QCA approach to analyze the mechanisms that shape innovation ecosystem niche fitness. The QCA approach is essentially an ensemble theory approach that considers the relationship between different combinations of influences and outcome variables in the context of multiple concurrent causal relationships [33]. Consistency and coverage are two reliability indicators for the results obtained. Consistency refers to the extent to which a given outcome can be expected when a particular antecedent condition occurs, while coverage measures the strength of interpretation of a given outcome by all antecedent conditional patterns [34]. The formula is as follows:
c o n s i s t e n c y X Y = min x i , y i / x i
c o v e r a g e X Y = min x i , y i / y i
where X is the set of antecedent condition variables, and Y is the set of outcome variables. xi, yi are the affiliations of case i in combinations X and Y, respectively. In general, when the consistency is >0.8, it indicates that the antecedent variable is a sufficient condition for the outcome variable. Additionally, when the consistency is >0.9, the antecedent variable can be considered a necessary condition for the outcome variable [35]. Coverage is mainly used to assess the extent to which a given conditional grouping explains the outcome.

3. Trend for Niche Fitness of Innovation Ecosystem in the Yellow River Basin

3.1. Trend for Innovation Ecosystem Niche Fitness and Each Ecological Factor in the Yellow River Basin

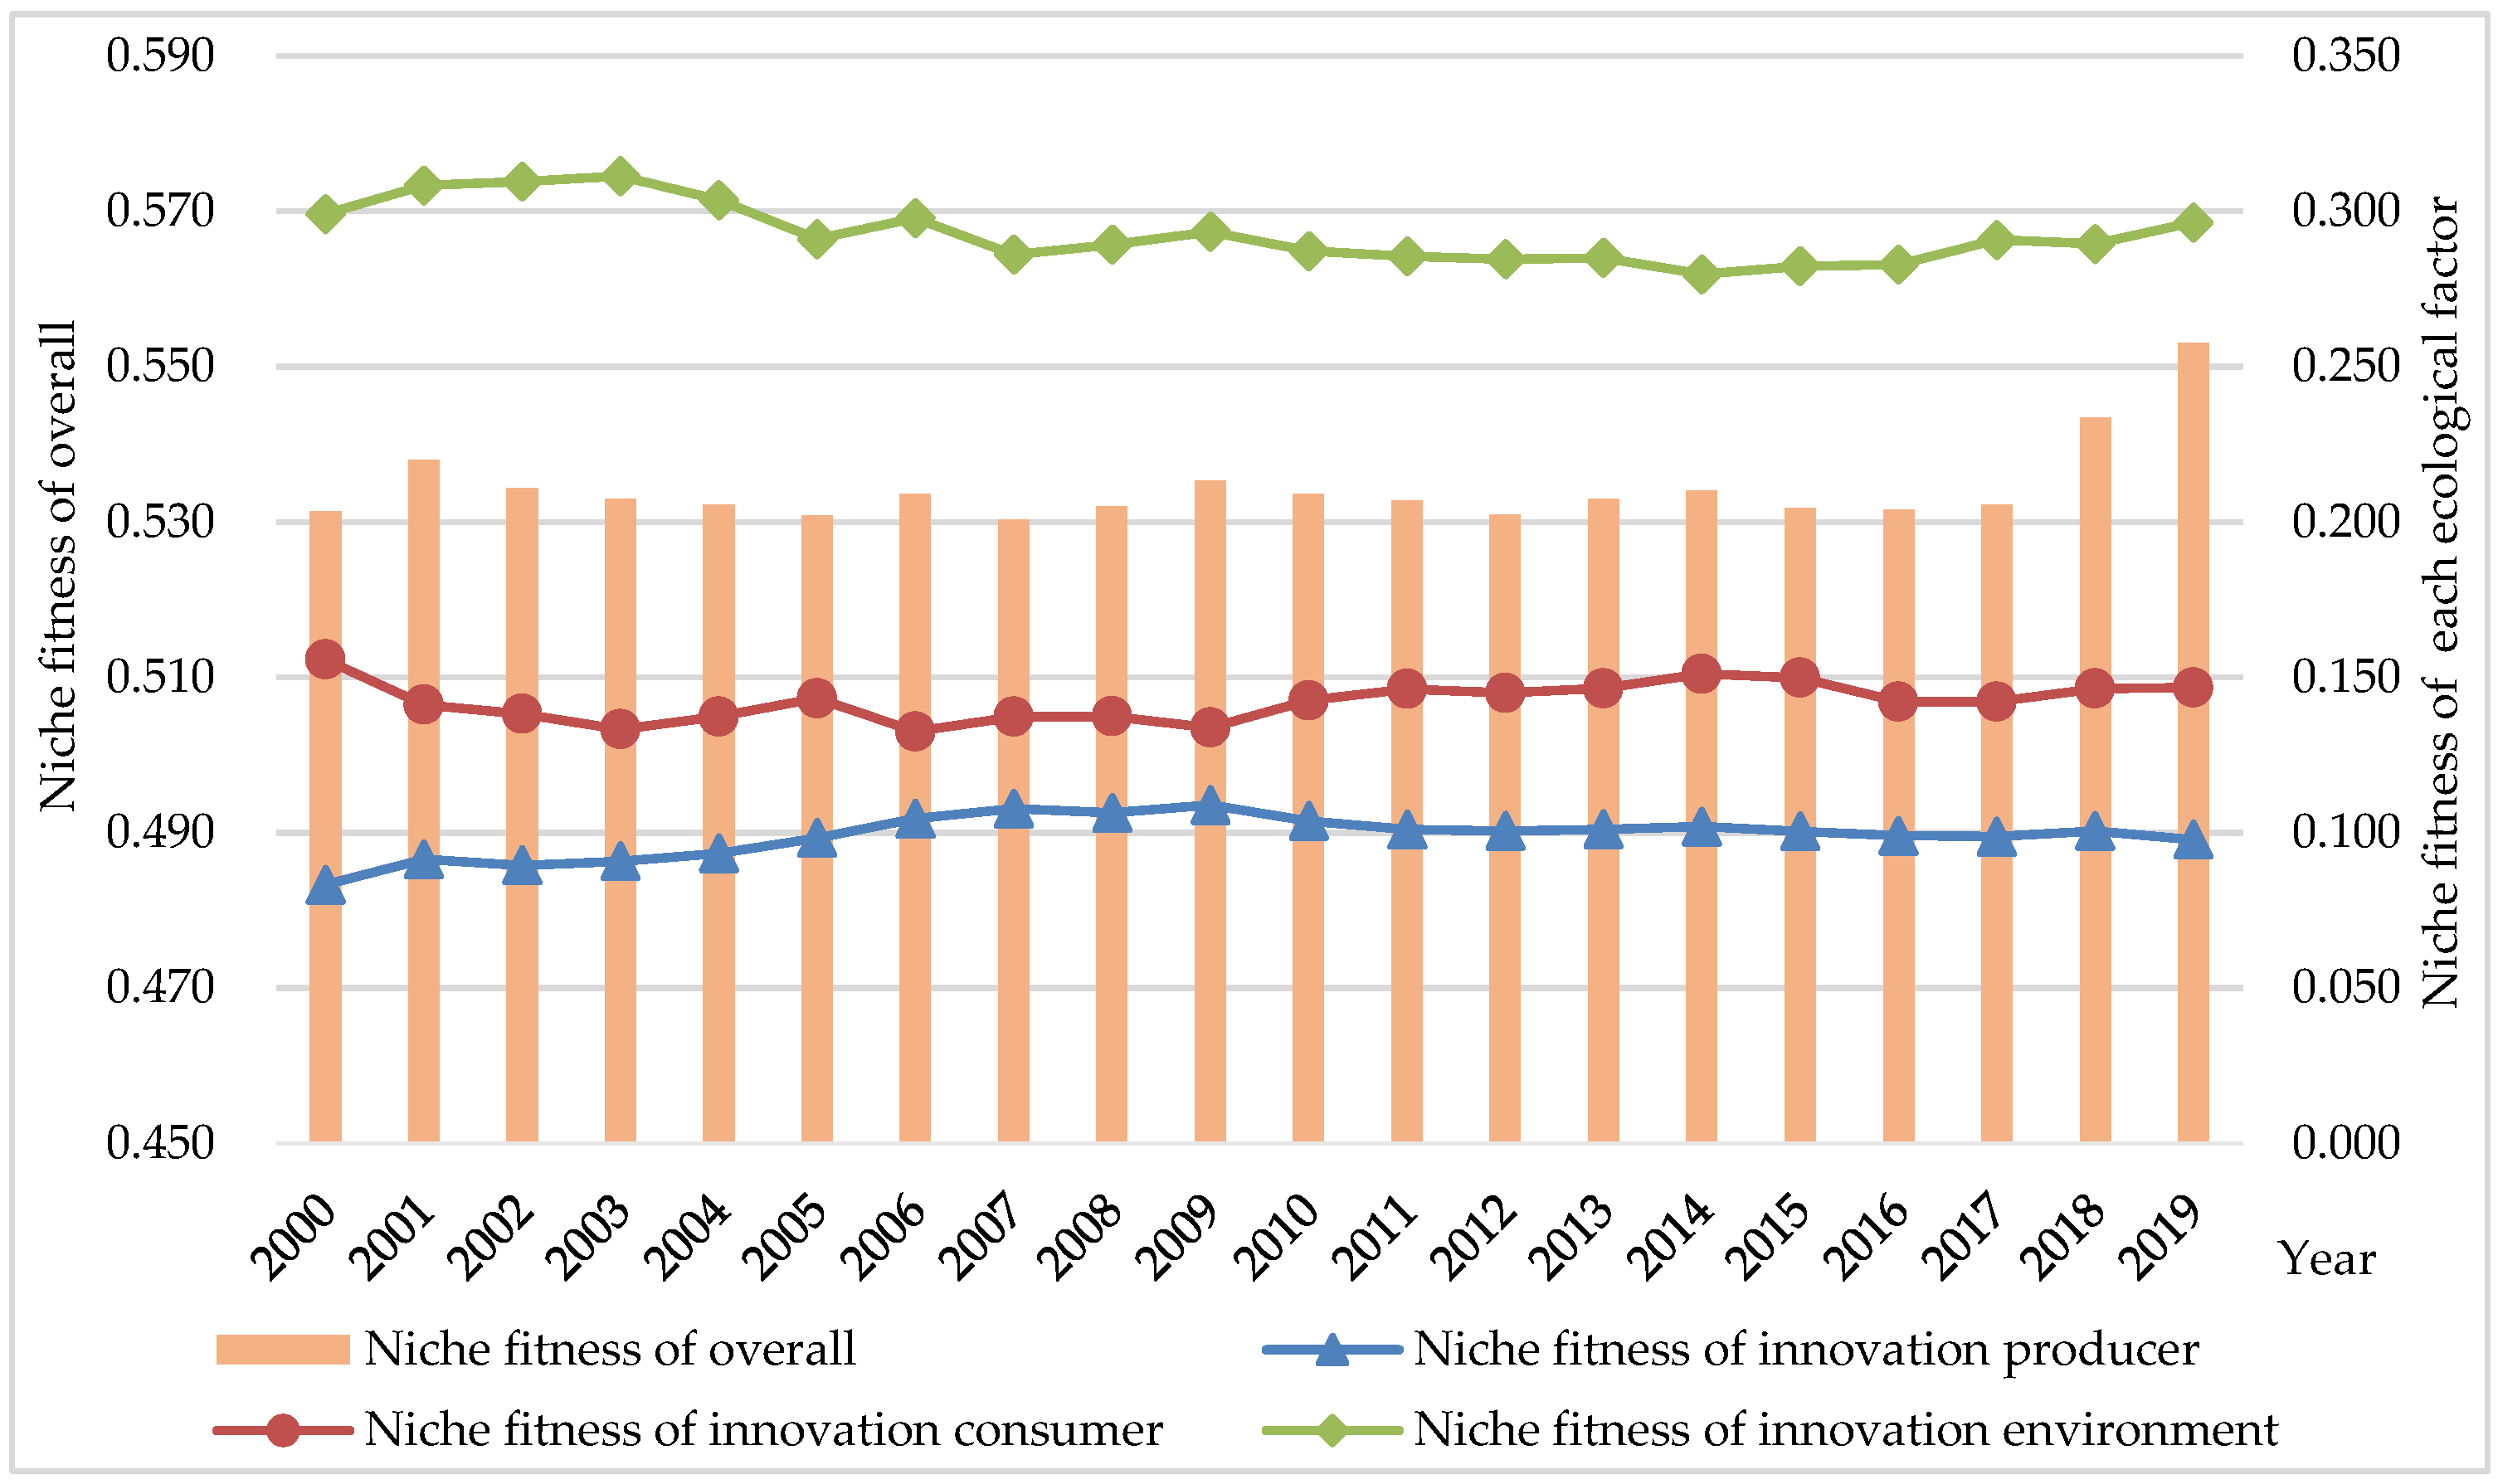
Using the niche fitness model, we calculated the niche fitness of the innovation ecosystem in nine provinces along the Yellow River Basin. Additionally, to analyze the degree to which each ecological factor supported the development of the innovation ecosystem, we calculated the ecological factors’ niche fitness values from 2000 to 2019 (Figure 2).
On the whole, the innovation niche fitness in the Yellow River Basin showed a slow growth trend, increasing from 0.531 in 2000 to 0.553 in 2019, with 2017 being an important turning point. The growth can be divided into two stages. From 2000 to 2017, the innovation niche fitness experienced slight fluctuations. After 2017, the rise in fitness accelerated significantly. This can be attributed to “the National Innovation-Driven Development Strategy” and “the 13th Five-Year National Science and Technology Innovation Plan”, both of which emphasize the creation of an innovative ecosystem with various types of innovative subjects cooperating and interacting with each other, and the efficient allocation of innovation elements. This institutional support provides the necessary foundation for the construction of an innovation ecosystem in the Yellow River Basin, leading to a significant improvement in the overall innovation niche fitness since 2016. Among the ecological factors, the niche fitness for the innovation environment was the highest, and its trend was consistent with the overall trend of the niche fitness, suggesting that the innovation environment holds a primary position in the operation of the innovation ecosystem. The innovation environment is complex and contains multiple constituents, which significantly affects the overall innovation ecosystem. The second ecological factor was the innovation producer niche fitness, which had minor fluctuations of around 0.15 during the study period. The niche fitness of innovation consumers persistently remained inferior during the study period, creating an essential limitation to the development of the overall innovation niche fitness. Furthermore, it showed a decreasing trend after 2009, which demands special consideration in the future.

3.2. Trend for Innovation Ecosystem Niche Fitness in Upstream, Midstream, and Downstream Regions

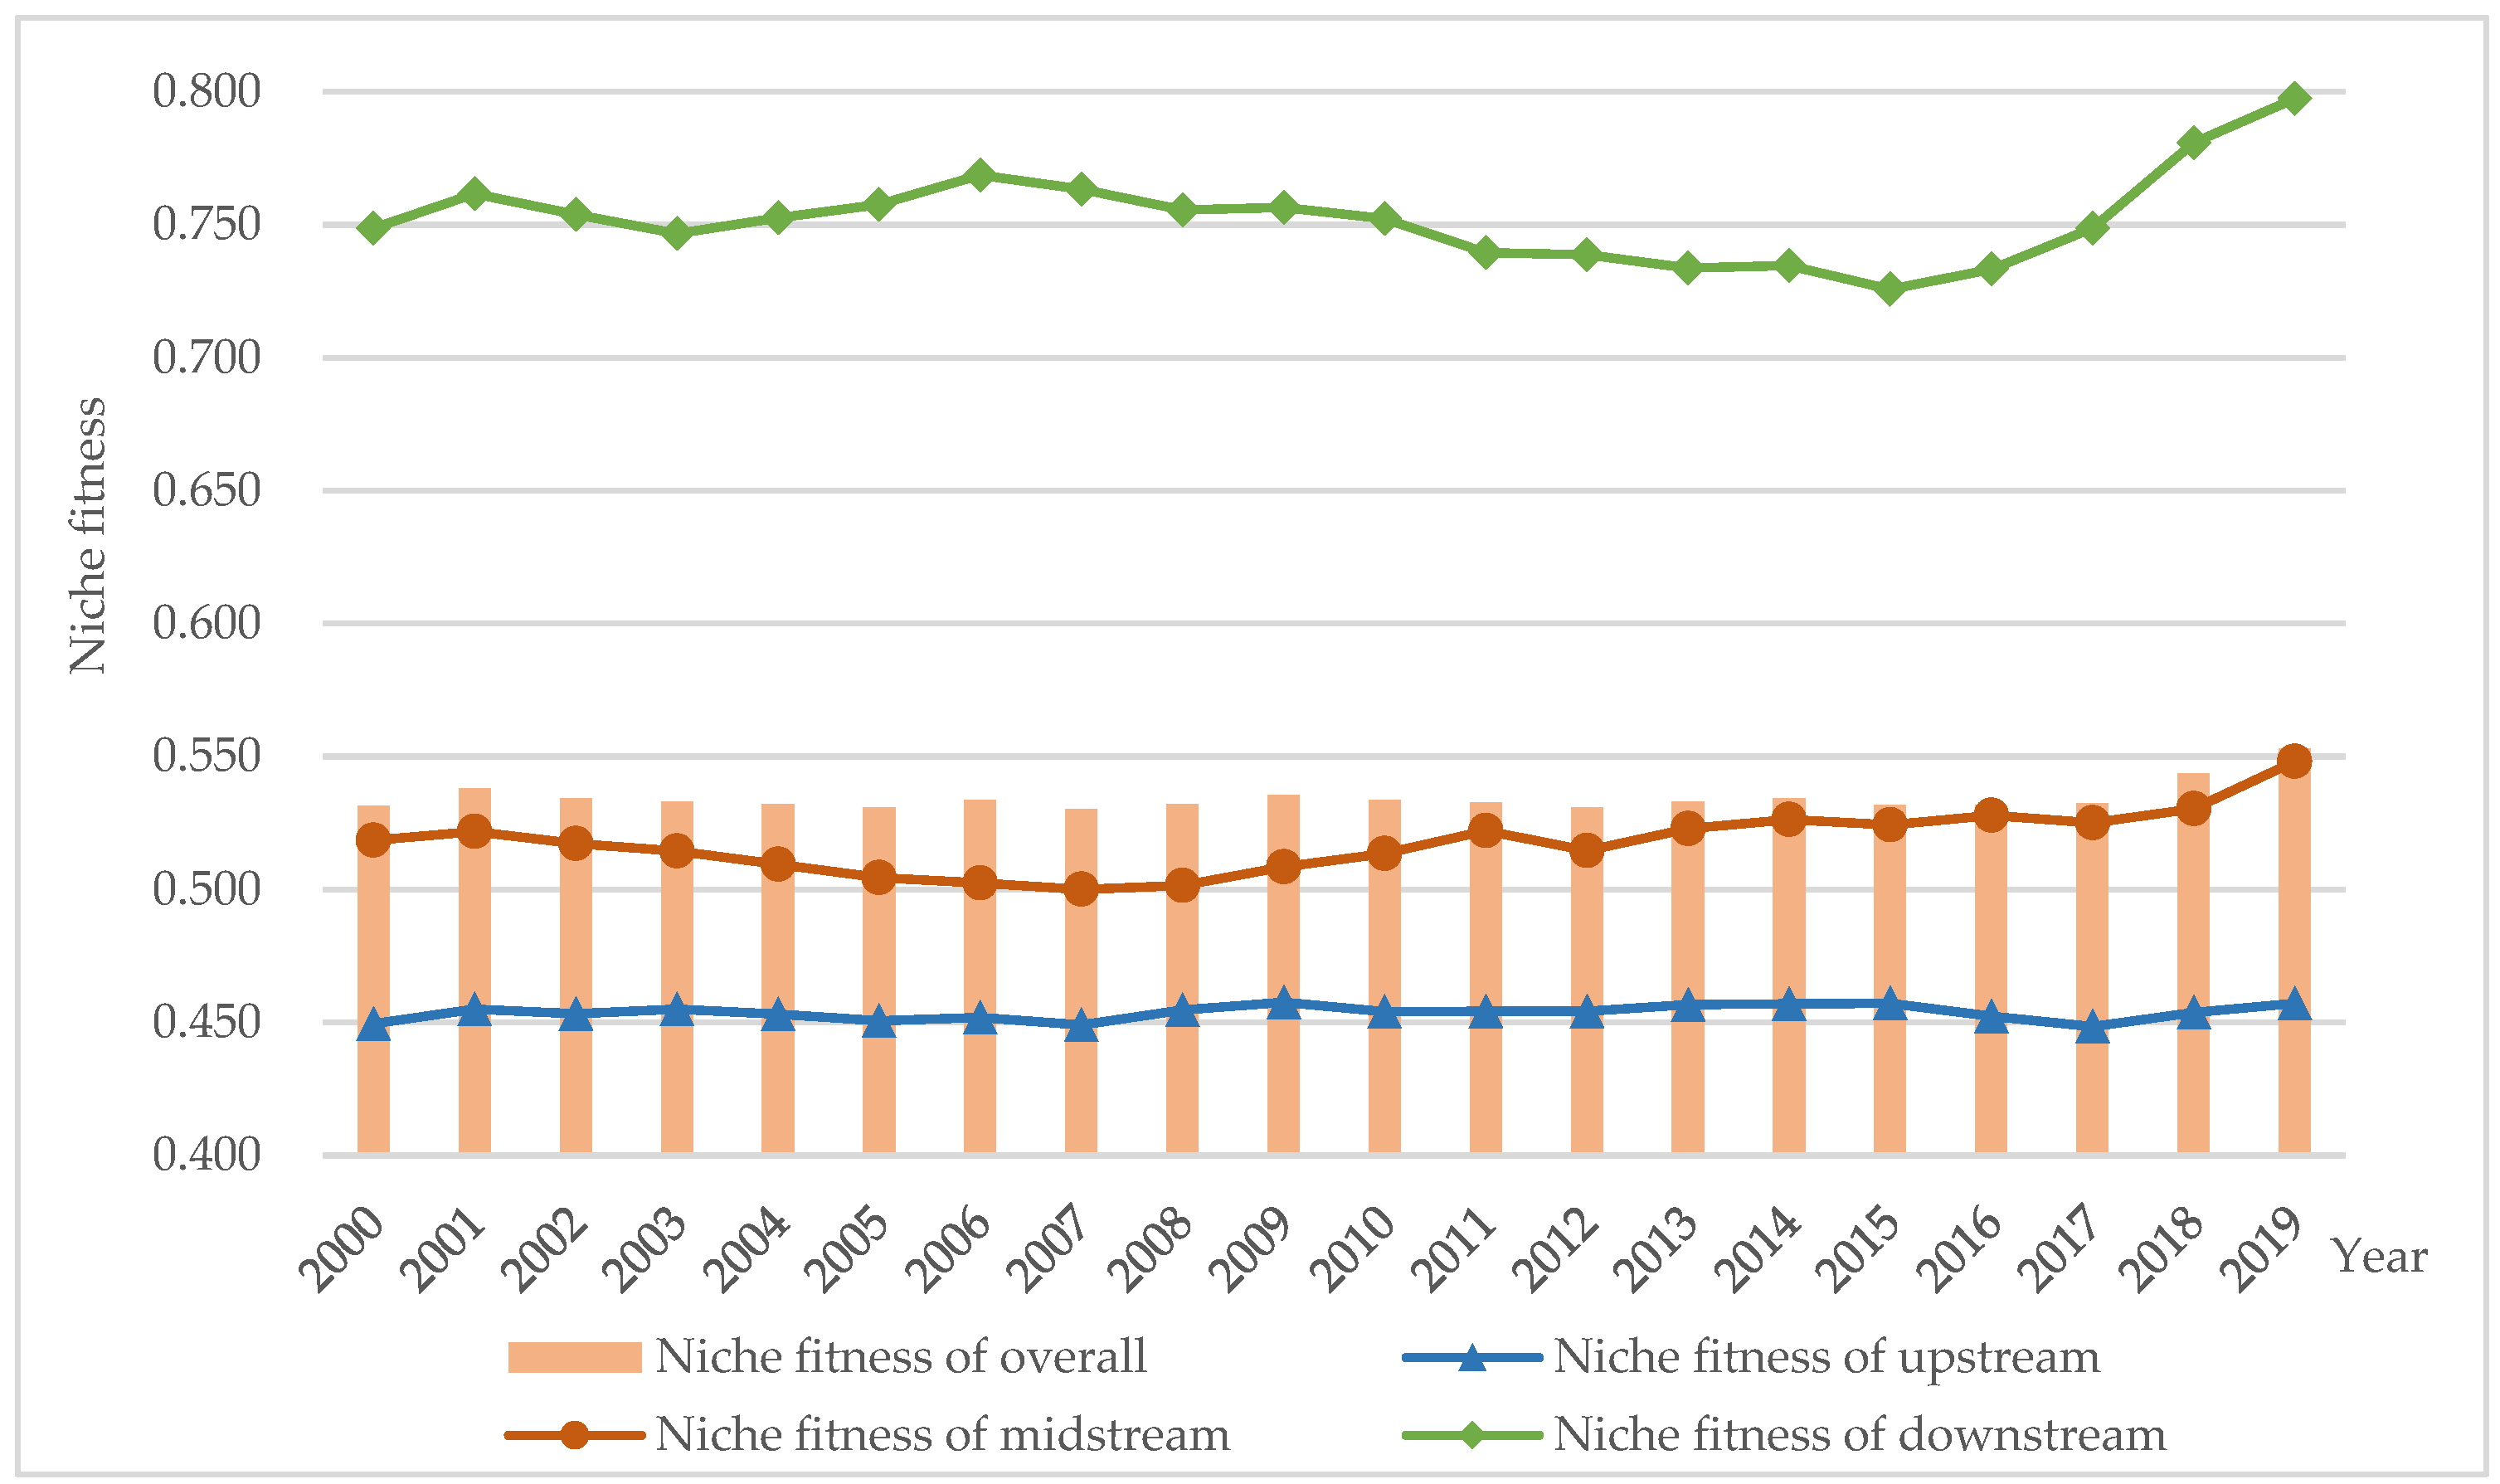
To show the regional differences in the innovation niche fitness within the Yellow River Basin, we categorized the nine provinces into three groups: upstream (Qinghai, Sichuan, Gansu, Ningxia, and Inner Mongolia), midstream (Shaanxi and Shanxi), and downstream (Henan and Shandong). We then calculated the average niche fitness values in each of the regions and compared them with the overall niche fitness value (Figure 3).
Based on distinct economic foundations, innovation environments, and resource endowments, the innovation niche fitness significantly varied across upstream, midstream, and downstream regions in the Yellow River Basin. The upstream regions, specifically Qinghai, Sichuan, Gansu, Ningxia, and Inner Mongolia, exhibited stable fitness values, oscillating around 0.45. These areas have underdeveloped economies, weak agglomeration of innovation factors, and insufficient innovation power, leading to a lower niche fitness. In the midstream of the Yellow River, the niche fitness initially declined and then increased during the study period. The fitness reached its nadir in 2007, with a value of 0.500, and then exhibited an upward trend. This was mainly due to the concentration of universities in Shaanxi and Shanxi provinces and the national strategy of the “Science and Education Prosperity Special Program” introduced in 2007, which greatly increased innovation entities’ production capacity and improved innovation niche. In the downstream region of the Yellow River, the innovation niche fitness showed a fluctuating downward trend before 2015, followed by a rapid increase. Based on their sound economic development foundations, Henan and Shandong provinces have actively implemented the innovation-driven development strategy in recent years and introduced advanced technology and innovation enterprises, resulting in a significant increase in the innovation niche, which is now at a higher level.

3.3. Trend for Innovation Ecosystem Niche Fitness in Nine Provinces

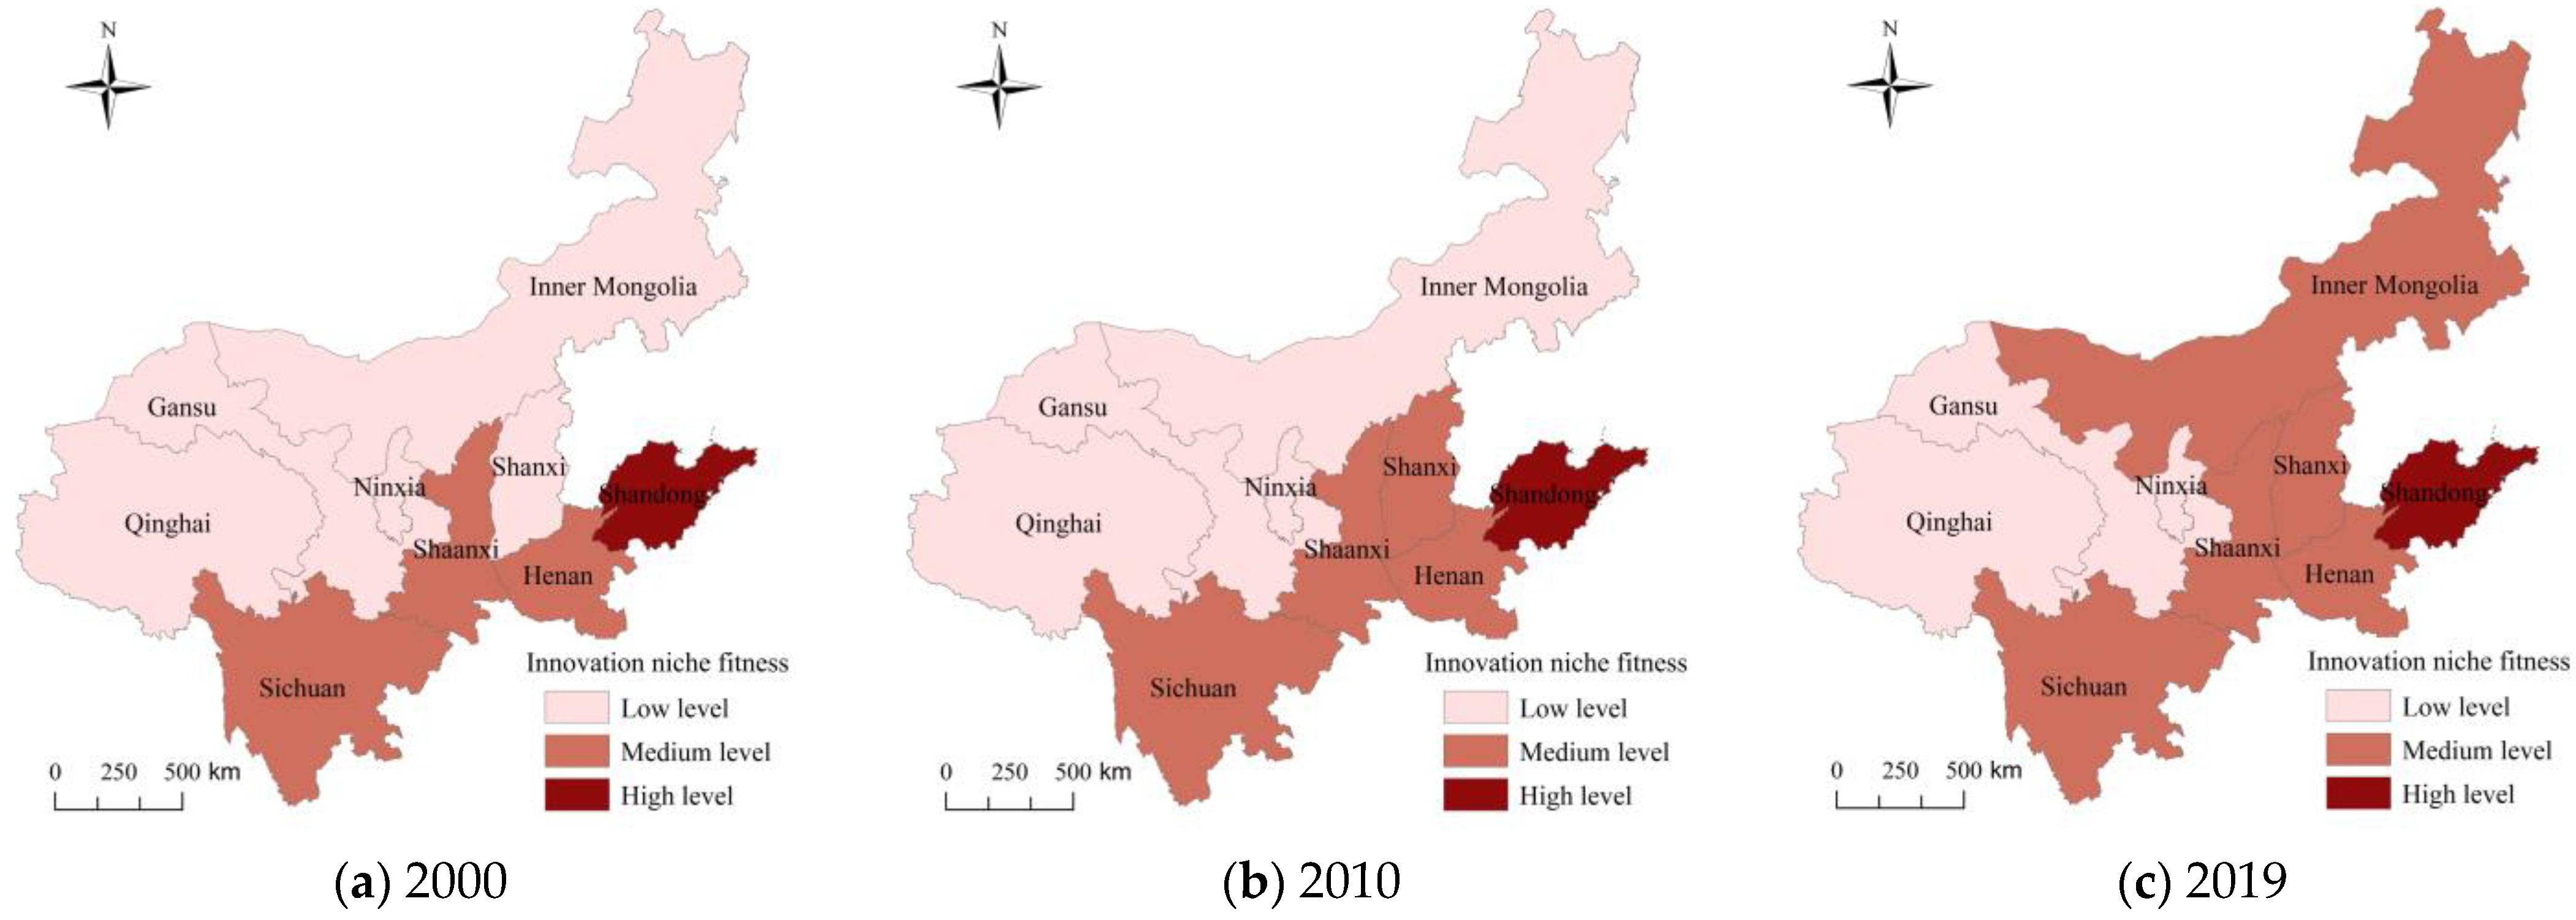
To perform a comprehensive analysis of spatial variations in the innovation niche fitness within the Yellow River Basin, the natural breakpoint method in ArcGIS was utilized to visualize and evaluate the levels of niche fitness across the nine provinces in 2000, 2010, and 2019 (Figure 4). The results were then classified into three categories: high level, medium level, and low level.
As shown in Figure 4, the innovation niche fitness in the Yellow River Basin is continuously distributed. In 2000, Shandong province had a high level of fitness due to the introduction of leading science and innovation companies such as Siemens, combined with extensive cooperation with local companies to enhance the competitiveness of the innovation ecosystem. Sichuan, Shaanxi, and Henan had medium levels of fitness. In Shaanxi and Sichuan, this was due to their reliance on strong innovative resource endowments, whereas Henan attained medium fitness due to its high scores in terms of both innovation producers and innovation consumers. Qinghai, Gansu, Ningxia, Shanxi, and Inner Mongolia had low levels of niche fitness. This was mainly due to their weak economic environments, insufficient innovative entities, and limited innovation environments during the early years of the study period. In 2010, Shanxi transitioned from a “low” level of fitness to a “medium” level. The main reason may be that, as a traditional resource province, Shanxi had many industrial enterprises that increased their investment in technological transformation, and an enhanced innovation environment led to a significant enhancement in innovation niche fitness. The performance of the other provinces remained the same as that in 2000. In 2019, Inner Mongolia’s fitness developed from “low” to “medium” level. Since the implementation of the “13th Five-Year Plan”, Inner Mongolia has been improving its innovation capacity and actively strengthening the supply of technological progress in key areas. The region actively participated in key national R&D projects, resulting in significant progress in innovation output and hence an increase in niche fitness. The performance of the other provinces and regions remained the same as that in 2010.

4. Identification of Critical Influencing Variables of Niche Fitness for the Innovation Ecosystem in the Yellow River Basin

The innovation niche fitness in the Yellow River Basin varied significantly across different regions due to various factors. To identify the primary impact factors, we conducted a correlation analysis using SPSS [36], which examined the degree of correlation between 15 variables and innovation niche fitness. The analysis revealed that eight indicators, namely industrial enterprises above designated size, the full-time equivalent of R&D personnel, higher education institutions, scientific institutions, expenditure on technical upgrading, revenue from new products, total R&D expenditure, and total consumer goods retail sales, were highly correlated with niche fitness at a 99% significance level. These indicators can be considered essential factors impacting innovation fitness in the Yellow River Basin (Table 2).
Specifically, the number of industrial enterprises above the designated size, research institutes, and higher education institutions, which represent innovation producers, form the basis of the innovation ecosystem [37]. A good innovation producer provides financial and equipment support and attracts talent and capital, supplementing innovation factors and ultimately improving the regional innovation niche fitness. The total retail sales of consumer goods, which characterize the market environment, enable innovation results to have market value and act as a source of motivation for improving innovation niche fitness [28]. The number of R&D personnel and total R&D expenditure are the primary factors directly linked to innovation activities, determining the possibility of regional innovation. A prosperous resource endowment signifies abundant innovation inputs, which are fundamental to the accomplishment of innovative outcomes. Furthermore, technical renovation investment reflects firms’ willingness to be primary subjects of the innovation ecosystem [29]. Higher technical renovation investment indicates that firms are willing to pay more for producing superior-value products with increased competitiveness. New product sales revenue is a direct reflection of consumers’ demand for innovative productions [28]. Higher innovation revenue drives the innovation ecosystem’s subjects to expand their innovation scale, forming a virtuous circle that improves the niche fitness of regional innovation. These above variables are significant to the innovation ecosystem and serve as the primary impetus for enhancing regional innovation niche fitness. As they work together, it is essential to explore the combination of conditions impacting the fitness of the innovation ecosystem to optimize the allocation of innovation resources and improve the innovation capacity in the Yellow River Basin.

5. An Analysis of the Mechanisms That Shape Niche Fitness for the Innovation Ecosystem in the Yellow River Basin

In this study, we employed the qualitative comparative analysis (QCA) technique to examine the formation mechanisms of innovation ecosystem niche fitness, using the mean values of critical variables from 2000 to 2019 in nine provinces within the Yellow River Basin as condition variables.

5.1. Variable Calibration

QCA methods based on set theory aim to identify sufficient or necessary subset relationships between the configurations of different antecedent variables and outcome variables. The difference between QCA analysis and traditional analysis techniques lies in its analysis of sets rather than variables. Therefore, it is necessary to calibrate the measured variables to give the original variables a meaningful set interpretation [32]. Calibrating the variables to sets requires setting three critical values based on theoretical and practical external knowledge or standards: complete affiliation, complete unaffiliation, and crossover point. The crossover point is the midpoint that distinguishes complete affiliation from complete unaffiliation. Therefore, the fuzziness of whether a case belongs to a set is greatest at this point [38,39]. In this paper, the three-valued fuzzy set calibration method of Fan et al. (2020) was adopted, with the variables using 95%, 50%, and 5% quantile values as the thresholds for complete affiliation, crossover point, and complete unaffiliation, respectively [40]. The calibration data of each variable are shown in Table 3.
As shown in Table 3, based on the outcome variable of the innovation niche fitness, the suitability index for the innovative ecological niche was mainly between 0.413 and 0.791, with a value of 90%. This indicates that the overall niche fitness in the Yellow River Basin is at a moderate level. The difference between the 5% percentile value and the 95% percentile value of each condition variable is relatively large, indicating that there are significant differences in innovation factors among provinces along the Yellow River Basin, resulting in different levels of innovation niche fitness.

5.2. Analysis of the Need for Individual Conditions

The set analysis involves two basic strategies: the first is to determine if a condition (X) is a subset of the result (Y), thereby serving as a sufficient condition (X ≤ Y). The second is to determine if a condition (X) is a superset of the result (Y), thereby serving as a necessary condition (Y ≤ X). The configuration of conditions can constitute the result if the consistency of cases with the same result under the shared configuration of conditions exceeds an acceptable empirical standard [41]. When the consistency level is greater than 0.9, it indicates that a certain condition is necessary condition for the result [38].
In this study, the consistency level of individual condition variables for both high and low innovation niche fitness was less than 0.9 (Table 4), suggesting that no single factor acted as a bottleneck for the shaping of the innovation ecosystem. Therefore, it was necessary to explore the influence of the configuration of conditions on innovation niche fitness. Notably, the consistency level of full-time equivalent R&D personnel was 0.896 for high innovation niche fitness, which is close to 0.9. Although it did not constitute a necessary condition for the outcome variables, its importance is highlighted and should be given special attention in the future.

5.3. Sufficiency Analysis of Conditional Configurations

Typically, the sufficiency analysis of conditional configurations results in three solutions: the complex solution, the parsimonious solution, and the intermediate solution. The complex solution contains only the configuration of the actual observed cases, while the parsimonious solution contains the configuration of the observed cases, together with all simple and complex logical residues. The intermediate solution, on the other hand, only includes the configuration of actual observed cases and simple logical residues. The intermediate solution strikes a balance between the complexity of the complex and parsimonious solutions. Therefore, the path configuration analysis presented in this paper is the result of the intermediate solution.

5.3.1. Path Analysis of High Innovation Niche Fitness

In this research, histological analysis was conducted using the fsQCA 3.0 software. After careful consideration, the frequency threshold was determined to be 1, while the original consistency threshold and PRI consistency threshold were both set at 0.8 [39]. The results revealed four distinct histological paths (H1a, H1b, H2, and H3) that explained the high innovation niche fitness in the Yellow River Basin (Table 5).
Both H1a and H1b share a common core condition, namely, the requirement of R&D personnel for high innovation niche fitness. However, the edge conditions for each configuration differ. Configuration H1a emphasizes the importance of having a sufficient number of research institutes and higher education institutions to provide the necessary support for regional innovation. This highlights the fact that high innovation niche fitness is primarily driven by the presence of adequate innovative human capital and robust innovation subjects, even if other conditions are not yet optimal. With sufficient human capital aimed toward innovation, the innovation system can receive the necessary financial and equipment support, ultimately leading to high innovation niche fitness. In contrast, configuration H1b demonstrates that the convergence of research institutes, higher education institutions, and total R&D expenditure collectively contributes to achieving high innovation niche fitness. This path indicates that, if necessary financial and human resources are ensured for universities and research institutes, high innovation niche fitness can still be achieved during the early stages of the regional innovation market. Examples of representative provinces in this category include Sichuan and Shaanxi.
Configuration H2 is characterized by three core conditions, namely, the number of industrial enterprises above the scale, the number of R&D personnel, and the total retail sales of consumer goods. This configuration underscores the crucial role played by innovation subjects, human capital, and market demand in driving high innovation niche fitness. To optimize the resource allocation of innovation subjects, invest in human capital, and deploy innovation tasks effectively, it is essential to cultivate a deep understanding of market demand and rapidly respond to changes in market dynamics. By taking these measures, we can prevent mismatches between market demand and supply and boost the niche fitness of the innovation ecosystem. Representative provinces exemplifying this configuration include Shandong and Henan.
Configuration H3 places emphasis on expenditures for technical renovation, with the presence of the number of industrial enterprises above the scale, total retail sales of consumer goods, and the absence of the number of R&D personnel and total expenditure on R&D as supporting conditions. This configuration suggests that in the face of limited innovation resources, enterprises should have a deep understanding of market demands and actively enhance their own technology in order to achieve greater compatibility through a complementary internal and external approach. The proposed model asserts that firms should take a leading role in enhancing innovation niche fitness in situations where innovation resources are insufficient. A notable example of this configuration is found in Shanxi.

5.3.2. Path Analysis of Low Innovation Niche Fitness

In light of the causal asymmetry present in the fsQCA analysis, i.e., particular outcomes require distinct explanations via varying combinations of conditions [42], we pursued a comprehensive assessment of the limiting factors that hinder enhanced innovation niche fitness within the Yellow River Basin. Accordingly, in this research, we delved deeper into the configurations resulting in low innovation niche fitness and conclusively identified two pathways (NH1 and NH2) that elucidate a low fitness in the Yellow River Basin. The findings are presented in Table 5.
In configuration NH1, the innovation niche fitness is hindered due to the absence of crucial indicators such as the number of higher education institutions, new product sales revenue, and R&D personnel. It is important to note that the relationship between industry-university-research cooperation networks and innovation capacity enhancement is becoming increasingly interconnected. Fewer higher education institutions directly result in a lack of regional innovation and insufficient R&D personnel, while insufficient revenue from new products points to the poor performance of regional innovation output. These factors work together synergistically, exacerbating the shortage of innovators and impeding the improvement of innovation niche fitness. Representative provinces affected by this include Qinghai and Ningxia.
Within configuration NH2, limitations in innovation subjects and inadequate resources put a damper on enhancing regional innovation capacity, resulting in reduced niche fitness. Universities and research institutions are crucial components of regional science and technology outputs, while human and financial resources determine the potential for regional innovation. With a solid resource endowment, innovation inputs are relatively sufficient, serving as the foundation for achieving innovation outcomes. However, when both the primary body of regional innovation output and innovation resources are lacking, even a high level of enterprise innovation capacity can fail to achieve high-level innovation niche fitness. Representative provinces such as Gansu and Inner Mongolia exemplify this challenge.

6. Conclusions and Suggestions

Based on the niche theory, a research framework of niche fitness for the innovation ecosystem and its influencing factors was constructed. Taking nine provinces along the Yellow River Basin in China as research objects, in this study, we investigated the spatiotemporal evolution characteristics, multiple influencing factors, and shaping paths of innovation niche fitness using spatiotemporal analysis and qualitative comparison methods. Our findings are as follows:
First, from 2000 to 2017, the levels of innovation niche fitness remained relatively stable, with slight fluctuations. Innovation niche fitness levels experienced a sharp rise after 2017, but the overall level is still relatively low. The possible cause may be attributed to the fact that the market and product demand niches that would reflect the needs of innovation consumers lagged behind. Midstream and downstream regions, such as Shandong, Henan, and Sichuan, displayed higher levels of fitness, while Qinghai, Ningxia, Gansu, and Inner Mongolia lack innovation subjects, resources, and environmental advantages, leading to lower levels of fitness.
Second, the innovation niche fitness within the Yellow River Basin is affected by several significant factors, including the number of industrial enterprises above the designated size, R&D personnel, higher education institutions, scientific research institutions, expenditure for technical renovation, sales revenue of new products, total expenditure on R&D, and total retail sales of consumer goods. To enhance the innovation niche fitness, provinces and regions should prioritize their attention on addressing these critical factors.
Finally, with the analysis of sufficiency, we categorized the high level of innovation niche fitness in the Yellow River Basin into four distinct paths: Paths H1a and H1b highlighted the importance of innovative human resources; path H2 highlighted the synergies among areas of innovation, human capital, and market demand; and path H3 highlighted the capability for technological innovation as critical in improving innovation niche fitness in under-resourced regions. Conversely, the low level of innovation niche fitness occured along two distinct paths and featured an asymmetric association with the high level of innovation niche fitness path.
The quality development of the Yellow River Basin is closely tied to the enhancement of the innovation ecology. To achieve innovation development in the basin, it is essential to cultivate an integrated and symbiotic innovation ecosystem [43]. A well-functioning innovation ecosystem should be an entity where innovation subjects and factors continually interact and integrate. The interaction of technology and the market should encourage innovation subjects to attain their maximum potential. It falls upon the government to create a liberal and encouraging environment for innovation. It is also necessary to facilitate coordination among different innovation subjects and strengthen innovation dynamics through institutional and policy reforms and coordinated planning, thus promoting innovation development in the Yellow River Basin.
Shandong and Henan located in the downstream region of the Yellow River achieved high niche fitness under the joint effect of human capital and market demand targeting innovation. Therefore, provinces in the downstream region should further prioritize the decisive role of human capital aimed toward innovation and attract more technology-oriented enterprises and high-quality talents to settle down. Meanwhile, they should improve the R&D and production capabilities of key core technologies to create diversified products for the demand market. In addition, the government should lead the establishment of an innovative eco-industrial park that appeals to high-tech firms looking to establish operations in the locality. Through industrial clustering, this initiative can invigorate economic growth while simultaneously providing benefits throughout the surrounding areas, thus enhancing their technological innovation potential [44].
The midstream region of the Yellow River is mostly composed of provinces that primarily rely on natural resources. The results of path analysis also indicate the core role of technological innovation in achieving a high niche fitness. Based on this, Shaanxi Province located in the midstream region of the Yellow River should make full use of the advantages of numerous universities. By constructing industry-academia-research cooperation networks based on the excellent innovation outputs of universities, it can further enhance the capability of transforming enterprise innovation achievements. Moreover, building green and efficient technology enterprise incubation bases and transformation platforms can facilitate effective linkage between innovation production and consumption.
The upstream region of the Yellow River faces challenges in achieving innovation development due to having few innovation producers and resources and low market demand. To address this issue, the government should play a leading role by formulating relevant favorable policies, increasing innovation input, and enhancing the vitality of innovation entities. In addition, they should accelerate the construction of innovation achievement transformation service platforms, emphasize the utilization capability of innovative resources, and strengthen cooperation with provinces with higher innovation capabilities to expand the market for innovation achievements.

Author Contributions

Conceptualization, H.H.; methodology, X.Z.; software, C.Z.; formal analysis, X.Z.; resources, X.Z.; writing—original draft preparation, X.Z.; writing—review and editing, C.Z.; visualization, C.Z.; funding acquisition, H.H. All authors have read and agreed to the published version of the manuscript.

Funding

This research was funded by the National Natural Science Foundation of China (No. 72072144), the Humanities and Social Sciences Foundation of the Ministry of Education of China (No. 19YJA890006), the Shaanxi Provincial Social Science Foundation Project (No. 2019S016), the Shaanxi Provincial Innovation Capability Support Program Soft Science Research Program Project (Nos. 2022KRM129, 2021KRM183, 2019KRZ007), and the Key Project of Xi’an Science and Technology Bureau Soft Science Research Program (No. 21RKYJ0009).

Institutional Review Board Statement

Not applicable.

Informed Consent Statement

Not applicable.

Data Availability Statement

This study does not report any data. The entire analysis was conducted using publicly available secondary data, and there are no data required to make available.

Conflicts of Interest

The authors declare no conflict of interest.

References

  1. Ma, D.; Zhu, Q. Innovation in emerging economies: Research on the digital economy driving high-quality green development. J. Bus. Res. 2022, 145, 801–813. [Google Scholar] [CrossRef]
  2. Fukuda, K. Science, technology and innovation ecosystem transformation toward society 5.0. Int. J. Prod. Econ. 2020, 220, 107460. [Google Scholar] [CrossRef]
  3. Carayannis, E.G.; Grigoroudis, E.; Campbell, D.F.; Meissner, D.; Stamati, D. The ecosystem as helix: An exploratory theory-building study of regional co-opetitive entrepreneurial ecosystems as Quadruple/Quintuple Helix innovation models. R D Manag. 2018, 48, 148–162. [Google Scholar] [CrossRef]
  4. Pidorycheva, I.; Shevtsova, H.; Antonyuk, V.; Shvets, N.; Pchelynska, H. A conceptual framework for developing of regional innovation ecosystems. Eur. J. Sustain. Dev. 2020, 9, 626. [Google Scholar] [CrossRef]
  5. Kuzior, A.; Pidorycheva, I.; Liashenko, V.; Shevtsova, H.; Shvets, N. Assessment of national innovation ecosystems of the EU countries and Ukraine in the interests of their sustainable development. Sustainability 2022, 14, 8487. [Google Scholar] [CrossRef]
  6. Chen, Y.; Lei, H.; Hsu, W. A study on the sustainable development strategy of firms: Niche and social network theory. Sustainability 2019, 11, 2593. [Google Scholar] [CrossRef] [Green Version]
  7. Peng, B.; Zheng, C.; Wei, G.; Elahi, E. The cultivation mechanism of green technology innovation in manufacturing industry: From the perspective of ecological niche. J. Clean. Prod. 2020, 252, 119711. [Google Scholar] [CrossRef]
  8. Grinnell, J. The niche-relationships of the California thrasher. Auk 1917, 34, 427–433. [Google Scholar] [CrossRef]
  9. Hutchinson, G.E. Concluding remarks—Cold spring harbor symposia on quantitative biology. Bull. Math. Biol. 1957, 22, 415–427. [Google Scholar]
  10. Li, Z.Z.; Lin, H. The niche-fitness model of crop population and its application. Ecol. Model. 1997, 104, 199–203. [Google Scholar]
  11. Xie, X.M.; Liu, X.J.; Blanco, C. Evaluating and forecasting the niche fitness of regional innovation ecosystems: A comparative evaluation of different optimized grey models. Technol. Forecast. Soc. 2023, 191, 122473. [Google Scholar] [CrossRef]
  12. Yin, S.; Li, B.Z. Academic research institutes-construction enterprises linkages for the development of urban green building: Selecting management of green building technologies innovation partner. Sustain. Cities Soc. 2019, 48, 101555. [Google Scholar] [CrossRef]
  13. Liu, H.D.; Lu, C.X. The impact of innovation ecosystem resilience on high-quality economic development. Forum Sci. Tech. China 2023, 321, 48–57. [Google Scholar]
  14. Qin, L.L.; Wang, D.P.; Zhou, C. Application of integrated ecological niche suitability in the sustainability evaluation of regional innovation systems. Syst. Eng. Theory Pract. 2011, 31, 927–935. [Google Scholar]
  15. Ding, L.; Wu, J. Innovation ecosystem of CNG vehicles: A case study of its cultivation and characteristics in Sichuan, China. Sustainability 2018, 10, 39. [Google Scholar] [CrossRef] [Green Version]
  16. Villani, E.; Lechner, C. How to acquire legitimacy and become a player in a regional innovation ecosystem? The case of a young university. J. Technol. Transfer 2021, 46, 1017–1045. [Google Scholar] [CrossRef]
  17. Xie, X.M.; Liu, X.J. Evaluation and prediction of regional innovation ecosystem ecological niche suitability—An empirical study based on data from 30 Chinese provinces and cities from 2009–2018. Stud. Sci.-Sci. 2021, 39, 1706–1719. [Google Scholar]
  18. Zhou, C.; Zhang, X.H.; Zhang, Q. Study on the construction and spatial differences of the “Five in One” comprehensive evaluation system for the Yellow River Basin. J. Des. Res. 2021, 41, 1–11. [Google Scholar]
  19. Yan, X.; Bai, J.; Zhang, Y.; Hu, S. Can the ecological environment reverse feed renewable energy technology innovation?—Heterogeneity test from the Yangtze River Economic Belt. Renew. Energy 2022, 195, 1381–1392. [Google Scholar] [CrossRef]
  20. Geng, W.; Li, Y.; Zhang, P.; Yang, D.; Jing, W.; Rong, T. Analyzing spatio-temporal changes and trade-offs/synergies among ecosystem services in the Yellow River Basin, China. Ecol. Indic. 2022, 138, 108825. [Google Scholar] [CrossRef]
  21. Liu, K.; Qiao, Y.; Shi, T.; Zhou, Q. Study on coupling coordination and spatiotemporal heterogeneity between economic development and ecological environment of cities along the Yellow River Basin. Environ. Sci. Pollut. Res. 2021, 28, 6898–6912. [Google Scholar] [CrossRef] [PubMed]
  22. Nowak, M.A.; Tarnita, C.E.; Antal, T. Evolutionary dynamics in structured populations. Philos. Trans. R. Soc. 2010, 365, 19–30. [Google Scholar] [CrossRef] [PubMed] [Green Version]
  23. Guan, X.; Chen, L.; Xia, Q.; Qin, Z. Innovation efficiency of Chinese pharmaceutical manufacturing industry from the perspective of innovation ecosystem. Sustainability 2022, 14, 12993. [Google Scholar] [CrossRef]
  24. Block, J.H.; Thurik, R.; Zhou, H. What turns knowledge into innovative products? The role of entrepreneurship and knowledge spillovers. J. Evol. Econ. 2013, 23, 693–718. [Google Scholar] [CrossRef] [Green Version]
  25. Zhang, W.; Liu, P.F.; Zhang, J.K. Multi-group symbiotic evolution mechanism in an innovative ecosystem: Evidence from China. Rev. Cercet. Interv. Soc. 2019, 66, 249. [Google Scholar] [CrossRef]
  26. Liao, K.C.; Zhang, Y.C.; Du, Q.H. Research on the decomposition and formation mechanism of regional differences in the dynamic operating efficiency of China’s regional innovation ecosystem. Sci. Sci. Manag. Sci.-Tech. 2022, 43, 94–116. [Google Scholar]
  27. Gobble, M.A.M. Charting the innovation ecosystem. Res. Technol. Manag. 2014, 57, 55–59. [Google Scholar]
  28. Xu, K.; Bossink, B.; Chen, Q. Efficiency evaluation of regional sustainable innovation in China: A slack-based measure (SBM) model with undesirable outputs. Sustainability 2019, 12, 31. [Google Scholar] [CrossRef] [Green Version]
  29. Coles, A.M.; Piterou, A.; Sentić, A. Is small really beautiful? A review of the concept of niches in innovation. Technol. Anal. Strateg. 2018, 30, 895–908. [Google Scholar] [CrossRef]
  30. Chen, P.C.; Hung, S.W. An actor-network perspective on evaluating the R&D linking efficiency of innovation ecosystems. Technol. Forecast. Soc. 2016, 112, 303–312. [Google Scholar]
  31. Wang, L.Y.; Hu, H.Q.; Wang, X.Z. The dynamic evolution of the structure of an urban housing investment niche network and its underlying mechanisms: A case study of 35 large and medium-sized cities in China. Sustainability 2022, 14, 3523. [Google Scholar] [CrossRef]
  32. Schneider, C.Q.; Wagemann, C. Reducing complexity in Qualitative Comparative Analysis (QCA): Remote and proximate factors and the consolidation of democracy. Eur. J. Polit. Res. 2006, 45, 751–786. [Google Scholar] [CrossRef]
  33. Xia, M.; Xie, Z.M.; Lin, H.; He, X.W. Synergistic mechanism of the high-quality development of the urban digital economy from blockchain adoption perspective—A configuration approach. J. Theor. Appl. El. Comm. 2022, 17, 704–721. [Google Scholar] [CrossRef]
  34. Roig-Tierno, N.; Gonzalez-Cruz, T.F.; Llopis-Martinez, J. An overview of qualitative comparative analysis: A bibliometric analysis. J. Innov. Knowl. 2017, 2, 15–23. [Google Scholar] [CrossRef]
  35. Huang, Y.J.; Bu, Y.J.; Long, Z.H. Institutional environment and college students’ entrepreneurial willingness: A comparative study of Chinese provinces based on fsQCA. J. Innov. Knowl. 2023, 8, 100307. [Google Scholar] [CrossRef]
  36. Bhunia, A. Statistical Methods for Practice and Research (A Guide to Data Analysis Using SPSS). S. Asian J. Manag. 2013, 1, 154. [Google Scholar]
  37. Yin, D.; Ming, X.G.; Zhang, X.Y. Sustainable and smart product innovation ecosystem: An integrative status review and future perspectives. J. Clean. Prod. 2020, 274, 123005. [Google Scholar] [CrossRef]
  38. Du, Y.Z.; Jia, L.D. Histrionic perspective and qualitative comparative analysis (QCA): A new path for management research. J. Manag. World 2017, 33, 155–167. [Google Scholar]
  39. Ragin, C.C. The Comparative Method: Moving beyond Qualitative and Quantitative Strategies; University of California Press: Oakland, CA, USA, 2014. [Google Scholar]
  40. Fan, D.; Li, Y.; Chen, L. Configuring innovative societies: The crossvergent role of cultural and institutional varieties. Technovation 2017, 66, 43–67. [Google Scholar] [CrossRef]
  41. Zhang, M.; Du, Y.Z. The application of QCA methods in organization and management research: Orientation, strategy and direction. J. Manag. 2019, 16, 1312–1323. [Google Scholar]
  42. Pattyn, V.; Molenveld, A.; Befani, B. Qualitative comparative analysis as an evaluation tool: Lessons from an application in development cooperation. Am. J. Eval. 2019, 40, 55–74. [Google Scholar] [CrossRef]
  43. Wu, Y.; Yang, S.; Liu, F.; Cao, Y.; Jiang, M. The security and driving factors of the innovative ecosystem: Evidence from the Yellow River Basin. Int. J. Environ. Res. Public Health 2023, 20, 2482. [Google Scholar] [CrossRef] [PubMed]
  44. Cui, Z.P.; Liu, X.Y.; Qin, H.; Ji, H.M. Differential game analysis of enterprises investing in new infrastructure and maintaining social network security under the digital innovation ecosystem. IEEE Access 2022, 10, 69577–69590. [Google Scholar] [CrossRef]
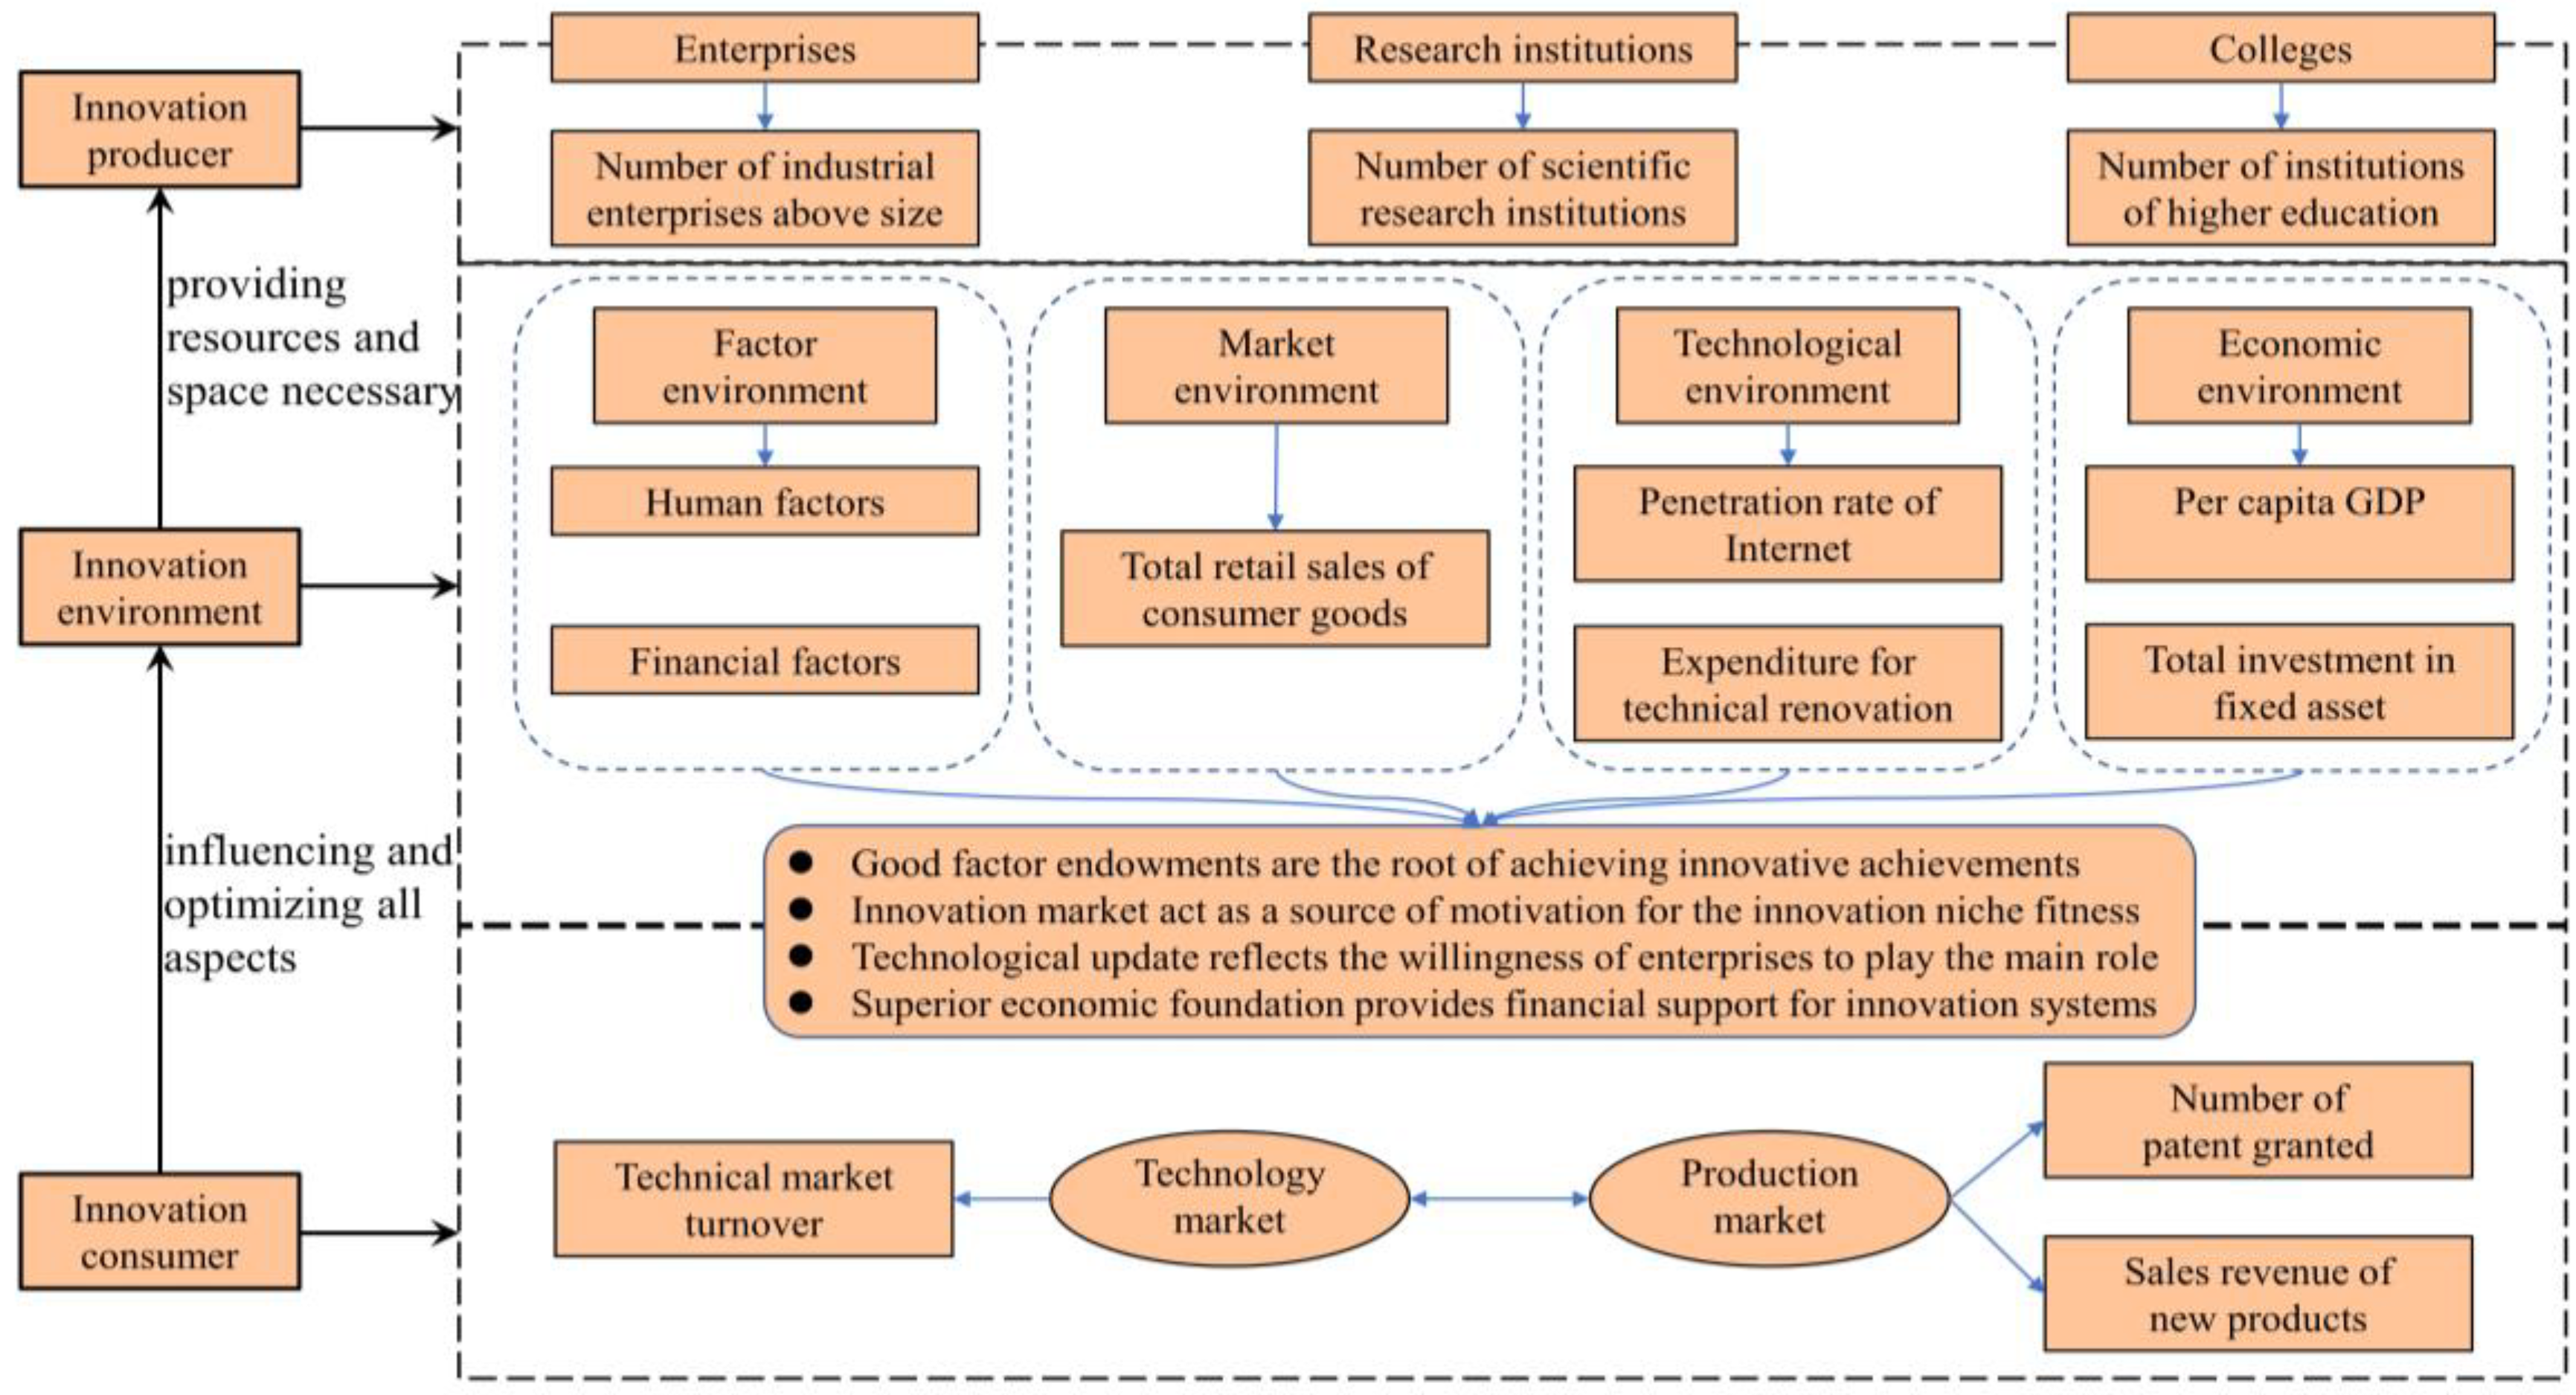
Figure 1. Complex framework on innovation ecosystem.
Sustainability 15 09454 g001
Figure 2. Trend for overall innovation niche fitness and each ecological factor in the Yellow River Basin, 2000–2019.
Sustainability 15 09454 g002
Figure 3. Trends for innovation niche fitness in upstream, midstream and downstream regions, 2000–2019.
Sustainability 15 09454 g003
Figure 4. Trends for innovation ecosystem niche fitness in nine provinces. Sub figures (ac) represent the years 2000, 2010, and 2019.
Sustainability 15 09454 g004
Table 1. Index system for the innovation ecosystem.
Evaluation ObjectivesPrimary
Index
Secondary IndexDescription of Secondary Indicators (Unit)
Innovation ecosystemInnovation producerenterprisesNumber of industrial enterprises above designated size (unit)
research institutionsNumber of regular institutions of higher education (unit)
universitiesNumber of scientific research institutions (unit)
Innovation consumertechnology marketTechnical market turnover (104 yuan)
production marketNumber of patents granted (piece)
Sales revenue of new products (104 yuan)
Innovation environmentfactor environmentFull-time equivalent of R&D personnel (man-year)
Total expenditure on R&D (104 yuan)
Expenditure for education (104 yuan)
Number of college students per 100,000 people (students)
market environmentTotal retail sales of consumer goods (104 yuan)
technological environmentPenetration rate of the Internet (%)
Expenditure for technical renovation (104 yuan)
economic environmentPer capita GDP (yuan)
Total investment in fixed assets (104 yuan)
Table 2. Correlation analysis of variables.
Conditional VariablesInnovation Niche Fitness
RelevanceSignificance
Number of regular institutions of higher education0.911 **0.000
Full-time equivalent of R&D personnel0.892 **0.000
Number of regular institutions of higher education0.853 **0.000
Number of scientific research institutions0.847 **0.000
Expenditure for technical renovation0.782 **0.000
Sales revenue of new products0.743 **0.000
Total expenditure on R&D0.728 **0.000
Total retail sales of consumer goods0.715 **0.000
Number of patents granted0.796 0.010
Technical market turnover0.784 0.012
Number of college students per 100,000 people0.2770.471
Per capita GDP0.1420.058
Expenditure for education0.5470.119
Total investment in fixed assets0.2730.478
Penetration rate of the Internet0.0160.829
Note: ** Significantly correlated at the 0.01 level (bilaterally).
Table 3. Calibration points for each variable.
VariablesComplete
Affiliation
Crossover PointComplete
Unaffiliation
Innovation niche fitness0.7910.4890.413
Number of industrial enterprises above designated size25,774.9803930.850630.900
Number of scientific research institutions201.130113.80022.370
Number of regular institutions of higher education111.70064.90012.120
Sales revenue of new products63,278,259.2667,568,820.630802,816.281
Full-time equivalent of R&D personnel151,169.59937,214.7304864.307
Total expenditure on R&D5,734,580.940876,388.000118,688.900
Total retail sales of consumer goods13,042.6943470.448441.967
Expenditure for technical renovation2,134,257.022550,546.290119,845.275
Table 4. Analysis of necessary conditions.
VariablesHigh Innovation
Niche Fitness
Low Innovation Niche Fitness
ConsistencyCoverageConsistencyCoverage
Number of industrial enterprises above designated size0.8170.8730.4360.609
~Number of industrial enterprises above designated size0.5890.4160.8090.841
Number of scientific research institutions0.8450.7790.5040.609
~Number of scientific research institutions0.5260.4200.8170.856
Number of regular institutions of higher education0.8300.7710.4620.562
~Number of regular institutions of higher education0.4720.3740.8120.845
Sales revenue of new products0.8050.8360.4210.641
~Sales revenue of new products0.6550.4350.8920.870
Full-time equivalent of R&D personnel0.8960.8630.4090.578
~Full-time equivalent of R&D personnel0.5620.3930.8030.827
Total expenditure on R&D0.8020.8000.4190.613
~Total expenditure on R&D0.6120.4180.8630.865
Total retail sales of consumer goods0.8170.7850.4420.623
~Total retail sales of consumer goods0.6070.4260.8480.872
Expenditure for technical renovation0.8820.7840.4690.611
~Expenditure for technical renovation0.5630.4190.8350.812
Note: “~” stands for “not” in logical operations. In the case of returns, for example, the absence of “~” indicates a high number of industrial enterprises above designated size, and the presence of a “~” indicates a low number of industrial enterprises above designated size. Qualitative comparative analysis is a form of asymmetric analysis. For example, high number of industrial enterprises above designated size are the cause of high innovation niche fitness, but it does not follow that low number of industrial enterprises above designated size are the cause of low innovation niche fitness; that is, the reasons for the emergence or otherwise of the desired outcome are asymmetric and need to be analyzed separately.
Table 5. Configuration path analysis of high and low innovation niche fitness in the Yellow River Basin.
Conditional VariablesHigh Innovation Niche FitnessLow Innovation
Niche Fitness
H1aH1bH2H3NH1aNH2
Number of industrial enterprises above designated size Sustainability 15 09454 i001Sustainability 15 09454 i002Sustainability 15 09454 i003Sustainability 15 09454 i002
Number of scientific research institutionsSustainability 15 09454 i002Sustainability 15 09454 i002 Sustainability 15 09454 i004
Number of regular institutions of higher educationSustainability 15 09454 i002Sustainability 15 09454 i002Sustainability 15 09454 i002 Sustainability 15 09454 i004Sustainability 15 09454 i003
Sales revenue of new productsSustainability 15 09454 i003Sustainability 15 09454 i003Sustainability 15 09454 i002 Sustainability 15 09454 i004Sustainability 15 09454 i002
Full-time equivalent of R&D personnelSustainability 15 09454 i001Sustainability 15 09454 i001Sustainability 15 09454 i001Sustainability 15 09454 i003Sustainability 15 09454 i004Sustainability 15 09454 i004
Total expenditure on R&D Sustainability 15 09454 i002Sustainability 15 09454 i002Sustainability 15 09454 i003Sustainability 15 09454 i003Sustainability 15 09454 i004
Total retail sales of consumer goods Sustainability 15 09454 i003Sustainability 15 09454 i001Sustainability 15 09454 i002Sustainability 15 09454 i003
Expenditure for technical renovation Sustainability 15 09454 i001 Sustainability 15 09454 i002
Consistency0.920.930.920.870.971
Coverage0.410.450.740.480.750.22
Unique coverage0.020.010.010.010.480.12
Consistency of solutions0.850.97
Coverage of solutions0.910.81
Note: Sustainability 15 09454 i001 indicates that the core condition is present; Sustainability 15 09454 i002 indicates that the marginal condition is present; Sustainability 15 09454 i004 indicates that the core condition is missing; Sustainability 15 09454 i003 indicates that the marginal condition is missing; a space indicates that the condition is optional.
Disclaimer/Publisher’s Note: The statements, opinions and data contained in all publications are solely those of the individual author(s) and contributor(s) and not of MDPI and/or the editor(s). MDPI and/or the editor(s) disclaim responsibility for any injury to people or property resulting from any ideas, methods, instructions or products referred to in the content.