Article

A Feature Fusion Method for Driving Fatigue of Shield Machine Drivers Based on Multiple Physiological Signals and Auto-Encoder

1
School of Mechanical Engineering, Shenyang University of Technology, Shenyang 110870, China
2
College of Business Administration, Northeast University, Shenyang 110819, China
*
Author to whom correspondence should be addressed.
Sustainability 2023, 15(12), 9405; https://doi.org/10.3390/su15129405
Submission received: 2 April 2023 / Revised: 12 May 2023 / Accepted: 25 May 2023 / Published: 12 June 2023

Abstract

:
The driving fatigue state of shield machine drivers directly affects the safe operation and tunneling efficiency of shield machines during metro construction. To cope with the problem that it is challenging to simulate the working conditions and operation process of shield machine drivers using driving simulation platforms and that the existing fatigue feature fusion methods usually show low recognition accuracy, shield machine drivers at Shenyang metro line 4 in China were taken as the research subjects, and a multi-modal physiological feature fusion method based on an L2-regularized stacked auto-encoder was designed. First, the ErgoLAB cloud platform was used to extract the combined energy feature (E), the reaction time, the HRV (heart rate variability) time-domain SDNN (standard deviation of normal-to-normal intervals) index, the HRV frequency-domain LF/HF (energy ratio of low frequency to high frequency) index and the pupil diameter index from EEG (electroencephalogram) signals, skin signals, pulse signals and eye movement data, respectively. Second, the physiological signal characteristics were extracted based on the WPT (wavelet packet transform) method and time–frequency analysis. Then, a method for driving fatigue feature fusion based on an auto-encoder was designed aiming at the characteristics of the L2-regularization method to solve the over-fitting problem of small sample data sets in the process of model training. The optimal hyper-parameters of the model were verified with the experimental method of the control variable, which reduces the loss of multi-modal feature data in compression fusion and the information loss rate of the fused index. The results show that the method proposed outperforms its competitors in recognition accuracy and can effectively reduce the loss rate of deep features in existing decision-making-level fusion.

1. Introduction

The display interface of the main control room of shield machines mainly consists of several modules, such as the real-time load display of cutters, the operation information display of belt and screw conveyors, transportation system monitoring and the posture sensing information display. During shield tunneling, due to uneven geology, shield drivers need to adjust and control multi-dimensional tunneling parameters, such as torque, boost force, position and posture, in real time and carry out multi-information interaction and multi-task collaboration operations to ensure the safety and efficiency of shield tunneling. Therefore, the high attention and multi-task operation of shield drivers during operation can easily lead to driving fatigue, which affects the construction safety and driving efficiency of shields. So, how to effectively identify and evaluate the driving fatigue state of shield drivers is the key to ensuring the safety of shield driving and construction efficiency.
Shield drivers usually pay attention to shield position, main thrust, screw conveyor status and video monitoring information in metro construction tunnels with vibration and noise and complete real-time adjustments of driving parameters. Multi-information interaction and multi-task collaboration abilities, which mainly include perceptual information, decision making and operational ability, are directly related to driving fatigue. At present, some significant works on intelligent transportation technologies have attracted many concerns [1,2,3,4,5,6,7]. Research on driving fatigue mainly identifies fatigue status using the corresponding changes in physiological indicators such as EEG, electrocardiogram (ECG), electro-myogram (EMG), electrodermal activity (EDA) and so on.
For instance, Sun et al. established an individual fatigue identification model based on the indicators calculated using the individual driver’s best parameters and unified parameters [8]. Zou et al. proposed a method based on the combination of the shortest path tree for constructing a functional brain network that is applied to fatigue driving state recognition and neural mechanism analysis of fatigue driving [9]. Moreover, an improved Bayesian fusion algorithm was presented for forecasting the blink number in a continuous video [10]. In [11], the EEG signal was explored to detect the driving fatigue. The results showed that the average intraclass correlation coefficients of the measures at the sensor level were generally higher than those at the source level, except for the directed between-region measures.
Moreover, Wang et al. presented a driving fatigue detection approach based on the brain functional network and then provided a possible method for the key EEG electrode and rhythm investigation with these brain networks [12]. The authors of [13] applied the multifractal detrended fluctuation analysis (MF-DFA) method to detect driver fatigue caused by driving for a long time. A novel relative wavelet entropy complex network method was introduced for improving the classification accuracy in [14]. Kong et al. proposed a method to evaluate driver fatigue that utilizes inter/intra-region phase synchronization and functional units (FUs) to explore whether EEG synchronization changes from the alert state to the fatigue state and indicates a simple and significant spatial-frequency pair of electrodes [15].
Du et al. used a single RGB-D camera to extract three fatigue features, including heart rate, eye openness level and mouth openness level [16]. The authors of [17] established a mental fatigue assessment model combining subjective self-state assessment and facial features. In [18], a specific feature-weighted support vector machine was designed to handle individual differences. Lin et al proposed a fuzzy recurrent neural network for driver fatigue detection based on steering-wheel angle sensor data [19]. Mousavi et al. designed a binary classification system based on the compression sensing of EEG signals and a deep neural network [20].
To handle the issue that the accuracy of the fatigue assessment of instructors decreases due to individual differences, a driving fatigue assessment method based on the fusion of electroencephalogram and electro-myogram features as well as migration learning was presented by Qi et al. [21]. The authors of [22] calculated the absolute alpha power by collecting the EEG signals of the subjects and combined it with the subjective state evaluation method to assess the effectiveness of the proposed method. Wang et al. extracted the features from EEG and EOG based on entropy theory, fused the features on the basis of canonical correlation analysis and performed classification experiments using correlation vector machine to achieve the time-series complexity measurement of EEG signals [23]. In [24], a driving fatigue detection method based on a multi-non-linear feature fusion strategy was applied. Li et al. proposed a fatigue driving detection model based on multi-feature fusion and semi-supervised active learning [25]. In addition, several works present the application of ML/DL methods for disease and mental workload prediction, such as [26,27,28,29,30,31].
In summary, most studies on driving fatigue collect time-domain physiological signals, such as electroencephalogram and eye movement, using analog driving platforms. For single and multiple time-domain physiological signals, a mapping relationship between driving fatigue and characteristic indicators is established, and a driving fatigue identification model is established using machine learning methods. The working conditions and environment of shield drivers are difficult to simulate, and single or multiple physiological time-domain signals cannot accurately reflect the fatigue state of shield drivers. It is difficult to simulate working conditions and environment with vibration, noise and uneven geology using existing analogue driving platforms. At the same time, existing research on fatigue status identification mostly collects one or more time-domain signals from physiological signals using analogue driving platforms, which makes it difficult to fully reflect driving fatigue information, thus affecting the recognition rate of the fatigue status of shield drivers. Furthermore, when extracting a driver’s physiological signal characteristics, it is necessary to compress the shield driver’s original physiological data, which inevitably lose some valid information, resulting in training loss during the training phase and test loss during data testing, thus affecting the accuracy and robustness of fatigue state identification.
The main contributions of this work can be concluded as follows: First, the time and frequency domains of physiological signals such as electroencephalogram and electrocardiogram during the driving operation of shield drivers were collected using the ErgoLAB cloud platform. Then, a method for fusing the driving fatigue characteristics of shield drivers was developed based on an L2-regularized stacked encoder. Moreover, the EEG features and the ECG features were extracted using the WPT method and time–frequency-domain analysis based on SDNN and LF/HF, respectively. Finally, an L2-regularization-based stacked encoder driver fatigue feature fusion network was constructed, and a regularization factor was added to the stacked self-encoder to fuse the physiological features of the feature layer.
The rest of this paper is arranged as follows: Section 2 presents the shield driver multiple physiological signal feature extraction method. A multi-modal physiological feature fusion method for shield machine drivers based on an L2-regularized auto-encoder is introduced in Section 3. Section 4 shows the experimental design, experimental procedures and data analysis. Finally, Section 5 concludes this work.
From the perspective of engineering management, the feature fusion method based on L2-regularized stacked auto-encoder features proposed in this paper can effectively fuse multi-sensor physiological features. Compared with traditional methods, it can reduce the loss rate of deep features after feature fusion to a certain extent. At the same time, the consumption of recognition time is reduced, and the recognition accuracy of the classification model is improved, so as to achieve the purpose of reducing monitoring costs and improving economic benefits.

2. Analysis of Driving Fatigue Generation Mechanism of Shield Drivers

Based on the analysis of the driving behavior characteristics of shield drivers, combined with the “perception-decision-operation” behavior of shield drivers, the main reason for driving fatigue is to maintain high concentration at all times to perceive the information on the monitor screen in the main control room, determining the type of information and then perform the corresponding operation during the long process of underground environment driving operation. Because of this, the operation process of shield drivers during driving can be divided into the following three kinds: perception information operation, judgment and strategy operation (information processing and thinking operation), and operation tasks. According to the job type, driving fatigue can be divided into perception information fatigue, judgment and strategy fatigue, and operation fatigue, respectively.

2.1. Perceptual Information

In the perception information operation stage, construction information is obtained using the screen and intercom, and the main sensory organs are eyes and ears. Restricted by the working ability of the sensory organs, when the driver stares at the screen for a long time and pays attention to the intercom information, with the decrease in perception ability, the phenomena of perception weakening, perception dullness or hallucination and auditory hallucination appear. In this case, the driver re-perceives the information and confirms the information. Therefore, fatigue in the perception stage is most likely to occur, which is also an important factor in driving fatigue.

2.2. Judgment and Strategy

During the decision-making stage, the main working organ is the brain or central nervous system, in which a judgment is made after processing the perceived information; then, the command signal is sent to the human action organ. With the increase in the amount of perceptual information, the brain and the central nervous system continue working; the mental load of the driver increases; and the ability to judge declines. When judgment error occurs, the information should be reconfirmed and re-perceived to make a new judgment until right.

2.3. Operation Task

In the operation stage, the main working organs are hands and mouth, which are driven to perform the corresponding action or reply after the brain and central nervous system complete the judgment and strategy. This long-time quasi-static operation easily makes the muscles of the driver atrophy and become hard, causing muscular fatigue.

3. Feature Extraction Method for Multi-Physiological Signals of Shield Drivers

To further identify the driving fatigue state of shield machine drivers, the ErgoLAB cloud platform was used in this paper to monitor the physiological signals of shield drivers during driving and then to extract physiological characteristic indicators to characterize the fatigue state of shield drivers. The physiological signals monitored included electroencephalogram (combined energy index E), heart rate variability (SDNN and LF/HF), eye movement (average pupil diameter) and skin electrical signals (response time). The average pupil diameter was used to calculate the change in pupil diameter during the experiment, and the fatigue status was characterized using the change in pupil diameter.
Driving behavior data were used to characterize the driving performance of shield drivers during the driving process, which is based on the driver’s response time, which is the time between the beginning of reading a certain information on the display and the moment when the driver takes action after making a decision upon information processing. Video data were acquired using an external camera and were used to calculate the response time of EDA signals in physiological data during driving. The pupil diameter index and reaction time index obtained during driving were used as indicators to distinguish the fatigue level of drivers; then, combined energy index E, SDNN and LF/HF were integrated as indicators to identify the driver fatigue status to complete shield driver driving fatigue status identification.

3.1. WPT-Based EEG Signal Feature Extraction for Shield Drivers

3.1.1. Analysis of EEG Signal Characteristics of Shield Drivers

The considered process includes the driving task of a shield machine driver and their rest while waiting for segment assembly, as well as the shield tunneling time and the time spent wait for segment assembly. As the operation unfolds, the driver reads the information on the display to control the shield machine to continue tunneling and continuously receives information through the sensory organs. The central nervous system analyzes the shield machine tunneling status according to the shield machine status and tunneling parameters, combined with driving experience and driving skills. Finally, the driver completes the decision and implements it.
This stage is characterized by a high-mental-load working state, in which E θ , E α and E β increase and the combined energy index   E α + E θ E increases. When shield tunneling is suspended, the driver fills in the tunneling record, enters the rest time and informs the segment assembler to carry out segment assembly. In this stage, E θ and E α decrease; E β does not significantly change; and the combined energy index (H) decreases. When the driver’s rest time is over, they start the propulsion system, main drive pump and other equipment in turn; E θ increases; E α increases; E β increases; and the combined energy index (E) increases.
Therefore, the change trend of slow waves and fast waves of the EEG signal can reflect the change process of a shield machine driver from wakefulness to fatigue. Based on this, the energy ratio of slow waves to fast waves of the shield machine driver’s EEG signal is taken as an indicator of the fatigue state and recorded as E.
E = E α + E θ E β + E δ
where E α , E β , E θ , E δ are the energy values of the α , β , θ , δ waves, respectively.

3.1.2. WPT-Based EEG Feature Extraction Method for Shield Drivers

In view of the “high frequency and low resolution” phenomenon caused by the adaptive time–frequency window of the traditional wavelet transform [32], this paper proposes a method for extracting the EEG features of shield drivers based on wavelet packet decomposition and reconstruction. This method is based on the expansion of wavelet decomposition and adaptively matches the characteristics of the analysis signal with the spectrum of the signal to reflect the essential characteristics of the signal. The essence of wavelet packet decomposition is to divide the signal into multiple levels and further decompose the high-frequency part of the signal, so as to solve the problem of “high frequency and low resolution” that occurs when the traditional wavelet transform is used to process EEG signals. The algorithm is as follows:
Let us set arbitrary j-scale space function
S j n ( t ) U j n
Then,
S j n ( t ) = r l j , n u n ( 2 j t l )
Among them, r l j , n is the wavelet packet coefficient. Wavelet packet coefficient r l j , 2 n on subspace U j 2 n and wavelet coefficient r l j , 2 n + 1 on subspace U j 2 n + 1 are obtained by solving wavelet packet coefficient r l j , n :
r l j , 2 n = k H k 2 l r k j + 1 , n r l j , 2 n + 1 = k G k 2 l r k j + 1 , n
Equation (4) is the wavelet packet decomposition algorithm, which decomposes the original EEG signal into multiple wavelet packets with the same bandwidth and interconnected frequency bands. As the number of decomposition layers increases, the resolution of the signal in the frequency domain increases, while the resolution in the time domain decreases. The reconstructed decomposed wavelet packet can improve the resolution in the frequency domain and ensure the resolution in the time domain. Reconstruction refers to preserving the wavelet packet data to be reconstructed after decomposition, clearing the remaining wavelet packet data to zero and improving the time-domain resolution of the retained wavelet packet data to the level of the signal before decomposition. The reconstruction equation can be depicted as follows:
r l j + 1 , 2 = k H l 2 k r k j , 2 n + G l 2 k r k j , 2 n + 1
Signal resampling in data preprocessing is 128 Hz, so the frequency range of the wavelet packet root node is 0~64 Hz, and the decomposition tree diagram is shown in Figure 1.
To represent the original signal, layer decomposition is performed based on the wavelet packet decomposition algorithm; a sub-band is obtained at layer m, and its expression is as follows:
f ( t ) = j = 0 2 i 1 f i , j ( t j ) = f i , 0 ( t 0 ) + f i , 1 ( t 1 ) + + f i , 2 i 1 ( t 2 i 1 )
where j = 0 , 1 , , 2 i 1 ;   f i , j ( t j ) is the reconstructed signal decomposed using the wavelet packet on nodes i , j .
Energy E i , j of reconstructed signal f i , j ( t j ) contained in the sub-band after wavelet packet decomposition is calculated as follows:
E i , j = r f i , j ( t j ) 2 d t = k = 1 m x j , k
where E i , j is the band energy of the f ( t ) wavelet packet decomposed to nodes i , j ; x j , k ( j = 0 , 1 , , 2 i 1 , k = 1 , 2 , m ) is the discrete point amplitude of reconstructed signal f i , j ( t j ) and m is the number of signal sampling points. If E i is the energy value of a node and E is the total energy of all nodes, then the frequency band energy ratio, P j , of the node is as follows:
P j = E j E

3.2. Feature Extraction from ECG of Shield Machine Drivers Based on Time–Frequency-Domain Analysis

A shield driver’s ECG signal is generated by the potential change formed by the heartbeat on the body surface. Therefore, this paper selected the heart rate variability (HRV) index, which refers to the small fluctuation in the instantaneous heart rate between individual continuous heartbeats. The HRV signal contains a lot of information about cardiovascular regulation, reflecting the change rule of the time interval between two consecutive heartbeats. The extraction and analysis of this information can quantitatively evaluate the tension and balance of cardiac sympathetic and vagal nerve activities, and their impact on cardiovascular system activities [33]. Therefore, in this paper, the PPG pulse signal was used as a way to record the heart activity of the subjects. For the ECG fatigue index, this paper selected the HRV time-domain index and frequency-domain index as the evaluation index to study the driving fatigue of shield machine drivers.

3.2.1. HRV Time-Domain Index

HRV time-domain analysis is employed to evaluate heart rate variability by calculating a series of mathematical and statistical indicators related to the R-R interval, reflecting the law of signal change with time. Time-domain indicators mainly reflect the tension of sympathetic and parasympathetic nerves and then evaluate the overall degree of the autonomic nervous system. Therefore, the SDNN was selected as the time-domain characteristic index of HRV to evaluate the overall change in HRV. The SDNN can be obtained as
S D N N = 1 n i = 1 n ( r r i r r ¯ )
where n , r r i and r r ¯ represent the total number of normal cardiac beats, the length of the i-th adjacent sinus RR interval and the average value of n RR intervals, respectively.

3.2.2. HRV Frequency-Domain Index

Fluctuations in the heart rate are usually considered to be periodic. These fluctuations in IBI time series can be quantified by calculating the power spectral density. PSD expresses the spectral power density of time series as a function of frequency and obtains the heart rate power spectrum with frequency as the abscissa and energy as the ordinate, providing the basic information of energy distribution with frequency. Therefore, LF/HF was selected as the frequency-domain index of HRV in this paper, and the LF/HF index can evaluate the balance degree of the autonomic nervous system of a shield machine driver. Based on the ErgoLAB cloud platform, the RR interval was randomly decomposed into energy components at different frequencies, and the power spectral density of the signal was obtained using the classical spectral estimation method of fast Fourier transform, which effectively reflects the composition and energy size of each frequency band in the signal.

4. Shield Machine Driver Multi-Modal Physiological Characteristics Fusion Method Based on Auto-Encoder of L2 Regularization

Based on the physiological data of the operation process of shield machine drivers after pretreatment, we extracted the combined energy feature (E), the reaction time, the HRV time-domain SDNN index and the HRV frequency-domain LF/HF index, respectively. The number of samples was divided into training set, validation set and test set according to the proportion of 3:1:1. Then, all samples were normalized to the range of [0, 1]. Due to the large acquisition frequency and number of channels of the original physiological signals, the number of original data collected was huge. Limited by the experimental equipment, the feature layer fusion method was used for fusion. Based on the L2-regularization method, combined with the characteristic that the auto-encoder can learn the expression of high-order features of data, the over-fitting problem of small sample data sets in the model training process was solved. A method for driving fatigue feature fusion during the operation of shield machine drivers based on an auto-encoder is proposed. The feature is input into the auto-encoder coding model to train and reduce the dimension to complete the fusion and is then decoded by the decoder back to the original input. Then, the sigmoid function is used as the activation function to output the training loss, and the optimal hyper-parameters of the model are verified using the experimental method of the control variable.

4.1. Auto-Encoder

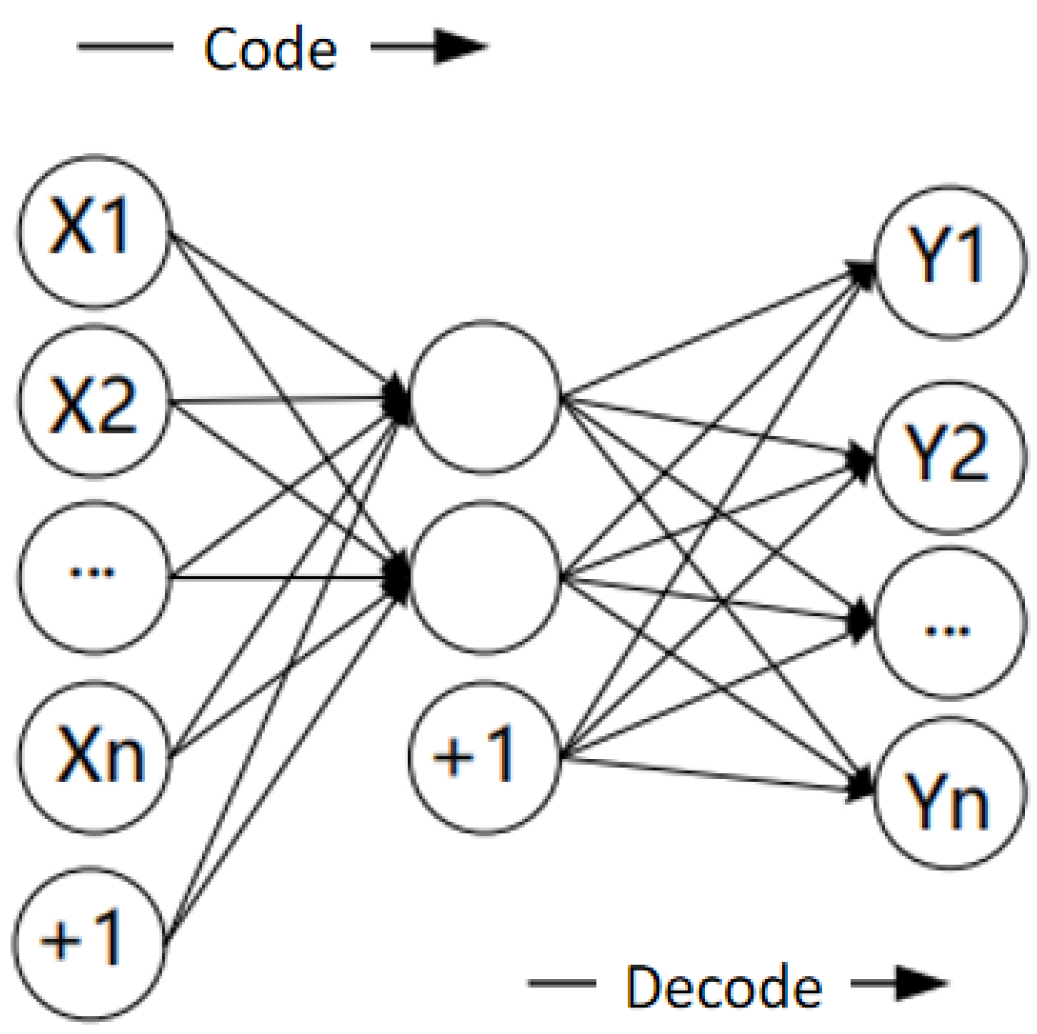
To overcome the problems of large error and easy loss of information in the recognition of the fatigue state using a single physiological feature, this paper introduces the unsupervised learning auto-encoder algorithm of the artificial neural network to learn the efficient representation of input data. In the coding process, the EEG and ECG signals of different drivers are dimensionally reduced using the coding model to achieve the purpose of feature remapping, and the mapping result is a one-dimensional, higher-order feature vector. In the decoding process, the decoding model reversely decodes the one-dimensional, higher-order eigenvectors obtained from the fusion of the coding model into the input physiological signal features as much as possible. Figure 2 shows the network architecture of the basic auto-encoder. The network output is approximately equal to the network input using the back-propagation algorithm. The input is compressed into potential higher-order features, and the output is reconstructed.
Let us suppose that there are n shield machine driver physiological signals as the input, X = { X 1 , X 2 , , X n } , of the auto-encoder and that the auto-encoder coding process uses coding function f θ to compress X into vector a :
a = f ( W 1 X + b 1 )
where a is the encoded higher-order feature vector, a = { a 1 , a 2 , a 3 } T ; the Relu function is the activation function of the coding function; coding weight matrix W 1 R s × n , where the initial value is generally a minimum random value; and offset of the hidden layer b 1 R s × 1 , where its initial value also needs to be initialized and θ 1 = { W 1 , b 1 } represents the set of parameters of the coding part. In the decoding process, the sigmoid function is used as the activation function of decoding function g θ , and higher-order eigenvector a is reversely decoded into Y = { Y 1 , Y 2 , , Y n } .
Y = g ( W 2 a + b 2 )
where weight matrix W 2 R n × s , output layer offset b 2 R n × 1 , and θ 2 = { W 2 , b 2 } represent the parameter set of the decoding part. In forward propagation, the loss is calculated as
l o s s = 1 2 [ X Y ] 2
The parameters in the network are updated as follows: In back propagation, the partial derivative of each parameter is obtained based on the chain rule:
s i g m o i d ( x ) = 1 1 + e x = e x ( 1 + e x ) = s i g mo i d ( x ) [ 1 s i g m o i d ( x ) ] l o s s W 2 = l o s s Y Y W 2 = ( Y X ) [ Y ( 1 Y ) a ] l o s s b 2 = l o s s Y Y b 2 = ( Y X ) [ Y ( 1 Y ) ]
l o s s W 1 = l o s s Y Y a a W 1 = ( Y X ) [ Y ( 1 Y ) W 2 ] [ a ( 1 a ) x ]
l o s s b 1 = l o s s Y Y a a b 1 = ( Y X ) [ Y ( 1 Y ) W 2 ] [ a ( 1 a ) ]
The updated weights are as follows:
W 1 = W 1 l r l o s s W 1 , b 1 = b 1 l r l o s s b 1
W 2 = W 2 l r l o s s W 2 , b 2 = b 2 l r l o s s b 2

4.2. L2 Regularization

This paper took the operation process of shield machine drivers in actual subway shield construction as the research object. Due to the limited construction conditions, the actual number of physiological data samples obtained during the operation of shield machine drivers was small, and the physiological data during the driving task were not balanced with the physiological data at rest; data were prone to the over-fitting phenomenon, which means that a model performs well with training data but has poor generalization ability in the test validation data set. To avoid over-fitting, L2 regularization was introduced to add costs associated with larger weight values to the auto-encoder network loss function, which can reduce the network generalization error and improve the generalization ability of the self-encoder network.
A regular term, Ω ( θ ) = 1 2 w 2 2 , is added to the objective function to make the weight closer to the origin. Assuming that there is no bias in the objective function, the total objective function of the model is expressed as
J ~ ( w , X , y ) = α 2 w T w + J ( w ; X , y )
The corresponding gradient is
w J ~ ( w ; X , y ) = α w + w J ( w ; X , y )
Equations (18) and (19) show that adding weight decay results in a modification of the learning rules, shrinking the weight vector in each step before performing the usual gradient update, multiplying the weight vector by a constant factor.

4.3. Sigmoid Function

Let us suppose that there is a training set of x 1 , y 1 , x 2 , y 2 , , x i , y i fused physiological signal characteristics of shield drivers, where x(i) are the sample data of the shield driver fatigue state and y(i) are the sample labels of the shield driver fatigue state. Using the data extracted from the driver fatigue status features as the input of the classifier and using the sigmoid function as the activation function of the neural network, the training data set is composed of two categories of individual driver fatigue status samples. Using the data extracted from the driver fatigue status features as the input of the classifier and using the sigmoid function as the activation function of the neural network, we make n driver fatigue samples of binary classification into training data set. When fusing the physiological features of driving fatigue of shield drivers, the features are input into the original input after dimension reduction of auto-encoder coding model training.
The sigmoid function is used as the activation function to output the training loss, and the hyper-parameter of the auto-encoder is adjusted experimentally to reduce the training loss. The sigmoid function is a common S-type function. It is often used as an activation function for neural network binary classification problems in deep learning. It maps variables in the range of [0, 1], and its function expression is
P = 1 1 + e x i

4.4. Stacked Auto-Encoder

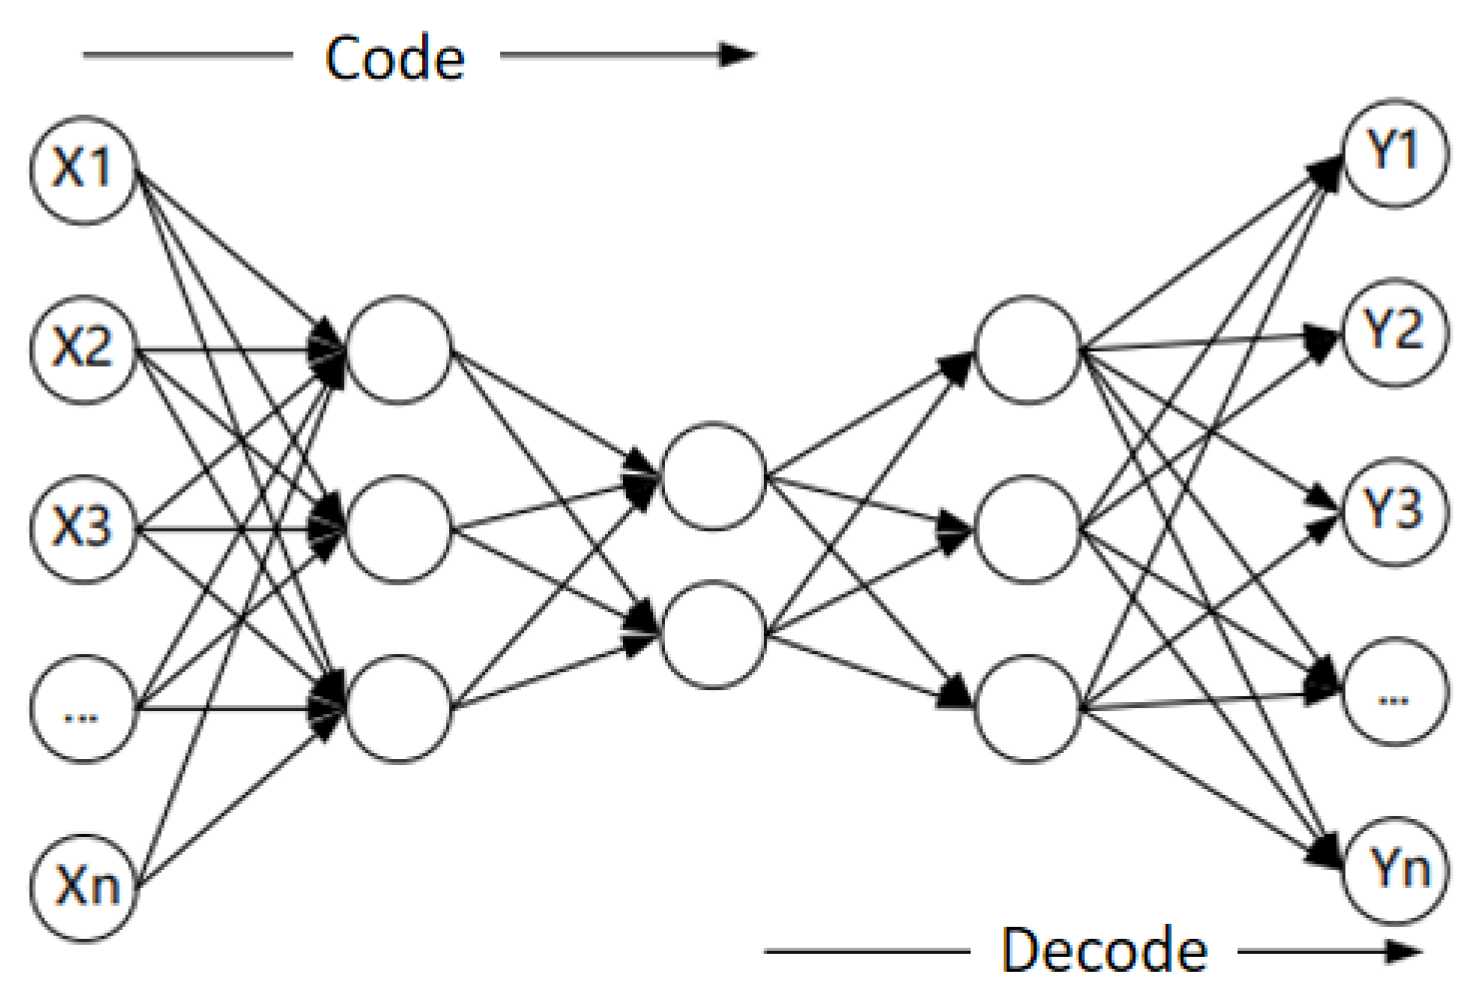
Since it is difficult to extract the high-dimensional features of a shield driver’s physiological data with a single-hidden-layer auto-encoder, the model parameters need to be adjusted to obtain high-order, abstract physiological data features and capture the semantic information of physiological data. This paper built a deep auto-encoder by stacking layers to form an SAE. By training the learning network parameters step by step and updating the weights and offsets of the layers, the high-order and abstract physiological data features are obtained; thus, the multi-modal physiological features of shield drivers are fused. Figure 3 shows the network structure of a stacked auto-encoder.

4.5. Softmax Classifier

Let us suppose that there is a training set of x 1 , y 1 , x 2 , y 2 , , x i , y i fused physiological signal characteristics of shield drivers, where x ( i ) are the sample data of the shield driver fatigue state and y ( i ) are the sample labels of the shield driver fatigue state. With the data extracted from the driver fatigue state feature as input to the classifier, the training data set consisting of n driver fatigue state samples classified by k has the following output probability:
P ( y = i ) = exp ( d w i d x d ) j exp ( d w i d x d ) , i = 1 , 2 , 3 , k
where w i d is the weight parameter vector of the classifier, j is the sample number, and i is the label corresponding to the category. The x ( i ) data of the k-classified problem are classified as having the highest probability. The softmax classifier is trained by finding the optimal parameters with the final optimization algorithm.

4.6. Fusion Method of Driving Fatigue Characteristics of Shield Drivers Based on L2-SAE

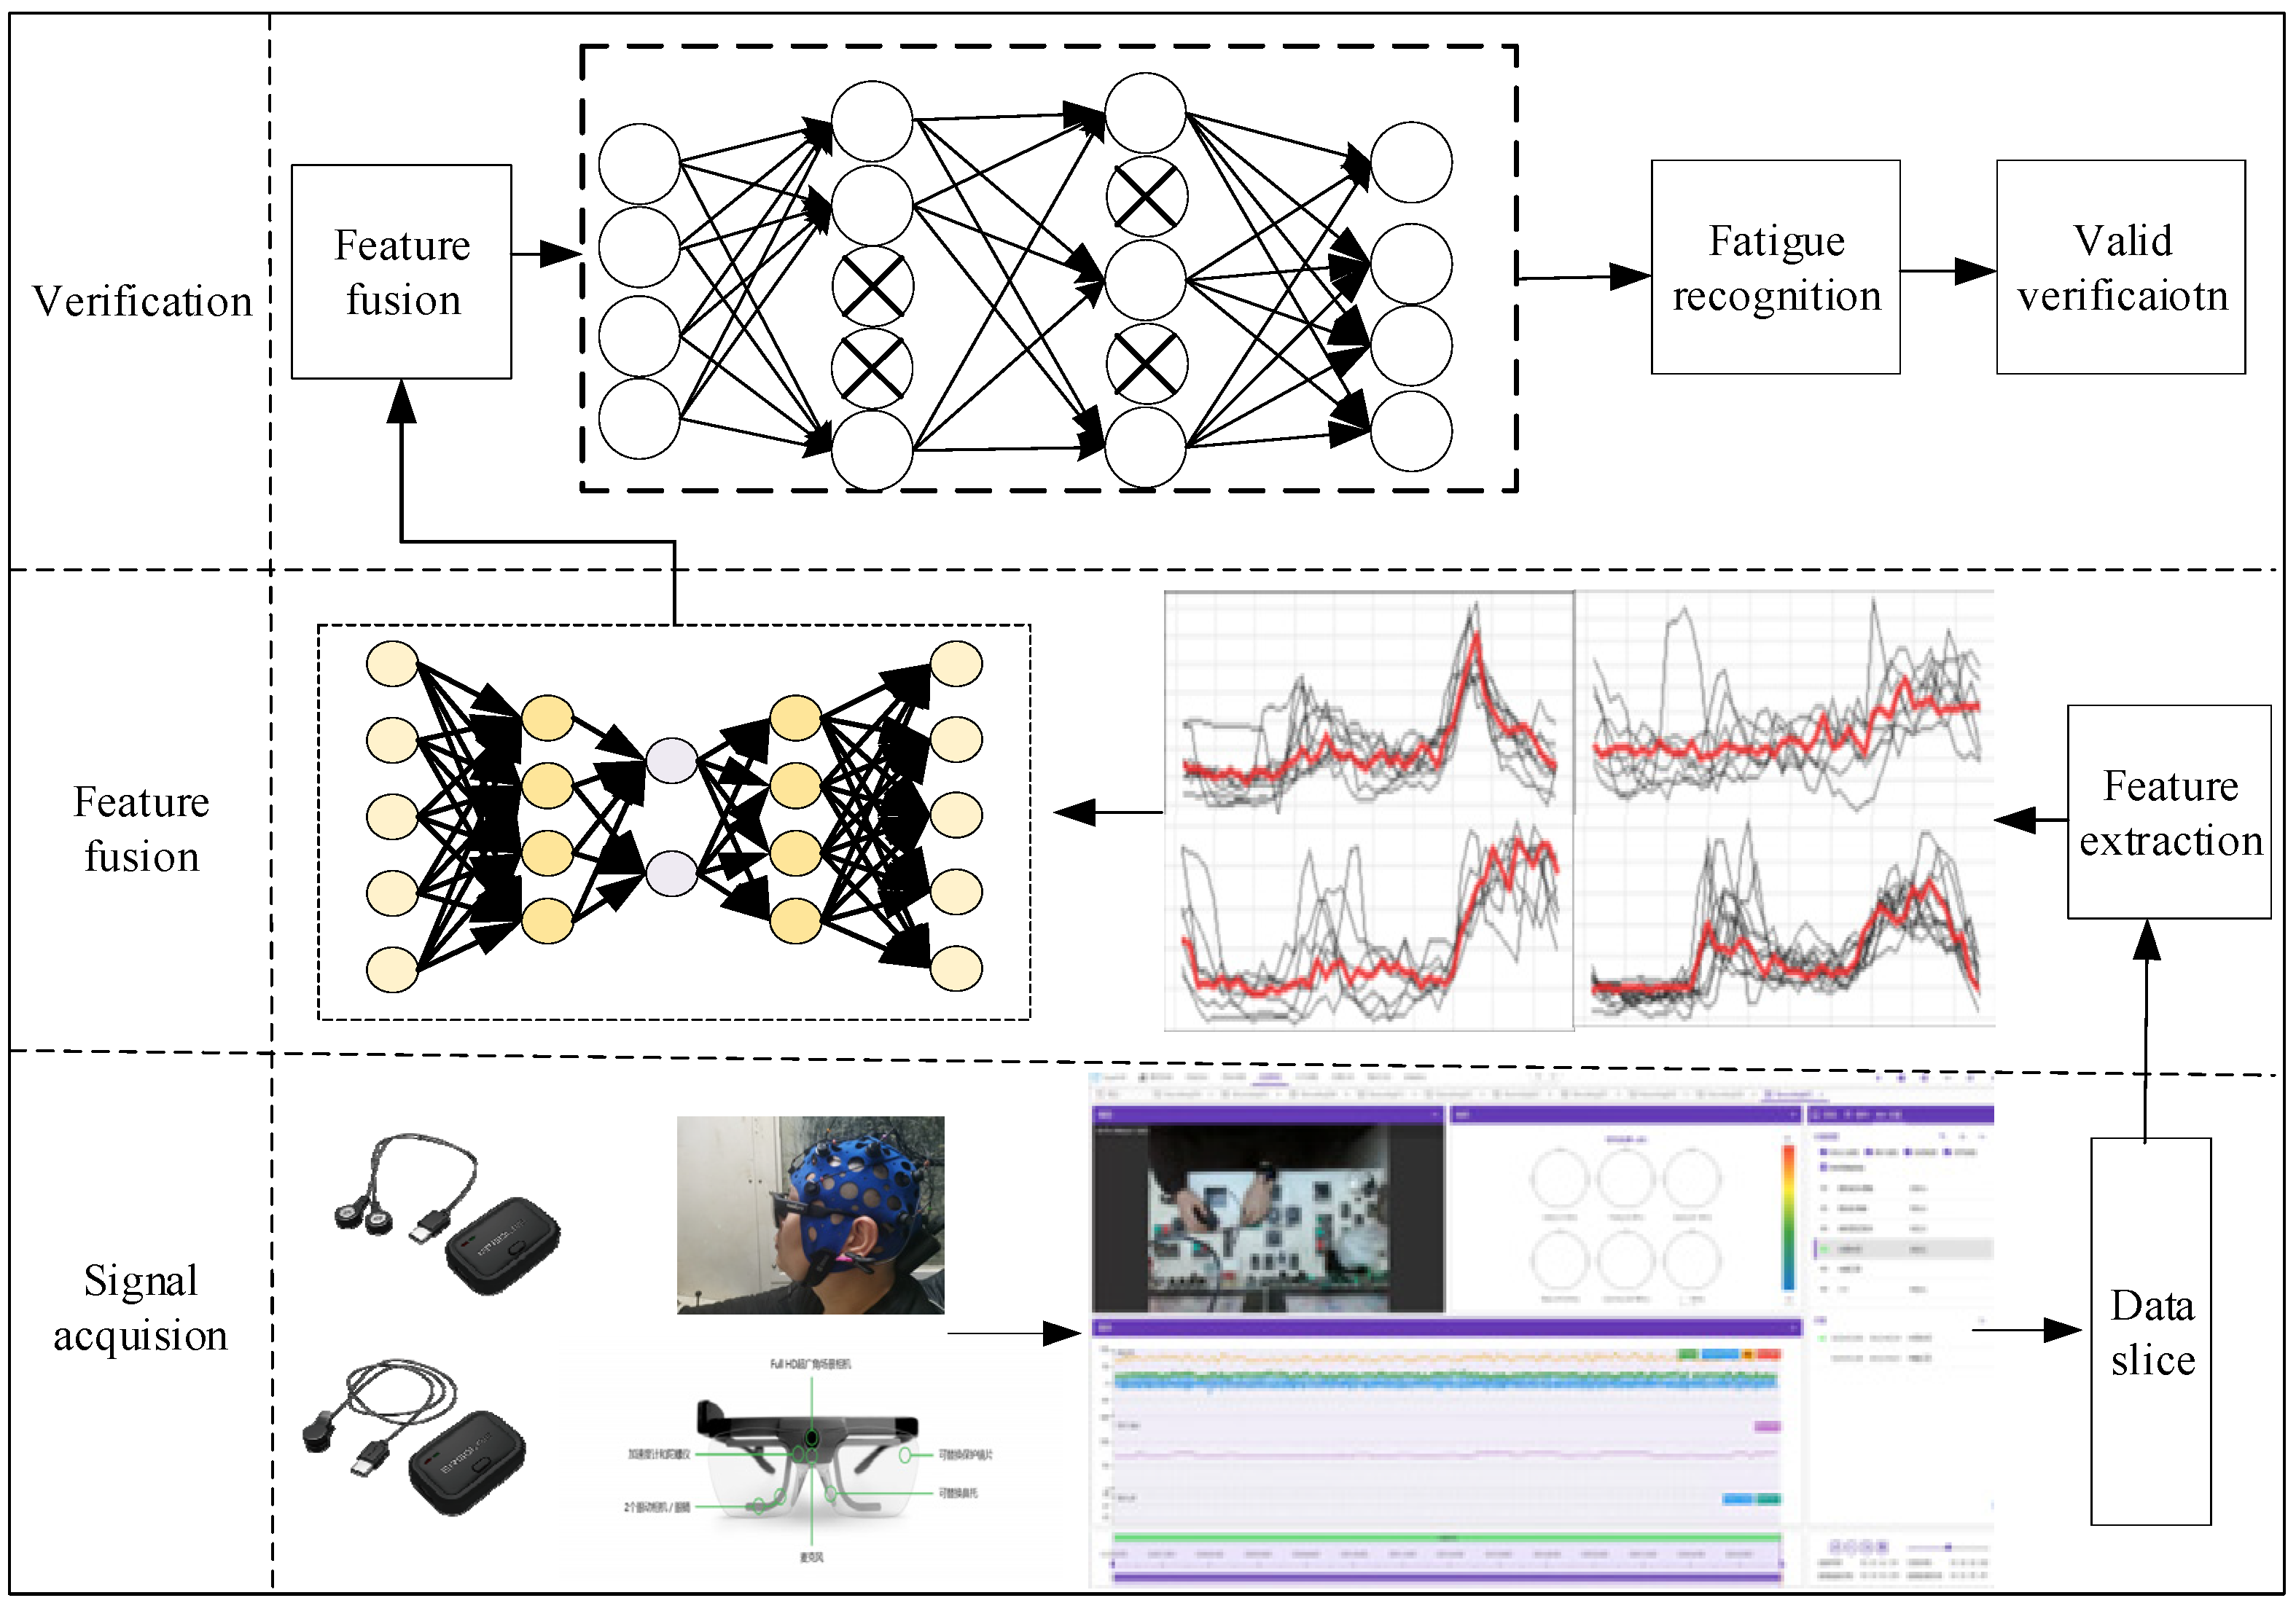
Drivers watch and read monitors to obtain driving parameters in real time during shield driving. In this way, task crossover is high, and cognitive resources are consumed. The subjective self-assessment of drivers inevitably affects their driving cognitive status. Traditional methods cannot extract driving fatigue characteristics and effectively identify driving status in real time. The improvement in computer hardware and software performance has made a breakthrough in deep learning algorithms in academia and applications. Then, an effective method for fusing driving fatigue characteristics of shield drivers that combines the advantages of in-depth learning and the ability of the auto-encoder to learn the expression of higher-order features of data is presented. The overall framework of the proposed method is shown in Figure 4, and the specific steps are as shown below.
Step 1: Data acquisition
Multimodal physiological data, including the fatigue state of shield drivers, such as electroencephalogram, pulse signal, picoelectric signal and other behavior data, were obtained from shield drivers who performed driving tasks at the construction site of Shenyang metro line 9 extension line.
Step 2: Data preprocessing
To preprocess the original multimodal physiological data, we used filtering, removing outliers, ICA and other methods to remove interference, reduce the noise signal in the original data and improve the signal-to-noise ratio.
Step 3: Feature extraction of multimodal physiological data of shield drivers
Based on the feature extraction method mentioned above, we separately carried out the feature extraction of multimodal physiological signals. We divided the samples into training set, validation set and test set according to the 3:1:1 ratio. Finally, we normalized all samples to the [0, 1] range.
Step 4: Building a fused model of driving fatigue characteristics of shield drivers based on L2-SAE
We constructed shield driver driving fatigue feature fusion, initialized various parameters of the network and input the normalized training set and verification set into the auto-encoder. Based on the forward-propagation algorithm, we trained the network layer by layer, minimizing the loss function. We observed the fitting state of the model using Tensorboard, continuously updated the super-parameters to minimize network loss, and completed the initial training.
Step 5: Reverse-propagation fine-tuning
On the basis of Step 4, we used the reverse-propagation algorithm to fine-tune each network, obtained the global optimal weights and offsets and then saved them.
Step 6: Model testing
We input the test sample data into the trained model to test and output the test results.

5. Experiment

5.1. Experimental Conditions

To assess the effectiveness of the above methods, the ErgoLAB human environment synchronization platform was used as the experimental platform. We took drivers, aged 25 to 30 years, at the construction site of the south extension of line 4 of Shenyang shield group Co., Ltd., as the research subjects. Drivers were prohibited from drinking for 24 h before the start of the experiment, which stimulated neurological properties. The shift scheduling system at the construction site was a two-shift operation mode, with the total working hours of the day shift being 12 h (07:00–19:00) and those of the night shift being 12 h (19:00–07:00). In addition to the lunch break and evening break, the rest time of the drivers during the work period also included other fragmented time periods, such as the segment assembly time of the segment assembler, the wait for the delivery of the residue, etc. These time periods were not fixed and depended on the completion of other work tasks.
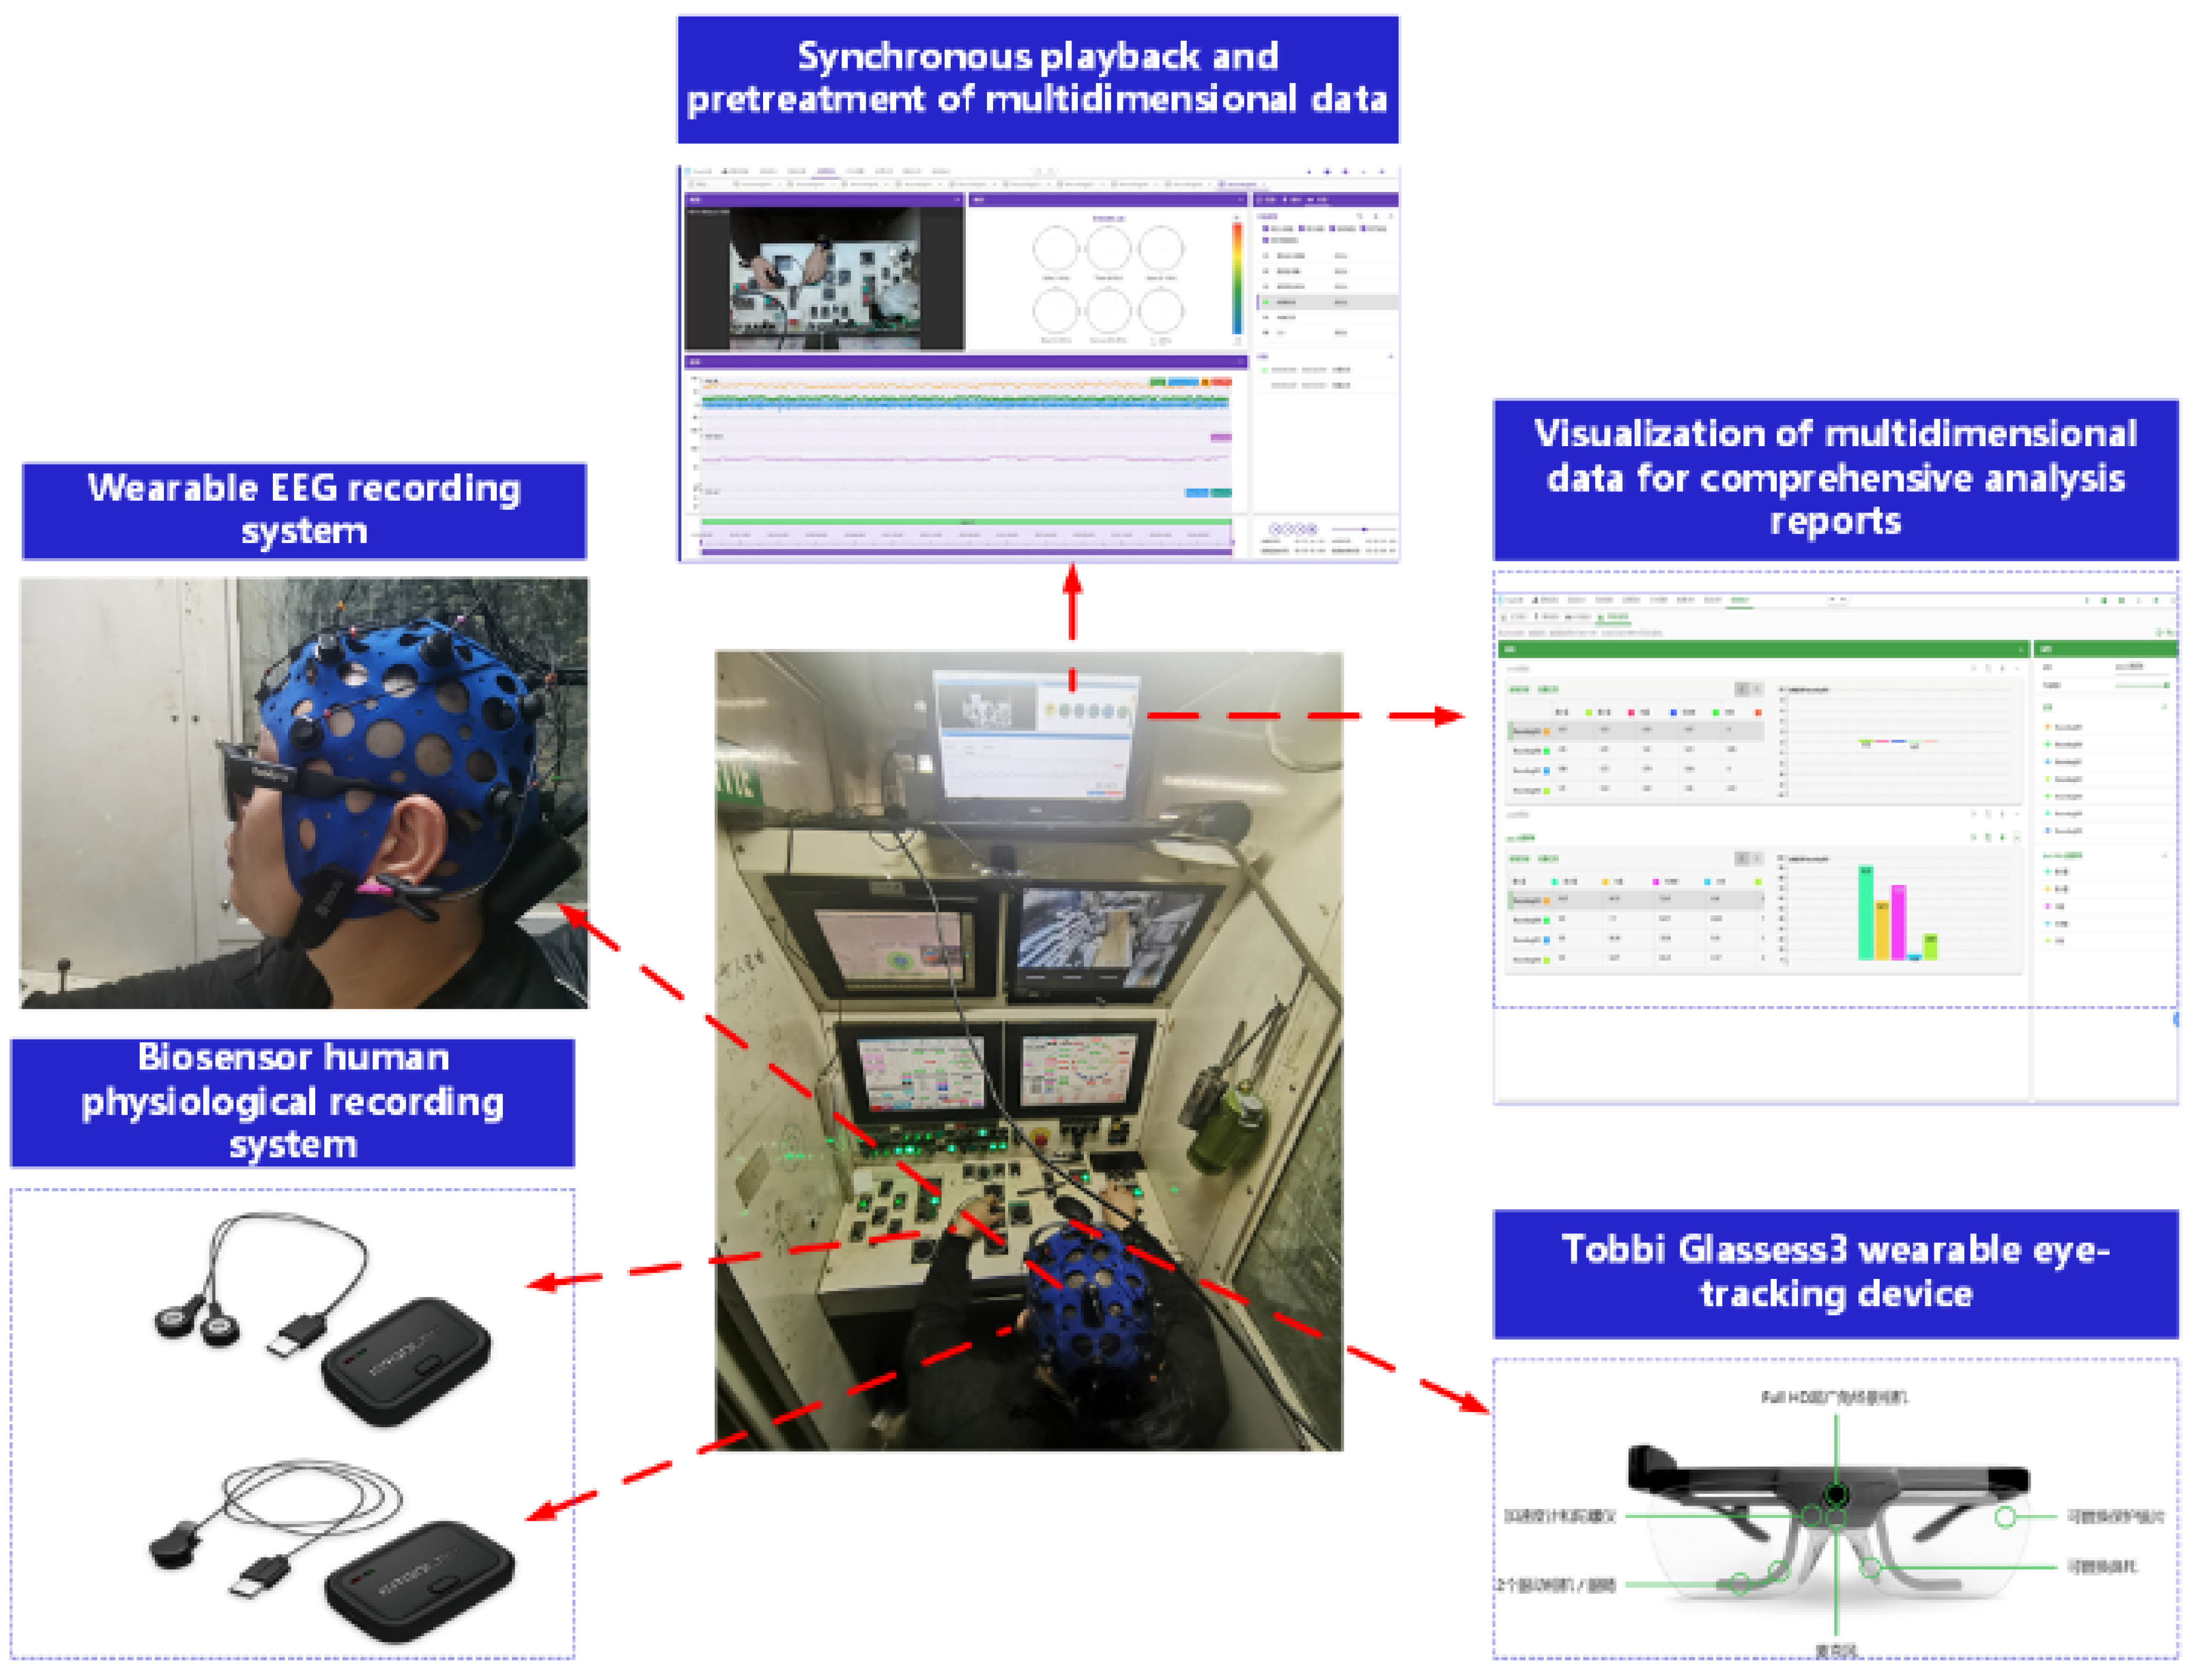
Before and during the experiment, drivers were in a normal driving state. The EEG signal and pulse signal of the shield drivers during operation were obtained using 16 lead semi-dry electrode EEG caps and intelligent wearable sensors, respectively, as demonstrated in Figure 5 below.
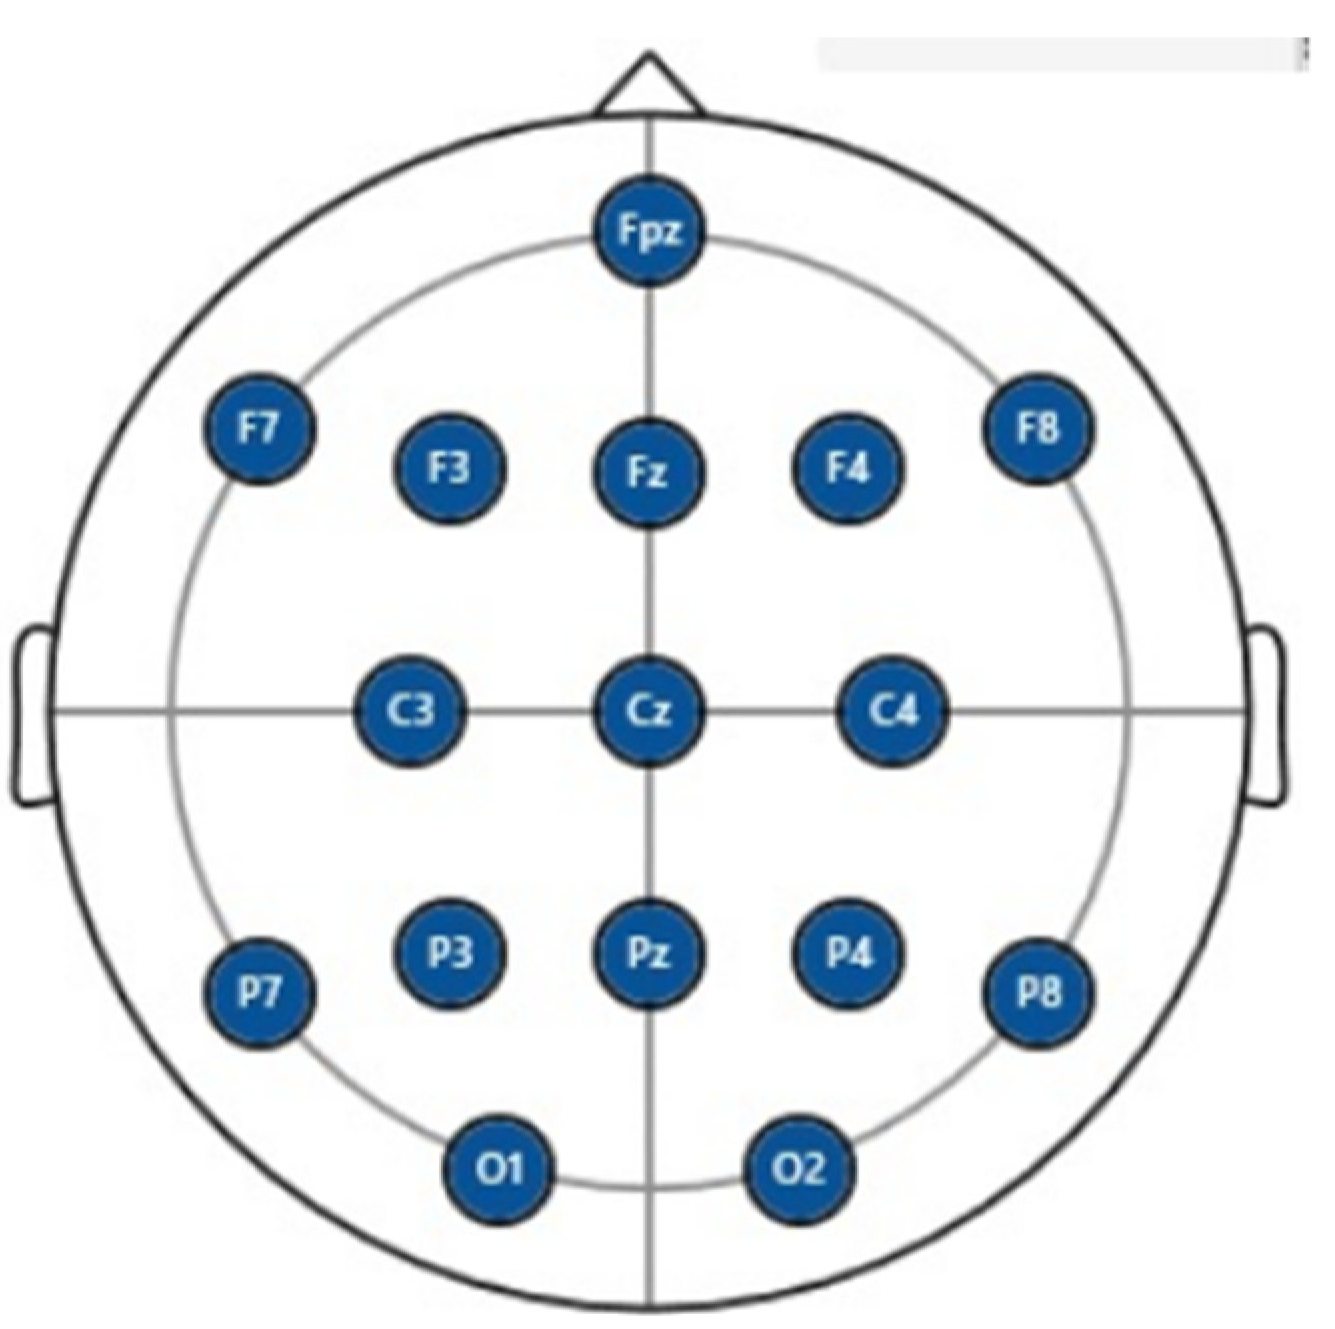
Among them, the electrode of the EEG cap was placed according to the 10–20 international standard, and the parietal lobe (P), frontal lobe (F), central region (C) and occipital lobe (O) of the subjects were selected; the sampling frequency was 128 Hz. The sampling frequency of the intelligent wearable sensor was 64 Hz. Figure 6 demonstrates the semi-dry EEG cap electrode arrangement.

5.2. Experimental Process Design

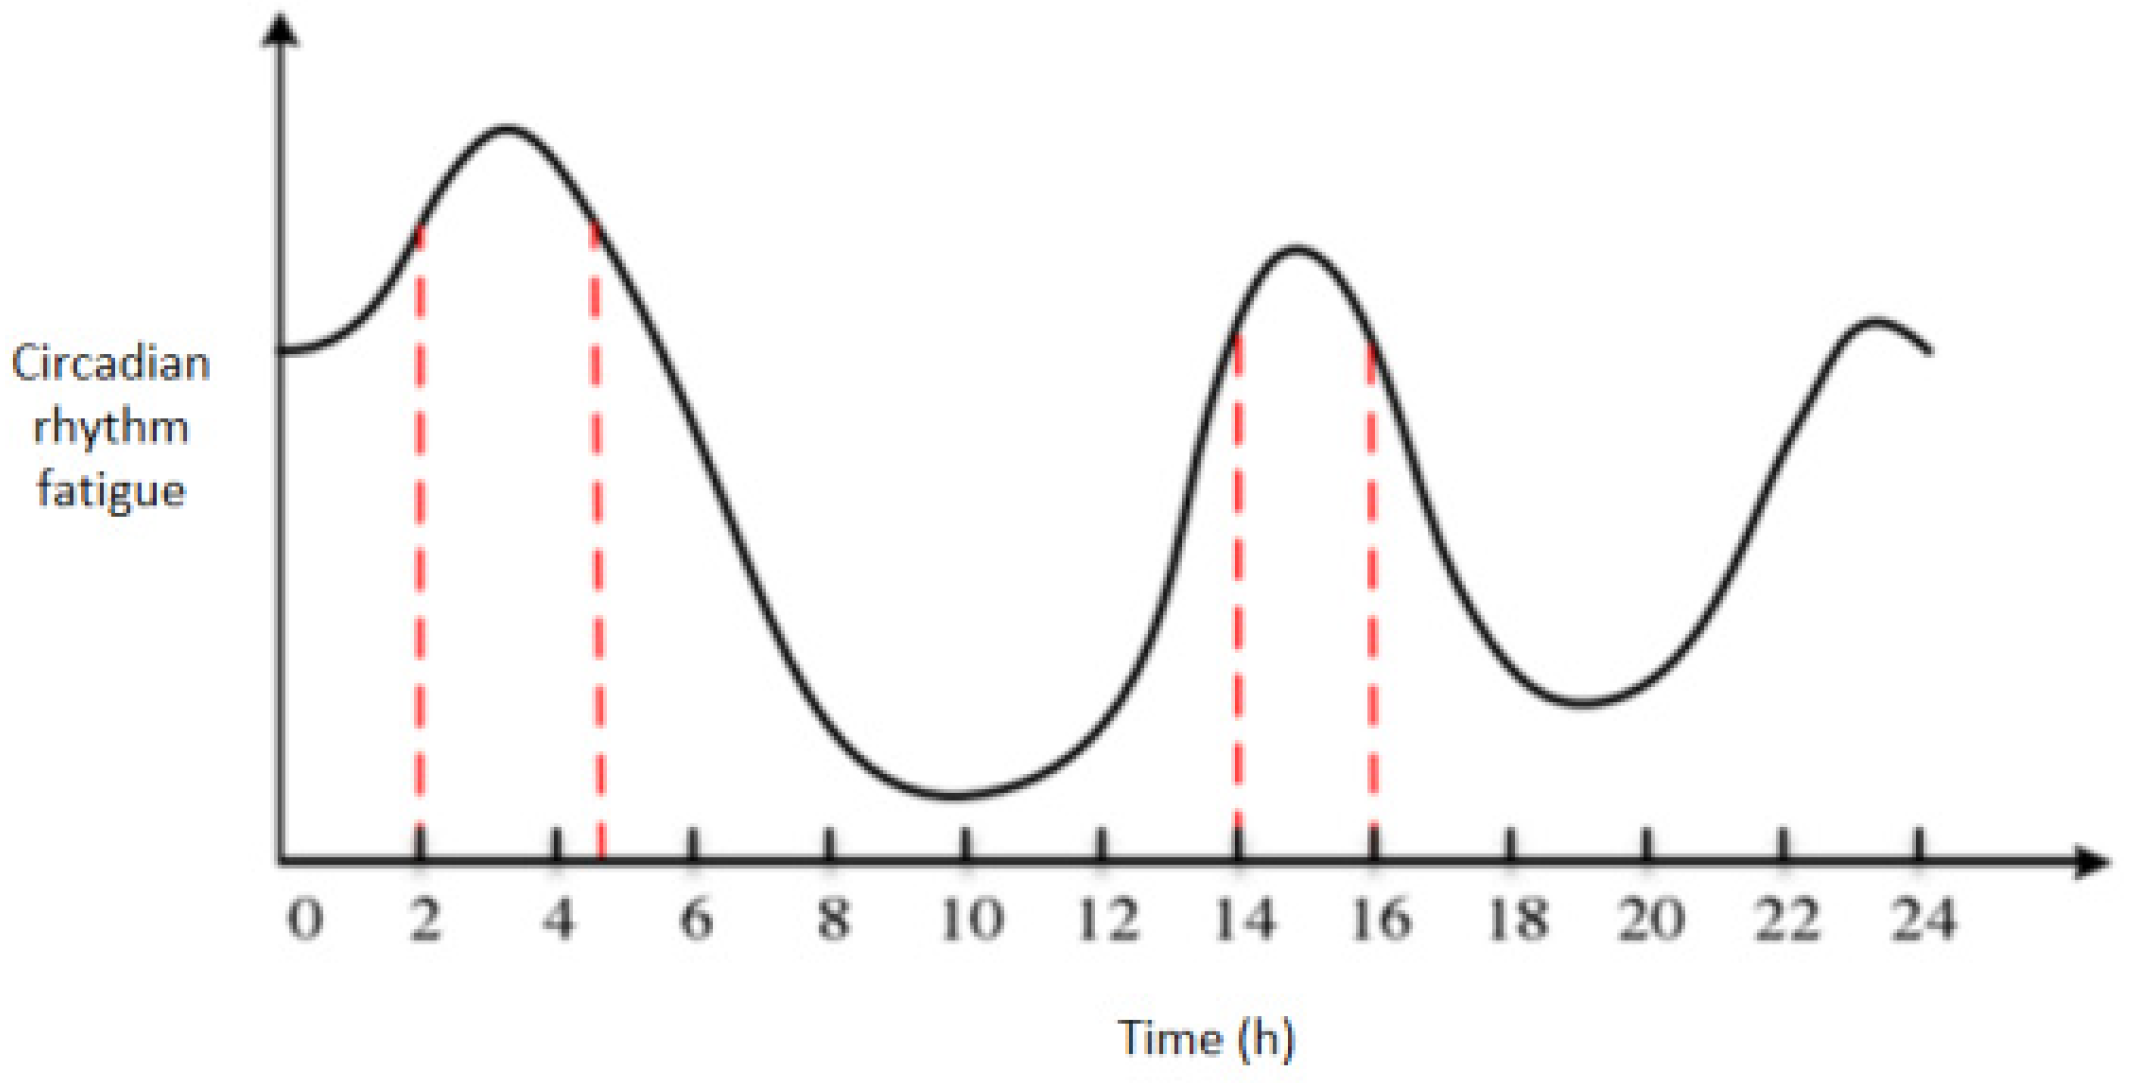
As shown in Figure 7, the natural circadian rhythm of the human body shows that the natural peak fatigue of the human body is more likely to occur between 2:00 and 5:00 A.M. and between 14:00 and 16:00 P.M. [34]. Therefore, this experiment planned to use the monitoring display in the main control room of the shield machine, the tunneling parameter information on the parameter display and the construction geological conditions as stimulating materials to obtain the physiological signal data of shield machine drivers.
In order to obtain the physiological signals, eye movement signals, driving behavior data and video data of the drivers’ fatigue state change during the whole driving process, the subjects needed to wear data acquisition equipment throughout the experiment. The collection experiment was designed based on the natural circadian fatigue rhythm of the human body and the driving task of the subjects. The experimental data acquisition paradigm was as follows: working time (shield tunneling); rest time (segment assembly); working time (shield tunneling). According to field research and interviews, the working time and rest time of the subjects were not fixed during the collection process. The working time range was 30–60 min, and the rest time was about 30 min. Figure 8 and Table 1 show the schematic diagram of the acquisition process and the acquisition schedule of the experiment, respectively.
The overall experimental process is as follows:
  • Debug the cloud platform to the working state to ensure that all modules are correctly connected.
  • Before they drive, have the subjects wear EEG caps, wearable eye movement meters and ECG sensors, and begin to collect relevant data (including personal data) after working for a few minutes.
  • Ensure that the subjects complete the driving operation according to the normal work flow; read the stimulation information on the monitoring and control display; and perform the key, knob and other operations on the operating console. At the same time, record the subjects’ eye movement, EEG, pulse and skin electrical data.
  • Remove the equipment.
  • Repeat steps (2) and (3).
  • Experiment complete; save the relevant data.
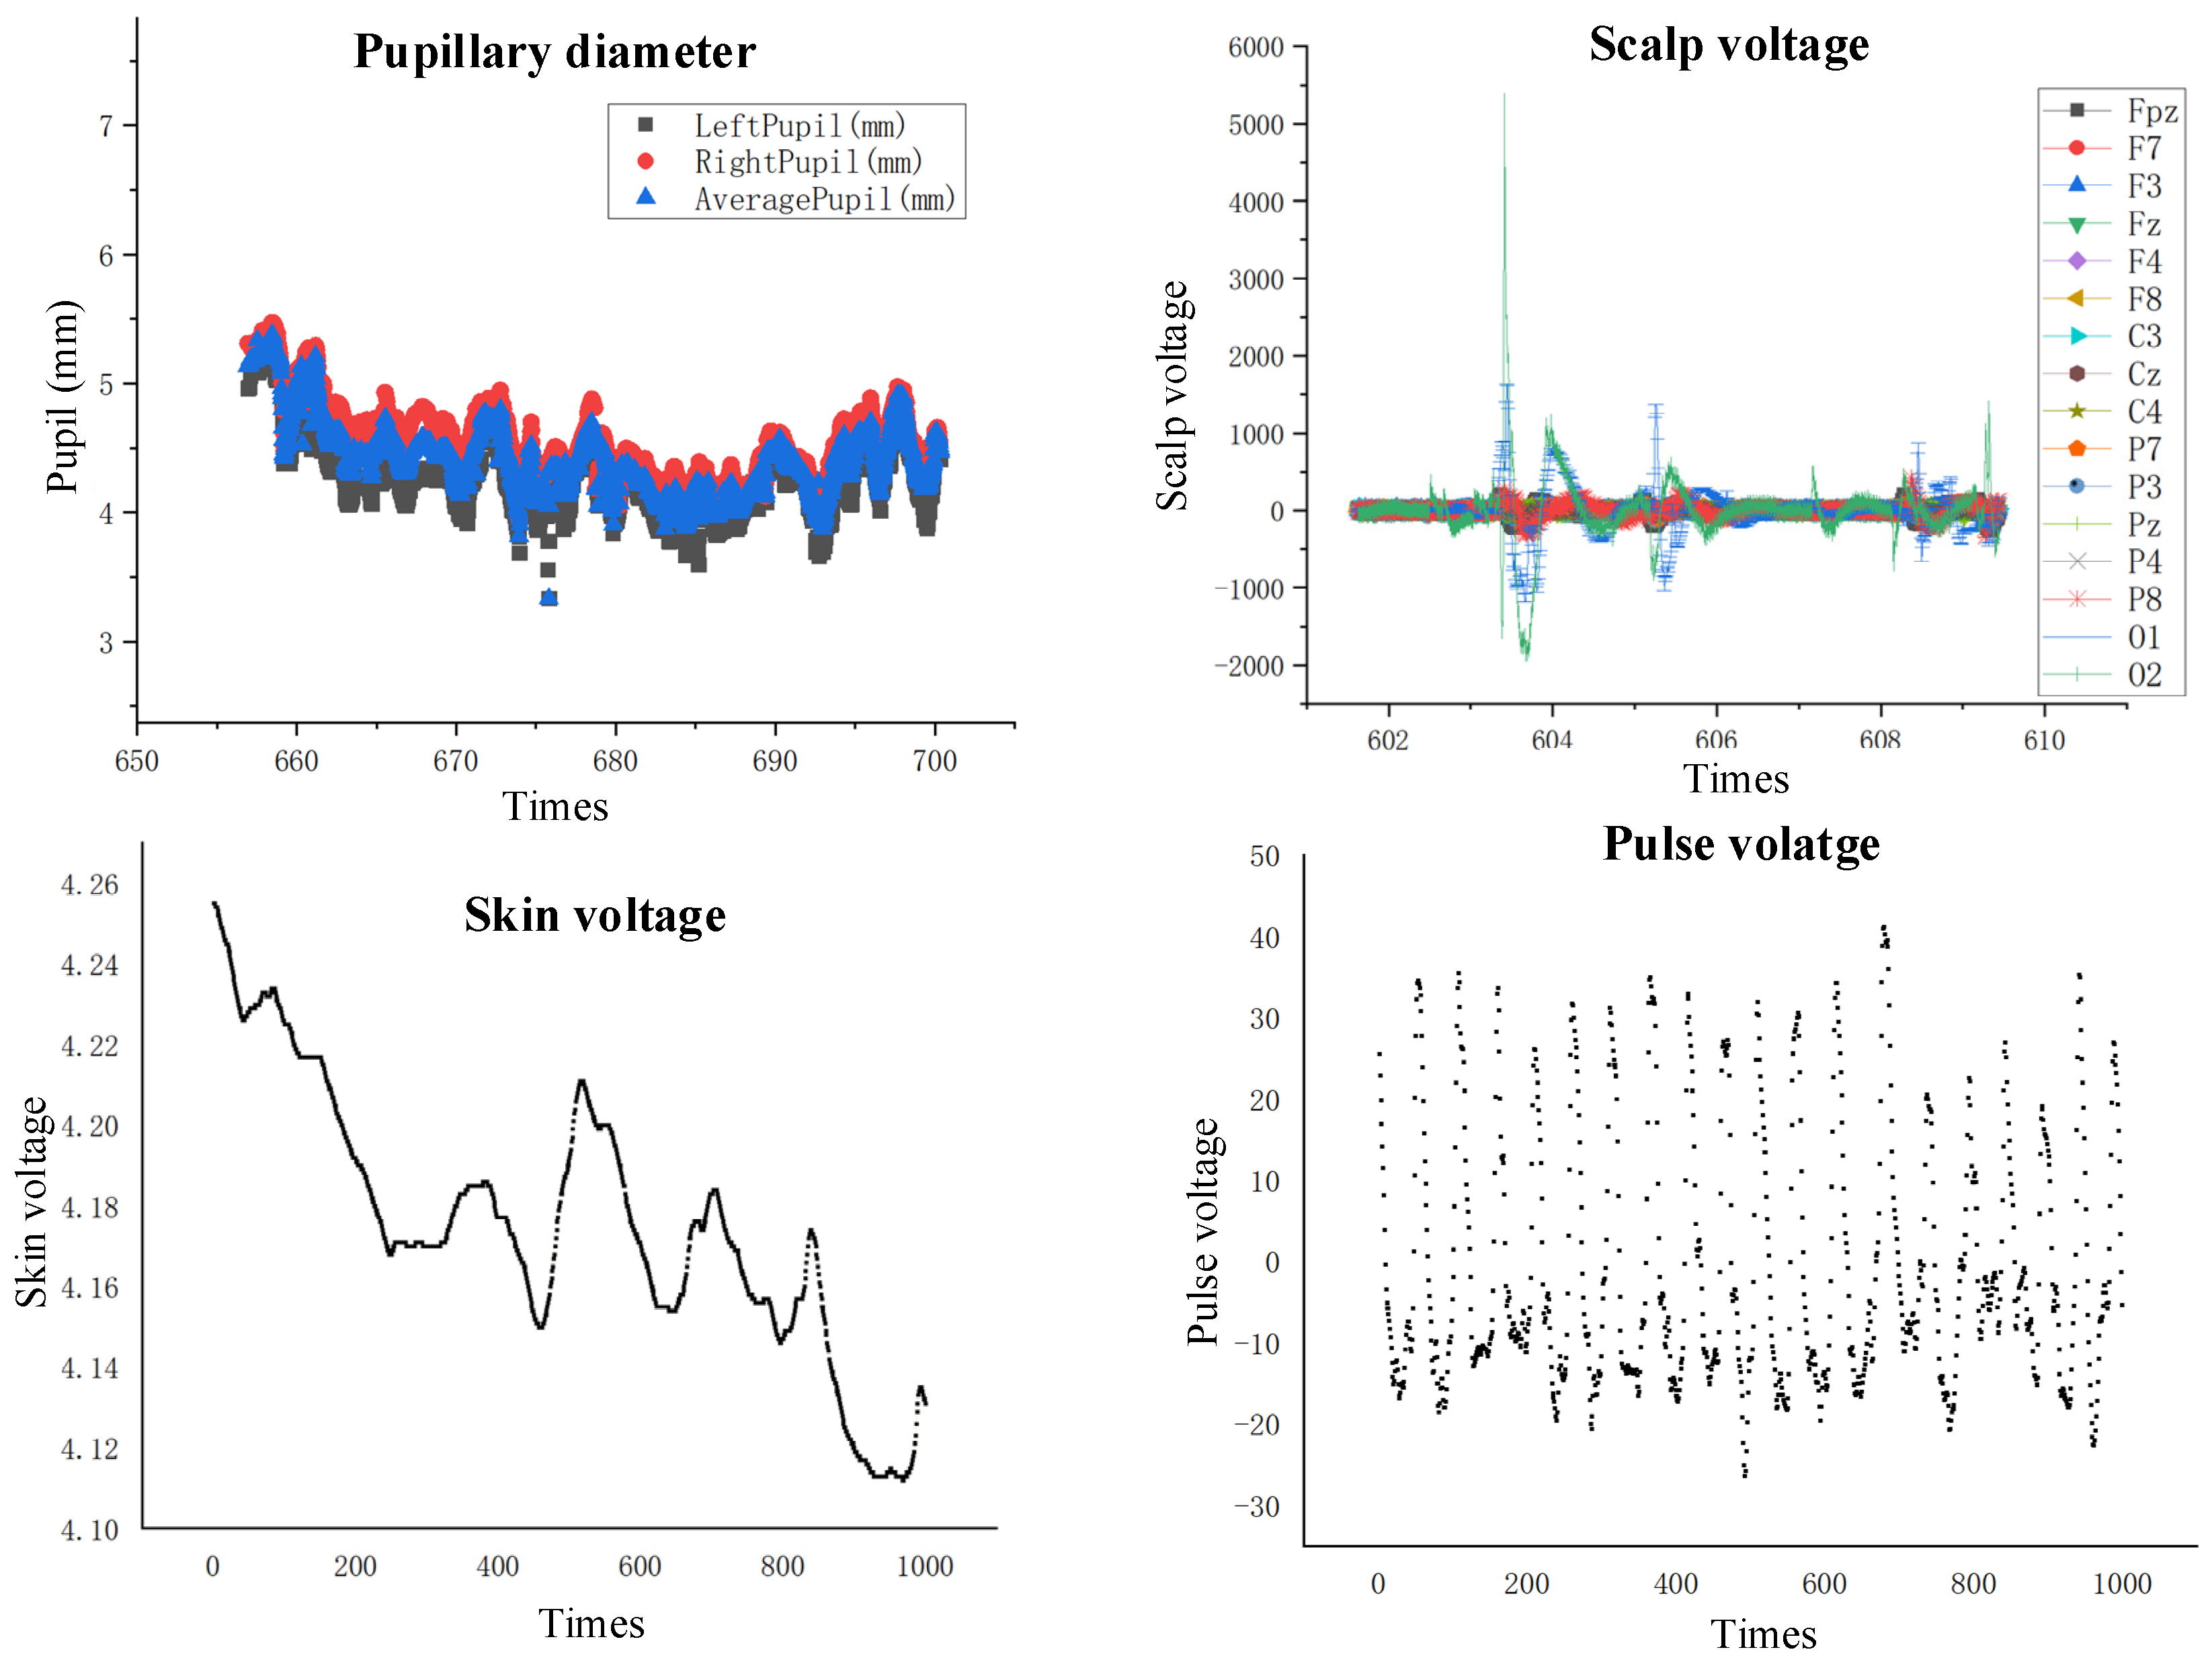
  • The collected raw data are shown in Figure 9.

5.3. Data Analysis

5.3.1. Data Preprocessing

The noise interference in the shield construction environment is strong, and the operation of other electric equipment during the construction process produces power frequency interference. Therefore, in order to reduce the data error or loss caused by the interference of the experimental equipment and surrounding environment during the experiment, while data acquisition in the driving experiment on shield machine drivers is completed, experimental data preprocessing was conducted. Based on the ErgoLAB cloud platform and EEGLAB, signal denoising, artifact removal, data filtering, data segmentation, data synchronization and other methods were used to achieve accurate experimental analysis results and improve signal quality.
(1) EEG signal preprocessing
a. EOG artifact and motion artifact processing
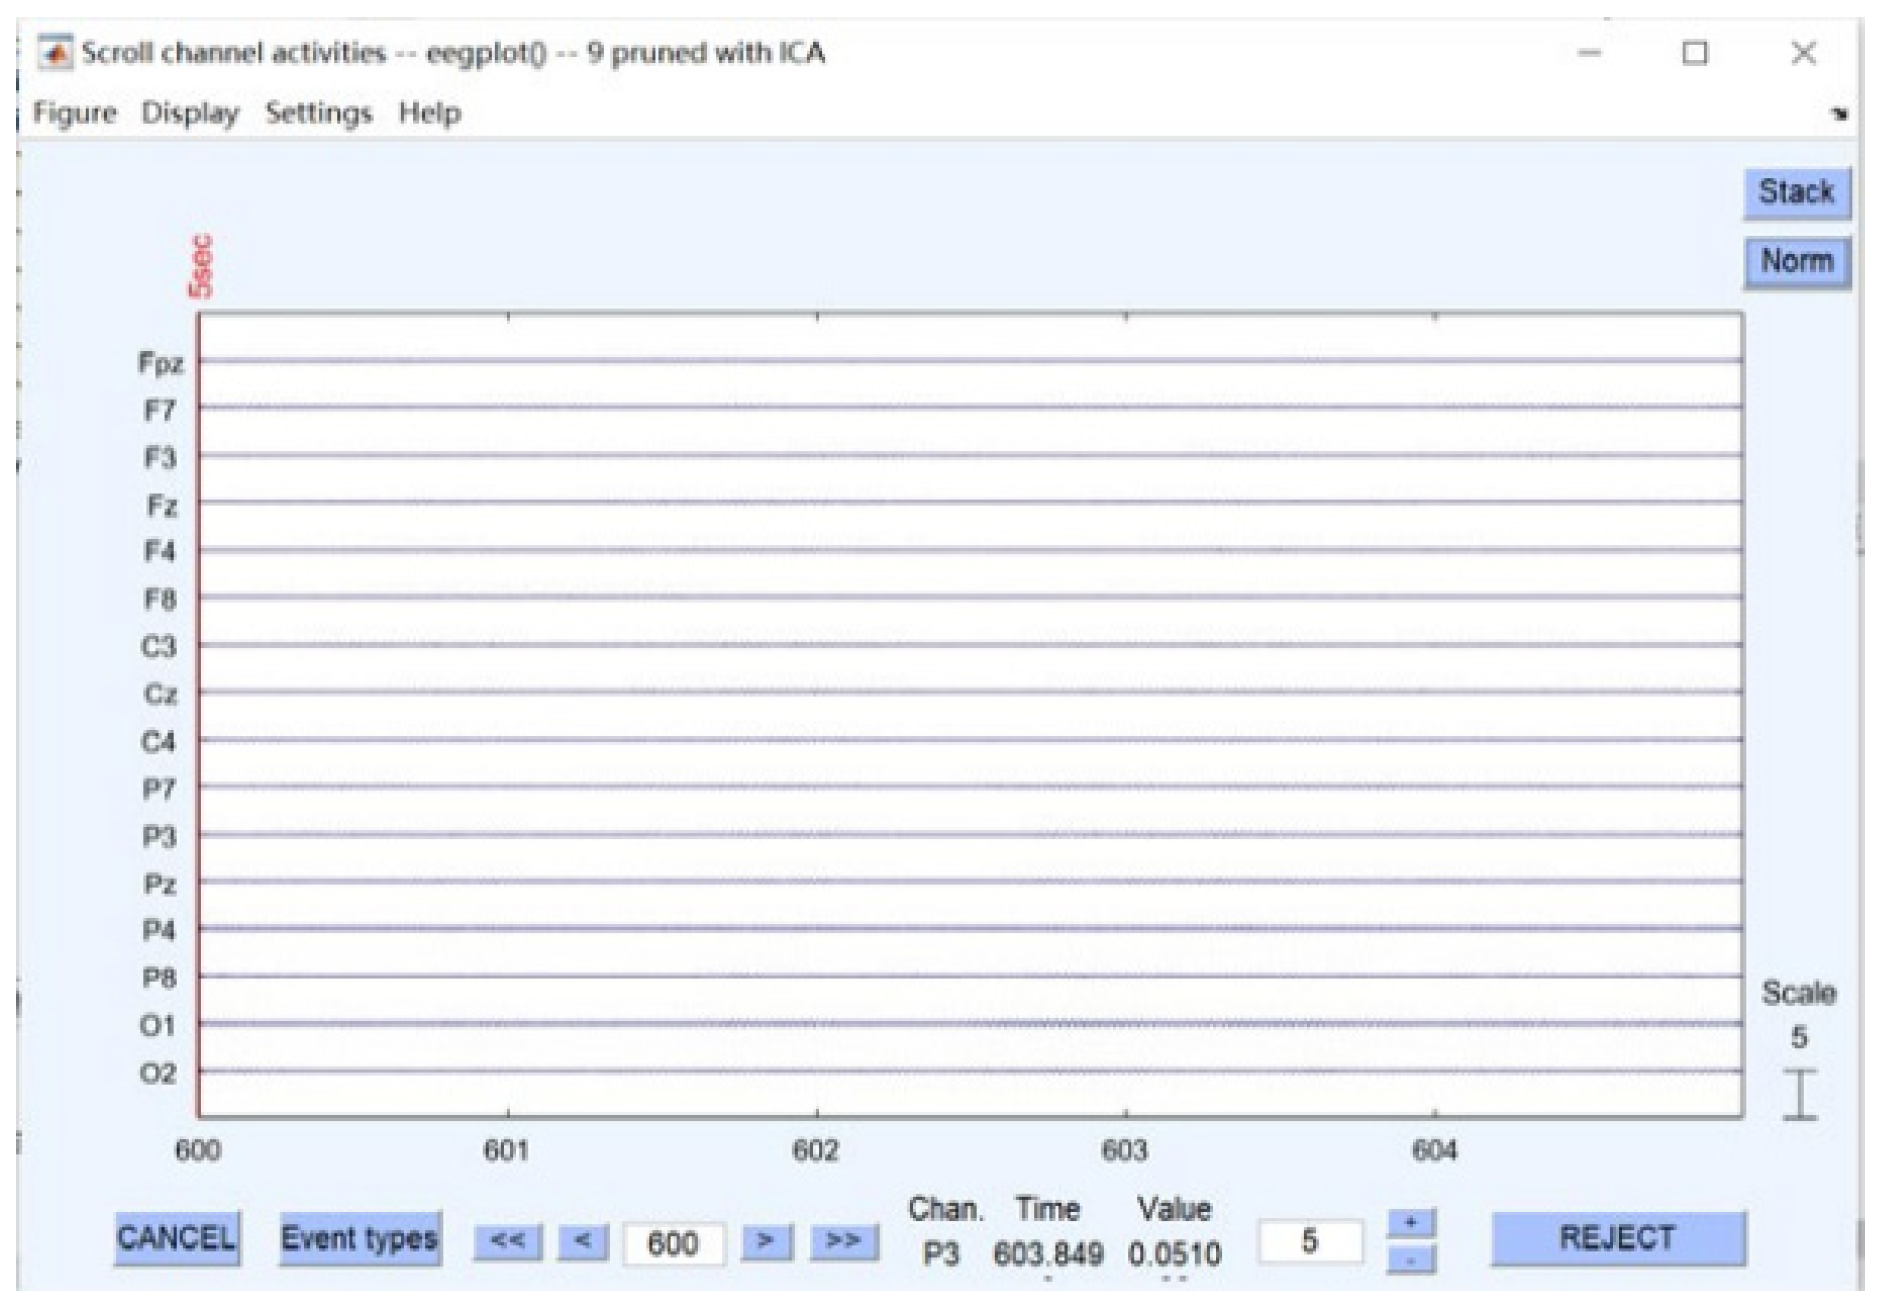
In this paper, independent component analysis (ICA) was used to remove EOG artifacts. ICA attempts to identify independent variation sources in EEG data, separate abnormal signals from EEG signals, and complete the removal of EOG artifacts. Figure 10 shows a waveform after removing EOG artifacts.
b. Filtering
In this paper, a non-recursive filter (Finite Impulse Response (FIR)) was used to remove the interference caused by the experimental equipment and the surrounding environment, ensuring that any amplitude frequency characteristic had strict linear phase frequency characteristics at the same time and that its unit sampling response was limited. Therefore, the filter was a stable system. The frequency domain of EEG signals concerned in the field of driving fatigue contains four basic rhythm waveforms (0–30 Hz), so the filtering range of the band-pass filter was set to 0–30 Hz. Figure 11a,b show the comparison of an EEG waveform before and after the filtering operation using the band-pass filter.
(2) Pulse signal preprocessing
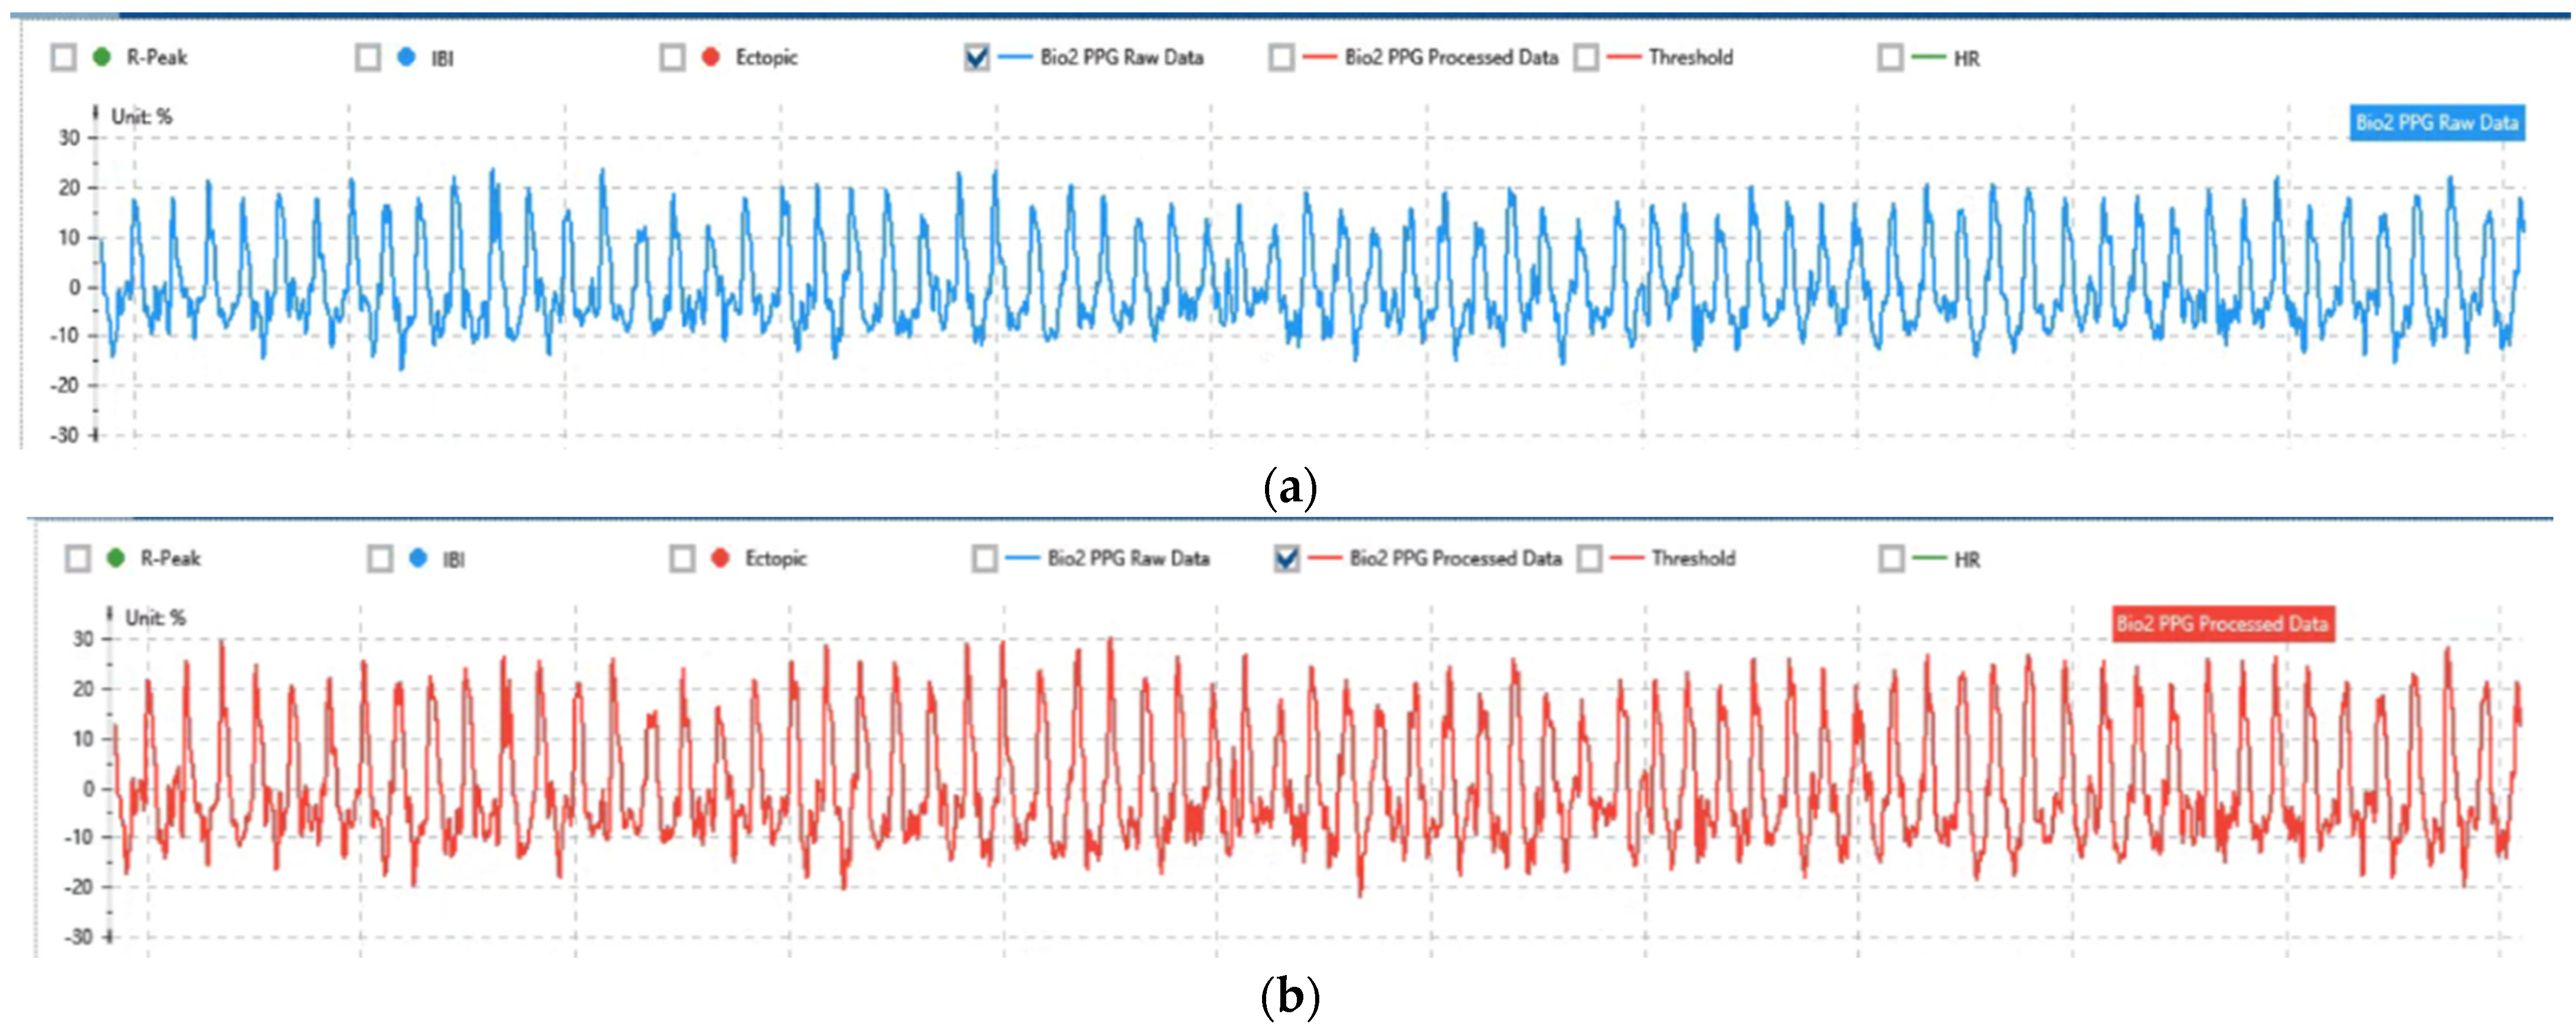
In this paper, the PPG pulse signal was selected as the way to record the heart activity of the subjects. Before the start of an experiment, motion interference should be reduced, and the stability of the sensor should be strengthened to ensure the reliability of the electrode and the palm. Figure 12a shows the original pulse signal of a certain segment obtained in this experiment. The sampling frequency was 64 Hz, and the frequency range was 0.1–40 Hz. On the ErgoLAB cloud platform, the concave filtering method was used to remove the power frequency interference in the environment; the band-pass filtering method was used to remove the noise signal; and the effective data frequency band was retained. Figure 12b shows the pulse waveform after band-pass filtering and concave filtering.
(3) Eye movement data preprocessing
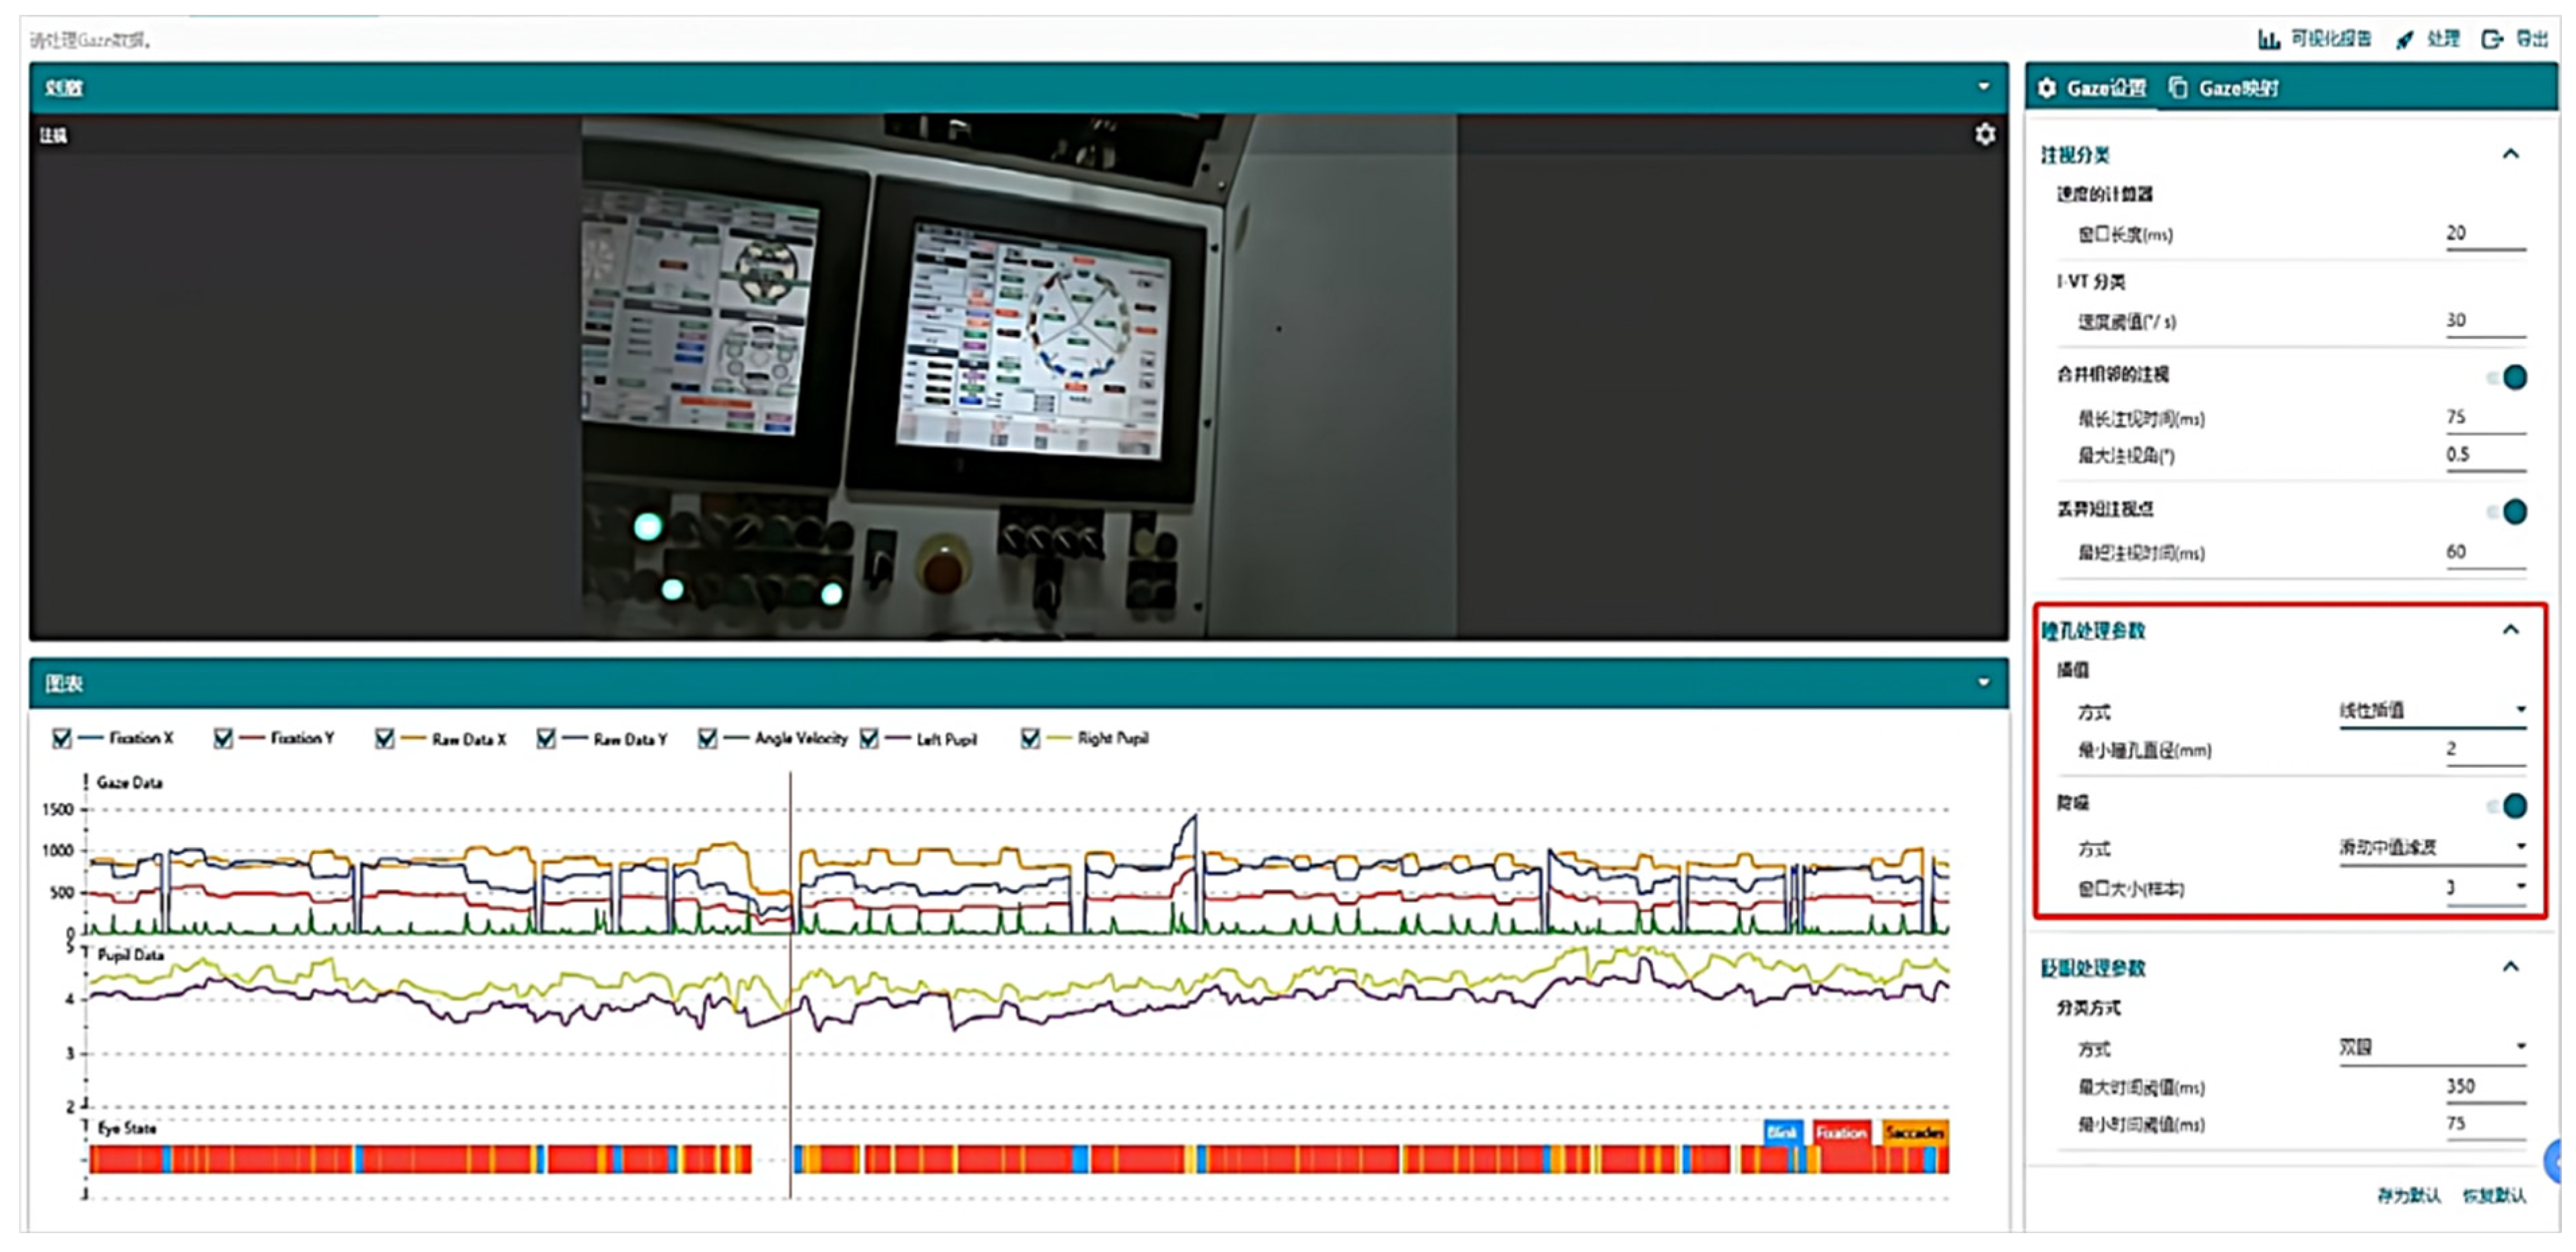
In this paper, eye movement data preprocessing consisted in the processing of pupil data, including two methods of interpolation and noise reduction. In Figure 13, the right side shows the pupil data processing interface. Combined with the number of original data, linear interpolation and sliding mean filtering were used to process signal loss and noise. The upper left side shows the stimulus received by the subjects, and the lower left side shows the change waveform of the Pupil X index of the original data machine of eye movement after data processing.
(4) Skin electrical signal data preprocessing
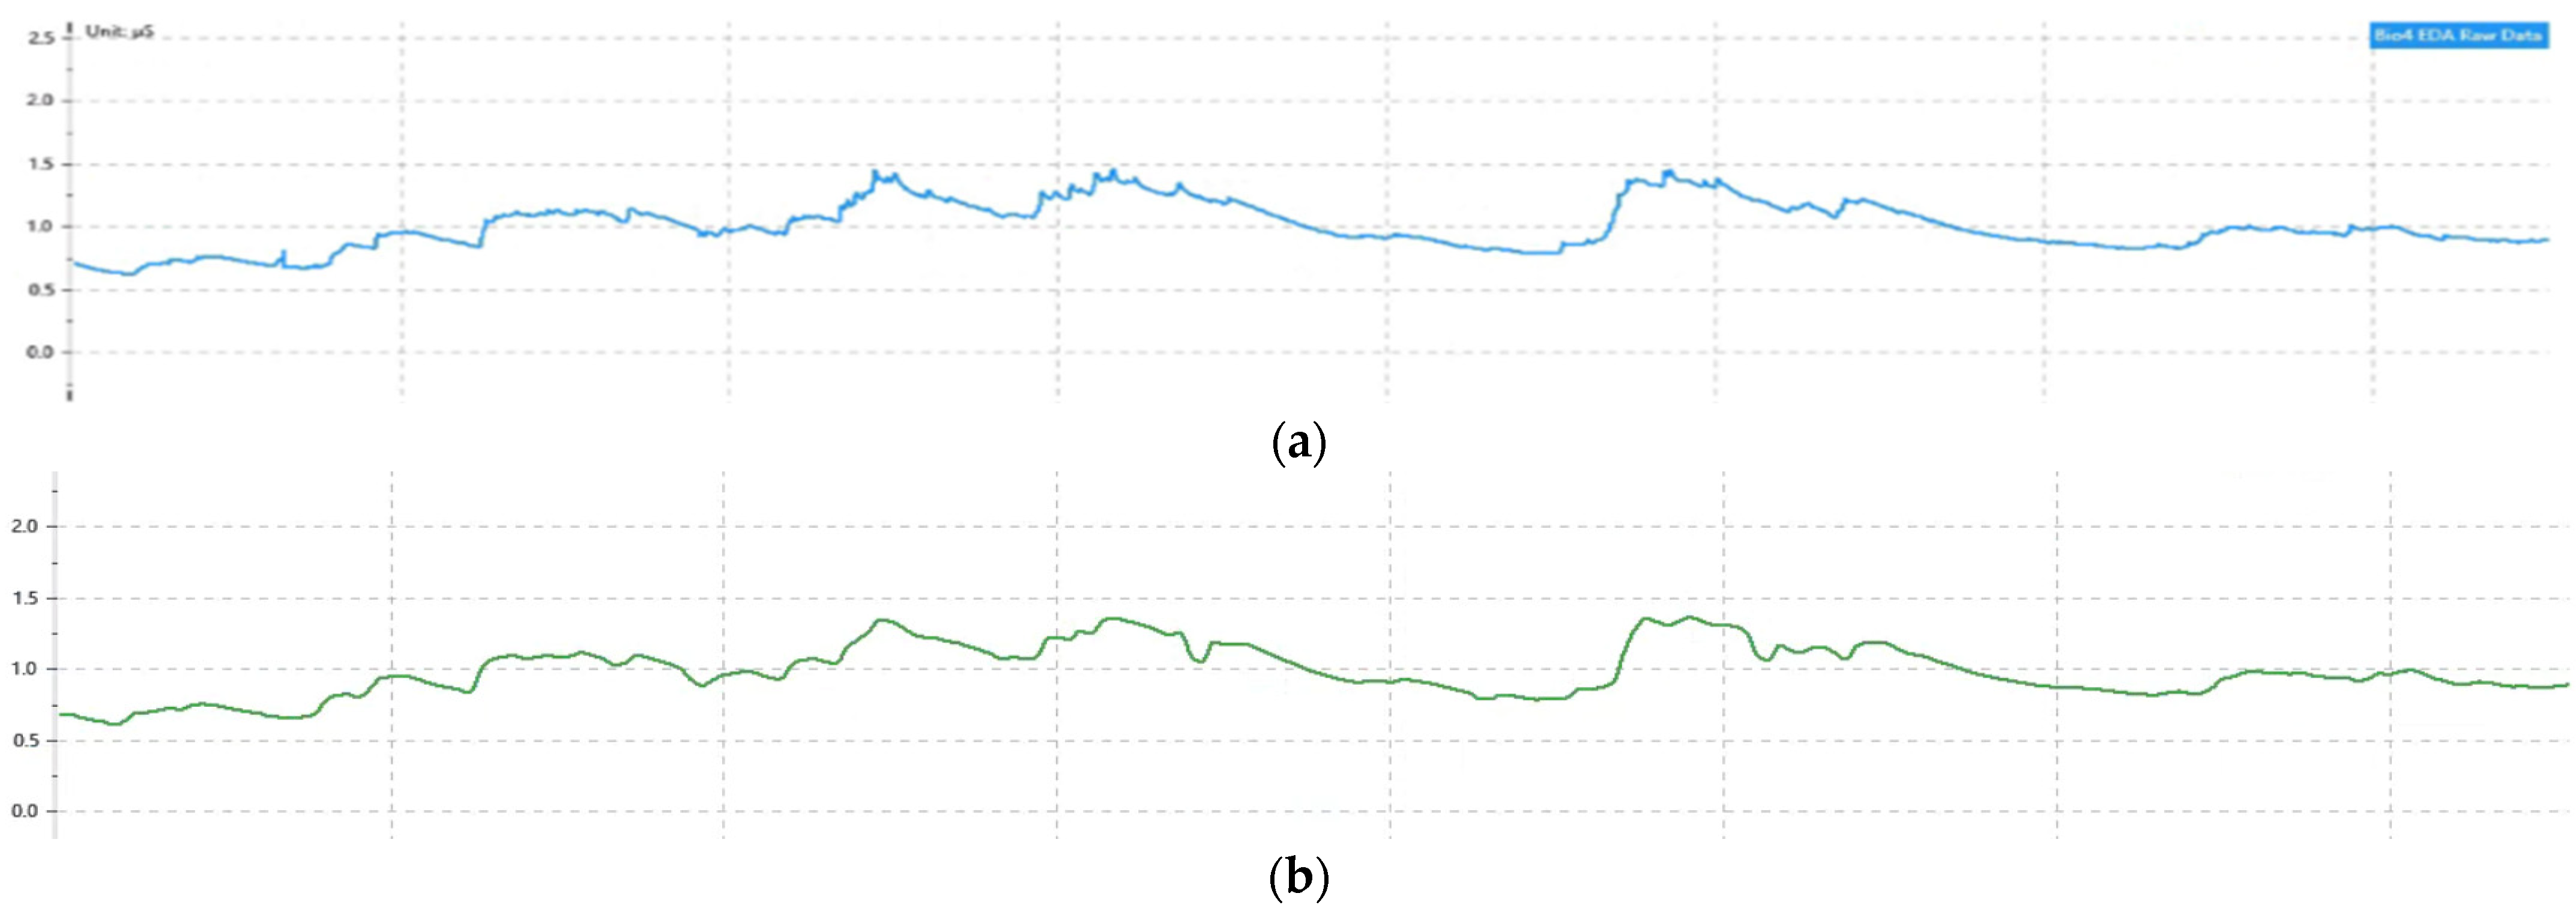
In this paper, the sampling frequency of the EDA signal was 64 Hz, and the effective frequency range of the EDA signal was 0.02–0.2 Hz. The effective frequency band of machine noise and other physiological signals was much higher than 0.2 Hz. Low-pass filtering was used for noise reduction. Figure 14 shows the comparison of EDA signal waveforms before and after filtering.
The physiological signal waveform of a shield driver after processing is shown in Figure 15.

5.3.2. Feature Extraction

The EEG features of shield machine drivers extracted using wavelet packet decomposition and reconstruction are shown in Figure 16. Starting from the driving task of the driver of the shield machine, the acquisition process included the time in which the subjects waited for segment assembly after the completion of the last round of tunneling, the time for shield tunneling and the time for segment assembly. As shown in Figure 16a, this section shows the data of the second half of the night-shift driving process of shield drivers. As the operation unfolded, the energy index of the subjects increased, and the drivers read the information on the display to control the shield machine to continue to excavation. In this stage, the driver continuously receives information through sensory organs.
After the central nervous system combines driving experience and driving skill analysis information, it makes a decision to complete the task and finally executes it using body organs based on the actual reflection of the decision. In this stage, the subjects worked under high mental load; E θ increased; E α increased; E β increased; and the combined energy index, E α + E θ E β , increased. When shield tunneling pauses, the driver fills in the driving record to enter the break time and notifies the segment assembler to assemble the segments. In this stage, E θ and E α decreased, and E β did not change significantly, while the combined energy index, H, decreased. At the end of break time, the driver starts the propulsion system, the main drive pump and other devices in turn. E θ , E α and E β increased, and the combined energy index E increased.
Figure 16b,c show the EEG characteristic data of shield drivers driving on shift. Figure 16b shows shield drivers at the lowest point of natural fatigue, and the overall EEG characteristic data of the drivers show a downward trend. Shield drivers were in a better mental state, were concentrating and had a lower probability of distraction. The extracted EEG comprehensive energy index as the driving hours continued to increase is shown in Figure 16c. This period represents the middle and late stages of shield driver driving operation. At this time, the drivers’ combined energy index had an obvious upward trend, and their fatigue degree gradually affected normal driving. Even after a short break, their concentration, reaction speed and performance level could not be restored to the state at the beginning of the experiment.
The combined energy index was lower than that of the previous excavation stage but still higher than that at the beginning of the experiment. The repetitive cognitive process and the effects of physical fatigue made the drivers’ brain dull and slow down, but by adjusting their own state, the effect of fatigue was reduced, so the combined energy index (E) showed an increasing trend compared with the previous period, even if there was a decrease.
With in vivo and in vitro environmental changes, SDNN indicators are significantly reduced; the mechanism of the autonomic nervous system to maintain body auto-balance is disordered; and the ability of drivers to resist pressure and maintain their mental state are gradually reduced. Based on the ErgoLAB cloud platform, the SDNN result of the original PPG signal after feature extraction is shown in Figure 17, where the acquisition time is synchronized with EEG. Figure 17a shows the end of the night-shift experiment, during which drivers were at the peak of natural human fatigue and the SDNN index showed a downward trend. Driving fatigue caused by watching the monitor and executing the operation for a long time increased the fatigue of the subjects. Figure 17b,c show the beginning and end of the day-shift experiment, and the mental state of shield drivers ceaselessly decreased from the peak. As the experiment progressed, the HRV time-domain index slowly decreased. Due to the existence of the autonomic nervous system regulation ability, drivers continuously adjusted their own state during driving, and the SDNN still increased with the decreasing trend. However, due to the accumulation of driving fatigue, the SDNN index of drivers could not return to the level before the start of the experiment.
LF/HF was selected as the frequency-domain index of HRV; it is widely used to assess the balance of the autonomic nervous system of shield drivers. Based on the ErgoLAB cloud platform, the RR interval was randomly decomposed into energy components at different frequencies. The power spectral density of the signal was obtained using the classical spectral estimation method of fast Fourier variation, which effectively reflects the composition and energy size of each band in the signal. As shown in Figure 18b, the HRV frequency-domain index of shield driver driving fatigue was at the lowest point in the whole cycle at the beginning of the experiment. As the driving task advanced, the LF/HF indicators gradually increased; drivers began to perceive their own fatigue state, resist the attack of driving fatigue by moving their bodies, standing, etc.; and the LF/HF indicators decreased to a certain extent. Figure 18a,c show that when drivers could not reduce their own fatigue using the above methods, the LF/HF index significantly increased. Until they entered the resting state, the drivers’ nerves were relaxed, and LF/HF showed a slow downward trend.

5.4. Feature Fusion Experiment

5.4.1. Fusion Process

During shield driving, shield drivers watch and read monitors to obtain driving parameters in real time. High cognitive resources are consumed for task crossover. The subjective self-assessment of drivers inevitably affects their driving cognitive status. Traditional methods cannot extract drivers’ driving fatigue characteristics and effectively identify driving status in real time. The improvement of computer hardware and software performance has made a breakthrough in the study and application of deep learning algorithms. Combining the advantages of deep learning with the ability of auto-encoders to learn the expression of high-order features of data, an effective method for fusing the driving fatigue features of shield drivers is presented.

5.4.2. Experimental Verification

The experiments were implemented in Windows 10 with an Intel Corei7–11800H CPU @2.40 GHz and 16 GB RAM. The deep learning framework was TensorFlow2.6, and the development environment was Jupyter Notebook; the configuration is shown in Table 2.
Before the actual experimental operation, 2000 physiological data were obtained from the data extracted from the completed features, and the data under five working conditions were obtained, including data A1 at the beginning of the shift, data A2 during the shift, data A3 at the end of the shift, data A4 during breaks in the shift and data A5 during non-shift times. Based on the control variable method to train the auto-encoder, the influence of hyper-parameters on the training loss of the model was analyzed, and the optimal super-parameters were found. In the network, the rule function was used as the activation function of the hidden layer and the input layer, and the sigmoid function was used as the activation function of the output layer.
Model hyper-parameter optimization mainly takes the hyper-parameters of the optimizer, the learning rate and the number of batch samples as variables. Stacked auto-encoders increase network depth by increasing layers to extract higher-order features. Under other conditions, the loss of higher-order feature extraction is different for different layers of stacked auto-encoders. Similarly, as shown in Figure 19, the learning rate, the number of batch samples, the regularization parameters, and the optimizer’s hyper-parameters were also experimentally different under other constant conditions.
The basic data structure of a neural network is a layer, which converts one or more input tensors into one or more output tensors. In neural network fusion with different structures and numbers of layers, the loss of the physical characteristics of shield drivers is different. Therefore, the network structure and network parameters need to be experimentally adjusted to extract higher-order features from the data. As shown in Figure 14a, with the increase in the number of hidden layers in the network, the loss of training and verification data gradually decreases. When the number of hidden layers reaches five, the loss of training and verification is the lowest and then increases. Therefore, the optimal number of hidden layers for stacked auto-encoders is five. The number of network layers and the unit parameter settings within the layers were experimentally verified, as shown in Table 3 below.
It can be seen from Figure 19a that as the number of hidden layers of the network increases, the recognition accuracy of the network gradually increases. When the number of hidden layers reaches four, the recognition accuracy of the network is the highest. Therefore, four is the best number of hidden layers. As observed in Figure 19b, with the increase in the learning rate, the training loss and validation loss of the network steadily increase. When the learning rate parameter is 1 × 10 3 , the network training loss is minimal. Therefore, the optimal learning rate parameter of the deep neural network is 1 × 10 3 . As shown in Figure 19c, the training and validation loss curve of the network steadily increases with the increase in the L2-regularization coefficient. When the L2-regularization parameter is 3 × 10 3 , the training and validation loss of the network reaches the minimum value, so the weight decay parameter of the stacked auto-encoder is 3 × 10 3 as the optimal weight decay parameter. To summarize, the hyper-parameter values that determine the stacked auto-encoder are shown in Table 4 below.

5.4.3. Result Analysis

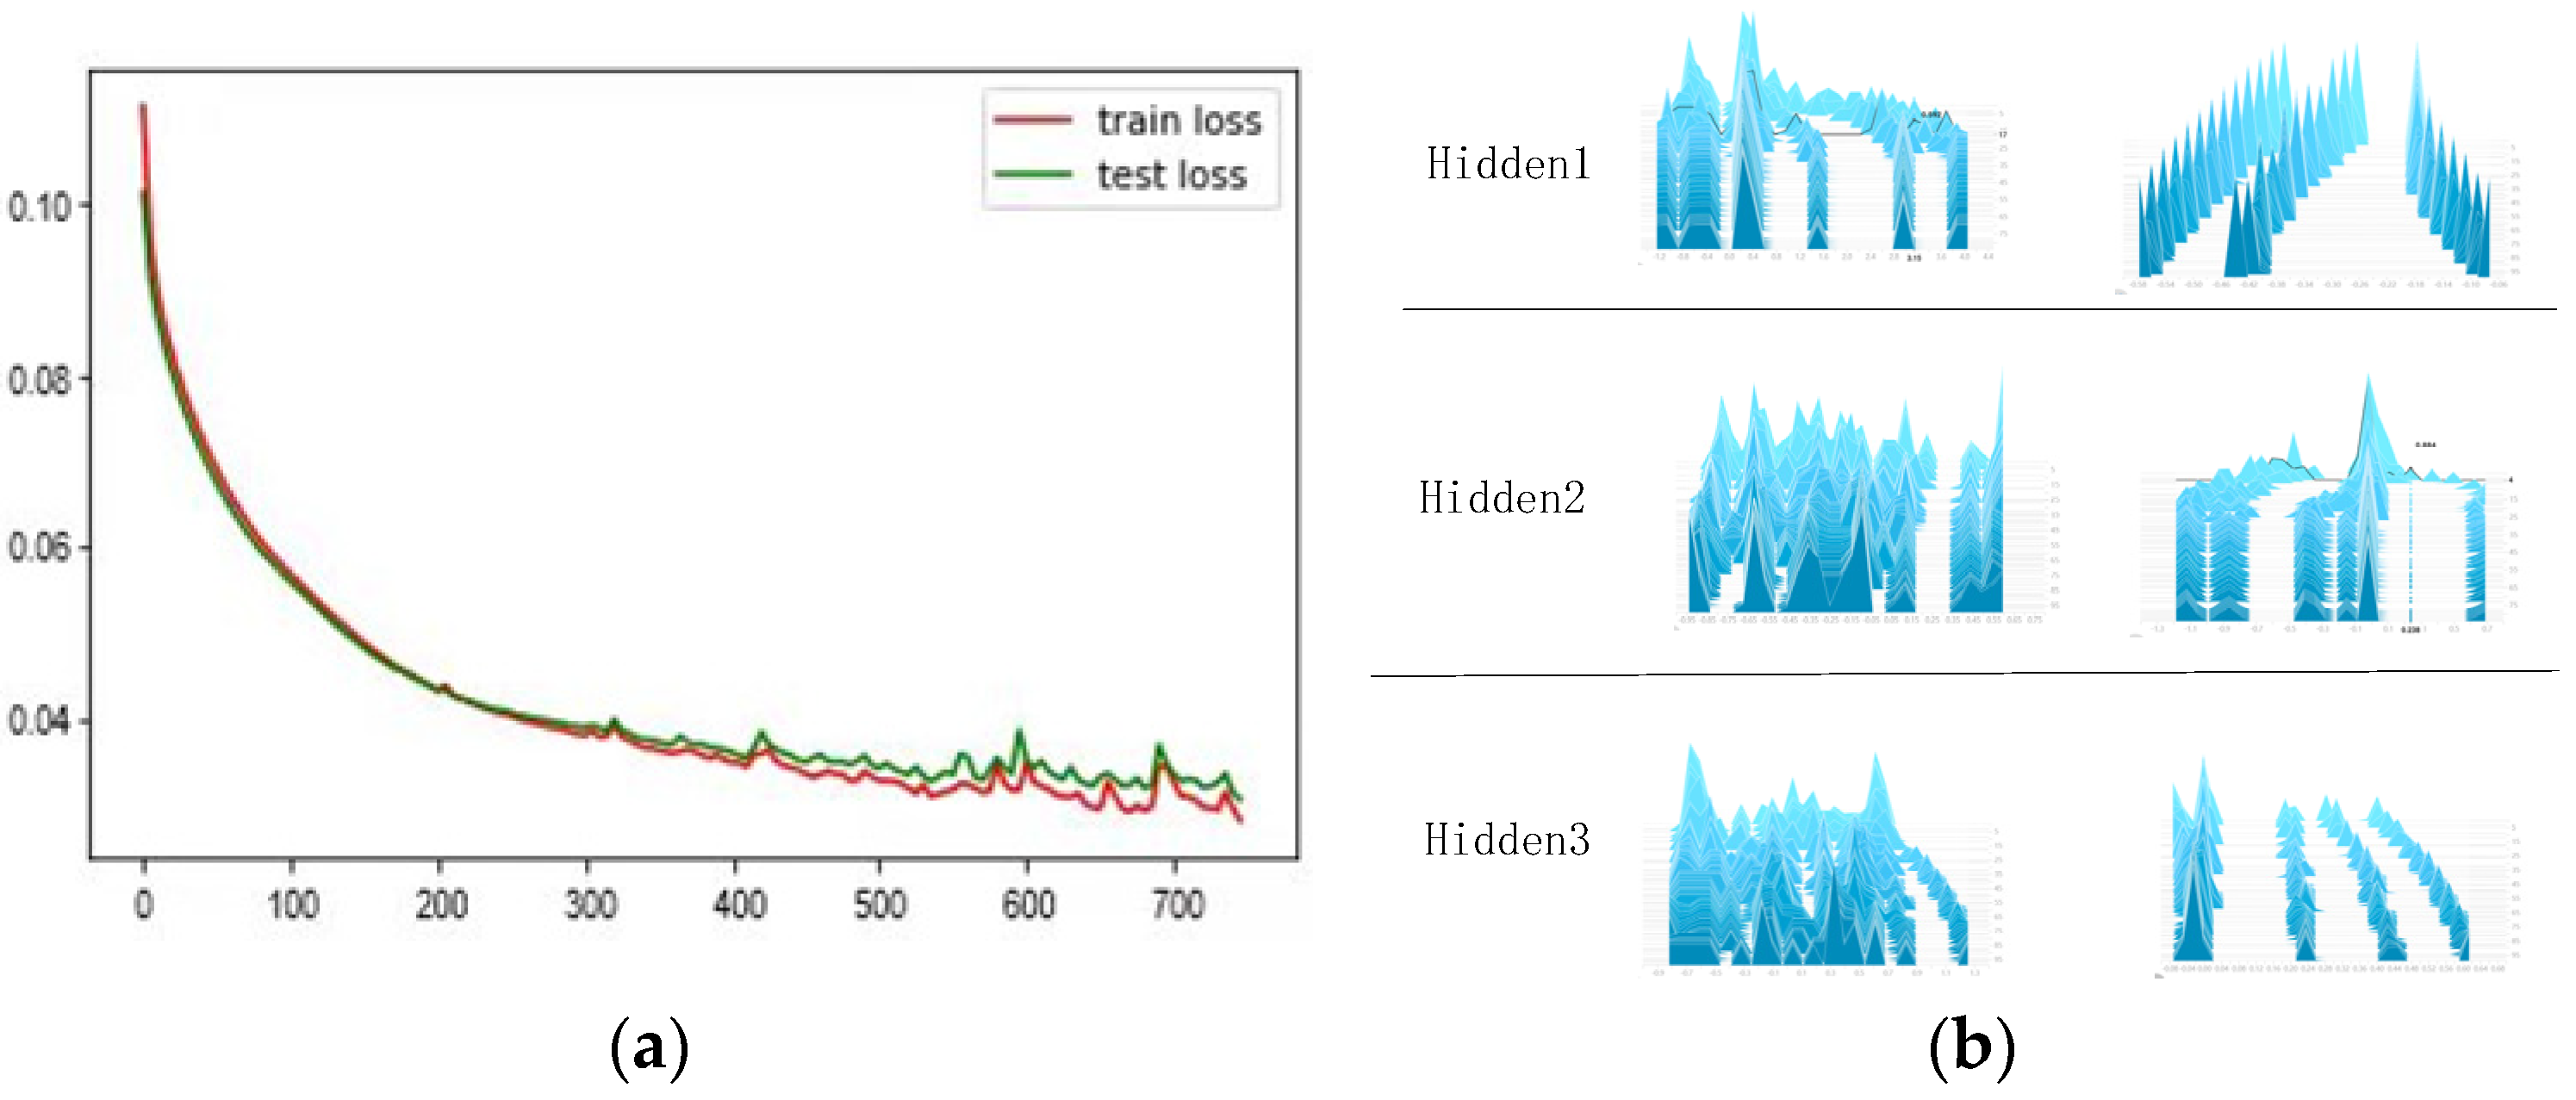
Due to the irreversibility and high economic cost of shield construction, the model for shield driver driving fatigue state should not only be accurate but also be applicable in real time. Therefore, besides the accuracy of classification, the training time of the stacked auto-encoder should also be one of the indexes used to evaluate network performance. Based on the analysis and settings of the above network hyper-parameters, combined with the loss value index, the stacked self-encoder hyper-parameters were set with the values in Table 4, and the model stopped fitting when the validation loss stability exceeded 10 epochs. The training set and test set were input into the stacked auto-encoder to train, and the weight offset of each layer was saved. The training results and the distribution of weight offset after repeated experiments are shown in Figure 20a,b, respectively. The stacked auto-encoder was trained with a loss value of 0.03214 after several iterations, and the overall loss of the test set was reduced to 0.03129. Therefore, the hierarchical model of shield driver driving fatigue based on the stacked auto-encoder mentioned in this chapter can be used as a reference method to monitor shield driver driving fatigue.
To verify the validity of the proposed method for fusing the physiological signal characteristics of shield driver driving operation, this method was compared with PCA, Kalman filter, D-S evidence theory and Bayes estimation method. We entered a variety of fusion results into densely connected networks, where the learning rate and the number of iterations were consistent with the method of this chapter. The data labels were based on the shield driver’s self-status at the time, and the network architecture was set to (128, 256, 64, 4). Taking into account the risk of shield driver driving and engineering economic problems, training accuracy was the first index of network performance. Considering the timeliness of shield driver fatigue assessment, the network training time was taken as the second index to evaluate network performance. To reduce the experimental error, the above methods were trained ten times, and the average value was taken as the comparison index. Table 5 summarizes the recognition accuracy and training time of training and testing of different fusion algorithms.
Table 5 shows that the methods presented in this chapter have good performance in training time, training and test accuracy and are significantly better than traditional data fusion methods. At the same time, it can be seen that the recognition accuracy of PCA fusion results was significantly lower than that of this method, which further proves that a deep learning network can extract more abstract feature information from data. In this paper, regularization coefficients were added to the stacked auto-encoder for feature layer fusion of physiological characteristics, which greatly reduces training loss during the training phase and guarantees the test loss of deep neural network in data testing. Moreover, the fusion results have advantages in accuracy stability and generalization ability when applied to classification models.

6. Conclusions and Prospect

6.1. Conclusions

In this paper, the fusing problem of EEG and ECG fatigue characteristics of shield drivers is addressed. Moreover, a feature fusion method based on multiple physiological signals and an auto-encoder is presented. The ErgoLAB platform was used to collect the EEG and ECG signals of shield drivers at Shenyang metro line 4, China. Moreover, a stacked encoder driver fatigue feature fusion network based on L2 regularization was constructed based on time–frequency-domain analysis and ECG feature extraction. Moreover, a regularization factor was introduced into the stacked auto-encoder to fuse the physiological features of the feature layer. Extensive experiments showed that the proposed method has higher accuracy in identifying the fatigue state of shield drivers and can effectively reduce the loss rate of deep features after feature fusion, which provides a new method for shield driver driving fatigue detection.

6.2. Prospect

This paper carried out research on the evaluation of the driving fatigue state of shield machine drivers, but due to the experimental time and equipment factors, there are still some deficiencies that need further in-depth study. As a result of the fact that there were only two drivers at the construction site of this physiological data acquisition experiment, the sample size of the test data in the SAE-based shield driver driving fatigue grading model was small, and the driving age was in the same range. Thus, the following study may consider different driving ages, age and other factors, as well as increase the number of test samples, and then fully analyze individual differences. In this way, the robustness of the model against differences in different driver characteristics will be improved.

Author Contributions

Conceptualization, K.L. and G.F.; methodology, K.L.; software, K.L.; validation, K.L., G.F. and X.J.; formal analysis, W.Z. and Z.T.; investigation, K.B.; resources, G.F. and X.J.; data curation, W.Z. and R.Z.; writing—original draft preparation, K.L.; writing—review and editing, G.F. and X.J.; visualization, writing—original draft preparation W.Z. and Z.T.; supervision, G.F.; project administration, R.Z. All authors have read and agreed to the published version of the manuscript.

Funding

This work was supported by Liaoning Revitalization Talent Program (XLYC180203 and Program for the Top Young and Middle-aged Innovative Talents of Shenyang (RC190148).

Institutional Review Board Statement

Not applicable.

Informed Consent Statement

Not applicable.

Data Availability Statement

All supporting data are available in this paper.

Conflicts of Interest

The authors declare no conflict of interest.

References

  1. Qiang, Y.; Tian, G.; Liu, Y.; Li, Z. Energy-Efficiency Models of Sustainable Urban Transportation Structure Optimization. IEEE Access 2018, 6, 18192–18199. [Google Scholar] [CrossRef]
  2. Tian, G.; Jia, H.; Li, Z. Fuzzy random cost-profit tradeoff location model for a vehicle inspection station with regional constraints. IEEJ Trans. Electr. Electron. Eng. 2016, 11, 796–803. [Google Scholar] [CrossRef]
  3. Tian, G.; Liu, Y. Energy-Efficient Models of Sustainable Location for a Vehicle Inspection Station With Emission Constraints. IEEE Trans. Autom. Sci. Eng. 2015, 12, 238–243. [Google Scholar] [CrossRef]
  4. Tian, G.D.; Qiang, T.G.; Chu, J.W.; Qiao, G.M. Condensation DrippingWater Detection and Its Control Method from Exhaust Pipe of Gasohol Vehicle under Low Environmental Temperature Conditions: A Case Study in Harbin, China. Adv. Mech. Eng. 2012, 4, 627131. [Google Scholar] [CrossRef]
  5. Tian, G.; Zhou, M.; Chu, J.; Qiang, T.; Hu, H. Stochastic Cost-Profit Tradeoff Model for Locating an Automotive Service Enterprise. IEEE Trans. Autom. Sci. Eng. 2015, 12, 580–587. [Google Scholar] [CrossRef]
  6. Tian, G.; Zhou, M.; Li, P.; Zhang, C.; Jia, H. Multiobjective Optimization Models for Locating Vehicle Inspection Stations Subject to Stochastic Demand, Varying Velocity and Regional Constraints. IEEE Trans. Intell. Transp. Syst. 2016, 17, 1978–1987. [Google Scholar] [CrossRef]
  7. Zhang, H.; Peng, Y.; Hou, L.; Wang, D.; Tian, G.; Li, Z. Multistage Impact Energy Distribution for Whole Vehicles in High-Speed Train Collisions: Modeling and Solution Methodology. IEEE Trans. Ind. Inform. 2020, 16, 2486–2499. [Google Scholar] [CrossRef]
  8. Sun, Y.; Wu, C.; Zhang, H.; Zhou, W.; Li, X.; Zhang, Q. Extraction of optimal fatigue-driving steering indicators considering individual differences. IET Intell. Transp. Syst. 2021, 15, 606–618. [Google Scholar] [CrossRef]
  9. Zou, S.; Qiu, T.; Huang, P.; Luo, H.; Bai, X. The functional brain network based on the combination of shortest path tree and its application in fatigue driving state recognition and analysis of the neural mechanism of fatigue driving. Biomed. Signal Process. Control. 2020, 62, 102129. [Google Scholar] [CrossRef]
  10. Sun, W.; Zhang, X.; Wang, J.; He, J.; Peeta, S. Blink Number Forecasting Based on Improved Bayesian Fusion Algorithm for Fatigue Driving Detection. Math. Probl. Eng. 2015, 2015, 832621. [Google Scholar] [CrossRef] [Green Version]
  11. Harvy, J.; Bezerianos, A.; Li, J.H. Reliability of EEG Measures in Driving Fatigue. IEEE Trans. Neural Syst. Rehabil. Eng. 2022, 30, 2743–2753. [Google Scholar] [CrossRef]
  12. Wang, F.; Wu, S.; Ping, J.; Xu, Z.; Chu, H. EEG Driving Fatigue Detection With PDC-Based Brain Functional Network. IEEE Sens. J. 2021, 21, 10811–10823. [Google Scholar] [CrossRef]
  13. Wang, F.; Wang, H.; Zhou, X.; Fu, R. A Driving Fatigue Feature Detection Method Based on Multifractal Theory. IEEE Sens. J. 2022, 22, 19046–19059. [Google Scholar] [CrossRef]
  14. Gao, Z.; Li, S.; Cai, Q.; Dang, W.; Yang, Y.; Mu, C.; Hui, P. Relative Wavelet Entropy Complex Network for Improving EEG-Based Fatigue Driving Classification. IEEE Trans. Instrum. Meas. 2019, 68, 2491–2497. [Google Scholar] [CrossRef]
  15. Kong, W.; Zhou, Z.; Jiang, B.; Babiloni, F.; Borghini, G. Assessment of driving fatigue based on intra/inter-region phase synchronization. Neurocomputing 2017, 219, 474–482. [Google Scholar] [CrossRef]
  16. Du, G.; Li, T.; Li, C.; Liu, P.X.; Li, D. Vision-Based Fatigue Driving Recognition Method Integrating Heart Rate and Facial Features. IEEE Trans. Intell. Transp. Syst. 2021, 22, 3089–3100. [Google Scholar] [CrossRef]
  17. Cheng, Q.; Wang, W.; Jiang, X.; Hou, S.; Qin, Y. Assessment of Driver Mental Fatigue Using Facial Landmarks. IEEE Access 2019, 7, 150423–150434. [Google Scholar] [CrossRef]
  18. Yan, R.; Wu, C.; Wang, Y. Exploration and evaluation of individual difference to driving fatigue for high-speed railway: A parametric SVM model based on multidimensional visual cue. IET Intell. Transp. Syst. 2018, 12, 504–512. [Google Scholar] [CrossRef]
  19. Li, Z.; Yang, Q.; Chen, S.; Zhou, W.; Chen, L.; Song, L. A fuzzy recurrent neural network for driver fatigue detection based on steering-wheel angle sensor data. Int. J. Distrib. Sens. Netw. 2019, 15, 1550147719872452. [Google Scholar] [CrossRef] [Green Version]
  20. Mousavi, Z.; Rezaii, T.Y.; Sheykhivand, S.; Farzamnia, A.; Razavi, S. Deep convolutional neural network for classification of sleep stages from single-channel EEG signals. J. Neurosci. Methods 2019, 324, 108312. [Google Scholar] [CrossRef]
  21. Qi, M.S.; Xie, P.; Zhang, Y.Y.; Yang, W.J.; Liu, Z.J.; Cheng, S.C. Ieee In Driver fatigue Assessment Based on the Feature Fusion and Transfer Learning of EEG and EMG. In Proceedings of the Chinese Automation Congress (CAC), Xian, China, 30 November–2 December 2018; pp. 1314–1317. [Google Scholar]
  22. Gharagozlou, F.; Saraji, G.N.; Mazloumi, A.; Nahvi, A.; Nasrabadi, A.M.; Foroushani, A.R.; Kheradmand, A.A.; Ashouri, M.; Samavati, M. Detecting Driver Mental Fatigue Based on EEG Alpha Power Changes during Simulated Driving. Iran. J. Public Health 2015, 44, 1693–1700. [Google Scholar]
  23. Wang, H.; Wu, C.; Li, T.; He, Y.; Chen, P.; Bezerianos, A. Driving Fatigue Classification Based on Fusion Entropy Analysis Combining EOG and EEG. IEEE Access 2019, 7, 61975–61986. [Google Scholar] [CrossRef]
  24. Wang, F.; Wu, S.; Zhang, W.; Xu, Z.; Zhang, Y.; Chu, H. Multiple nonlinear features fusion based driving fatigue detection. Biomed. Signal Process. Control. 2020, 62, 102075. [Google Scholar] [CrossRef]
  25. Li, X.; Hong, L.; Wang, J.; Liu, X. Fatigue driving detection model based on multi-feature fusion and semi-supervised active learning. IET Intell. Transp. Syst. 2019, 13, 1401–1409. [Google Scholar] [CrossRef]
  26. Hussain, I.; Park, S.J. Big-ECG: Cardiographic Predictive Cyber-Physical System for Stroke Management. IEEE Access 2021, 9, 123146–123164. [Google Scholar] [CrossRef]
  27. Islam, M.S.; Hussain, I.; Rahman, M.; Park, S.J.; Hossain, A. Explainable Artificial Intelligence Model for Stroke Prediction Using EEG Signal. Sensors 2022, 22, 9859. [Google Scholar] [CrossRef]
  28. Hussain, I.; Park, S.J. HealthSOS: Real-Time Health Monitoring System for Stroke Prognostics. IEEE Access 2020, 8, 213574–213586. [Google Scholar] [CrossRef]
  29. Hussain, I.; Park, S.-J. Quantitative Evaluation of Task-Induced Neurological Outcome after Stroke. Brain Sci. 2021, 11, 900. [Google Scholar] [CrossRef]
  30. Hussain, I.; Young, S.; Park, S.-J. Driving-Induced Neurological Biomarkers in an Advanced Driver-Assistance System. Sensors 2021, 21, 6985. [Google Scholar] [CrossRef]
  31. Hussain, I.; Hossain, A.; Jany, R.; Bari, A.; Uddin, M.; Kamal, A.R.M.; Ku, Y.; Kim, J.-S. Quantitative Evaluation of EEG-Biomarkers for Prediction of Sleep Stages. Sensors 2022, 22, 3079. [Google Scholar] [CrossRef]
  32. Zhao, X.; Zhou, J. Fast Recognition Algorithm for Human Motion Posture Using Multimodal Bioinformation Fusion. Math. Probl. Eng. 2022, 2022, 9538295. [Google Scholar] [CrossRef]
  33. Peters, C.H.L.; Vullings, R.; Rooijakkers, M.J.; Bergmans, J.W.M.; Oei, S.G.; Wijn, P.F.F. A continuous wavelet transform-based method for time-frequency analysis of artefact-corrected heart rate variability data. Physiol. Meas. 2011, 32, 1517–1527. [Google Scholar] [CrossRef] [PubMed]
  34. Hittle, B.M.; Gillespie, G.L. Identifying shift worker chronotype: Implications for health. Ind. Health 2018, 56, 512–523. [Google Scholar] [CrossRef] [PubMed] [Green Version]
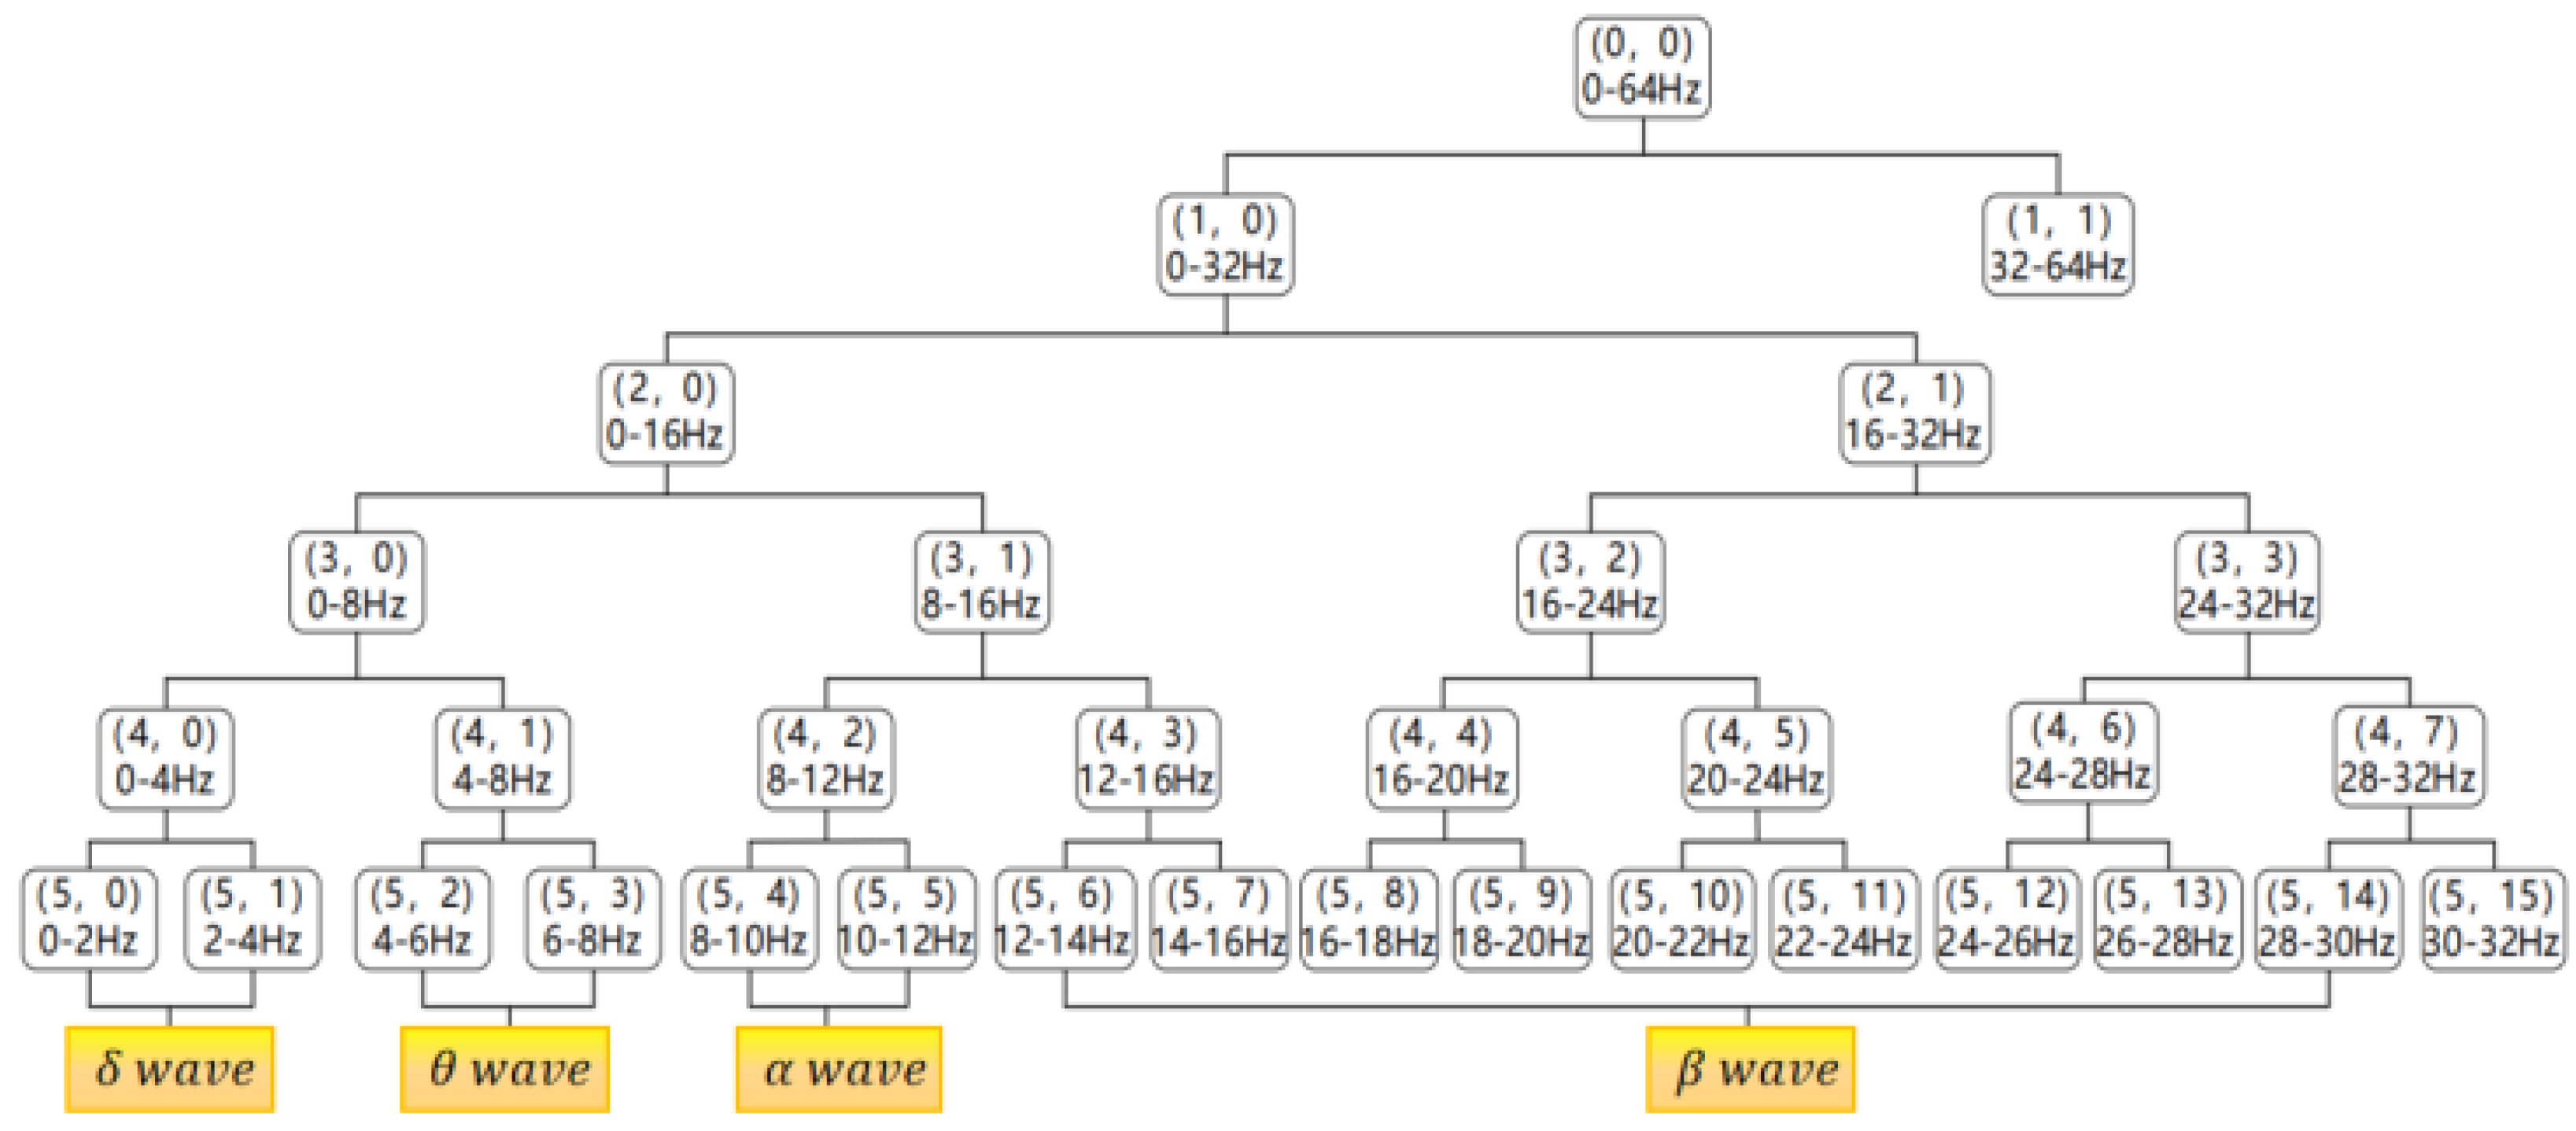
Figure 1. Wavelet packet tree decomposition.
Sustainability 15 09405 g001
Figure 2. Single hidden layer auto-encoder.
Sustainability 15 09405 g002
Figure 3. Stacked auto-encoder network architecture.
Sustainability 15 09405 g003
Figure 4. Integration process of physiological characteristics of shield machine drivers.
Sustainability 15 09405 g004
Figure 5. Test equipment.
Sustainability 15 09405 g005
Figure 6. Semi-dry EEG cap electrode arrangement.
Sustainability 15 09405 g006
Figure 7. Natural fatigue rhythm of the human body during the day and the night.
Sustainability 15 09405 g007
Figure 8. Physiological data acquisition from shield machine driver during excavation driving.
Sustainability 15 09405 g008
Figure 9. Physiological data of shield machine drivers (part).
Sustainability 15 09405 g009
Figure 10. EEG pattern after removal of electrical artifacts.
Sustainability 15 09405 g010
Figure 11. Comparison of EEG patterns: (a) before and (b) after filtering.
Sustainability 15 09405 g011
Figure 12. Waveform: (a) before and (b) after PPG signal processing.
Sustainability 15 09405 g012
Figure 13. Eye movement data processing interface.
Sustainability 15 09405 g013
Figure 14. Waveform: (a) before and (b) after EDA signal processing.
Sustainability 15 09405 g014
Figure 15. Physiological signal waveform of shield machine driver during operation after pretreatment.
Sustainability 15 09405 g015
Figure 16. EEG combined energy index of shield driver (a) segment 1, (b) segment 2 and (c) segment 3.
Sustainability 15 09405 g016
Figure 17. HRV time-domain index of shield driver (a) segment 1, (b) segment 2 and (c) segment 3.
Sustainability 15 09405 g017
Figure 18. Shield driver HRV frequency-domain LF/HF indicator (a) segment 1, (b) segment 2 and (c) segment 3.
Sustainability 15 09405 g018
Figure 19. Effects of various parameters on network training loss (a) hidden layers, (b) learning rate, and (c) regularization coefficient.
Sustainability 15 09405 g019
Figure 20. Training loss of SAE network with validation loss and weight bias distribution. (a) Model training loss and validation loss of SAE. (b) Distribution of SAE network weights and biases.
Sustainability 15 09405 g020
Table 1. Test time plan for obtaining physiological data of shield machine drivers.
ShiftExperiment NumberStart TimeEnd Time
Day shiftFirst test07:00After tunneling three rings
Second test10:00–14:00After tunneling three rings
(including rest time)
Third testThe last three tunneling instances on the day shiftAfter tunneling three rings
Night shiftFirst test19:00After tunneling three rings
Second test00:00–02:00After tunneling three rings
(including rest time)
Third testThe last three tunneling instances on the night shiftTunneling three rings
Non-working stateFirst test10:00–14:0020 min after the start
Table 2. Hardware Parameters of Driving Fatigue Physiological Characteristic Fusion Experiment for Shield Drivers.
ClassificationNameConfiguration
HardwareProcessor CPU©te© Core(TM) i7–11800H CPU @2.30 GHz
Running memory RAM16 GB
Solid-state diskIM2P33F8–512GD (512 GB)
Graphics cardNVIDIA GeForce RTX 3060 Laptop GPU (6 GB/1D05)
Operating systemWindows10
SoftwareIn-depth learning frameworkTensorFlow2.6
Development environmentJupyter Notebook
Algorithmic languagePython
Table 3. Node Parameter Settings for Deep Neural Networks.
LayerHidden1Hidden2Hidden3Dense2
Parameter161163
Table 4. Settings for Other Network Parameters.
Hyper-Parameter NameParameter CodeNumerical Value
Hidden layersh3
Nodes in each layern3-16-1-16-3
Learning rateLearning_rate1 × 10−3
Regularization factorλ3 × 10⁻³
Table 5. Recognition accuracy and training time of training and testing of different fusion algorithms.
Feature Fusion MethodTraining Accuracy (%)Test Accuracy (%)Training Time (s)
PCA76.572.1416
D-S syndrome79.478.9395
Bayesian estimation78.376.9413
L2-SAE81.981.5369
Disclaimer/Publisher’s Note: The statements, opinions and data contained in all publications are solely those of the individual author(s) and contributor(s) and not of MDPI and/or the editor(s). MDPI and/or the editor(s) disclaim responsibility for any injury to people or property resulting from any ideas, methods, instructions or products referred to in the content.