Article

Multi-Level Participatory GIS Framework to Assess Mobility Needs and Transport Barriers in Rural Areas: A Case Study of Rural Mumias East, a Sub-County of Kakamega, Kenya

by
Jean-Claude Baraka Munyaka
1,*,
Jérôme Chenal
1,2,
Pablo Txomin Harpo de Roulet
1,
Anil Kumar Mandal
3,
Uttam Pudasaini
3 and
Nixon Ouku Otieno
4
1
EPFL ENAC IIE CEAT Bâtiment BP—Station 16, 1015 Lausanne, Switzerland
2
UM6P CUS, Ben Guerir 43150, Morocco
3
Nepal Flying Labs/NAXA, Kathmandu 44616, Nepal
4
World Bicycle Relief, Kisumu 40100, Kenya
*
Author to whom correspondence should be addressed.
Sustainability 2023, 15(12), 9344; https://doi.org/10.3390/su15129344
Submission received: 28 March 2023 / Revised: 6 June 2023 / Accepted: 6 June 2023 / Published: 9 June 2023

Abstract

:
In recent decades, there has been a growing interest in the application of GIS to community empowerment or new policy development through participatory design, information gathering and implementation. This study, therefore, aims to apply a multi-level participatory GIS (PGIS) framework to assess mobility needs and barriers in rural areas from different available transport modes. This assessment was applied to three sub-locations (Lusheya, Khaunga and Mahola) located in the sub-county of Mumias East, Kakamega, Kenya. The study brings two main contributions: (1) an overview of mobility needs and barriers in Sub-Saharan Africa (SSA) and (2) an introduction of a PGIS framework that integrates in-depth local knowledge of rural mobility needs and mobility barriers. This PGIS framework was applied to mobility issues based on three main dimensions: context, process and content. The context in the PGIS framework focuses on identifying the right stakeholders and putting on suitable structures for their training as well as the collection of data. The process considers the collection, analysis and visualization of rural mobility data. The content of the data collected are validated for accuracy in the form of maps and are evaluated for relevance by stakeholders. Local youths with GIS knowledge and digital tools were mobilized along with community people having a solid understanding of the local geographical contexts to collect geographically referenced data related to community resources, transport networks, and mobility barriers. The application of the multi-level PGIS framework has brought to the mainstream daily mobility challenges faced by rural communities in Sub-Saharan Africa. Community members, even those from remote areas, also have access to decision making, reversing the previous structure that strongly relied on often-irrelevant, top-down decision making.

1. Introduction

1.1. Knowledge Gaps in Rural Mobility
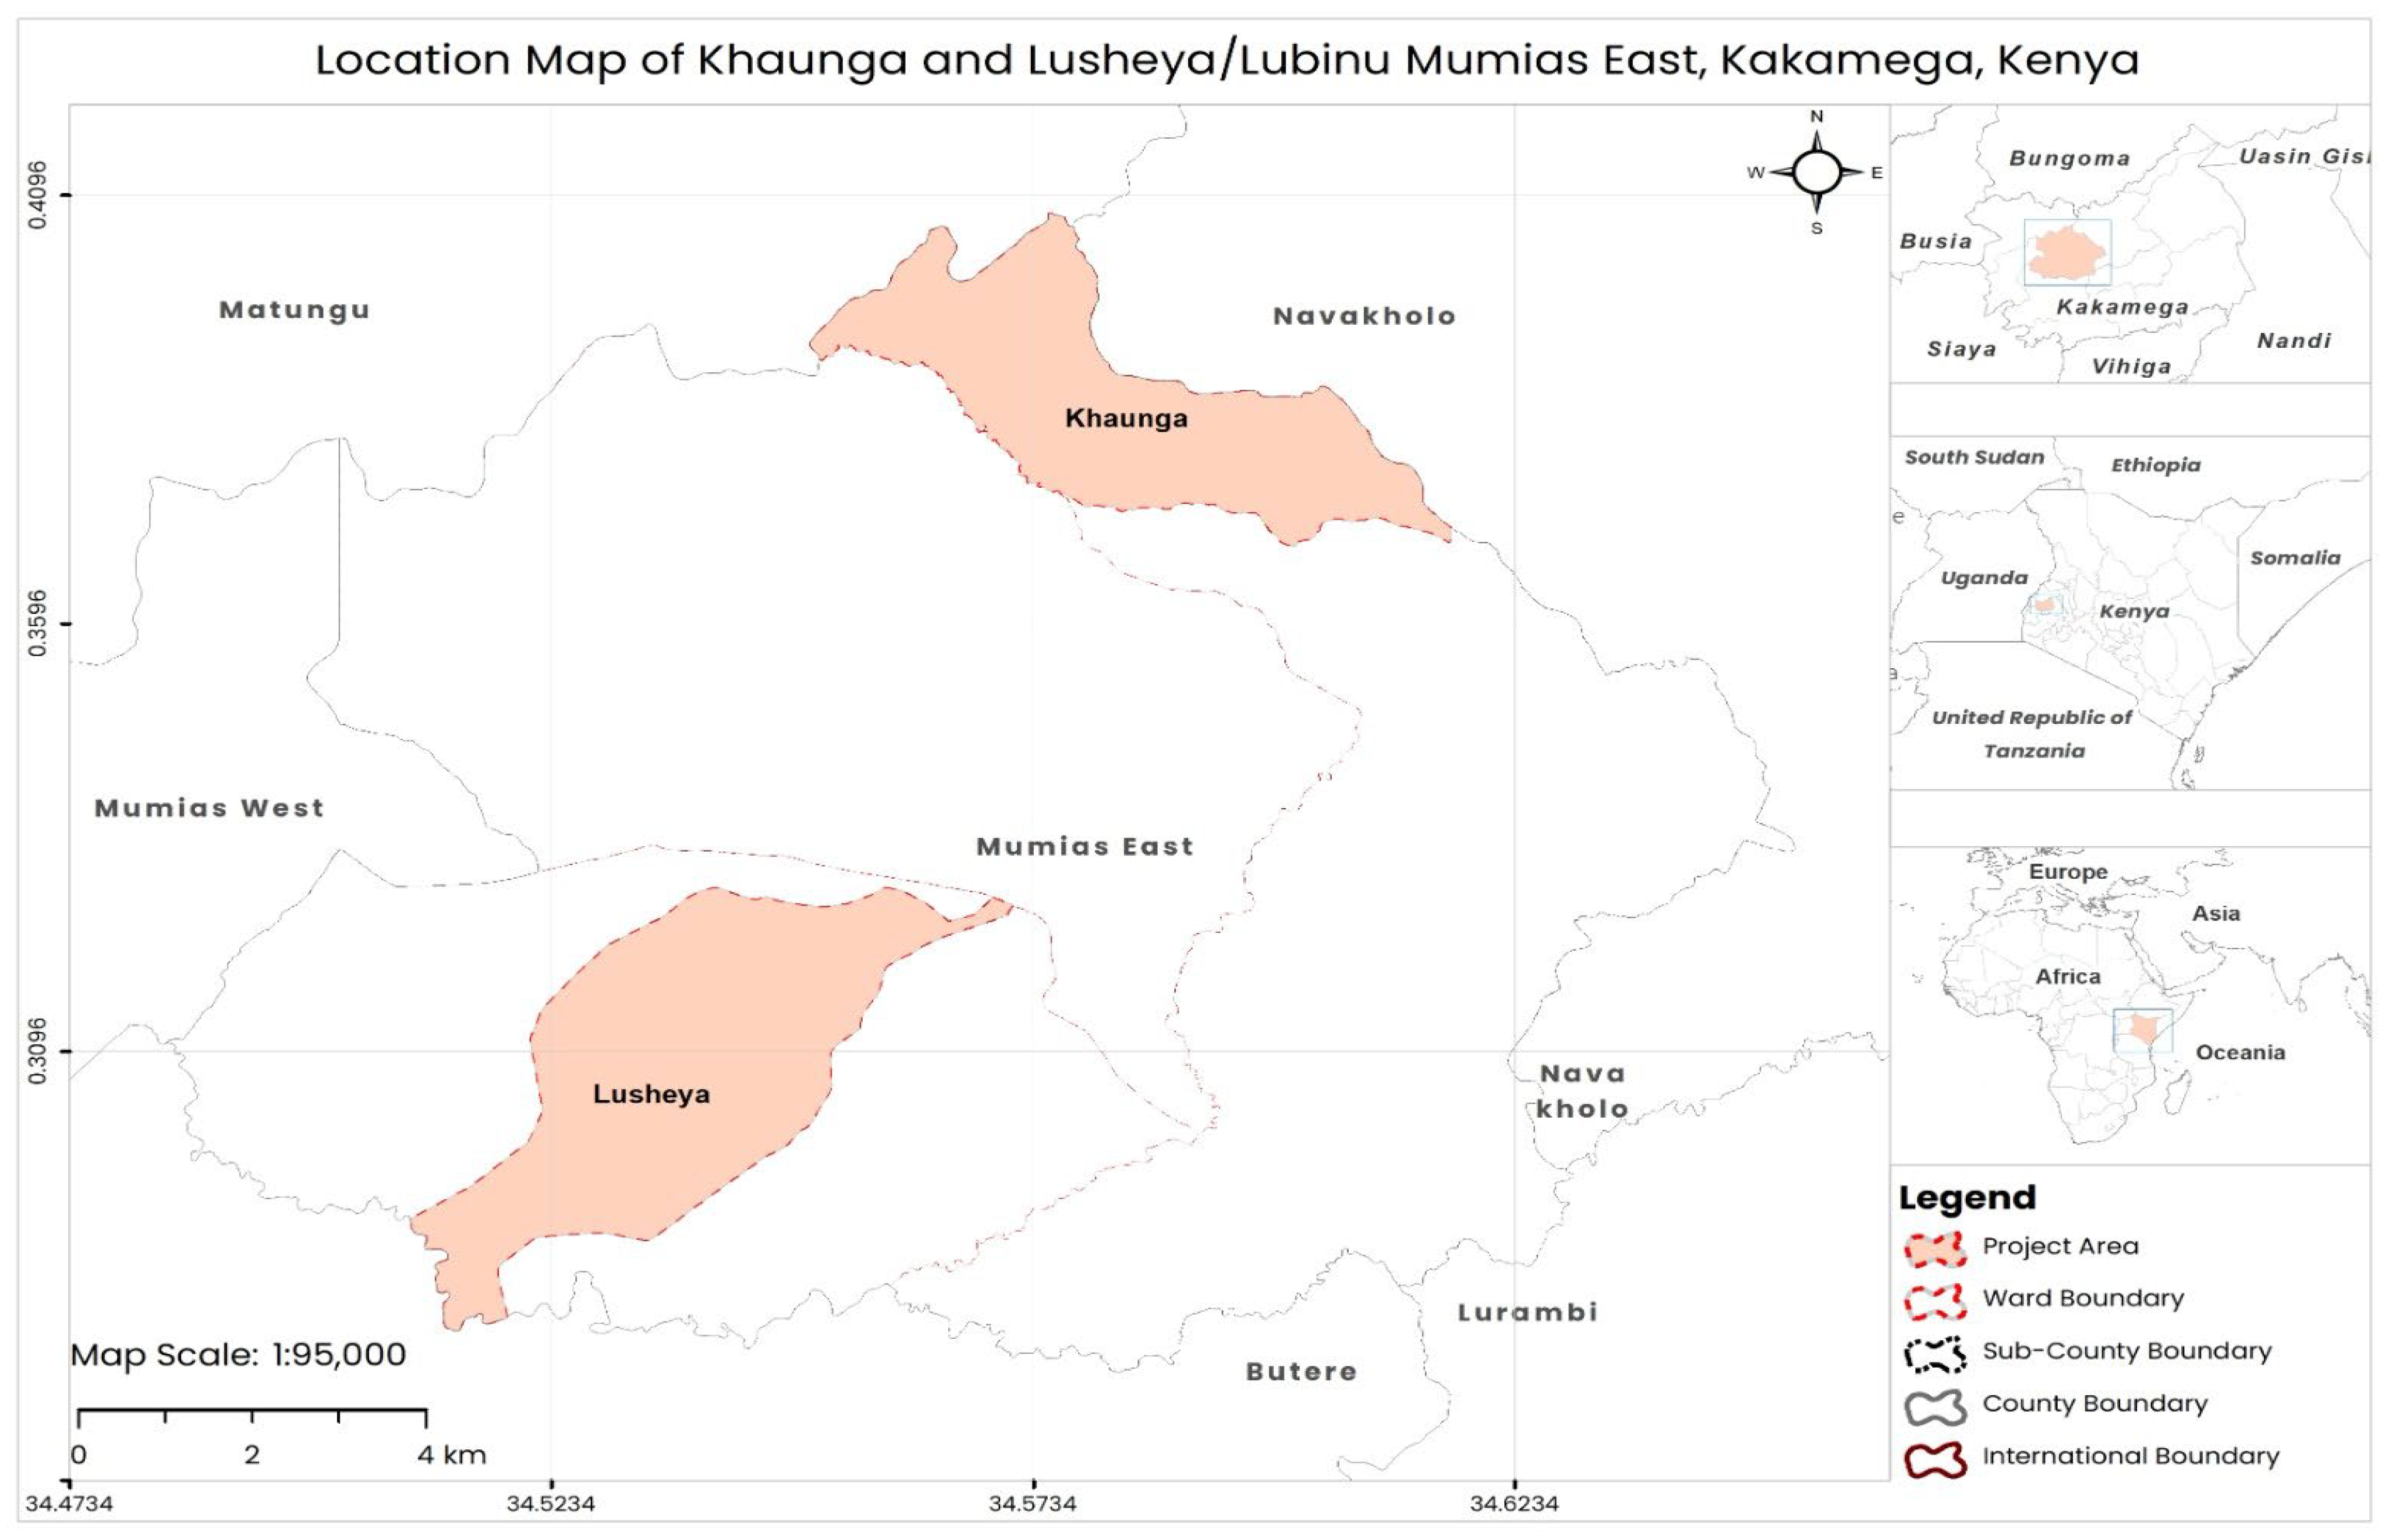
According to Sustainable Mobility for All [1], one billion people living in rural communities worldwide cannot access reliable transport. This hinders their ability to access essential commodities and transport of goods [2]. Past efforts to improve rural transport in Sub-Saharan Africa (SSA) have focused on building and maintaining roads, while the issues of rural access, mobility, and household transport were paid little attention [3]. Transport options in rural areas are often scarce and challenging, while settlements are dispersed and nucleated, with variated population densities. According to Ahern and Hine [4], the dispersed nature of the rural African population in rural areas is primarily due to demographic changes caused by rural–urban migration. These demographic changes are often the results of the scarcity of crucial infrastructure needed to survive in this globalized world [5]. These changes have increased poverty due to rural depopulation and have decreased labor forces needed for agriculture, livestock, mining, and fishing [6]. Furthermore, rural mobility challenges, particularly faced by women, include traveling long distances to access facilities such as (i) water and firewood collection, (ii) crop production, (iii) crop marketing, (iv) non-agricultural income generation, and (v) access to economic and social services [3]. A study conducted in Vienna on barriers and their influence on mobility behavior by Strohmeier [7] identified mobility needs and barriers in four categories: (i) needs caused by other road users, (ii) needs caused by insufficient and unsuitable transport supply, (iii) needs with the physical environment and (iv) needs with quality of roads and availability of information.
Since transport problems are spatially based and involve a set of feasible alternatives with multiple evaluation criteria, Giurida et al. [8] believe that Geographic Information Systems (GIS) can be powerful tools to support experts conducting robust assessments and to allow stakeholders and citizens to easily visualize the impacts. GIS tools can be adopted to improve living standards and to reduce poverty through public participation in policymaking enhancement and community empowerment [9]. Implementing a GIS is said to be “participatory” when a set of inclusive practices are applied to incorporate the participation of local people in all phases of the project, from designing and information gathering to mapping production and decision making [10,11]. PGIS further contributes to local knowledge by transforming and updating even omitted or forgotten substances into maps [12]. According to Brown and Kyttä [13], the publications and research in the PGIS field have significantly increased in recent decades. There is, however, little PGIS research conducted on mobility.
This study brings two main contributions: first, the application of a multi-level conceptual framework structured in three dimensions—context, process and content—conceived and piloted to assess mobility needs and barriers in rural areas; second, the contribution to the extension of the existing digital platforms, such as OSM, through participatory means. This PGIS framework was applied to three sub-locations, namely Lusheya, Khaunga and Mahola, all located in the sub-counties of Mumias East, Kakamega, Kenya (Figure 1). Due to its geographical location, population size, climate, and socio-economic activities, Mumias East is a strategically important sub-county in the western Kenyan region.

1.2. The Study Area

Kakamega is a strategically important County in Kenya located in western Kenya. With its population size (third largest) and its population density of 618.4 people/km2, Kakagema county has a significant sugar and agricultural economy in the region. It borders Siaya county to the west, Vihiga county to the south, Nandi and Uasin Gishu counties to the east and Bungoma and Trans Nzoia counties to the north [14]. Kakamega county is divided into thirteen (13) sub-counties [14]. This study focuses on the constituency of Mumias East, which consists of three wards covering nine localities and 18 sub-localities with an area of 135.50 km2 and a population of 100,956. From the three wards, the study emphasis is on the locations and sub-locations shown in Figure 1 below:
(i)
Lusheya location (Lusheya sub-location); population: 37,609; sq km: 57; Lusheya-Lubinu ward, Mumias East sub-counties; latitude: 0.3199904; longitude: 34.543329.
(ii)
Khaunga location (Khaunga and Mahola sub-locations); population: 32,343; sq km: 35.10; East-Wanga ward, Mumias East sub-counties; latitude: 0.3764; longitude: 34.5779.
Kakamega county has the largest rural population in Kenya, with 62% of the people involved in agricultural activity. These activities include the cultivation of maize and beans for subsistence, tea, in some parts, on a small scale (1 acre on average), and sugar cane (a significant cash crop agricultural activity) on a large scale in the areas around Mumias for the local sugar industry [14]. Apart from crop production, livestock farming, although on a smaller scale, contributes to regional high output. After production, farm products are transported to the marketplaces by road. With the tropical climate and annual rainfall ranging from 2214.1 to 1280.1 mm per annum, roads in Mumias East that lead to/from farms in rural areas are often subject to barriers such as flooding, resulting in mud and slippery roads, thus limiting access to commonly used modes of transport such as motorcycles (boda boda) or bicycles. In addition to the impact of climate on mobility, the socio-economic impact also plays a crucial role in ensuring that all road types i rural Kakamega are constantly maintained and that new road paths are built.

2. Literature Review

2.1. Overview of GIS and PGIS Research Streams

GIS is a computer-based tool for mapping and analyzing spatially referenced data that can facilitate the understanding of spatial aspects of social and economic development [15]. According to Rambaldi et al. [16], GIS enables modern spatial decision making, a technological artifact to non-governmental and community-based organizations. GIS is composed of two main components [11], namely:
(i)
The software component brings geographic data into the GIS—either from remote sensing sources, ordinary printed or digital maps, or field reports—and converts this data into a computer-readable form.
(ii)
The database incorporated by a GIS allows the data to be managed and deployed.
Similarly, among different approaches to mapping using GIS, PGIS offers a holistic approach that integrates the participation of local people in all project phases in order to “create more reliable data outputs, and encourage capacity building and learning processes” [12]. The term “PGIS” emerged from the participatory approach in rural areas of developing countries, the fusion of participatory learning and action (PLA) methods with geographic information technologies [16], making data credible, quantifiable, and easily updated, providing supportive baseline data to intervention and evaluation, and reflecting physical, social and economic constraints [17]. The PGIS approach is also effective in improving communication between stakeholders, increasing trust, educating the public, reducing conflicts, incorporating public values into decision making, and improving the quality and legitimacy of decisions [18,19].

2.2. ML-PGIS Frameworks Review for Transport Planning/Mobility Need Assessment/Mobility Analysis

Using PGIS, rural transport information gaps are able to be filled in order to integrate all aspects of rural lives, including demographic structures, into their plan for future transport planning. Among the few existing publications on PGIS applied to transport planning, note its application in rural land reform in post-apartheid South Africa. It revealed that GIS developments, in their previous state, were a modernist, top-down, technocratic, and elitist “development” paradigm. [20]. As a result, “knowledge” and “meaning” were defined based on the individual’s abilities to interpret technical data in a computer system [21]. These authors then further explore the potential for incorporating community knowledge, within the framework of alternative GIS production, in the pursuit of a participatory land reform project in the Kiepersol locality in the former Eastern Transvaal region of South Africa [20,21]. Harris and Weiner [22] explored the linkage between GIS, empowerment and marginalization through community-integrated GIS, marking the preliminary attempt to use GIS for community empowerment, with the technology being taken out of a conventional top-down development context [23].
Corbett and Keller [24] proposed a distinction between empowerment and empowerment capacity, with the latter dealing with the “process” of changing the internal conditions that influence power, while the former defines the “outcome” or “increase in power”. In addition, Corbett and Keller [24] produced and replicated the concept thematically, leading to the development of a two-dimensional framework that incorporates two social scales—individual and community—and four empowerment enablers (themes) to serve as a roadmap for the current and future evaluation of “participatory: GIS activities. The four themes (empowerment enablers) mentioned earlier are information, process, skills and tools. Similarly, Sieber [25] developed a two-dimensional framework in which co-production takes place through the following themes: “place and people”, “technology and data”, “process”, and “outcomes and evaluation”. Although the indicators in the model showed an increase in empowerment through all the different catalysts and an evident change in individual and community capacity levels, Pozzebon et al. [26] believed that the model lacked a more precise and more concrete frame to guide empirical work that encompasses multiple levels of analysis.
Given the growing importance of information systems (IS) and the increasing relevance of community-based research, Pozzebon et al. [11] proposed a conceptual framework that incorporates a complex, multi-level analysis involving the individual, group, community, network and organizational levels, even those who are not in a position to implement and use ICT innovations for their development purposes. ML-PGIS is an approach that involves using geographical information technologies (PGIS) at multiple levels to enable community members to participate in the creation, management, analysis, and dissemination of geographic data [27,28,29]. Pozzebon and Diniz [30] further develop a ML-PGIS influenced by three theoretical perspectives:
  • Social Shaping of Technology: In the first theory, the attention is paid to the diversity of actors’ interpretations of meaning and content of technology [31].
  • Structurationist view of technology: This second theory is influenced by Giddens’ structuration theory written by Giddens and Pierson [32]. Structuring thus emphasizes the interaction process between individuals and society rather than one or the other [33].
  • Contextualism approach: This approach introduced by Pettigrew [34] argues for the lack of process and context in research aimed at institutional change and therefore emphasizes the need for three-dimensional research that includes context, process and content. These dimensions are integrated by Pozzebon and Diniz [30] into four main concepts: (i) relevant social groups, (ii) interpretive frames, (iii) negotiation and (iv) technology in practice.
The theoretical scheme developed by Pozzebon et al. [11] was used to analyze the use and consequences of PGIS in local communities. This scheme incorporated two frameworks, one from Pozzebon’s previous works [26,30] and the other from Corbett and Keller [24]. Figure 2 below proposes applying the Pozzebon et al. [11] framework to the assessment of mobility needs and barriers in rural areas. The proposed ML-PGIS framework in Figure 2 focuses on in-depth local knowledge of rural mobility problems rather than on demographic structure, social composition or political orientation.

3. Materials and Methods

The proposed ML-PGIS framework in Figure 2 was applied in the Mumias East sub-county. Mobility-related data were collected from several data sources, were analyzed and the findings validated by the local community (Figure 3).

3.1. Data Collection

Data collection involves multiple steps: (i) first finalization of a list of datasets that need to be collected, (ii) secondary data collection, (iii) training local people, (iv) primary data collection, (v) data validation and (vi) data analysis.

3.1.1. Standard Data Listing (L1)

The finalized data template is a critical step in the data-collection exercise. These 11 lists of data layers with different categories and consisting of different sets of attributes, as shown in Table 1, were gathered from the reviewed literature and were validated by stakeholders during the project kickoff meeting before the data-collection exercise.

3.1.2. Secondary Data Collection

For secondary data, the research team gathered local institutions such as the municipality offices, national mapping agencies, and other available datasets in their existing format. Other government offices targeted included the Ministry of Health, Education, Transport, and Public Works, the Kenya Rural Roads Authority, the Ministry of Lands and Physical Planning, the police headquarters in Kakamega, and the village chiefs and assistant chiefs’ offices. The study collected data from 42 villages (24 in Lusheya, 10 in Khaunga, and 8 in Mahola). Other data sources included Open Street Maps (OSM) and remote mapping. OMS data were used as baseline data, while the remote mapping exercise enhanced the existing geographical data layers within the project area. The remote mapping involved youth mapping volunteers from several countries, conducted online for seven days.

3.1.3. Training and Primary Data Collection

a.
Data Gap Analysis
A thorough and careful review of the secondary dataset helped identify and understand the existing data gaps. During this process, the collected datasets were compared with the standard data collection checklist. The primary data collection was conducted in order to fill the existing gaps in the standard data listing (L1). Table 2 below shows the L1 data type (layer) and sources (both secondary and primary) for the Mumias East sub-county.
b.
Orientation Session and Technical Training
The research team identified and sensitized local enumerators and community participants on the benefits of data-driven planning and GIS mapping. The enumerators’ training focused on the use of QField during the data collection. As the principles of citizen science suggest that “members of the community know more about the community they live in”, the research, therefore, recruited community members with deep knowledge of their community. The five days of PGIS training focused on (i) the completeness and accuracy of existing data, (ii) relevance of the collected data to the community, (iii) data privacy and the data protection laws, (iv) data collection tools and (v) the handling of cultural, economic or even security sensitivity. Furthermore, the study collected primary data for ten days, including the digitization of the attributes and categories from L1 in a participatory means. Finally, the validation exercise was conducted after the collection and consolidation of data into one map. During the two-day exercise, additional missing data were incorporated into the map.
The primary datasets were collected using Qfield. Participants and enumerators were trained using QField, a free and open-source application developed by the OpenGIS OS Company. The collected data layers are directly well-suited with QGIS desktop GIS software and GIS layers without additional processing. QField collects data as attributes as mentioned in Table 1.
Furthermore, the data generated from the Qfield are in the shapefile or geo-package format, which are read and analyzed as a GIS layer with all the attribute information from the table, including the drop-down selection feedback (categories) or checkboxes (see Table 1). Each project was developed in QGIS and transferred to QField on one or more tablets for the collection exercises.
c.
Data Collection Exercise
The recruited participants were paired (a community member and an enumerator). The community members targeted had strong local knowledge. Meanwhile, the enumerators included one with a basic understanding of data, GIS, and knowledge of mobile devices. After training and orientation, these groups were then mobilized to collect different datasets as per the gaps identified. The primary data collected were not existing geographical data from the L1 data type (layer) and from sources for Mumias East sub-county, as shown in Table 2. Each attribute datum was useful in identifying Mumias East residents’ movements as part of their daily life routine and the challenges attached to accessing markets with farm produce and basic services.

3.1.4. Data Validation

The main essence of PGIS is to ensure that the community people play a critical role in finalizing the datasets and ultimately the GIS database of a given area. Hence, the datasets collected using different means were again presented in front of the community for a data validation exercise. The data validation first aimed to increase the data accuracy. Community people from different gender and daily activities, together with the enumerators, officials and the research team, reviewed each data layer and provided their feedback on names, places, missing features, etc. Furthermore, the second aim of the data validation was to test and discuss the relevance of geographic features that had been collected. The validation process took two days.

3.1.5. Data Analysis

The analysis conducted included the following steps: (i) cleaning of data layers collected from various sources, (ii) qualitative data analysis of daily activities (performed as “males vs. females”) and (iii) analysis of mobility needs attributes.
a.
Cleaning of data layers collected from various sources
Before data analysis, data cleaning work was conducted. QGIS software was used to refine the datasets before analysis. This work included the cleaning of the network layer, ensuring the completeness of the data, etc. Data quality is the primary concern faced by most research projects. Improper cleaning of dirty data will indirectly generate inconsistent results [48], leading to wrong decisions [49]. Rahm et al. [50] listed the data cleansing process in five phases: (i) data analysis, (ii) definition of transformation workflow and mapping rule, (iii) verification, (iv) transformation and (v) backflow of cleaned data.
b.
Daily “Males vs. Females” Analysis
The frequency of trips and the multitude of tasks performed daily by women and males contribute to the overall knowledge of the socio-economic, family structures (agriculture, trade, crafts, and liberal professions) and the targeted area’s mobility needs. Participants were separated as per their gender, and each listed the daily activities carried out between 6:00 a.m. and 9:00 p.m., “Based on a literal transcription of the speeches, the information collected was subjected to a thematic content analysis assisted by Nvivo” [51].
c.
Analysis of mobility needs
Attribute data and categories valorized on QGIS were exported and analyzed using statistical methods. The statistical analysis aimed at understanding mobility needs and barriers, relationships and associations in Mumias East. The most frequent mobility barriers observed were: (i) damaged infrastructure, (ii) open sewage, (iii) unmaintained pavement and (iv) waterlogged areas. The statistical significance relationships between the type of road barriers on categorized roads and other parameters were tested at 90%, 95% and 99% confidence levels (* p < 0.1; ** p < 0.05 > 0.01; *** p < 0.01), respectively, using Statistical Software for Data Science (Stata). The parameters included the season the data were collected (critical for mobility barriers), seasonal/permanent usage (car, foot, bicycle, public), and road types/network (path, residential and tracks, etc.). Apart from Stata, Excel was used to further analyze the mobility needs and barriers from the attribute table. Deductive/inductive analysis was used to refine the framework through an iterative approach, giving way to a clearer understanding of the subject [52].

4. Findings

The PGIS multi-level framework findings were classified into three levels: context level, process level and content level.

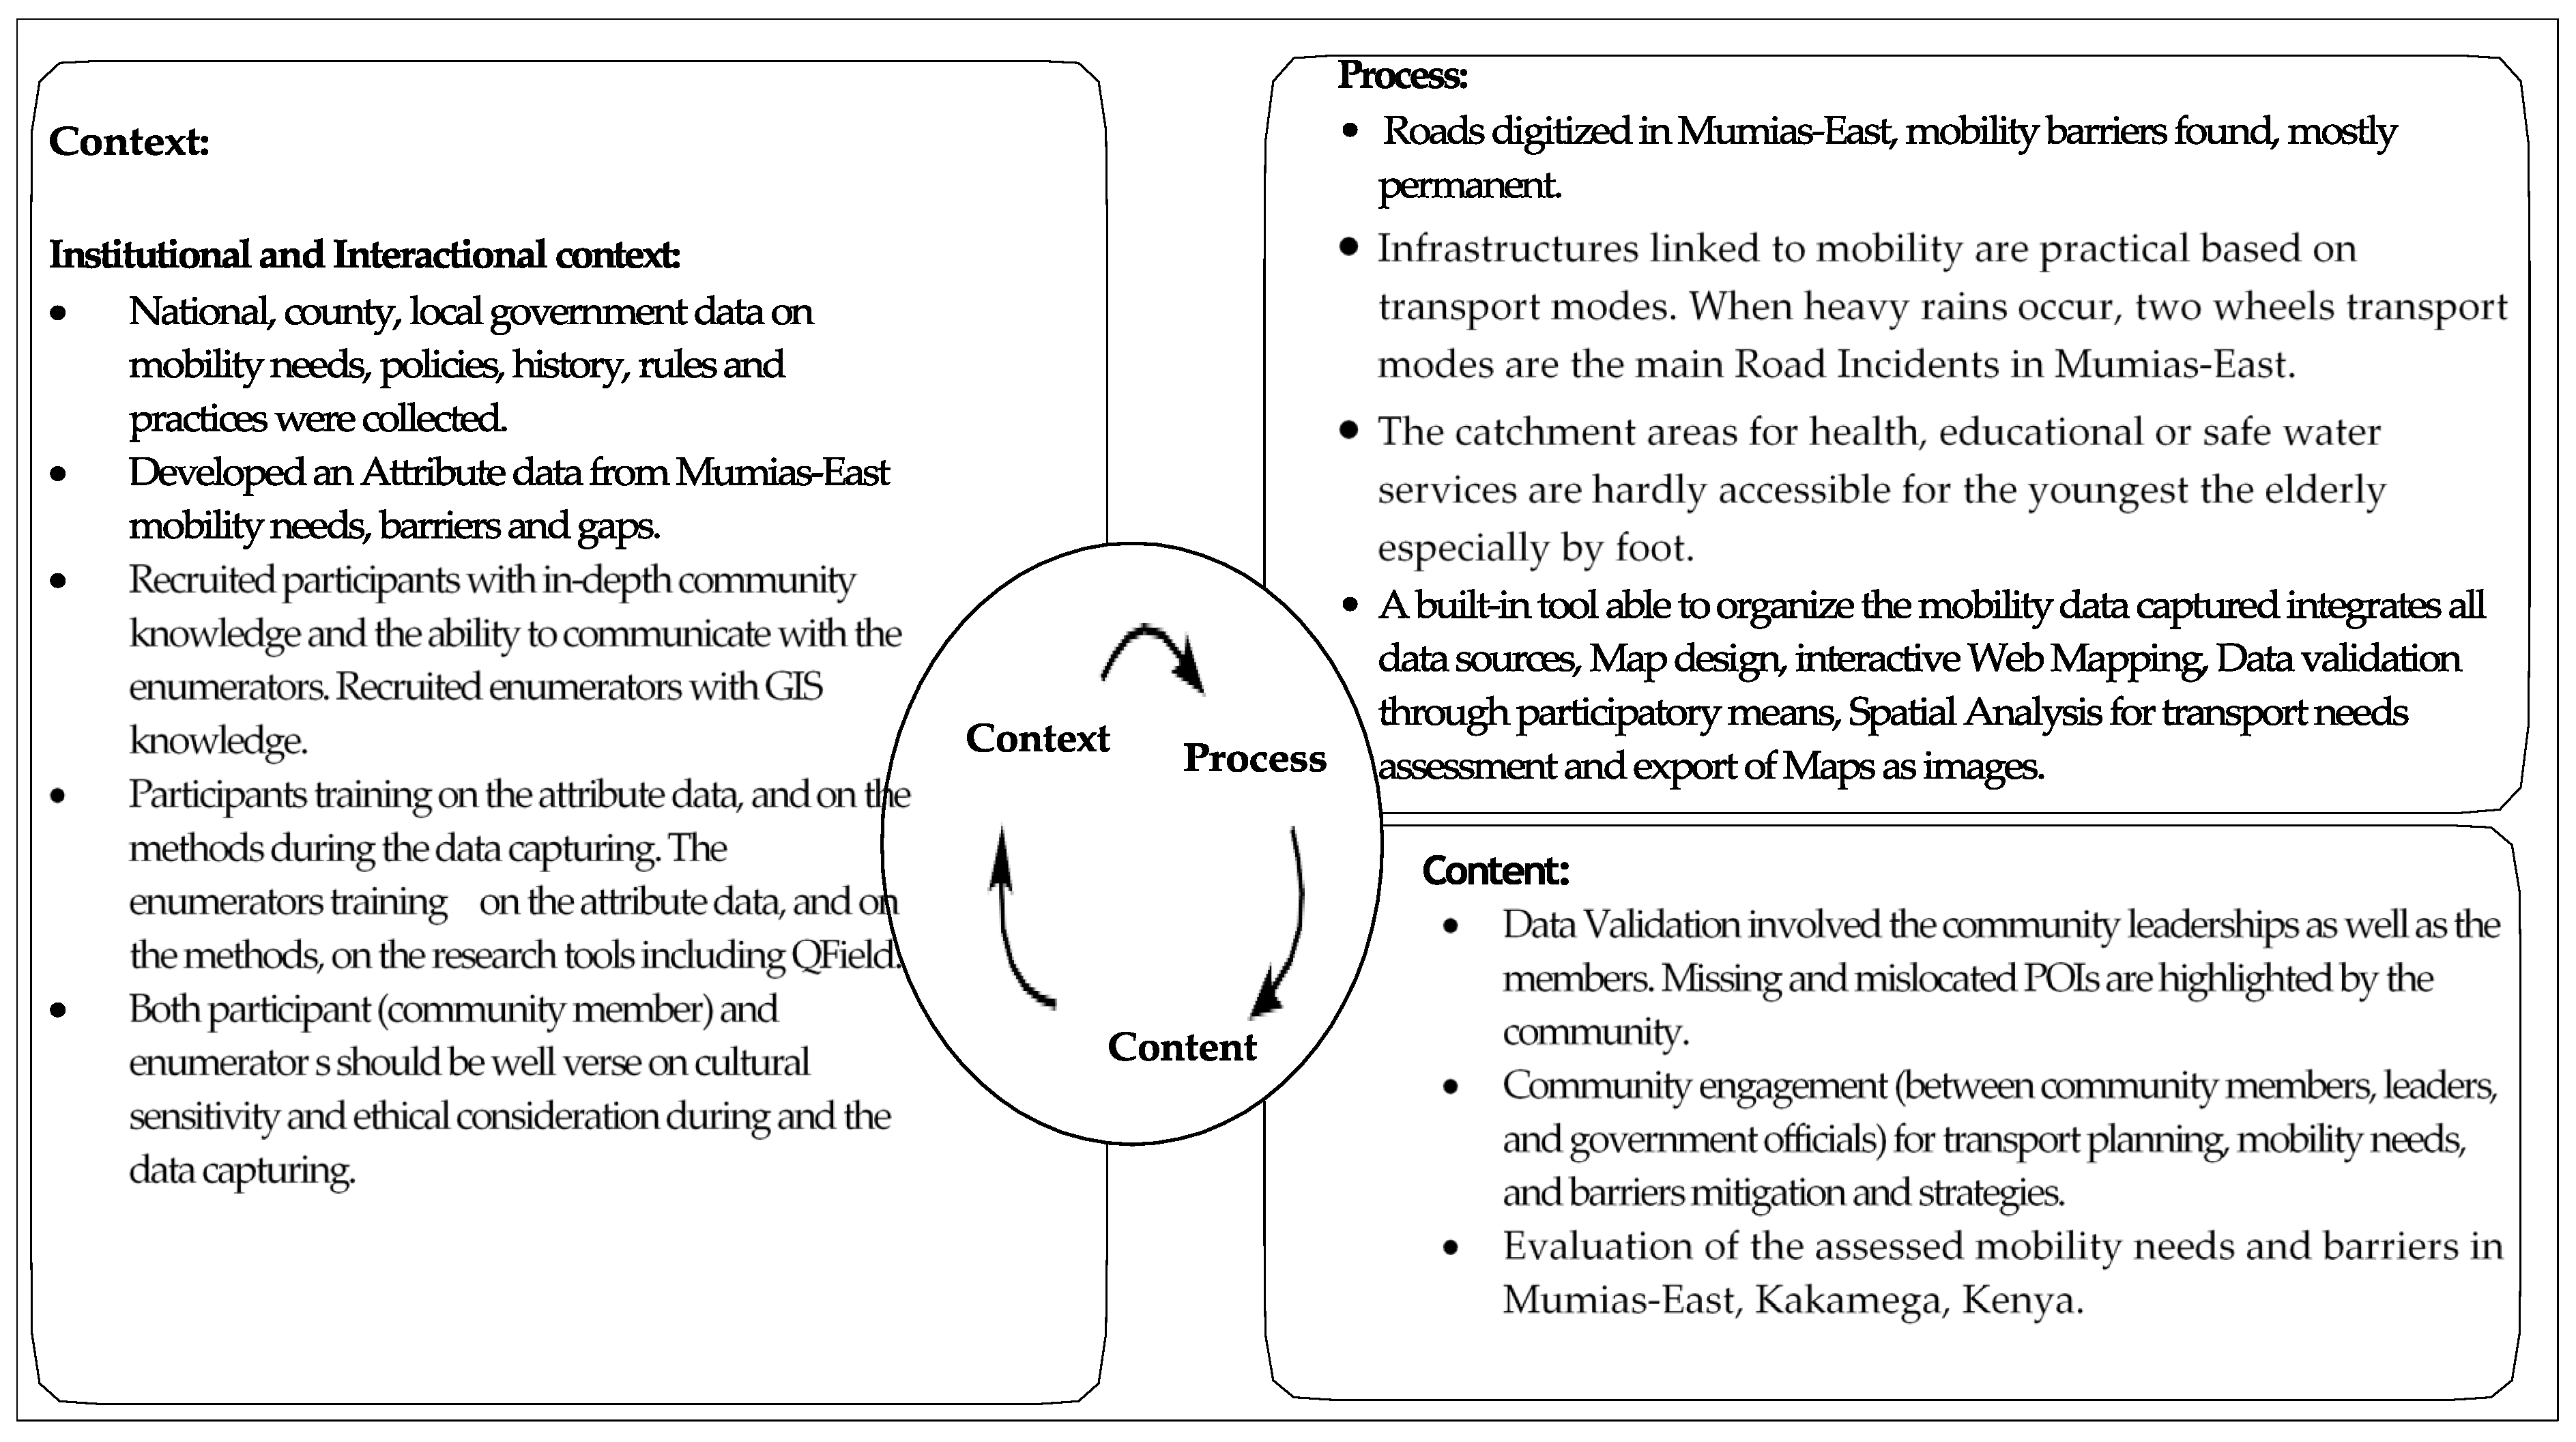
4.1. Level 1—The Context of the Mumias East Project: Institutional and Interactional

The context of the PGIS multilevel framework, as shown in Figure 2, is centered around institutional and interactional pillars. This context involves first community policies, history, rules, and practices; second, community recruitment with in-depth knowledge of rural transport needs and barriers to mobility; third, training on the method, information flow, resource allocation, responsibility assignment and engagement on the field with an enumerator; and finally, community participation structure and rural data intended to be collected.
Mumias East has a known agricultural history. Consequently, transportation policies were built to alleviate the supply of fresh produce to the local markets. The community members targeted had strong local knowledge. Many authors, including Bryceson et al. [53], argued on the instinct as to which rural road investments are critical to economic development. In Mumias East, to ensure that farmers or farm products are transported in time, investments are needed to maintain existing roads and for building new roads connecting farm areas to marketplaces. Such investments improve road quality, reduce transport costs and remove barriers to mobility. The investments needed are not only financial. The Sub-Saharan Africa Transport Policy (SSATP)/World Bank technical assessment in the early 2000s, invested in improving local authorities’ infrastructure building capacity and on the involvement of users at all stages of the transport project cycle throughout SSA [54]. In recent years, there has been, in Kenya, a policy shift, with local or sub-county governments having more responsibility for planning and management previously occupied by central government agencies. Using PGIS, the local government and residents are also directly involved in decision making concerning their communities, and their inputs are incorporated into the strategic plan and policy making. To assess mobility needs and transport barriers in Mumias East, participants from the community were recruited taking into account their social and age categories and gender. Participant profiles retained included: (i) being an active member and deeply involved in activities of the local community, (ii) being able to speak in local languages and dialects, (iii) being knowledgeable about the local cultures and customs, and (iv) being knowledgeable about the community day-to-day movements and road trends.
Participants with previous experience in community work had an added advantage. Some participants involved were also either part of the administration or held administrative positions, such as an assistant chief, village leader, or elder. In addition to the ten participants, the study also recruited youth mappers (enumerators) with GIS knowledge in digitizing information collected from participants and digitally recording the information about geographical objects they see around them as they walk around the community.
Participants’ activities during the training included mapping their local communities and listing their daily activities from 6 a.m. to 9 p.m. Both assisted in understanding mobility needs and the catchment area and were useful during the digitization process.
In the analysis of male and female participants’ daily activities, the study identified 36 personal activities for females against 23 for males during a similar time frame. Similarly, agro-pastoral activities were mostly conducted by males (10 over 7).

4.2. Level 2—The Process of Implementing a PGIS Framework

As per the proposed framework shown in Figure 2, the process involves: first, the stakeholders interactions, data management and capture; second, built-in tools, decision makers support tools, and practitioners that design and guide; and third, data visualization through graphs and maps.

Stakeholders’ Interactions and Data Management and Capture

During the ten days of data collection on the three sub-locations, participants, enumerators, and the technical team worked interactively to achieve the research objectives. The attribute data as defined in Table 1 were captured. Figure 4 and Figure 5 also show the digitized road networks in both the Lusheya and Kaunga locations.
QField was used for data capturing, while the participants, through stakeholder interactions, offered guidance and direction to the attribute’s location and knowledge regarding the attribute’s categories. Finally, the technical team offered technical support to the enumerators and valorized the collected data from QGIS. In total, 3988 segments were captured, linking residents in the two targeted sub-locations to the catchment areas. These areas included POIs such as schools (40), health facilities (10), government offices (15), water points (18), and mosques, churches, and businesses (370). From the captured segments, 138 had transport barriers in the form of (i) damaged infrastructure, (ii) flooded areas, (iii) open sewage, and (iv) unmaintained pavements. Among the road types digitized, they included paths, tracks, residential and others.
Of the digitized road networks, 46% were paths, and both tracks and residential roads collected were 23% each. Other road networks collected included unclassified, tertiary, pedestrian, footpath and primary roads. “Path” was considered as a generic path, with any type of surfacing, open to multi-use for all non-motorized vehicles and not intended for motorized vehicles unless marked separately. In most parts of rural Sub-Saharan Africa, paths are used mainly for non-motorized transport of farm produce and access to water points or local markets. Similarly, tracks serve as minor land access roads that are often not considered as part of the general-purpose road network. In the Mumias East rural context, tracks are mainly used for agriculture, forestry, water supply, etc.
In proportion to the digitized roads (3988 segments), the mobility barriers represented only 4% of the total road network data. Furthermore, of the 138 road segments with mobility barriers, 60% (83 road barriers) were from the Lusheya sub-location, 29% (40 road barriers) were from the Mahola sub-location, and the remaining 11% (15 road barriers) were based in the Khaunga sub-location. Further data on barriers to mobility in the targeted areas revealed that 55.8% of roads had infrastructural damage, while 40.6% of roads appeared to have problems mainly related to seasonal congestion. Open sewers and unmaintained road surfaces accounted for less than 5% and were found only in Lusheya. Figure 6, Figure 7, Figure 8 and Figure 9 show the barrier types collected in the studied sub-locations.
Furthermore, a relationship analysis was conducted between the road barriers categories, seasonal/permanent usage, road types/network and the studied sub-locations (Khaunga, Mahola and Lusheya). From the analysis, only three (3) variables had a sufficient relationship with the sub-location studied. For example, “walking” (p = 0.010), “road” use by bicycles (p = 0.014) and “road network” (p = 0.081) had a good relationship with the sub-location studied at the 95% confidence level. Furthermore, in terms of walkability, all road points collected in Mahola were usable by foot,. as well as the majority of roads in the Khaunga and Lusheya sub-locations. With regard to the road networks or type of roads, the majority (60%) of the road “lines” collected were residential roads in Khaunga. In addition, mobility barriers are largely seasonal in Khaunga (80%), while they are more or less balanced between permanent and seasonal in Lusheya and Mahola. In addition, in terms of the relationship between the sub-locations being studied and those used by transport modes, based on the road data collected, “foot” and “bicycle” are the two most used transport modes in the three sub-locations. Finally, “paths” are the road types/networks mostly used by the population in the sub-locations targeted.

4.3. Level 3—The Content in the Implementation of a PGIS

As per the proposed framework shown in Figure 2, the content involve, first, data validation with stakeholders and, then, the evaluation of the mobility impacts on community movement as well as goods from one point to another.

4.3.1. Data Validation

The stakeholders involved included community members, community leaders, enumerators, the technical team and government officials from the Mumias East sub-county. The validation process lasted two days, and participatory discussions were held in groups. The datasets collected were displayed on a projector screen, and participants were requested to comment on both the accuracy and the completeness of the data layers (Figure 10). The validation process ensured that the data presented in Lusheya, Khaunga and Mahola represented the reality of these targeted areas. The analysis of participants’ daily activities in the contextual stage of the multi-level framework provided a rich gender perspective on the Mumias East sub-county attribute data collected and aggregated into a map and the evaluation of mobility impacts on community movement.

4.3.2. Evaluation of the Mobility Impacts

Based on the feedback received, Table 3 evaluates the mobility impact of each attribute and road networks in relation to the targeted community movement as well as their goods in Mumias East. In the evaluation, the “context” targeted participants’ views on the parties responsible as per attribute. Meanwhile, the “process” mostly focused on the PGIS framework findings. Lastly, the “content” validated and evaluated the PGIS framework findings.

5. Discussion and Conclusions

The application of the multi-level PGIS framework in this study conducted in Mumias East Kenya has brought to the mainstream daily mobility challenges faced by rural communities in Sub-Saharan Africa. These challenges are multiform and target all aspects of their lives, from education and healthcare to business. This study therefore applied a hybrid approach of participatory mapping where digital tools and technologies were used together, with community-based participation kept at the core heart. The digital approach was used not just in data collection but also in data validation and finalization. Mumias East sub-county, as a research area, is ideal because of its strong agricultural base and predominantly rural population. The three dimensions of the multi-level PGIS framework (context, process and content) were applied, and the assessment is contextually summarized in Figure 11.

5.1. Context in the PGIS Framework

The context for this research was mainly institutional and interactional. Institutional implies government involvement in the mobility assessment. This involvement occurred at all governmental levels, from the central to the village. With the recent decentralization in Kenya, mobility data attributed to this research were available at the national and sub-county levels. The interactional part of the research implies the involvement of not only government officials but also of community leaders and members. These participatory exercises permit a deeper understanding of the community and its needs in terms of mobility and transportation. The recruitment and training of participants were critical to the research. The participant recruitment considered more than just their knowledge of the area or their anciency but also the community grouping structures and cultural dynamics. Additional training on using QField during the data collection process was provided to the enumerators. Based on the context, the success or failure of the PGIS framework took into account the available transport-related data collected and the recruitment and training of the community members and youth mappers.

5.2. Process in the PGIS Framework

A vital aspect of the process was identifying the relevant attribute data for the rural Sub-Saharan mobility needs and barriers. For the success of this exercise, the research reviewed projects and reviewed papers on mobility subjects. Although not rich enough in Sub-Saharan Africa, the transport data on Open Street Maps (OSM) provided a list of critical attributes to consider during the data collection exercise. The data collected revealed the mobility barriers that were categorized into four, namely: (i) damaged infrastructure, (ii) open sewage, (iii) unmaintained paving and (iv) waterlogged areas. Furthermore, the road networks digitized vs. road networks available showed the level of data disparities in the Sub-Saharan region. These datasets are an asset to local governments and can be used in planning other development works beyond mobility. They can be helpful for the improvement of a non-existent dataset in the health sectors, educational institutions, etc. Based on this process, the success or failure of this PGIS framework proposed depended on the number of new road segments such as “paths” or “tracks” collected, new POIs and mobility needs uncovered, and transport barriers.

5.3. Content in the PGIS Framework

The content involved the validation of the dataset with community leaders, members, government representatives, enumerators and the technical team. The validation process ensured that the data collected and presented on a map represented the reality in the sub-locations of Lusheya, Khaunga and Mahola. The community representative highlighted any missing items in the collected list. The collected POIs, road networks, educational and health facilities, infrastructure obstacles, road incidents, crimes and misdemeanors, etc., were validated during the exercise. Furthermore, an evaluation of the multi-level findings was conducted based on the dataset validation. Based on the content, the success or failure of the PGIS framework considered the value of community engagement, data validation, and the evaluation of mobility needs and assessments.

5.4. Conclusions

Participatory GIS offers a revolutionary means for rural transport planning. Through a multi-level PGIS model, mobility needs and barriers in rural communities of Mumias East were highlighted. Using PGIS, rural communities are empowered to partake in decision making rightfully. Decision making has therefore shifted from “bottom-to-top” instead of from “top-to-bottom”. This multi-disciplinary project has sought to understand the current mobility needs and transport barriers in Sub-Saharan Africa. The research findings have revealed the existence of other road networks, infrastructure obstacles, and POIs used by rural communities that were previously not included on any existing platform. In addition, the datasets allow local governments to improve rural planning beyond mobility.
Then, based on the data-collection process, the research intends to build an open-source, participatory GIS toolkit capable of evaluating the accessibility, utilization and sustainability of mobility options in rural communities. The PGIS toolkit will be able to adapt existing mapping tools, assemble existing data from multiple sources, validate and enhance data through community participation, provide data back to the community and integrate with a global platform (OpenStreetMap) for wide dissemination. Implementing the PGIS framework has not only brought into the mainstream the long-hidden mobility needs and barriers but has also opened the way for a PGIS toolkit to give the rural community a tool to assist with proximity and the shortest route decisions based on the community transport modes and existing barriers. The PGIS framework has also brought to light, through computerized spatial analysis, an understanding of rural community’s mobility needs.

Supplementary Materials

The following supporting information can be downloaded at: https://www.mdpi.com/article/10.3390/su15129344/s1, Research license.

Author Contributions

Conceptualization, J.C. and J.-C.B.M.; methodology, J.-C.B.M.; software, U.P., P.T.H.d.R., A.K.M. and J.-C.B.M.; validation, J.C., P.T.H.d.R. and U.P.; formal analysis, J.-C.B.M. and A.K.M.; investigation, N.O.O., P.T.H.d.R., A.K.M. and J.-C.B.M.; resources, J.C.; data curation, U.P. and N.O.O.; writing—original draft preparation, J.-C.B.M.; writing—review and editing, J.C., U.P., N.O.O. and P.T.H.d.R.; visualization, J.-C.B.M. and A.K.M.; supervision, J.C.; project administration, P.T.H.d.R.; funding acquisition, J.C. All authors have read and agreed to the published version of the manuscript.

Funding

This research was funded by EPFL Tech4Impact, Vice Presidency for Innovation, grant number “591598 MAPSTECH4DEV”.

Institutional Review Board Statement

The study was conducted in accordance with the Declaration of Helsinki, and approved by the Institutional Review Board (or Ethics Committee) of Swiss Federal Institute of Technology Lausanne (protocol code HREC000179 and date of approval: 21 March 2022).

Informed Consent Statement

Informed consent was obtained from all subjects involved in the study.

Data Availability Statement

The data presented in this study are available on request from the corresponding author. The data are not publicly available due to privacy or ethical restrictions.

Acknowledgments

We acknowledge the administrative support of the Kakamega County Government. We also acknowledge the support of the local governments of Mumias East. We thank the Human Research Ethics Committee (HREC) of EPFL for ensuring that the research was conducted ethically and following Kenyan ethical standards (see Supplementary Materials). We also acknowledge the partners in this multidisciplinary research project: the World Bicycle Relief (WBR) by their representation, namely Alisha Myers, for the Kenyan field access for implementing the tool; the Nepal Flying Labs (NFL) by their representation, namely Uttam Pudasaini, for their contributions in building the PGIS toolkit.

Conflicts of Interest

The authors declare no conflict of interest.

References

  1. World Bank. Sustainable Mobility for All. Global Roadmap of Action toward Sustainable Mobility: Universal Rural Access; World Bank: Washington, DC, USA, 2019. [Google Scholar]
  2. Dennis, R. Transport and accessibility. In A Synthesis Paper, Employment Intensive Investment Branch; International Labour Office: Geneva, Switzerland, 1998. [Google Scholar]
  3. Barwell, I.J. Transport and the Village: Findings from African Village-Level Travel and Transport Surveys and Related Studies (English); World Bank Discussion Papers; No. WDP 344. Africa Region Series; World Bank: Washington, DC, USA, 1996; Available online: http://documents.worldbank.org/curated/en/846361468764127131/Transport-and-the-village-findings-from-African-village-level-travel-and-transport-surveys-and-related-studies (accessed on 20 April 2023).
  4. Ahern, A.; Hine, J. Rural transport—Valuing the mobility of older people. Res. Transp. Econ. 2012, 34, 27–34. [Google Scholar] [CrossRef]
  5. Wahba Tadros, S.N.; Wellenstein, A.; Das, M.B.; Palmarini, N.; D’Aoust, O.S.; Singh, G.; Restrepo Cadavid, P.; Goga, S.; Terraza, H.C.; Lakovits, C.; et al. Demographic Trends and Urbanization (English). World Bank Group: Washington, DC, USA. Available online: http://documents.worldbank.org/curated/en/260581617988607640/Demographic-Trends-and-Urbanization (accessed on 29 September 2022).
  6. Dasgupta, P.; Morton, J.F.; Dodman, D.; Karapinar, B.; Meza, F.; Rivera-Ferre, M.G.; Toure Sarr, A.; Vincent, K.E. Rural Areas. In Climate Change 2014: Impacts, Adaptation, and Vulnerability. Part A: Global and Sectoral Aspects. Contribution of Working Group II to the Fifth Assessment Report of the Intergovernmental Panel on Climate Change; Field, C.B., Barros, V.R., Dokken, D.J., Mach, K.J., Mastrandrea, M.D., Bilir, T.E., Chatterjee, M., Ebi, K.L., Estrada, Y.O., Genova, R.C., et al., Eds.; Cambridge Unviersity Press: Cambridge, UK; New York, NY, USA, 2014; pp. 613–657. [Google Scholar]
  7. Strohmeier, F. Barriers and their influence on the mobility behavior of elder pedestrians in urban areas: Challenges and best practice for walkability in the city of Vienna. Transp. Res. Procedia 2016, 14, 1134–1143. [Google Scholar] [CrossRef] [Green Version]
  8. Giuffrida, N.; Le Pira, M.; Inturri, G.; Ignaccolo, M. Mapping with Stakeholders: An Overview of Public Participatory GIS and VGI in Transport Decision-Making. ISPRS Int. J. Geo-Inf. 2019, 8, 198. [Google Scholar] [CrossRef] [Green Version]
  9. Sieber, R.E.; Pamela, J.; Robinson, P.J.; Peter, A.; Johnson, P.A.; Jon, M.; Corbett, J.M. Doing Public Participation on the Geospatial Web. Ann. Am. Assoc. Geogr. 2016, 106, 1030–1046. [Google Scholar] [CrossRef]
  10. Verplanke, J.; McCall, M.K.; Uberhuaga, C.; Rambaldi, G.; Haklay, M. A Shared Perspective for PGIS and VGI. Cartogr. J. 2016, 53, 308–317. [Google Scholar] [CrossRef] [Green Version]
  11. Pozzebon, M.; Rozas, S.T.; Delgado, N.A. Use and Consequences of Participatory GIS in a Mexican Municipality: Applying a Multilevel Framework; Revista de Administracao de Empresas: São Paulo, Brazil, 2015; Volume 55, pp. 290–303. [Google Scholar]
  12. Minang, P.A.; Mccall, M.K. Participatory GIS and local knowledge enhancement for community carbon forestry planning: An example from Cameroon. Particip. Learn. Action 2006, 54, 11. [Google Scholar]
  13. Brown, G.; Kyttä, M. Key issues and research priorities for public participation GIS (PPGIS): A synthesis based on empirical research. Appl. Geogr. 2014, 46, 122–136. [Google Scholar] [CrossRef]
  14. National Land Value Index. County Government of Kakamega. In County Annual Development Plan F/Y 2019/20; Ministry of Lands and Physical Planning: Kakamega, Kenya, 2020. [Google Scholar]
  15. Puri, S.K. Integrating scientific with indigenous knowledge: Constructing knowledge alliances for land management in India. MIS Q. 2007, 31, 355–379. [Google Scholar] [CrossRef] [Green Version]
  16. Rambaldi, G.; Kwaku Kyem, A.P.; Mbile, P.; McCall, M.; Weiner, D. Participatory spatial information management and communication in developing countries. Electron. J. Inf. Syst. Dev. Ctries. 2006, 25, 1–9. [Google Scholar] [CrossRef]
  17. Mcconchie, J.; McKinnon, J. Using GIS to produce community-based maps to promote collaborative natural resource management. ASEAN Biodivers. 2002, 2, 27–34. [Google Scholar]
  18. Weingart, P.; Joubert, M.; Connoway, K. Public engagement with science—Origins, motives and impact in academic literature and science policy. PLoS ONE 2021, 16, e0254201. [Google Scholar] [CrossRef]
  19. Dietz, T.; Stern, P. (Eds.) Public Participation in Environmental Assessment and Decision-Making; National Academies Press: Washington, DC, USA, 2008. [Google Scholar]
  20. Harris, T.M.; Weiner, D.; Warner, T.; Levin, R. Pursuing social goals through participatory GIS: Redressing South Africa’s historical political ecology. In Ground Truth: The Social Implications of Geographical Information Systems; Pickles, J., Ed.; Guilford: New York, NY, USA, 1995; pp. 196–222. [Google Scholar]
  21. Weiner, D.; Harris, T.M. Community-integrated GIS for Land Reform in South Africa. URISA J. 1995, 15, 61–73. [Google Scholar]
  22. Harris, T.; Weiner, D. Empowerment, Marginalization, and “Community-integrated” GIS. Cartogr. Geogr. Inf. Syst. 1998, 25, 67–76. [Google Scholar] [CrossRef]
  23. Hutchinson, C.F.; Toledano, J. Guidelines for demonstrating geographical information systems based on participatory development. Int. J. Geogr. Inf. Syst. 1993, 7, 453–461. [Google Scholar] [CrossRef]
  24. Corbett, J.; Keller, C. An analytical framework to examine empowerment associated with Participatory Geographic Information Systems (PGIS). Cartographica 2005, 40, 91–102. [Google Scholar] [CrossRef]
  25. Sieber, R. Public participation geographic information systems: A literature review and framework. Ann. Assoc. Am. Geogr. 2006, 96, 491–507. [Google Scholar] [CrossRef]
  26. Pozzebon, M.; Diniz, E.; Jayo, M. Adapting the structurationist view of technology for studies at the community societal levels. In Handbook of Research on Contemporary Theoretical Models in IS; Dwivedi, Y.D., Lal, B., Williams, M., Schneberger, S., Wade, M., Eds.; Information Science Reference: Hershey, PA, USA, 2009; pp. 18–33. [Google Scholar]
  27. Nair, S.; Kshirsager, M. Multi-Level participatory GIS for natural resource management: A review of contemporary research. J. Environ. Manag. 2017, 192, 163–178. [Google Scholar]
  28. Budhathoki, N.R.; Haynie, H.J.; Goodchild, M.F. The role of volunteered geographic information in participatory planning: A case study of participaotry GIS in Plano, Texas. URISA J. 2008, 20, 33–44. [Google Scholar]
  29. Chambers, R. Participatory GIS empowerment: Enabling community-based natural resource management. J. Environ. Manag. 2006, 78, 7–21. [Google Scholar]
  30. Pozzebon, M.; Diniz, E. Theorizing ICT and society in the Brazilian context: A multilevel, pluralistic and remixable framework. BAR-Braz. Adm. Rev. 2012, 9, 287–307. [Google Scholar] [CrossRef] [Green Version]
  31. Wilson, M.; Howcroft, D. Power, politics and persuation in IS evaluation: A focus on relevant social groups. J. Strateg. Inf. Syst. 2005, 14, 17–43. [Google Scholar] [CrossRef]
  32. Giddens, A.; Pierson, C. Conversations with Anthony Giddens; Polity Press: Cambridge, UK, 1989. [Google Scholar]
  33. Jones, M.R.; Karsten, H. Gidden’s structuration theory and information systems research. MIS Q. 2005, 32, 127–157. [Google Scholar] [CrossRef]
  34. Pettigrew, A.M. Contextualist research and the study of organizational change processes. In Research Methods in Information Systems; Mumford, E., Hirschheim, R., Fitzgerald, G., Wood-Harper, A., Eds.; North Holland: New York, NY, USA, 1985; pp. 53–72. [Google Scholar]
  35. De Souza, R.-M.; Clarke, J. Advancing Coastal Climate Resilience: Inclusive Data and Decision-Making for Small Island Communities. In Advancing Coastal Climate Resilience Chapter 11; Adaptation Actions—Hazards, Ecosystems, Sectors, Resilience; Elsevier: Amsterdam, The Netherlands, 2018. [Google Scholar] [CrossRef]
  36. Zolkafli, A.; Liu, Y.; Brown, G. Bridging the knowledge divide between public and experts using PGIS for land use planning in Malaysia. Appl. Geogr. 2017, 83, 107–117. [Google Scholar] [CrossRef]
  37. Fagerholm, N.; Torralba, M.; Moreno, G.; Girardello, M.; Herzog, F.; Aviron, S.; Burgess, P.; Crous-Duran, J.; Ferreiro-Domínguez, N.; Graves, A.; et al. Cross-site analysis of perceived ecosystem service benefits in multifunctional landscapes. Glob. Environ. Chang. 2019, 56, 134–147. [Google Scholar] [CrossRef] [Green Version]
  38. Kyem, P.A. Finding common ground in land use conflicts using PGIS: Lessons from Ghana. Particip. Learn. Action 2006, 54, 36–40. [Google Scholar]
  39. Kahila-Tani, M.; Kyttä, M.; Nummi, P. Crowdsourcing place-based memories. In Heritage is Ours—Citizens Participating in Decision Making; Halme, A.-M., Ed.; EuropaNostra: Helsinki, Finland, 2018; pp. 128–131. Available online: http://www.europanostra.fi/wp-content/uploads/2018/03/HeritageisOursBook9.3.pdf (accessed on 15 October 2020).
  40. Ramirez-Gomez, S.O.I.; Brown, G.; Fat, A.T.S. Participatory mapping with indigenous communities for conservation: Challenges and lessons from suriname. Electron. J. Inf. Syst. Dev. Ctries. 2013, 58, 1–22. [Google Scholar] [CrossRef] [Green Version]
  41. Samuelsson, K.; Giusti, M.; Peterson, G.D.; Legeby, A.; Brandt, S.A.; Barthel, S. Impact of environment on people’s everyday experiences in Stockholm. Landsc. Urban Plan. 2018, 171, 7–17. [Google Scholar] [CrossRef]
  42. Kajosaari, A.; Hasanzadeh, K.; Kyttä, M. Residential dissonance and walking for transport. J. Transp. Geogr. 2019, 74, 134–144. [Google Scholar] [CrossRef]
  43. Lechner, A.M.; Raymond, C.M.; Adams, V.M.; Polyakov, M.; Gordon, A.; Rhodes, J.R.; Mills, M.; Stein, A.; Ives, C.D.; Lefroy, E.C. Characterizing spatial uncertainty when integrating social data in conservation planning. Conserv. Biol. 2014, 28, 1497–1511. [Google Scholar] [CrossRef] [Green Version]
  44. Brown, G.; Kelly, M.; Whitall, D. Which “public”? Sampling effects in public participation GIS (PPGIS) and volunteered geographic information (VGI) systems for public lands management. J. Environ. Plan. Manag. 2014, 57, 190–214. [Google Scholar] [CrossRef]
  45. Brown, G.; Strickland-Munro, J.; Kobryn, H.; Moore, S.A. Mixed methods participatory GIS: An evaluation of the validity of qualitative and quantitative mapping methods. Appl. Geogr. 2017, 79, 153–166. [Google Scholar] [CrossRef]
  46. Jankowski, P.; Czepkiewicz, M.; Młodkowski, M.; Zwoliński, Z. Geo-questionnaire: A method and tool for public preference elicitation in land use planning. Trans. GIS 2016, 20, 903–924. [Google Scholar] [CrossRef]
  47. Rohrbach, B.; Anderson, S.; Laube, P. The effects of sample size on data quality in participatory mapping of past land use. Environ. Plan. B Plan. Des. 2016, 43, 681–697. [Google Scholar] [CrossRef]
  48. Cohen, B.; Vawdrey, D.K.; Liu, J.; Caplan, D.; Furuya, E.Y.; Mis, F.W.; Larson, E. Challenges Associated with Using Large Data Sets for Quality Assessment and Research in Clinical Settings. Policy Politics Nurs. Pract. 2015, 16, 117–124. [Google Scholar] [CrossRef]
  49. Ridzuan, F.; Zainon, W.M.N.W. A Review on Data Cleansing Methods for Big Data. The Fifth Information Systems International Conference 2019. Procedia Comput. Sci. 2019, 161, 731–738. [Google Scholar] [CrossRef]
  50. Rahm, E.; Do, H.H. Data Cleaning: Problems and Current Approaches. IEEE Bull. Technol. Comm. Data Eng. 2000, 23, 3–13. [Google Scholar]
  51. Blanchet, A.; Gotman, A. L’enquête et Ses Méthodes; L’entretien; Nathan: Paris, France, 1992. [Google Scholar]
  52. Patton, M.Q. Qualitative Evaluation and Research Methods; Sage Publications: Thousand Oaks, LA, USA, 2015. [Google Scholar]
  53. Bryceson, D.F.; Bradbury, A.; Bradbury, T. Roads to Poverty Reduction? Exploring Rural Roads’ Impact on Mobility in Africa and Asia. Dev. Policy Rev. 2008, 26, 459–482. [Google Scholar] [CrossRef]
  54. Wilson, S. Assessment of the Non-Motorized Transport Program in Kenya and Tanzania. Sub-Saharan Africa Transport Policy Program Saharan Africa Transport Policy Program Saharan Africa Transport Policy Program. In The World Bank and Economic Commission for Africa; SSATP Working Paper No. 71 Africa Region; World Bank: Washington, DC, USA, 2002. [Google Scholar]
Figure 1. Lusheya sub-locations, Lusheya location, Mumias East sub-county, Kakamega, Kenya.
Sustainability 15 09344 g001
Figure 2. ML-PGIS framework on rural transport needs and mobility barriers [8,11,35,36,37,38,39,40,41,42,43,44,45,46,47].
Sustainability 15 09344 g002
Figure 3. ML-PGIS data collection, analysis and validation process.
Sustainability 15 09344 g003
Figure 4. Before and after digitization of road networks and POI collected in Lusheya locations.
Sustainability 15 09344 g004
Figure 5. Before and after digitization of road networks and POI collected in Khaunga locations.
Sustainability 15 09344 g005
Figure 6. Damaged infrastructure barrier types and frequency.
Sustainability 15 09344 g006
Figure 7. Waterlogged barrier types and frequency.
Sustainability 15 09344 g007
Figure 8. Unmaintained paving barrier types and frequency.
Sustainability 15 09344 g008
Figure 9. Open sewage barrier types and frequency.
Sustainability 15 09344 g009
Figure 10. Mumias East sub-county attribute data collected and aggregated into a map.
Sustainability 15 09344 g010
Figure 11. The PGIS framework application on mobility needs in Mumias East as a case study.
Sustainability 15 09344 g011
Table 1. Attribute data and categories collected in Mumias East.
AttributeCategoriesDescription of Data Collected
Mobility barriersDamaged infrastructure, waterlogged area, excessive traffic, open sewage, improper parking, unmaintained paving, unmanaged street vendorsRoad networks, infrastructure barriers that could impede its accessibility.
Road IncidentsRoad crash, animal attack, physical attackEnsuring that the area collected or the POI did not have a road incidents history that could impede its accessibility.
Crime or Wrong doingsHarassments, theft, physical aggressions, substance abuseEnsuring that the area collected or the POI did not have a crimes or wrongdoings history that could impede its accessibility.
EducationSchool, college/TVET, university, kindergartenLocation of the education facilities, its capacity, its accessibility by public transport, by bicycle, by car, and its population base.
HealthPharmacy, clinic, health Center, hospitalLocation of the health facilities, its capacity, its accessibility by public transport, by bicycle, by car, and its population base.
GovernmentChief office, assistant to the chief, other government officeThe chief and the government offices assisted by granting the team the authorization to conduct research and by providing secondary data and village leaders contacts as well as community members for training and data collection.
Points of InterestReligious sites, local business, public spaces, security forces, hotels, lodges and restaurants, industries and factories, tourist sites, recreational centers, public toilets, fuel stations, transport utility shop, bicycle shop/repair, bank, money transfer, posho-millsLocations that communities may find useful or interesting.
Street profileStreet profile, administrative border line, otherStreet landmarks serving as a reference for road users and other community members.
Local ResourceWaterThe research covered all sources of freshwater for human consumption, from boreholes to controlled water stream.
Road NetworkPrimary, residential, (primary link), secondary, service, unclassified, track, footway, pathThe road link between two communities (streets, villages, sub-locations, locations, wards, sub-county, etc.)
WaterwaysRivers, streamsLinear water features, often used as border line (between two villages, sub-locations, locations, wards, sub-county or county) water sources for animals and farmers.
Table 2. L1 data type (layer) and sources for Mumias East sub-county.
SNData TypeSource 1Source 2Source 3
1Health FacilitiesOSMLocal Municipal Geodatabaseprimary survey using Qfield
2Education Facilities OSMLocal Municipal Geodatabaseprimary survey using Qfield
3Local BoundariesOSMLocal Municipal Geodatabaseprimary survey using Qfield
4Points of Interest (POI)OSMLocal Municipal Geodatabaseprimary survey using Qfield
5Road NetworksOSMLocal Municipal Geodatabaseprimary survey using Qfield
6Crime or Wrongdoings Local Municipal Geodatabaseprimary survey using Qfield
7Road Incidents Local Municipal Geodatabaseprimary survey using Qfield
8Street profile Local Municipal Geodatabaseprimary survey using Qfield
9Local ResourceOSMLocal Municipal Geodatabaseprimary survey using Qfield
10WaterwaysOSMLocal Municipal Geodatabaseprimary survey using Qfield
Table 3. Evaluation of mobility impacts on community movement.
AttributesContextProcessContent
Mobility barriersKenya Rural Roads Authority, Ministry of Roads and Transport and local governmentsMostly permanent and represented only 4% of the digitized roads.Most digitized roads with barriers were practical by foot and bicycles in Lusheya sub-locations. Damaged infrastructures and waterlogged areas have the highest barrier causes.
Road IncidentsKakamega Traffic Police Department, local authorities and road users.Mostly caused by poor infrastructure, often from heavy rain.Road crashes are the most occurring road incidents, particularly in Mahola.
Crime or WrongdoingsKakamega Police Department, local authorities and road users.Theft in private property is the most common crime in Lusheya, followed by substance abuse and harassment.Populated areas are the most exposed to thefts. Substance abuse and harassment also make it unsafe for road users, especially at night.
EducationKakamega, Mumias East Department of Education and local authorities Most education facilities are public. Not much available for reduced mobility students. School catchment area is about a 6 km radius. Students’ daily travels amount between 450 and 1250 per school (mostly by foot) on paths and tracks.
HeathKakamega, Mumias East Department of Health and local authorities Most health facilities are public. Most health centers and clinics are run by experienced nurses. Most health facilities have limited emergency services, out-of-hours services or even ICUs.Health catchment facilities are about 3000 to 15,000 populations mostly during day time. Patients often use bicycles or motorcycles for critical cases. Foot travel is generally the standard transport mode.
GovernmentLocal authorities, government buildings and chiefdom in Kakamega.Most government offices data were collected in Khaunga.Shianda is the administrative center for government offices as well as commercial activities in Khaunga location.
Points of InterestLocal authorities and participantsMost points of interest include local businesses and religious sites. Lusheya had the most points of interest.Churches, shops, porsho mills and brick-laying businesses are the most common points of interest in the three sub-locations visited in Mumias East.
Local ResourceLocal authorities and participants Most local resources in Mumias East are boreholes and springs. Paths and tracks mainly connect residents and farms to rivers and streams. Transport modes include foot, bicycle, and animals in remote places.The location of boreholes (commonly shared with the community), springs, rivers and water points impact mobility.
Road NetworkOSM, Ministry of Roads and Transport, enumerators, local authorities and participantsMost road networks collected are residential, tracks and paths. Mahola has the most road networks digitized, with residential and tracks being the two highest. Khaunga has the highest amount of paths.Most road networks are accessible to at least one transportation mode.
WaterwaysLocal authorities and participants Most waterways are rivers and streams. Rivers and streams are often crossed by bridges on paths and tracks connecting one point to another. Both a cause (livestock, agriculture and plants) and a barrier (missing bridges) to mobility. Infrastructure damage is another consequence.
Disclaimer/Publisher’s Note: The statements, opinions and data contained in all publications are solely those of the individual author(s) and contributor(s) and not of MDPI and/or the editor(s). MDPI and/or the editor(s) disclaim responsibility for any injury to people or property resulting from any ideas, methods, instructions or products referred to in the content.

