Article

Explore the Complex Interaction between Green Investment and Green Ecology: Evaluation from Spatial Econometric Models and China’s Provincial Panel Data

1
School of Management Science and Engineering, Nanjing University of Information Science and Technology, Nanjing 210044, China
2
Binjiang College, Nanjing University of Information Science and Technology, Wuxi 272135, China
*
Author to whom correspondence should be addressed.
Sustainability 2023, 15(12), 9313; https://doi.org/10.3390/su15129313
Submission received: 20 March 2023 / Revised: 28 May 2023 / Accepted: 31 May 2023 / Published: 8 June 2023
(This article belongs to the Section Economic and Business Aspects of Sustainability)

Abstract

:
From the economic perspective, China has made remarkable progress, yet environmental concerns represent an alarm to the country’s long-term prosperity. The associated relationship between green investment and the green economy has important implications for the environment. Whether there is an interactive relationship between green investment and green ecology, current views seem to be at odds with each other. This paper employs a panel vector autoregressive model to construct an empirical analysis of China’s provincial panel data from 2005 to 2019. Specifically, generalized moment estimation, impulse response function, variance decomposition, and other measurement methods were applied to study the interaction between green investment and green ecological development. The research results show the following: (1) the inertial development of the green investment system seriously restricts the progress of green investment levels, and the long-term development of green ecology has a significant self-reinforcing trend; (2) the two-way interaction between green investment and green ecology shows a positive spillover effect in the short term, but the positive effect gradually weakens in the long run; (3) the impact of green ecology on green investment is most significant in the interactive relationship, and the positive effect of green ecology on green investment in the western region is the most prominent. Therefore, the government should standardize green investment standards and use policy guidance to promote the regional transfer of green investment and green ecological resources. Financial institutions should appropriately lower the financing threshold for polluting enterprises and municipal construction and leverage more social funds to flow into long-term green technologies and green industries. Companies should raise awareness of environmental disclosure, ban outdated production capacity, and transition to cleaner production models to secure green funding.

1. Introduction

In recent years, the world economy has continued to grow, but extensive production methods and harsh environmental conditions have emerged at the same time [1]. More than 4 billion tons of solid waste are generated every year [2], and China’s solid waste fluctuates and rises [3]. The Lancet Commission on Pollution and Health reported that pollution was responsible for 9 million premature deaths every year from 2015 to 2019, corresponding to one in six deaths worldwide. Little real progress against pollution can be identified overall, particularly in low-income and middle-income countries, where pollution is the most severe. [4]. For instance, China’s death toll ranks second in the world [5]. Despite the unwavering commitments of the international community in the form of the Kyoto Protocol in 1997, the Paris Climate Change Agreement in 2015, and the 2030 Agenda for Sustainable Development, green ecology targets remain far from realization [6]. Therefore, to achieve sustainable economic, social, and environmental development, advocating green ecological development has gradually become a hot issue [7]. China’s 14th Five-Year Plan and Goals released in March 2021 set green ecology as a major economic and social development indicator. Green ecology is a national economic and social development goal integrating ecological civilization and its realization methods [8]. To achieve the goal of green ecology, we must integrate green economy (GE), green welfare (GW), and resources and environment (RE).
However, both the short-term rapid restoration of green ecology and the sustainable long-term improvement require the green financial system as an engine to provide power. As an important model of the green financial system [9], green investment is widely involved in the fields of emerging energy [10], promoting economic colocalization [11], and social welfare [12], providing an economic foundation for the realization of green ecology. Moreover, green investment in China remains static or develops at a constant rate, which is unchangeable inertia [13,14]. Inertia thinking is a natural complement to theories of external influence, such as ecological responsiveness, demand-side research, and stakeholder theory [15]. How does green investment affect green ecological development? Can green ecological development break through the inertia of existing green investment policies and improve the level of green investment? Some scholars are optimistic about these issues [10,13], but some scholars believe that there is a negative impact mechanism between green investment and green ecology [14]. In addition, there are still gaps in quantitative research on the interaction between green investment and green ecology. In the critical period of China’s in-depth promotion of green development and green financial development strategies, clarifying such an interaction mechanism will have practical significance. Therefore, we try to systematically explore the interaction between green investment and green ecological development and provide ideas for the coordinated development of green investment and green ecology.
As governments around the world increasingly prioritize green development, new experiences and data on green investments and green environments are continuously accumulating. Currently, research on green ecology and green investments has yet to focus on the relationship between the two, and new analysis models have yet to be introduced. This paper fills the gap in research on green development in the following aspects. On the one hand, it is found that the inertial development of China’s green investment seriously restricts the progress of green investment. It reflects the emergence of green investment policies that are not suitable for the long-term development of China’s green investment system. On the other hand, it is found that the impact of green ecology on green investment is greater than that of green investment on green ecology and found that the positive spillover effect of green ecology on green investment in the western region is the most obvious, reflecting significant regional heterogeneity. Furthermore, a comprehensive index is formed by combining various factors of the green ecosystem. In comparison to the existing academic discourse, this paper comprehensively reflects the interactive mechanism between green investment and green ecology.
The arrangement of this study is as follows. Section 2 summarizes the existing literature and refines the research content. Section 3 clarifies the construction of indicators, research models, and data sources. Section 4 carries out empirical analysis and mathematical analysis of regression results. In Section 5, the empirical analysis results are discussed. Section 6 summarizes the conclusions of this article and provides relevant policy recommendations based on the results of the discussion.

2. Literature Review

Although green investment and green ecology are both important topics in academic research, few studies have examined both green investment and green ecology at the same time, especially the interactive mechanism between them. To that end, this paper expounds on the research status of green investment and green ecology from two aspects of green investment promotes green ecological development and green ecological development attracts green investment.

2.1. Green Investment Promotes Green Ecological Development

Regarding green investment, some scholars creatively interpret it as “investment in environmental protection”. Academic circles have different views on the mechanism of economic development in the RE, GE, and GW under green ecology. As far as the resources and environment are concerned, Shen et al. [16] found that green investment is negatively related to carbon emissions, so there is an urgent need to strengthen the national natural tax law. Li et al. [10] also believed that green investment can reduce short-term and long-term carbon emissions and that carbon emissions from green investment in different sectors are significantly different. These results suggest that fiscal decentralization improves environmental sustainability through green investment and a renewable energy transition [17]. However, some scholars have also found that the coupling effect of financial support on the ecological environment is not obvious or even has a negative effect. With the increasing inadaptability among the three subsystems of finance, innovation, and ecological efficiency, the contradictions in the process of sustainable economic development of some cities are also increasing [18].
In terms of GE, Ekeh, Wara, and Orovwode [11] indicated that green finance is effective for economic greening and low-carbon development. Labatt [19] indicated that green finance provides the foundation for the development of the GE and provides the possibility for sustainable development; Wang and Wang [20] argued that green finance has different effects on inclusive economic growth in different regions and has a great impact on the central and western regions.
In terms of green welfare, John and Anderson [21] both agreed that finance has a supporting role in real estate and infrastructure construction. Leung et al. [12] also believed that the rent subsidy policy had a significant effect on improving the living conditions of families. However, some scholars have objections. Vernon et al. [22] examined the impact of financial support on urban and found that investment in infrastructure has no impact on urbanization. GE, GW, and RE construct a green ecological system, so this paper preliminarily judges that green investment has a positive impact on green ecology.

2.2. Green Ecological Development Attracts Green Investment

As an important development method of social progress, green ecology also has a certain effect on the efficiency of green investment, but the existing literature mainly focuses on the impact of environmental regulations on economic growth. Leiter et al. [23], Testa [24], and Zhu [13] stated that the government’s management of enterprises such as environmental control, financial subsidies, and collection of pollution charges can significantly optimize the production methods of enterprises, which will strengthen the level of green investment of enterprises. Sun et al. [14] also found that market-incentive environmental regulations have significantly inhibited high-quality economic growth.
In summary, academic circles have different views on the impact mechanism of green investment and green ecology. Scholars, including Shen et al. [16], Ekeh, Wara, and Orovwode [11], Ebru et al. [25], Zhu [13], and others, argued that there is a positive spillover effect between green ecology and green investment efficiency. The results of the EU and the USA experience that the most effective way to attract additional financing to the green goals implementation is to develop and activate the green investment market [26]. The concept of green ecology has attracted increasing attention, and governments have played an important role in encouraging enterprises to make green investments [27]. However, Vernon et al. [22] and Gray and Shadbegian [28] considered that the role of green investment and green ecology was not clearly noticeable or even negative. The above studies have the following shortcomings. First of all, for econometrics, most authors have adopted only one specific indicator to represent the level of green ecological development, ignoring other factors of the green ecosystem. Secondly, the mechanism of green investment is mostly initiated from the perspective of corporate environmental regulation. Moreover, the existing academic discussions have mainly focused on the one-way impact of green investment and green ecological development, which cannot fully reflect the interaction mechanism between the two.
Therefore, this research selects the general indicators of green investment and green ecosystems in 30 provinces in China and employs the projection pursuit method to obtain green investment and green ecological scores to eliminate the influence of subjective factors. In addition, an autoregressive panel vector model was constructed to study the interaction between China’s green investment and green ecological development from 2005 to 2019 for the first time. Specifically, this study uses generalized moment estimation, impulse response function, and variance prediction decomposition methods to deeply explore the dynamic relationship, influence mechanism, and regional heterogeneity of the two. Finally, this research also compares the research conclusions with current academic viewpoints and provides theoretical ideas for the virtuous development of green investment and green ecology in China.

3. Research Model and Index Construction
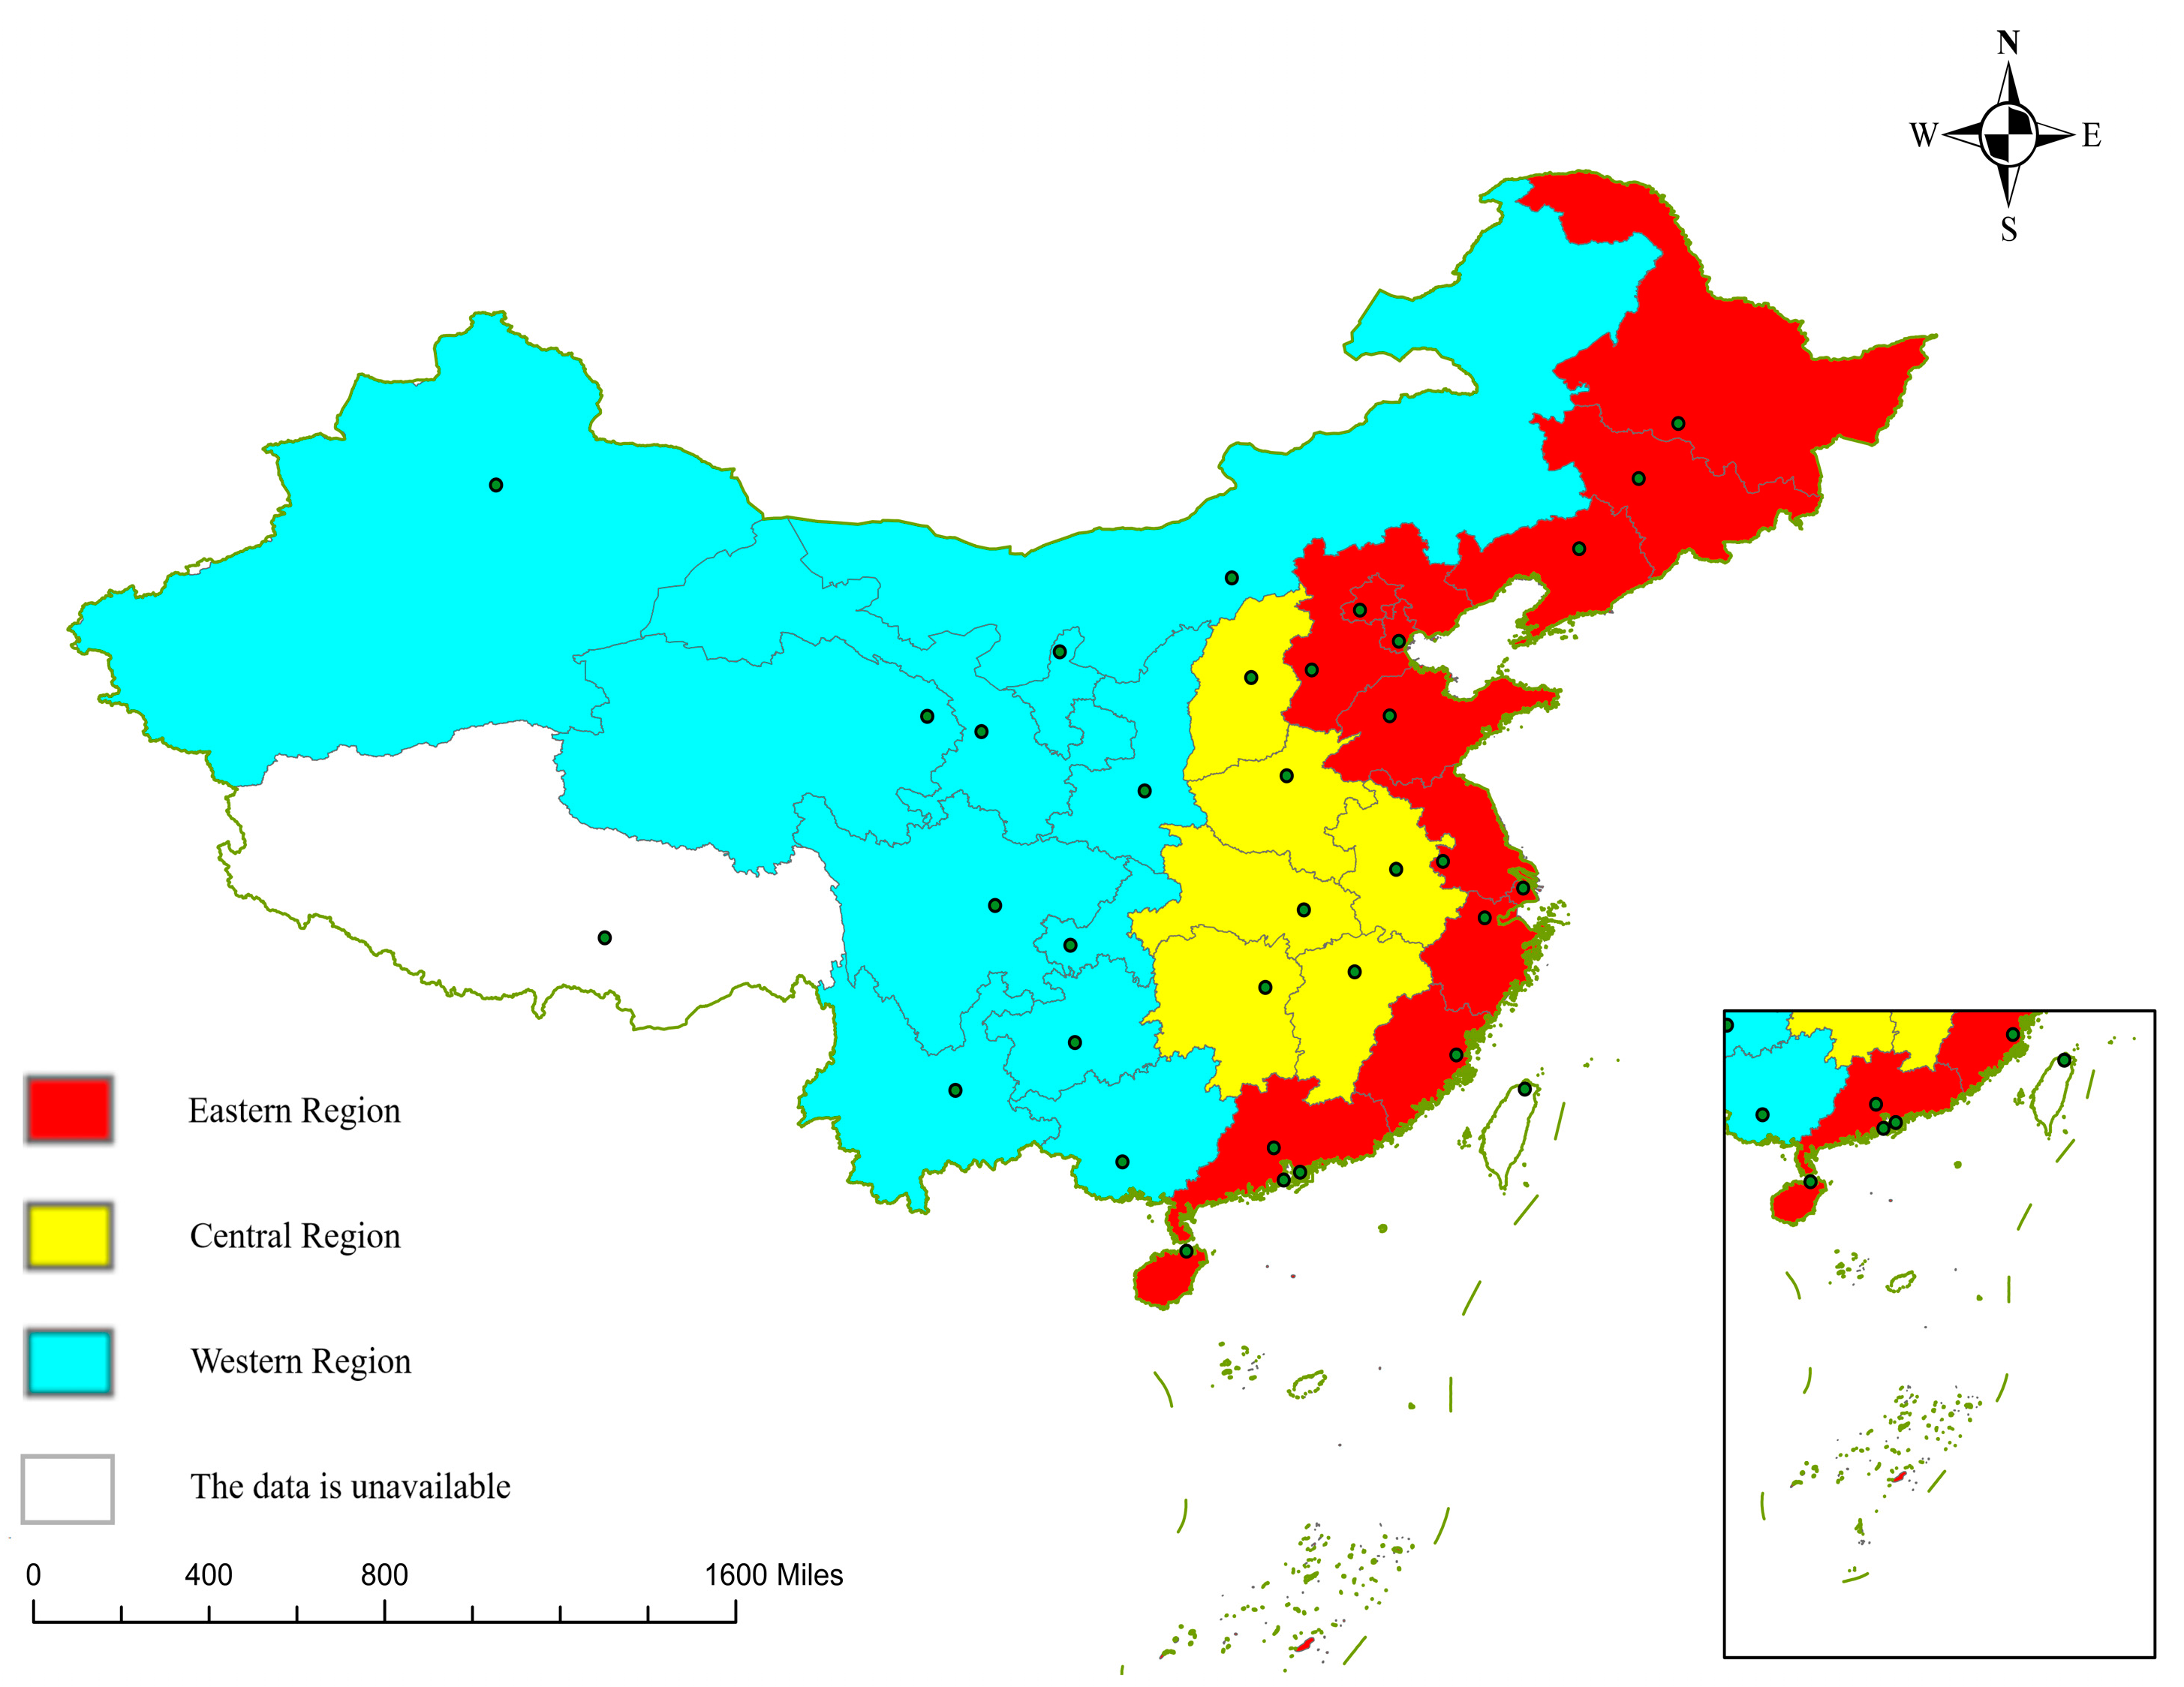
3.1. Study Area

China is located in the eastern part of the Eurasian continent and on the west coast of the Pacific Ocean. Except for Tibet, Hong Kong, Macau, and Taiwan, where data is incomplete or unavailable, the study area has 30 provinces (Figure 1). As the world’s largest developing country, China has different green investments in various provinces and different green ecological development policies. It has significant spatial differentiation and typical characteristics of the combination of green investment and green ecology in developing countries.
The data comes from the 2005–2019 ‘China Environmental Statistical Yearbook’, ‘China Water Conservancy Yearbook’, ‘China Forestry Yearbook’, and provincial statistical yearbooks. The selected index data are both scientific and readily available. The vector map of China used to visualize the conclusion is derived after scanning the administrative boundaries of the region, and individual missing values are filled in with linear regression interpolation.

3.2. Model Construction

The traditional value at risk (VAR) model is limited by the form of data and the amount of data. When the period of the research data is short, the accuracy of the results may be affected. To reduce the stringent requirements of the VAR model on the amount of sample data, Holtz et al. [29] deepened the research conclusions of Chamberlain [30], introduced cross-sectional data to expand the amount of sample data, and constructed a panel vector autoregressive model (PVAR) for the first time. Scholars of Pesaran et al., Canova et al. [31], and Love et al. [32] successively improved the model, making the panel vector autoregressive model (PVAR) more widely used. Therefore, this study establishes a PVAR model based on the research results of the above-mentioned scholars to study the response relationship and influence mechanism of China’s green investment and green ecology.
Y it = β 0 + j = 1 k β j Y i t j + η i + φ t + ε i t
where i represents the provinces in China, t denotes the year, k stands for the lag order corresponding to the variable, Y i t j is the explanatory variable of lag j in year t in i provinces, and β j is the regression coefficient. Here, the intercept term vector is given, η i and φ t are the individual effect and time effect vector, respectively, and ε i t is the random disturbance term.

3.3. Indicator Construction and Variable Selection

3.3.1. Construction of Green Investment and Green Ecological Development Index System

As an important part of the green financial system, green investment is a sustainable development investment that promotes the harmonious coexistence of the economy, society, and ecology. This article draws on the indicator system of Wu et al. [33] to construct a green investment indicator system from three aspects: investment in environmental pollution control, water conservancy construction investment, and forestry investment. Green ecological construction is a complex project, and it involves factors such as economy, resources, population, and environment. This article draws on the indicator system of Cheng et al. [34], Peng et al. [35], and Fei, Cui, and Qin [36] from the three aspects of green economy, green welfare, and RE construct a green ecological index system. Among them, the GE includes three levels: economic growth, ecological economy, and output level. Green welfare includes two aspects: living standards and public services. RE includes three aspects: environmental consumption, environmental pressure, and ecological quality (Table 1). The indicator attribute indicates that the indicator is a positive”+” (negative ”−”) indicator for the set measurement, with larger (smaller) values indicating better results.

3.3.2. Variable Selection and Processing

(1) Green Ecology
Because the measurement of the GE, GW, and RE in the green ecosystem involves the process of a multi-factor comprehensive evaluation, to avoid evaluation errors caused by human subjective factors, this article refers to the research of Huber [37] and Tang et al. [38] and adopts the projection pursuit evaluation model (PPM). The model can scientifically process nonlinear, non-normal, and high-dimensional data through the projection optimization function so that high-dimensional data can be converted into low-dimensional data. It further simulates and analyzes the projection vectors of high-dimensional data structures or features in low-dimensional space, thus solving complex multi-dimensional and comprehensive data problems. Specific calculation steps are as follows:
① Data standardization processing. The set of regional indicators is x * ( i , j ) i = 1.2 , , m , j = 1 , 2 , , q , where x * ( i , j ) is the j -th indicator of the region i , and m and q are the number of regions and the number of indicators, respectively. Below, x ( i , j ) is the normalized value of the index, and x min ( j ) and x max ( j ) , respectively, represent the minimum and maximum values of the j -th index as follows:
Positive   index :   x ( i , j ) = x * ( i , j ) x min ( j ) x max ( i , j ) x min ( j )
Negative   index :   x ( i , j ) = x max ( i , j ) x * ( j ) x max ( i , j ) x min ( j )
② The construction of the projection objective function. Let n = n ( 1 ) , n ( 2 ) , n ( q ) be the projection direction vector, and the one-dimensional projection value of the area i in this direction is as follows:
Z ( i ) = j = 1 q n ( j ) x ( i , j ) , i = 1.2 , , m
The projection objective function expression is as follows:
Q ( m ) = S z D z
In Formulas (6) and (7), S z is the standard deviation of Z ( i ) ; D z is the local density of Z ( i ) . The formula is expressed as follows:
S z = i = 1 m ( Z ( i ) E ( z ) ) 2 / m 1
D z = i = 1 m j = 1 m ( R r ( i , s ) ) f ( R r ( i , s ) )
E ( z ) is the average value of the sequence; R is the window radius of the local density D z ; r ( i , s ) represents the distance between regions i and s , which is equal to the absolute value of the subtraction of the projection values of the two regions; f ( R r ( i , s ) ) is the unit order jump function. When R r ( i , s ) is the function value is 1; otherwise, the function value is 0.
③ Optimization of the projection objective function. Using an accelerated genetic algorithm to optimize the maximum value, the constraint formula is expressed as follows:
i = 1 q n 2 ( j ) = 1
④ Calculate the projection value. Multiply the best projection direction n * by the normalized index value x ( i , j ) , and add up to get the projection value X ( i ) , which is the evaluation of GE, GW, and RE in the green ecosystem Score. The larger the projection value, the higher the score.
X ( i ) = j = 1 q n * x ( i , j )
(2) Green Investment
To unify the data format and to avoid the influence of subjective factors on variables, this paper draws on the research ideas of Tang et al. [38] and adopts the projection pursuit model to obtain green investment (GI) scores via environmental pollution control investment, water conservancy construction investment, and forestry investment data.

4. Empirical Analysis

The VAR model has strict data length requirements, while the PVAR model has relatively loose requirements, so the PVAR model is more suitable for exploring the relationship between green investment and green ecology, which makes the empirical results more scientific and effective [39]. The PVAR model is analyzed through the process of stationarity and cointegration testing, selection of optimal lag order, generalized moment estimation (GMM), impulse response analysis (IRF), and variance decomposition.

4.1. Unit Root Test and Cointegration Test

As panel data may have a certain heteroscedasticity problem, the GE, GW, RE, and green investment indicators in the green ecology are first processed in logarithm. At the same time, considering the possibility of pseudo-regression in the regression process, LLC and IPS unit root test methods are adopted to test the stationarity of panel data. Among them, lnGE means GE index, lnGW means GW index, lnRE means resource environment index, and lnRE means green investment index. The test results reveal (Table 2) that lnGE, lnGW, lnRE, and lnRE all reject the hypothesis of non-stationary variables in the LLC test. However, most of them cannot reject the original hypothesis of IPS, which means that the original variable sequence cannot pass the stationarity test of IPS. Therefore, this article performs first-order differential processing (dlnGE, dlnGW, dlnRE, and dlnRE) on the original variable sequence. The results show that the variable series after the first-order differential processing has passed the stationarity test, indicating that the first-order single integer series can participate in the subsequent panel vector autoregressive process.
To examine whether there is a long-term equilibrium relationship between variables, a co-integration test is further conducted. Because the research variables are of the same order and the number of variables is 4, the Kao test, Westerlund test, and Pedroni test are used. As seen in the test results (Table 3), the statistical values of the three test methods are all significant at the level of 1%. Obviously, tests reject the null hypothesis. Therefore, there is a stable and balanced relationship between green investment and green ecology.

4.2. Selection of the Optimal Lag Period for the PVAR Model

Given the lag between the effects of variables, it is necessary to establish the optimal lag order before developing the regression model. If the lag order is too small, it may cause a serious loss of research data; if the lag order is too large, the regression results will lack reliability. According to the PVAR model principle, Akaike Information Criterion (AIC), Bayes Information Criterion (BIC), and Hannan–Queen Information Criterion (HQIC) are adopted to select the optimal lag order. To select the optimal lag order of the variable and, at the same time, facilitate comparison between regions, the lag order of each region should also be as consistent as possible. From the test results (Table 4), the optimal lag order of the sample variables in the national, central, and western regions are all set to 3, but the optimal lag order in the eastern region is a second-order lag. Considering that the statistical values of the second-order lag and the third-order lag in the eastern region are relatively close, this paper sets the optimal lag order in the eastern region as the third-order lag.

4.3. Basic Regression of PVAR Model

Based on the selection results of the unit root test, cointegration test, and optimal lag order, this research takes the green investment index, GE, GW, and resource environment index, as endogenous variables of the PVAR model and uses the GMM method to obtain regression parameters. As seen in the test results (Table 5 and Table 6), when the explained variable is the GE, the regression coefficient of the three-phase GE on itself is 0.273, which is significant at the level of 1% statistical value. From a regional perspective, the regression coefficients for the second and third stages of the lagging GE in the eastern region are 0.149 and 0.197, respectively, and both have passed the 5% significance test. The three-phase lagging GE in the western region has an impact of 0.301 on itself and has passed the 1% level of a significance test. This means that the development of China’s GE is more dependent on itself.
When the explained variable is GW, the regression coefficient of the three GW lags on itself is 0.104, and it has passed the 1% significance test. From a regional perspective, the regression coefficients of the second and third phases of the GE in the eastern region on GW are 0.244 and 0.209, respectively, and they have passed the significance tests of 5% and 10%, respectively. The impact of the delayed second phase of green investment on the development of GW is 0.027, which is significant at the 1% statistical level. The regression coefficient for second-period lagging GW in the central region is 0.203, and it passed the 5% significance test. This means that China’s GW also has obvious self-reliance, but the influencing factors in the eastern region are more diverse.
When the explanatory variable is the RE, the regression coefficient of the second-stage resource environment on its own is −0.307, which has a significant negative characteristic. At the regional level, the RE of the eastern region lags behind the first stage and the second stage also has a significant negative relationship with its development. However, the impact of the lagging three-phase green investment on resources and the environment is 0.009, and it passed the 5% significance test. This indicates that the inertia of RE has significantly inhibited the development of China’s RE. From the perspective of time, since the environmental effect is caused by RE having a time lag, RE has an inertia effect. If the index of current RE is high, then the RE of next year is likely to be high.
When the explained variable is a green investment, the regression coefficient of one-period green investment lag on itself is −0.311, and it passes the 1% significance test. At the regional level, the regression coefficients of lagging green investment in the eastern and western regions are −0.329 and −0.310, respectively, which are also significant at the statistic level of 1%. In addition, the lagging second-stage GE has a significant positive effect on green investment in the eastern region. The lagging GE in the first phase and the lagging GW in the second and third phases have a significant positive effect on green investment in the central region. The three-phase lag in GW has a significant positive effect on green investment in the western region. Overall, the development of green ecology can attract green investment.

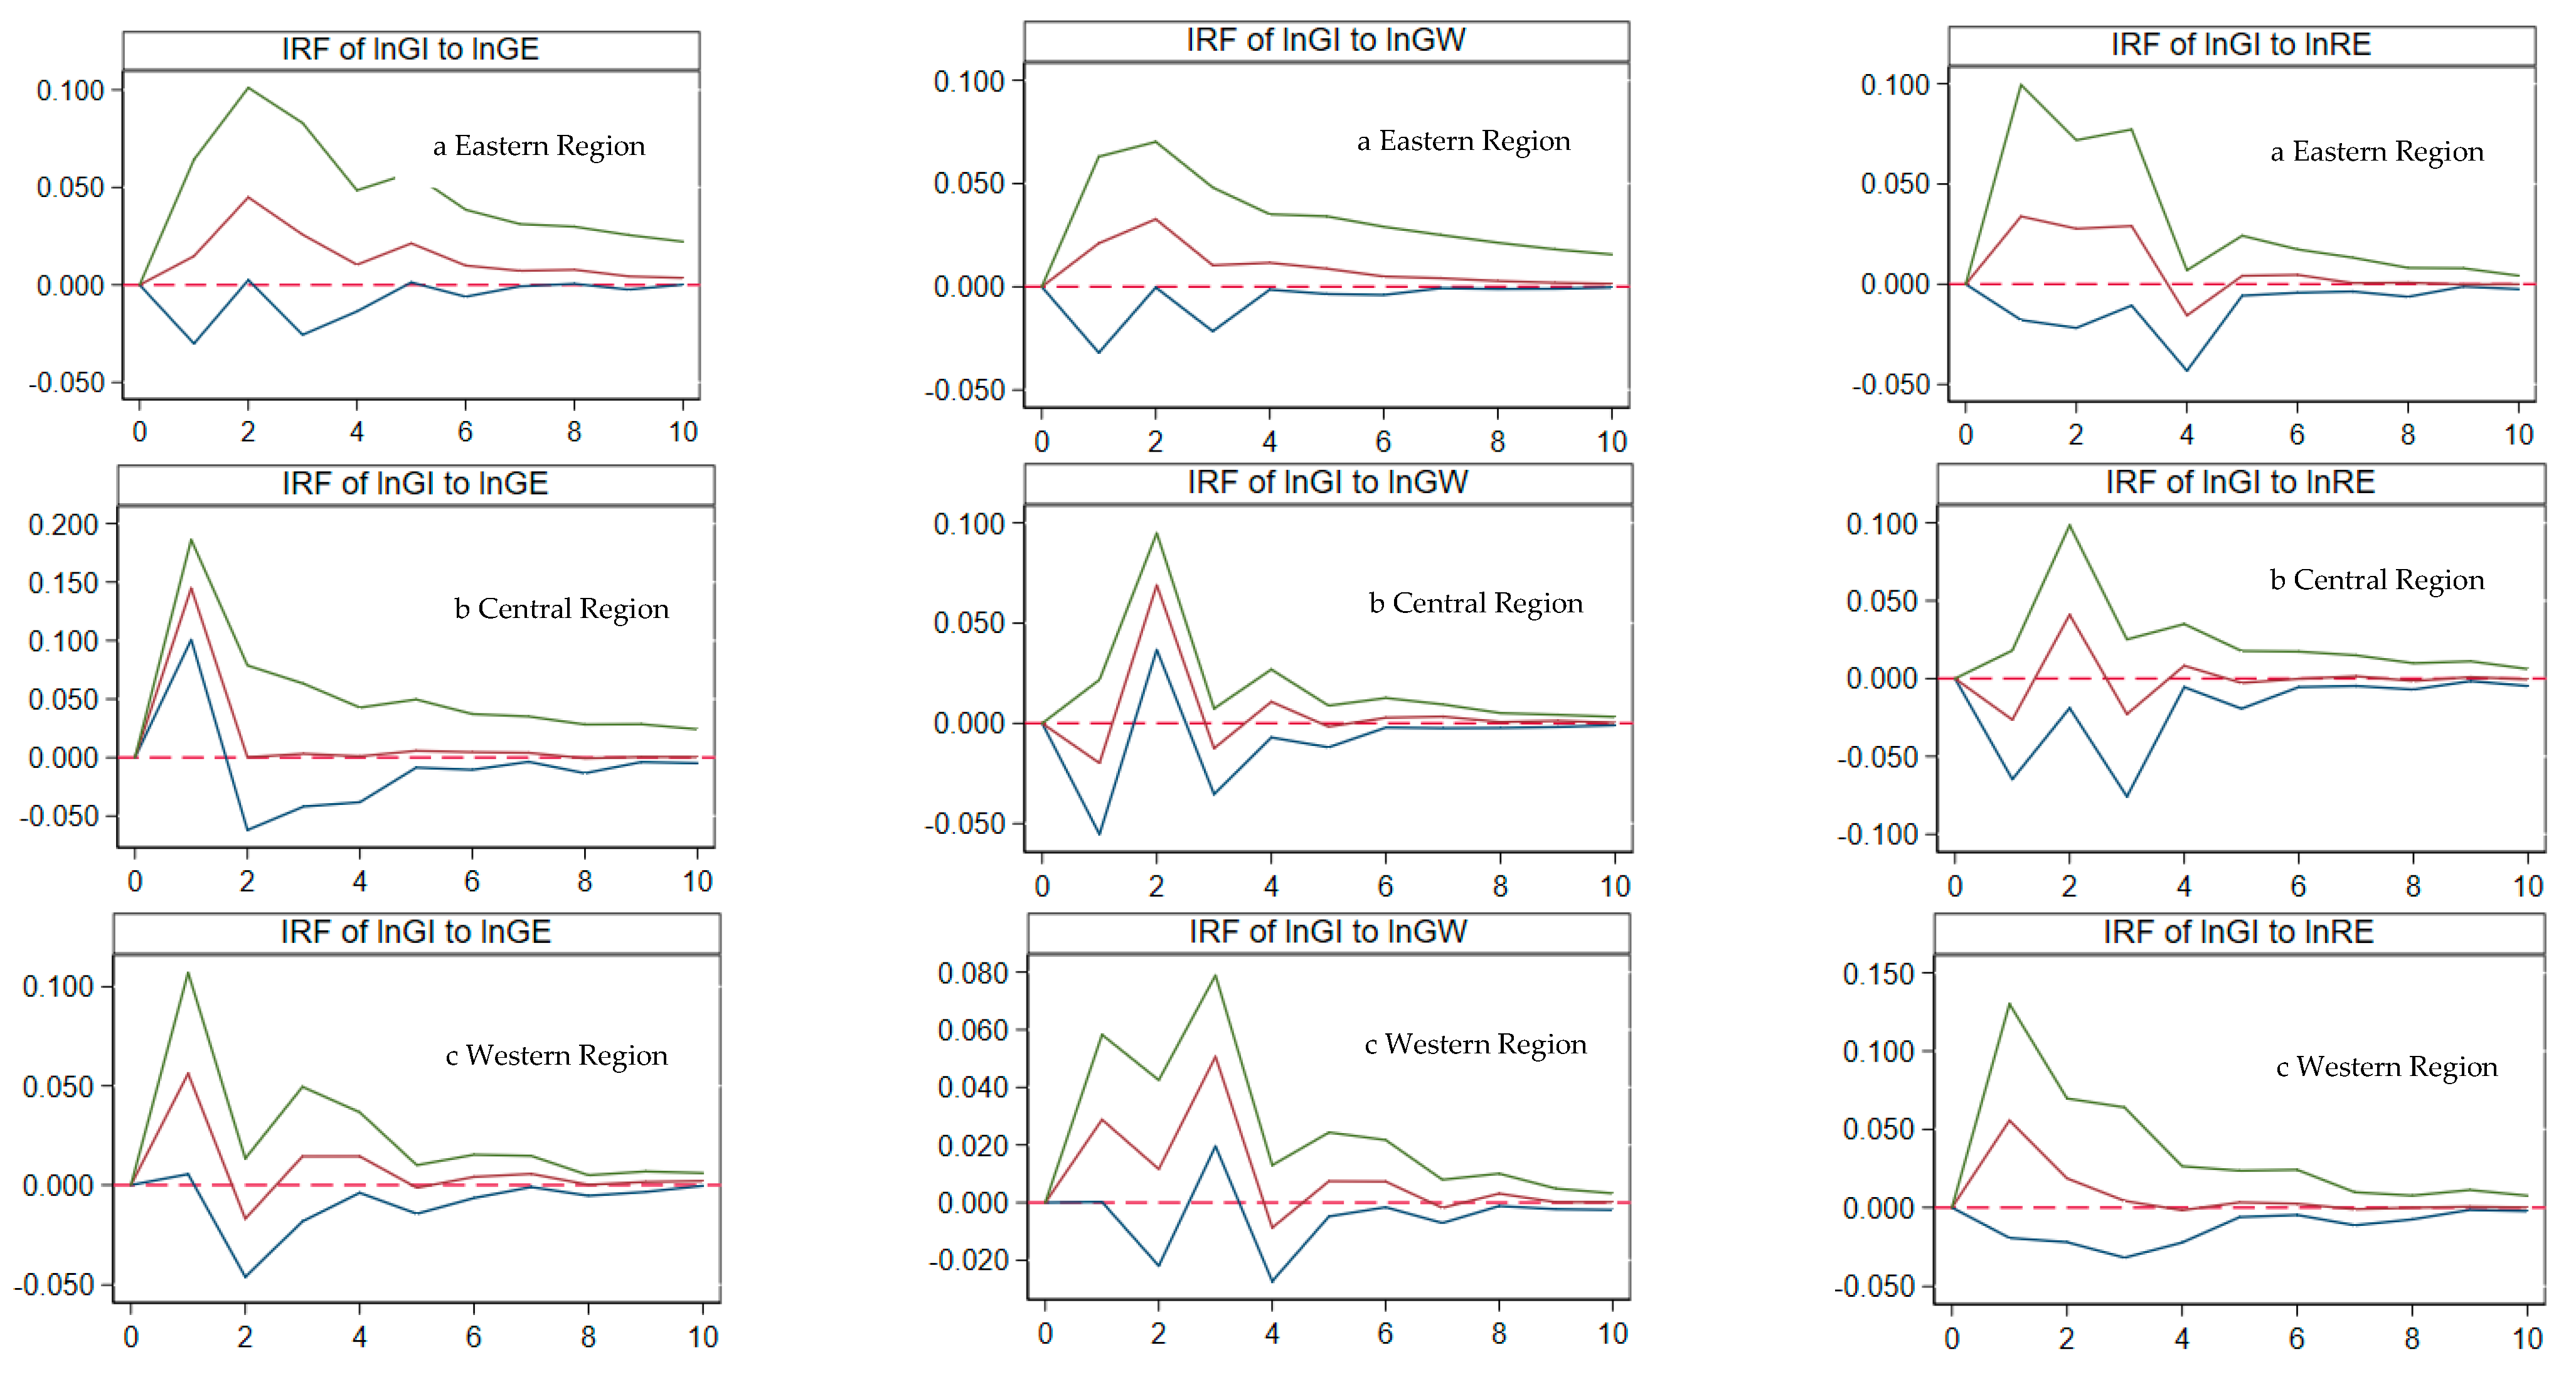
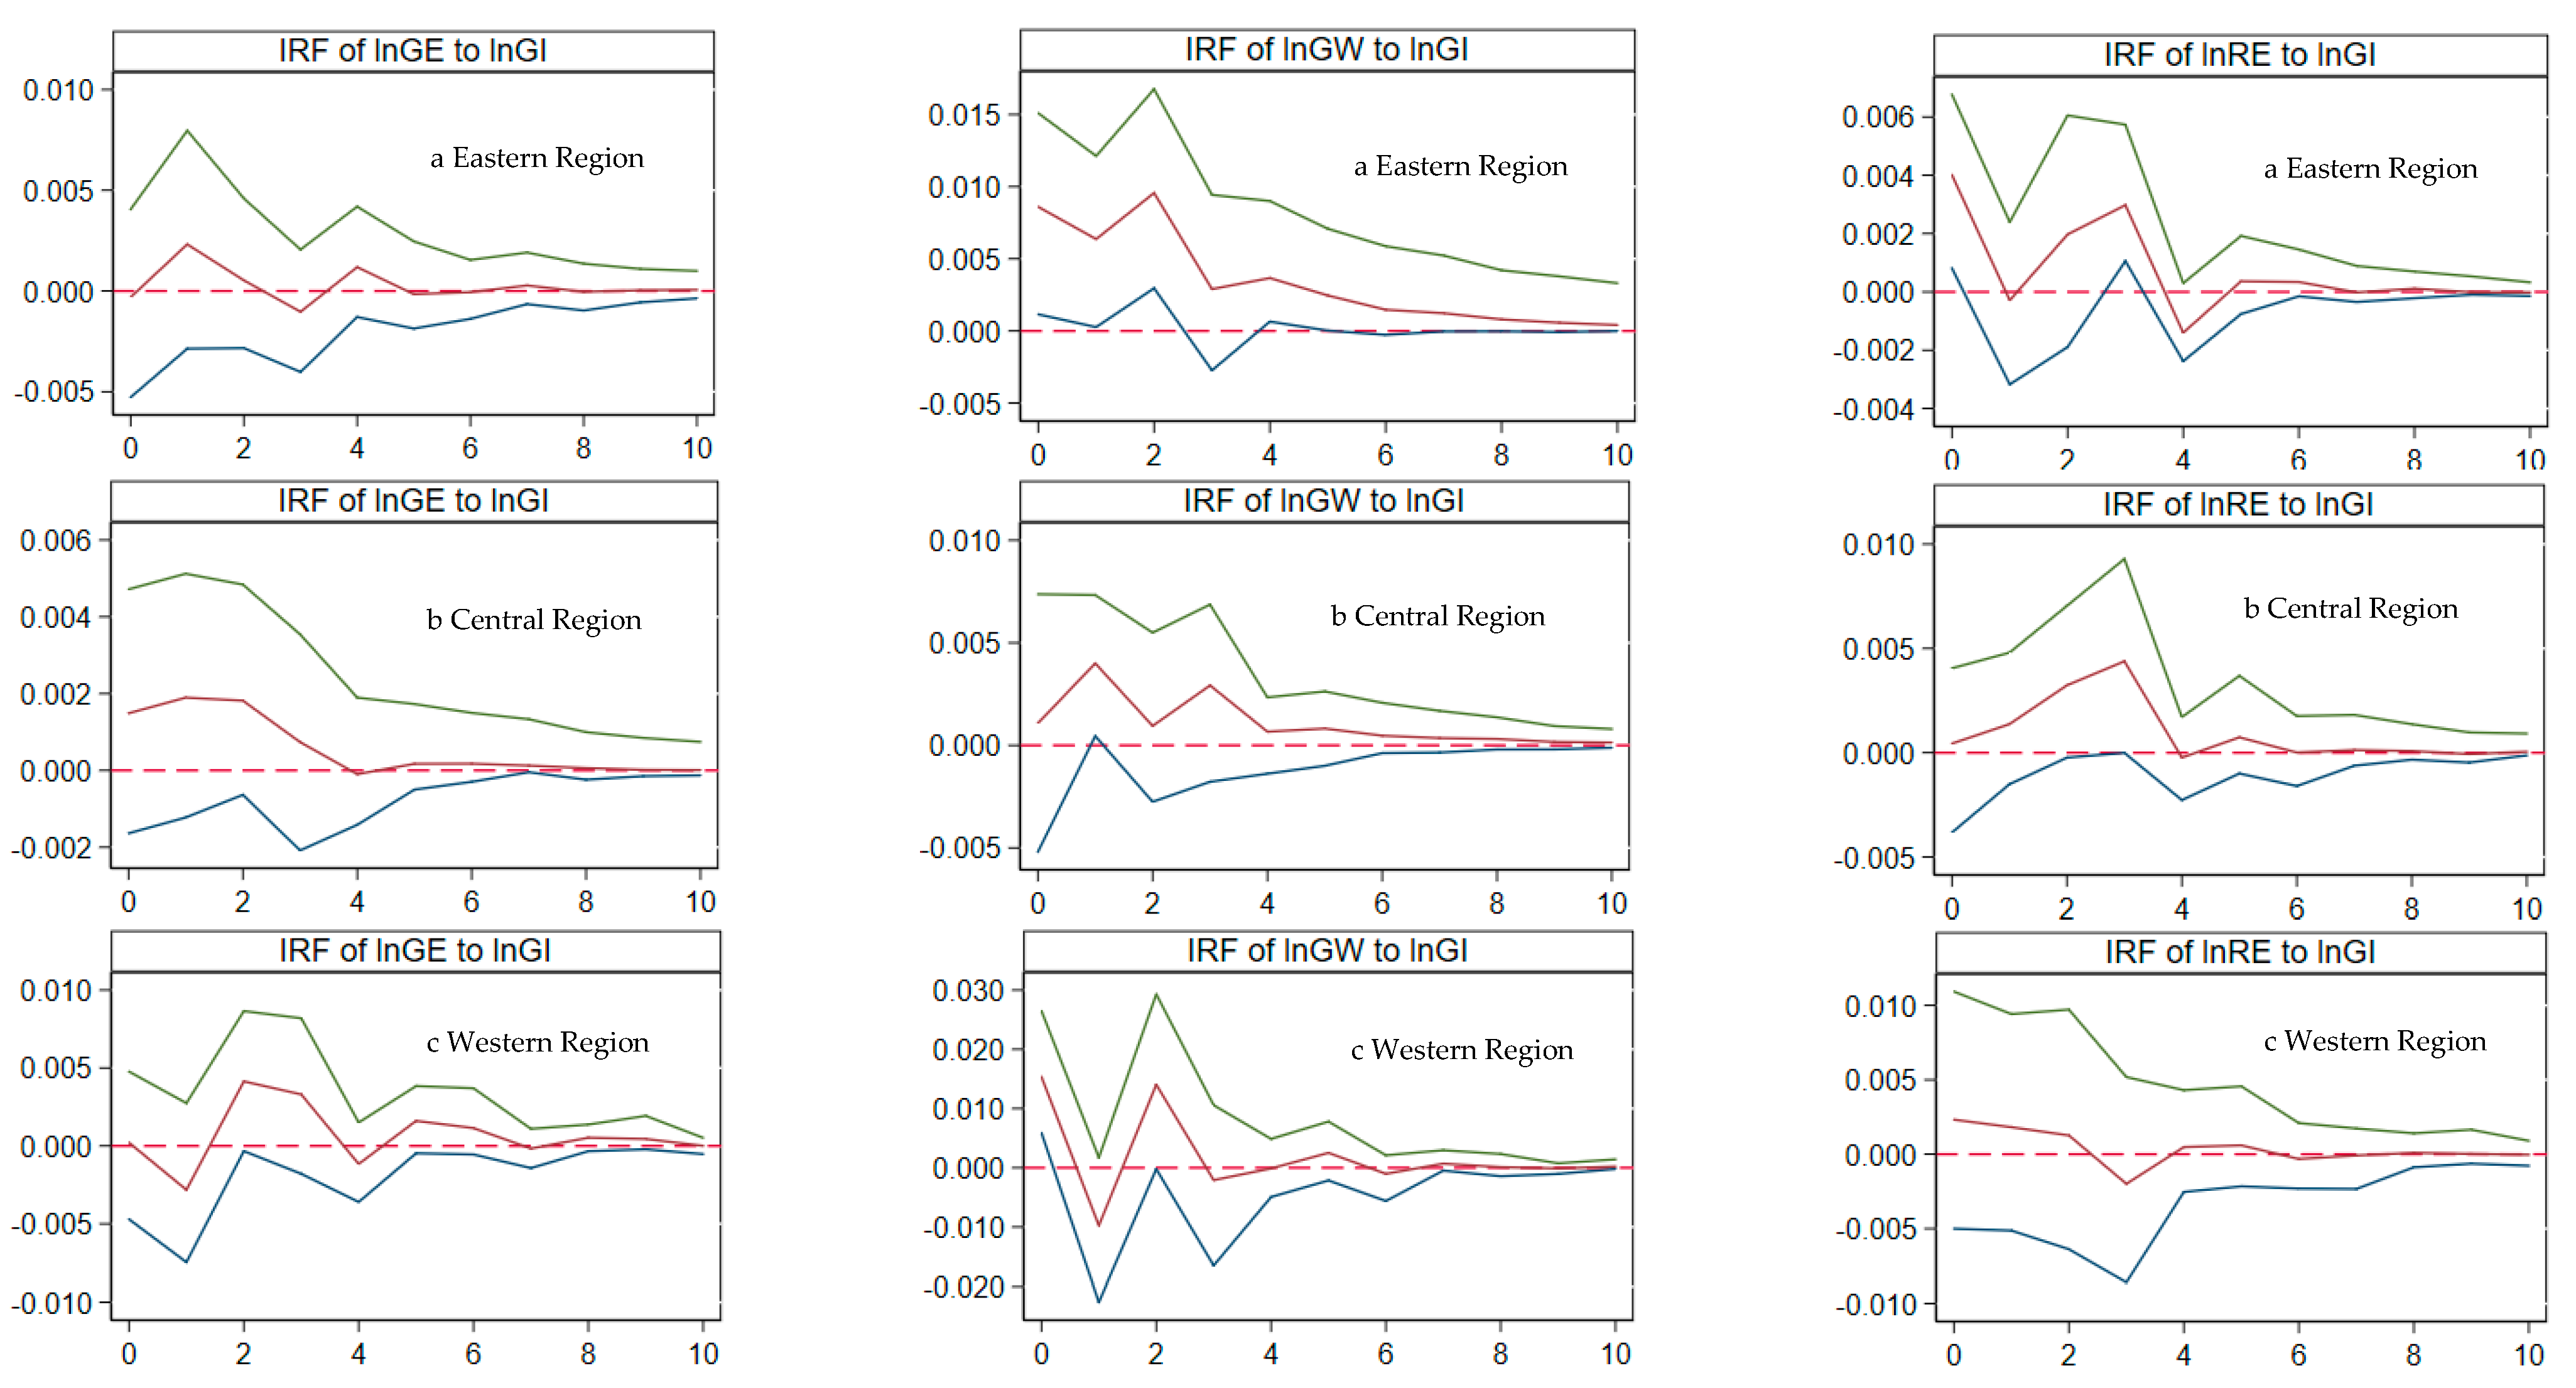
4.4. Research on the Dynamic Relationship between Green Investment and Green Ecology

As a dynamic model, the PVAR model has complicated interactions among various variables. Therefore, it is difficult to determine the impact of changes in variables on other variables. For this reason, the impulse response function is used to study the dynamic influence of the impact of a certain variable on other variables of the system [40]. The first 500 Monte Carlo simulations were conducted to define the standard deviation of the impulse response function of green investment and green ecology by region. The specific impulse response relationship is shown in Figure 2. The abscissa is the number of prediction periods, the ordinate is the degree of the impulse response, the middle curve represents the impulse response estimate, and the upper and lower curves give 95% confidence interval boundaries.
We conducted our analysis from the perspective of green ecology as the impacted variable. ① When green investment issues a standard deviation shock, the responses of GE, GW, and RE in the eastern region all present a fluctuating trend that rises at the beginning and then falls. Apart from the negative value of the resource environment at the initial stage, the other response values are all positive and gradually tend to zero. It indicates that the green investment in the eastern region has a positive effect on the green ecology, but it is gradually weakening. The economic base in the eastern part of China has played a leading role, so the implementation effect of green investment is remarkable. However, the RE of GE and GW are limited in the long term. ② The response process of the GE in the central region only occurs in the initial stage of the green investment shock and has experienced a process of “rising-declining” and eventually tending to zero. However, GW and RE are affected by the impact of green investment, and they all have multiple periods of negative response value fluctuations. This means that green investment has a staged impact on GW and RE. Green investment policies in central China are poorly implemented, financing channels are flawed, and the ecological environment is fragile. ③ The response process of green ecology in western and eastern regions is similar. Except for the occasional decline in the GW response to a negative value, the overall green ecological response generally showed positive fluctuations converging to zero. This means that green investment has a positive impact on the green ecological development of the eastern and western regions.
We conducted our analysis from the perspective of green investment as the impacted variable. ① When the GE increases by one standard deviation unit, the response value of green investment in the eastern region is positive and low. The response to green investment in the central region peaked in the second phase and gradually tended to zero. The initial response value of the green investment in the western region was negative, but it gradually shifted to a positive effect and peaked in the second period, eventually converging to zero. ② When the GW is increased by one standard deviation unit, the green investment response in the eastern region reached its maximum value at the beginning of the period, revealing a trend of declining fluctuations and tending to zero. The response value of the green investment in the central region indicates a fluctuating downward process of “rising-falling-rising-falling”, but the positive effect of GW on green investment is weaker than that of the eastern region. The response value of green investment in the western region declined from a negative value in the first period but turned to a positive value in the second period and converged to zero in the third period. ③ When the RE increase by one standard deviation unit, the response value of China’s green investment is mainly positive, and there are large regional differences. Among them, the positive effect of resources and the environment on green investment in the western region is the least obvious. The positive effect in the eastern and central regions was more significant at the beginning of the period but gradually tended to zero in the long-term development process. The green ecological foundation in the central and eastern regions is relatively poor, so the positive effect of green investment is more obvious. The specific impulse response relationship is shown in Figure 3.

4.5. Research on the Contribution of Green Investment and Green Ecology

The variance prediction decomposition method is used to measure the contribution of each unit shock to endogenous variables. This method is conducive to visually showing the relative importance of unit shocks to endogenous variables and also helps to clarify the link between green investment and green ecology. To briefly display the research results, this paper sets the number of forecast periods to 1, 10, 15, and 20 and finds that the variance decomposition results of 15 and 20 periods are similar. This means that after the 15th period, the dynamic relationship between China’s green investment and green ecology has reached equilibrium. Therefore, the 15th period of variance decomposition is used to explain the degree of mutual influence between green investment and green ecology.
From the test results, we observed the following: ① From the decomposition of the GE error term, the impact of green investment on the GE is 42.5%. This means that in the process of long-term development, green investment is the main factor in the development of GE. Results at the regional level show that the eastern, central, and western values are 44.4%, 38.5%, and 40.6%, respectively. This means that green investment at the regional level has a stronger impact on GE, with the eastern region having the strongest explanation, followed by the western region. ② From the perspective of the decomposition of the GW error term, its interpretation strength is 6.2%. This means that the development of GW relies on strong inertia, and the numerical display at the regional level also confirms this point. Among them, the western region’s GW (9.6%) has the strongest dependence on itself. ③ From the perspective of the decomposition of resource and environmental error terms, the GE contributed 13.5% of the explanation. Therefore, the impact of the GE on RE is stronger in the long-term development process. At the regional level, the western region’s GE (23.3%) contributes the most to the RE. ④ From the perspective of the decomposition of green investment error terms, the degree of impact of GW on green investment is 46%. Hence, in the long-term development process, GW is the main reason for green investment development. At the regional level, the central region’s GW (54.1%) contributed the most to green investment. The variance prediction decomposition results of GE and GW as the explained variables are shown in Table 7. The variance prediction and decomposition results for the explained variables as resources, environment, and green investment are shown in Table 8.

5. Discussion

(1) The results of the GMM show that the inertia of green investment in China severely restricts its short-term progress. On the one hand, the path-dependence characteristics of GE and GW are more obvious in the long run. Because green investment in China is in the trial stage, and the financial performance brought about by investment has not reached expectations [41]. The corresponding policy requirements do not apply to the long-term development of China’s green investment system and need to develop in the direction of green innovation [42]. On the other hand, the long-term development of green ecology has a significant self-reinforcing trend. In recent years, green ecology has achieved long-term development of social construction [43], natural environment maintenance [44], financial development, and industrial structure optimization [45]. The long-term cumulative effect has contributed to the self-enhancing mechanism of the green ecology, creating a positive phenomenon of path dependence. The reform in the eastern region is more effective. The eastern region demonstrates a better improvement effect in terms of factors such as the harmless treatment rate of municipal solid waste and the comprehensive utilization rate of industrial solid waste. The results show that only by optimizing green finance policies, continuously improving green fiscal and tax policies, and strengthening green governance capacity can we fully unleash the potential of green investment to support green ecology.
(2) The two-way interaction between green investment and green ecology has a positive spillover effect, but the positive effect gradually diminishes in the long run. The results of the impulse response reveal that the interaction between China’s green investment and green ecology shows positive effects to varying degrees in the short term. However, in the long term, the positive effect gradually decreases, and regional heterogeneity is more obvious, confirming the conclusion of the GMM estimation. It appears that green investment has improved the production technology of enterprises and increased investment in infrastructure, effectively reducing the emissions of pollutants represented by CO2 [46]. However, the lack of continuous green innovation in the green investment process has reduced the impact on pollutant emissions [47]. As a result, the positive spillover effect is weakened. The trend of green investment policy resources has alleviated the green ecological situation and improved the GE, social infrastructure, and ecological environment in the short term. Green ecological transformation, including GE, GW, and RE, requires targeted green investment to enhance the two-way interaction.
(3) The impact of China’s green ecology on green investment is the most significant in the interactive relationship, and the positive effect of green ecology on green investment in the western region is the most significant. Among the two-way interactions between green investment and green ecology, the impact of green ecology on green investment is better than the impact of green investment on green ecology. The gradual improvement of the green ecology with the participation of low-carbon energy has significantly promoted the green investment system [48]. Therefore, stricter environmental management measures are needed to promote enterprises to increase green investment [49]. Green investment and renewable energy consumption significantly reduce carbon emissions [10], and they will ultimately lead to sustainable growth [9]. However, environmental monitoring institutions are not sound, so it is difficult to promote the long-term development of the green investment system [50].
(4) Our findings can explain this phenomenon: green ecology varies in different regions of China, resulting in regional differences in the implementation of green investment [51]. ① Green investment has a positive impact on the green ecology of the eastern and western regions. One of the reasons is that green investment can deliver jobs [52]. In addition, the marketization process in eastern China is higher than in other regions, which is conducive to green ecology [53]. ② The response process of the GE in the central region only occurs in the initial stage of the green investment shock. Additionally, green investment has a staged impact on GW and RE. The Green Credit Policy has positive impacts in the eastern and western regions, and the policy effect is not obvious in the central region [54]. The failure to implement the relevant policies of green investment in the central region, so the fragile ecology especially needs to be improved by green investment.
In summary, this research finds that China’s green investment and green ecology have a significant positive interaction mechanism from the level of dynamic relationship, influence mechanism, and regional heterogeneity. Our conclusion confirms the research conclusions of Shen et al. [16], Ekeh, Wara, and Orovwode [11].

6. Conclusion and Policy Implications

6.1. Conclusions

Different from the research ideas and conclusions of scholars such as Verno et al. [22] and Gray and Shadbegian [28]. We first use the panel vector autoregressive model to explore the interaction between China’s green investment and green ecology. The conclusions are as follows: (1) The inertial development of green investment in China severely restricts the short-term progress of green investment. In the past time, the path-dependence characteristics of the GE and GW are more obvious, and the green ecosystem indicates the characteristics of relying on its development. There is a significant self-enhancing trend in green ecology. Green ecology improves each component through green investment, including GE, GW, and RE. (2) This paper expands the theory of ecological civilization [55], and the results of this study show that the two-way interaction between green investment and green ecology shows positive effects to varying degrees in the short term, but the positive effect gradually weakens in the future. The maintenance of positive spillover effects is worth exploring and practicing. (3) There is a two-way interaction between green investment and green ecology. The impact of China’s green ecology on green investment is more significant in interactive relationships. Among them, the positive effect of green ecology on green investment in the western region is the most significant. The positive spillover effect of green investment on green ecology in the central region is the most significant. Green ecology varies greatly in different regions of China, resulting in regional differences in the implementation of green investment. Hence, it is necessary to adjust the policy of green investment in a targeted manner according to geographical differences. The findings provide a new perspective and evidence on how to improve green investment and green ecology.

6.2. Policy Implications

In response to the above findings and in combination with the theoretical analysis, this paper proposes the following policy implications. Firstly, the inertial development of green investment in China severely restricts the short-term progress of green investment. Therefore, the government should first regulate green investment standards and attach importance to green technology and the green industry. In addition, the government should expand financing channels and fully mobilize the vitality of social idle funds. Furthermore, the government should thoroughly improve the overall coordination mechanism in ecological civilization, especially the green investment mechanism. Considering the development of different regions, the government should allocate green investment promptly according to the financial efficiency of different periods and regions. Moreover, the government should accelerate the regional transfer of green investment and green ecological resources to provide a platform for the coordinated development of both.
Secondly, the inclination trend of green investment policy resources has alleviated the green ecological situation region and improved the GE, GW, and environment. Therefore, financial institutions should embed environmental assessment in the credit management process, reducing investment in polluting enterprises and investing more funds in green technologies and green industries. In addition, financial institutions should accelerate the innovation efficiency of financial products and reduce the inertial effect of the existing green investment system.
Finally, the impact of green ecology on green investment is greater than the impact of green investment on green ecology. Therefore, the implementation of measures to promote green ecology can attract green investment, such as using clean energy, expanding the coverage of green infrastructure, and accelerating the cultivation of energy conservation industries. In particular, enterprises should heighten awareness of environmental information disclosure, eliminate backward production capacity, engage in green technology innovation, and shift towards cleaner production models.
There are still some shortcomings and room for improvement. First, in terms of variable measurement and selection, the PVAR model was studied and general indicator of green investment and green ecology in provinces, but no detailed grouping was conducted according to the level of economic development and population size for further research. In the future, with the introduction of more dimensions of data, there will be new results in cross-comparison. Secondly, the selection of regional size in this paper is only at the provincial level. In the future, research at the national and municipal levels will be included in the discussion.

Author Contributions

Investigation, Resources, Data Curation, Software, Visualization, Writing—Review and Editing, Y.X.; Formal Analysis, Supervision, Writing—Original Draft, W.Y.; Conceptualization, Validation, Methodology, Project Administration, Funding Acquisition, B.P. All authors have read and agreed to the published version of the manuscript.

Funding

This research was supported by a National Social Science Foundation Project grant funded by the Chinese government (grant nos. 21FGLB054), and funded by Wuxi Philosophy and Social Sciences Bidding Project (WXSK23-A-07).

Institutional Review Board Statement

This article does not contain any studies with human participants or animals performed by any of the authors.

Informed Consent Statement

Not applicable.

Data Availability Statement

Please contact the corresponding author if you need data.

Acknowledgments

The authors are grateful to all research staff that contributed to the data collection required for this study.

Conflicts of Interest

The authors declare no conflict of interest.

References

  1. Khan, Z.; Ali, S.; Umar, M.; Kirikkaleli, D.; Jiao, Z. Consumption-based carbon emissions and international trade in G7 countries: The role of environmental innovation and renewable energy. Sci. Total Environ. 2020, 730, 138945. [Google Scholar] [CrossRef] [PubMed]
  2. Gutberlet, J. Cooperative urban mining in Brazil: Collective practices in selective household waste collection and recycling. Waste Manag. 2015, 45, 22–31. [Google Scholar] [CrossRef] [PubMed]
  3. Khan, S.; Anjum, R.; Raza, S.T.; Ahmed Bazai, N.; Ihtisham, M. Technologies for municipal solid waste management: Current status, challenges, and future perspectives. Chemosphere 2022, 288, 132403. [Google Scholar] [CrossRef]
  4. Fuller, R.; Landrigan, P.J.; Balakrishnan, K.; Bathan, G.; Bose-O’Reilly, S.; Brauer, M.; Caravanos, J.; Chiles, T.; Cohen, A.; Corra, L.; et al. Pollution and health: A progress update. Lancet Planet. Health 2022, 6, e535–e547. [Google Scholar] [CrossRef] [PubMed]
  5. Landrigan, P.J.; Fuller, R.; Acosta, N.J.; Adeyi, O.; Arnold, R.; Baldé, A.B.; Bertollini, R.; Bose-O’Reilly, S.; Boufford, J.I.; Breysse, P.N. The Lancet Commission on pollution and health. Lancet 2018, 391, 462–512. [Google Scholar] [CrossRef] [Green Version]
  6. Ahmed, Z.; Cary, M.; Le, H.P. Accounting asymmetries in the long-run nexus between globalization and environmental sustainability in the United States: An aggregated and disaggregated investigation. Environ. Impact Assess. Rev. 2021, 86, 106511. [Google Scholar] [CrossRef]
  7. Ahmad, M.; Wu, Y. Combined role of green productivity growth, economic globalization, and eco-innovation in achieving ecological sustainability for OECD economies. J. Environ. Manag. 2022, 302, 113980. [Google Scholar] [CrossRef]
  8. Lin, Z. The connotation and strategic conception of green ecology in the new era. China Soft Sci. 2022, S1, 25–33. [Google Scholar]
  9. Wang, L.; Su, C.-W.; Ali, S.; Chang, H.-L. How China is fostering sustainable growth: The interplay of green investment and production-based emission. Environ. Sci. Pollut. Res. 2020, 27, 39607–39618. [Google Scholar] [CrossRef]
  10. Li, Z.-Z.; Li, R.Y.M.; Malik, M.Y.; Murshed, M.; Khan, Z.; Umar, M. Determinants of Carbon Emission in China: How Good is Green Investment? Sustain. Prod. Consum. 2021, 27, 392–401. [Google Scholar] [CrossRef]
  11. Ekeh, J.; Wara, S.; Orovwode, H. Management of Existing Capacity of Electric Power with Energy Saving Devices; Advanced Materials Research, Trans Tech Publ: Wollerau, Switzerland, 2007; pp. 117–124. [Google Scholar]
  12. Leung, C.K.Y.; Sarpça, S.; Yilmaz, K. Public housing units vs. housing vouchers: Accessibility, local public goods, and welfare. J. Hous. Econ. 2012, 21, 310–321. [Google Scholar] [CrossRef] [Green Version]
  13. Zhu, S.; He, C.; Liu, Y. Going green or going away: Environmental regulation, economic geography and firms’ strategies in China’s pollution-intensive industries. Geoforum 2014, 55, 53–65. [Google Scholar] [CrossRef]
  14. Sun, Y.; Song, Y.; Yang, C. The Impact of Environmental Regulations on the Quality of Economic Growth: Promote or Restrain?—From the Perspective of Total Factor Productivity. Contemp. Econ. Manag. 2019, 41, 11–17. [Google Scholar]
  15. Schillebeeckx, S.J.; Kautonen, T.; Hakala, H. To buy green or not to buy green: Do structural dependencies block ecological responsiveness? J. Manag. 2022, 48, 472–501. [Google Scholar] [CrossRef]
  16. Shen, Y.; Su, Z.-W.; Malik, M.Y.; Umar, M.; Khan, Z.; Khan, M. Does green investment, financial development and natural resources rent limit carbon emissions? A provincial panel analysis of China. Sci. Total Environ. 2021, 755, 142538. [Google Scholar] [CrossRef] [PubMed]
  17. Sun, Y.; Guan, W.; Razzaq, A.; Shahzad, M.; Binh An, N. Transition towards ecological sustainability through fiscal decentralization, renewable energy and green investment in OECD countries. Renew. Energy 2022, 190, 385–395. [Google Scholar] [CrossRef]
  18. Pang, Q.; Li, M.; Li, H. Research on spatial coupling coordinated development between financial agglomeration, regional innovation and ecological efficiency of Yangtze River Economic Belt. J. Ind. Technol. Econ. 2019, 38, 68–76. [Google Scholar]
  19. Labatt, S.; White, R.R. Environmental Finance: A Guide to Environmental Risk Assessment and Financial Products; John Wiley & Sons: Hoboken, NJ, USA, 2002; Volume 98. [Google Scholar]
  20. Wang, X.; Wang, S. The impact of green finance on inclusive economic growth—Empirical Analysis Based on Spatial Panel. Open J. Bus. Manag. 2020, 8, 2093. [Google Scholar] [CrossRef]
  21. Anderson, J.E. Financing urban development in China. Chin. Econ. 2009, 42, 48–62. [Google Scholar] [CrossRef]
  22. Henderson, J.V.; Wang, H.G. Urbanization and city growth: The role of institutions. Reg. Sci. Urban Econ. 2007, 37, 283–313. [Google Scholar] [CrossRef]
  23. Leiter, A.M.; Parolini, A.; Winner, H. Environmental regulation and investment: Evidence from European industry data. Ecol. Econ. 2011, 70, 759–770. [Google Scholar] [CrossRef]
  24. Testa, F.; Iraldo, F.; Frey, M. The effect of environmental regulation on firms’ competitive performance: The case of the building & construction sector in some EU regions. J. Environ. Manag. 2011, 92, 2136–2144. [Google Scholar]
  25. Alpay, E.; Kerkvliet, J.; Buccola, S. Productivity growth and environmental regulation in Mexican and US food manufacturing. Am. J. Agric. Econ. 2002, 84, 887–901. [Google Scholar] [CrossRef]
  26. Pimonenko, T.V.; Lieonov, S.V.; Ibragimov, Z. Green investing for SDGS: EU experience for developing countries. Econ. Soc. Dev. 2019, 2019, 867–876. [Google Scholar]
  27. Sun, H.; Wan, Y.; Zhang, L.; Zhou, Z. Evolutionary game of the green investment in a two-echelon supply chain under a government subsidy mechanism. J. Clean. Prod. 2019, 235, 1315–1326. [Google Scholar] [CrossRef]
  28. Gray, W.B.; Shadbegian, R. Environmental Regulation and Manufacturing Productivity at the Plant Level; National Bureau of Economic Research Cambridge: Cambridge, MA, USA, 1993. [Google Scholar]
  29. Holtz-Eakin, D.; Newey, W.; Rosen, H.S. Estimating vector autoregressions with panel data. Econom. J. Econom. Soc. 1988, 1371–1395. [Google Scholar] [CrossRef]
  30. Samuel, G.M. Ibsen: The Open Vision; JSTOR: London, UK, 1984. [Google Scholar]
  31. Canova, F.; Ciccarelli, M. Forecasting and turning point predictions in a Bayesian panel VAR model. J. Econom. 2004, 120, 327–359. [Google Scholar] [CrossRef] [Green Version]
  32. Love, I.; Zicchino, L. Financial development and dynamic investment behavior: Evidence from panel VAR. Q. Rev. Econ. Financ. 2006, 46, 190–210. [Google Scholar] [CrossRef]
  33. Di, W.; Haibo, K.; Xianyou, P. Research on the Effects of Environmental Investments on Regional Spatial Spillover Effects. Manag. Rev. 2018, 30, 49. [Google Scholar]
  34. Cheng, Y.; Wang, J.; Wang, Y.; Ren, J. A comparative research of the spatial-temporal evolution track and influence mechanism of green development in China. Geogr Res 2019, 38, 1–21. [Google Scholar]
  35. Peng, B.; Zhang, X.; Elahi, E.; Wan, A. Evolution of spatial–temporal characteristics and financial development as an influencing factor of green ecology. Environ. Dev. Sustain. 2022, 24, 789–809. [Google Scholar] [CrossRef]
  36. Fei, R.; Cui, A.; Qin, K. Can technology R&D continuously improve green development level in the open economy? Empirical evidence from China’s industrial sector. Environ. Sci. Pollut. Res. 2020, 27, 34052–34066. [Google Scholar]
  37. Huber, P.J. Projection pursuit. Ann. Stat. 1985, 13, 435–475. [Google Scholar] [CrossRef]
  38. Tang, Q.; Wang, J.; Jing, Z. Tempo-spatial changes of ecological vulnerability in resource-based urban based on genetic projection pursuit model. Ecol. Indic. 2021, 121, 107059. [Google Scholar] [CrossRef]
  39. Liu, H.; Peng, C.; Chen, L. The impact of OFDI on the energy efficiency in Chinese provinces: Based on PVAR model. Energy Rep. 2022, 8, 84–96. [Google Scholar] [CrossRef]
  40. Ren, S.; Hao, Y.; Wu, H. Government corruption, market segmentation and renewable energy technology innovation: Evidence from China. J. Environ. Manag. 2021, 300, 113686. [Google Scholar] [CrossRef]
  41. Su, X. Can Green Investment Win the Favor of Investors in China? Evidence from the Return Performance of Green Investment Stocks. Emerg. Mark. Financ. Trade 2021, 57, 3120–3138. [Google Scholar] [CrossRef]
  42. Guo, J.; Zhou, Y.; Ali, S.; Shahzad, U.; Cui, L. Exploring the role of green innovation and investment in energy for environmental quality: An empirical appraisal from provincial data of China. J. Environ. Manag. 2021, 292, 112779. [Google Scholar] [CrossRef]
  43. Lei, Z.; Dayong, Z. Relationship between Ecological Civilization and Balanced Population Development in China. Energy Procedia 2011, 5, 2532–2535. [Google Scholar] [CrossRef] [Green Version]
  44. Yu, Y.; Wu, W.; Zhang, T.; Liu, Y. Environmental catching-up, eco-innovation, and technological leadership in China’s pilot ecological civilization zones. Technol. Forecast. Soc. Chang. 2016, 112, 228–236. [Google Scholar] [CrossRef]
  45. Wei, Z.; Yuguo, J.; Jiaping, W. Greenization of Venture Capital and Green Innovation of Chinese Entity Industry. Ecol. Indic. 2015, 51, 31–41. [Google Scholar] [CrossRef]
  46. Chen, Y.; Ma, Y. Does green investment improve energy firm performance? Energy Policy 2021, 153, 112252. [Google Scholar] [CrossRef]
  47. Zahan, I.; Chuanmin, S. Towards a green economic policy framework in China: Role of green investment in fostering clean energy consumption and environmental sustainability. Environ. Sci. Pollut. Res. 2021, 28, 43618–43628. [Google Scholar] [CrossRef] [PubMed]
  48. Eyraud, L.; Clements, B.; Wane, A. Green investment: Trends and determinants. Energy Policy 2013, 60, 852–865. [Google Scholar] [CrossRef]
  49. Liao, X. Public appeal, environmental regulation and green investment: Evidence from China. Energy Policy 2018, 119, 554–562. [Google Scholar] [CrossRef]
  50. Gao, X.; Zheng, H. Environmental concerns, environmental policy and green investment. Int. J. Environ. Res. 2017, 14, 1570. [Google Scholar] [CrossRef] [Green Version]
  51. Ren, S.; Hao, Y.; Wu, H. How Does Green Investment Affect Environmental Pollution? Evidence from China. Environ. Resour. Econ. 2022, 81, 25–51. [Google Scholar] [CrossRef]
  52. Hanna, R.; Xu, Y.; Victor, D.G.J.N. After COVID-19, green investment must deliver jobs to get political traction. Nature 2020, 582, 178–180. [Google Scholar] [CrossRef]
  53. Huang, L.; Lei, Z. How environmental regulation affect corporate green investment: Evidence from China. J. Clean. Prod. 2021, 279, 123560. [Google Scholar] [CrossRef]
  54. Zhang, S.; Wu, Z.; Wang, Y.; Hao, Y. Fostering green development with green finance: An empirical study on the environmental effect of green credit policy in China. J. Environ. Manag. 2021, 296, 113159. [Google Scholar] [CrossRef] [PubMed]
  55. Geall, S.; Ely, A. Narratives and Pathways towards an Ecological Civilization in Contemporary China. China Q. 2018, 236, 1175–1196. [Google Scholar] [CrossRef]
Figure 1. Study area.
Sustainability 15 09313 g001
Figure 2. The impulse response of green ecology as a shock variable.
Sustainability 15 09313 g002
Figure 3. The impulse response of green investment as an impact variable.
Sustainability 15 09313 g003
Table 1. Green investment and construction of green ecosystem indicators.
System
Layer
Element
Layer
Indicator Layer
(Indicator Code)
UnitIndicator Attributes
Green
ecology
Green
growth
Economic GrowthGDP per capita (X1)CNY+
Per capita local fiscal revenue (X2)CNY+
Ecological EconomyEnergy consumption per CNY 10,000 GDP (X3)Tons of standard coal/CNY ten thousand
CNY 10,000 GDP SO2 emissions (X4)kg/CNY ten thousand
Wastewater discharge per ten thousand CNY GDP (X5)kg/CNY ten thousand
Output levelPrimary industry labor productivity (X6)CNY/person+
Labor productivity in the secondary industry (X7)CNY/person+
Tertiary industry labor productivity (X8)CNY/person+
Proportion of the added value of the tertiary industry (X9)%+
Green
welfare
Standard of livingPer capita disposable income of urban residents (X10)CNY+
Net income of rural residents (X11)CNY+
Housing area per capita (X12)m2+
Public ServicePark green area per capita (X13)m2/person+
Green coverage rate in built-up area (X14)%+
Harmless treatment rate of municipal solid waste (X15)%+
Comprehensive utilization rate of industrial solid waste (X16)%+
Resources and EnvironmentResource consumptionPer capita domestic water consumption (X17)L/person
Energy consumption per capita (X18)kg standard coal/person
Environmental pressureSO2 emissions per unit land area (X19)t/km2
Wastewater discharge per unit land area (X20)t/km2
Ecological qualityForest cover rate (X21)%+
The ratio of the area occupied by nature reserves (X22)%+
Green investmentEnvironmental pollution control investmentIndustrial pollution control investment (Y1)CNY ten thousand+
Urban environmental infrastructure construction investment (Y2)+
“Three Simultaneities” project environmental protection engineering investment (Y3)+
Water conservancy construction investmentInvestment in water conservancy construction (Y4)+
Forestry investmentForestry investment (Y5)+
Table 2. Unit root test of green investment and green ecological development.
VariableAll RegionsEastern RegionCentral RegionWestern Region
LLCIPSLLCIPSLLCIPSLLCIPS
ln(GE)−11.341 ***−4.786 ***−7.174 ***−3.369 ***−5.231 ***0.209−8.466 ***−4.395 ***
(0.000)(0.000)(0.000)(0.0004)(0.000)(0.583)(0.000)(0.000)
ln(GW)−14.446 ***−3.904 ***−8.143 ***−0.786−5.290 ***−3.662 ***−11.279 ***−2.889 ***
(0.000)(0.000)(0.000)(0.216)(0.000)(0.000)(0.000)(0.002)
ln(RE)−16.150 ***0.228−15.942 ***0.4778−1.970 **0.913−1.952 **−0.818
(0.000)(0.590)(0.000)(0.684)(0.024)(0.819)(0.026)(0.207)
ln(GI)−7.178 ***−1.723 **−3.100 ***−0.337−2.366 ***0.025−6.374 ***−2.497 ***
(0.000)(0.042)(0.000)(0.368)(0.009)(0.510)(0.000)(0.006)
dln(GE)−8.032 ***−6.237 ***−6.414 ***−4.121 ***−3.752 ***−3.885 ***−4.041 ***−2.951 ***
(0.000)(0.000)(0.000)(0.000)(0.000)(0.000)(0.000)(0.001)
dln(GW)−11.674 ***−7.935 ***−5.548 ***−5.251 ***−7.130 ***−4.225 ***−7.460 ***−4.276 ***
(0.000)(0.000)(0.000)(0.000)(0.000)(0.000)(0.000)(0.000)
dln(RE)−26.086 ***−9.312 ***−25.456 ***−6.283 ***−4.181 ***−4.335 ***−3.909 ***−5.347 ***
(0.000)(0.000)(0.000)(0.000)(0.000)(0.000)(0.000)(0.000)
dln(GI)−9.652 ***−10.180 ***−6.626 ***−6.636 ***−4.706 ***−4.551 ***−5.352 ***−6.237 ***
(0.000)(0.000)(0.000)(0.000)(0.000)(0.000)(0.000)(0.000)
**, *** represent significant at 5%, 1% confidence levels, respectively.
Table 3. Co-integration test of green investment and green ecological development.
Testing MethodStatistic NameStatisticsp Value
KaoDickey–Fuller t−2.330 ***0.0099
westerlundVariance ratio−2.875 ***0.0020
PedroniModified Phillips-Perron t2.549 ***0.0054
Phillips-Perron t−7.261 ***0.0000
Augmented Dickey–Fuller t−7.369 ***0.0000
*** represents significant at 1% confidence level.
Table 4. Selection results of the optimal lag order.
Hysteresis
Order
All RegionsEastern RegionCentral RegionWestern Region
AICBICHQICAICBICHQICAICBICHQICAICBICHQIC
1−8.49−7.02−7.90−10.52−9.19 *−9.98−12.29−11.03 *−11.79−6.69−5.38−6.16
2−8.97−7.22−8.27−10.76 *−9.02−10.05 *−12.68−10.83−11.95−7.02−5.27−6.31
3−9.42−7.35 *−8.59 *−10.43−8.23−9.53−13.13 *−10.62−12.15 *−7.64−5.38 *−6.73 *
4−9.46 *−7.01−8.47−10.17−7.44−9.0611.1114.3612.36−7.84 *−5.01−6.70
* represents significant at 10% confidence level.
Table 5. GMM estimation results where the explained variables are GE and GW.
VariableAll RegionsEastern RegionCentral RegionWestern Region
h_lnGEh_lnGWh_lnGEh_lnGWh_lnGEh_lnGWh_lnGEh_lnGW
L.h_lnGE0.0630.0920.0400.211−0.3190.4390.0800.022
(0.378)(0.570)(0.789)(0.113)(0.201)(0.171)(0.336)(0.933)
L.h_lnGW−0.0040.0030.0940.0630.0470.142−0.021−0.038
(0.891)(0.964)(0.124)(0.562)(0.418)(0.287)(0.531)(0.649)
L.h_lnRE0.0220.052−0.179−0.129−0.0140.1970.0500.090
(0.665)(0.492)(0.280)(0.431)(0.889)(0.246)(0.271)(0.343)
L.h_lnGI0.002−0.0110.0060.0150.0100.023 *−0.008−0.045
(0.769)(0.417)(0.550)(0.107)(0.248)(0.065)(0.469)(0.145)
L2.h_lnGE0.0990.1790.149 **0.244 **−0.1430.1780.04880.221
(0.131)(0.212)(0.035)(0.028)(0.469)(0.484)(0.636)(0.362)
L2.h_lnGW0.0130.0440.0520.0080.0570.203 **0.013−0.003
(0.583)(0.564)(0.485)(0.949)(0.225)(0.033)(0.668)(0.974)
L2.h_lnRE−0.029−0.074−0.0270.052−0.1560.067−0.007−0.081
(0.385)(0.343)(0.752)(0.670)(0.263)(0.673)(0.874)(0.337)
L2.h_lnGI0.0070.020−0.0010.027 ***0.006−0.0030.0120.019
(0.157)(0.131)(0.979)(0.014)(0.496)(0.767)(0.219)(0.548)
L3.h_lnGE0.273 ***0.1330.197 **0.209 *0.0590.2660.301 ***0.102
(0.000)(0.329)(0.022)(0.099)(0.639)(0.142)(0.000)(0.590)
L3.h_lnGW0.0020.104 ***0.007−0.0050.0020.032−0.0040.106
(0.895)(0.000)(0.838)(0.926)(0.924)(0.458)(0.853)(0.041)
L3.h_lnRE−0.028−0.0170.0100.059−0.208 *−0.252 *−0.028−0.003
(0.454)(0.776)(0.924)(0.630)(0.057)(0.062)(0.569)(0.971)
L3.h_lnGI0.003−0.003−0.0070.0050.0040.0060.016−0.014
(0.499)(0.756)(0.191)(0.485)(0.599)(0.514)(0.157)(0.587)
*, **, *** represent significant at 10%, 5%, and 1% confidence levels, respectively.
Table 6. GMM estimation results where the explained variables are resources, environment, and green investment.
VariableAll RegionsEastern RegionCentral RegionWestern Region
h_lnREh_lnGIh_lnREh_lnGIh_lnREh_lnGIh_lnREh_lnGI
L.h_lnGE0.0101.0750.128 *0.6430.3239.603 ***−0.0681.162
(0.943)(0.153)(0.058)(0.556)(0.349)(0.001)(0.791)(0.265)
L.h_lnGW0.0340.157−0.001−0.4120.047−1.902 *0.0270.299
(0.113)(0.156)(0.994)(0.556)(0.660)(0.087)(0.392)(0.261)
L.h_lnRE−0.1150.408−0.189 *0.812−0.105−0.917−0.0830.542
(0.238)(0.478)(0.090)(0.650)(0.253)(0.504)(0.470)(0.409)
L.h_lnGI−0.007−0.311 ***−0.002−0.329 ***0.0020.061−0.007−0.310 ***
(0.299)(0.000)(0.775)(0.003)(0.884)(0.495)(0.676)(0.003)
L2.h_lnGE0.0450.3620.128 *1.702 **0.2991.6140.006−0.215
(0.430)(0.454)(0.077)(0.036)(0.199)(0.554)(0.960)(0.676)
L2.h_lnGW0.0070.224−0.021−0.142−0.0712.210 ***0.0020.230
(0.780)(0.305)(0.655)(0.821)(0.143)(0.000)(0.952)(0.429)
L2.h_lnRE−0.307 *0.500−0.220 *1.2960.0760.878−0.3260.357
(0.074)(0.184)(0.054)(0.318)(0.534)(0.650)(0.123)(0.335)
L2.h_lnGI−0.001−0.0180.0050.0180.008−0.133−0.0140.005
(0.876)(0.773)(0.440)(0.850)(0.325)(0.134)(0.425)(0.964)
L3.h_lnGE0.2040.0350.0871.0720.0020.6470.338−0.205
(0.133)(0.937)(0.245)(0.291)(0.990)(0.664)(0.125)(0.724)
L3.h_lnGW−0.0260.382 *−0.016−0.3320.015−0.824 ***−0.0420.699 ***
(0.127)(0.054)(0.539)(0.350)(0.661)(0.005)(0.163)(0.004)
L3.h_lnRE−0.0180.307−0.0462.056 *0.008−1.024−0.0030.238
(0.800)(0.456)(0.493)(0.066)(0.931)(0.572)(0.978)(0.610)
L3.h_lnGI0.0010.0040.009 **0.0680.008−0.215 **−0.018 *−0.017
(0.987)(0.944)(0.011)(0.347)(0.439)(0.021)(0.097)(0.845)
*, **, *** represent significant at 10%, 5%, and 1% confidence levels, respectively.
Table 7. Variance prediction decomposition results of GE and GW as the explained variables.
VariableForecast PeriodAll RegionsEastern RegionCentral RegionWestern Region
lnGElnGWlnGElnGWlnGElnGWlnGElnGW
lnGE11.0000.0001.0000.0001.0000.0001.0000.000
lnGW10.0210.9790.0190.9810.0140.9860.0230.977
lnRE10.0010.0100.0000.0050.0190.1280.0040.006
lnGI10.0000.0300.0000.0200.0010.0050.0000.045
lnGE100.5180.0390.5480.0230.4830.0240.4850.062
lnGW100.4370.1320.4670.0770.3980.1050.4100.192
lnRE100.4530.0500.5000.0280.4000.0590.4150.072
lnGI100.5070.0520.5170.0300.4440.0340.5060.079
lnGE150.3940.0310.4190.0180.3670.0170.3660.051
lnGW150.3650.0620.3860.0350.3350.0430.3430.096
lnRE150.3760.0350.4010.0190.3410.0280.3520.056
lnGI150.4250.0370.4440.0210.3850.0230.4060.059
lnGE200.3220.0260.3450.0150.3040.0130.2950.044
lnGW200.3070.0400.3280.0230.2880.0250.2850.064
lnRE200.3130.0280.3350.0160.2920.0180.2900.046
lnGI200.3430.0290.3640.0160.3180.0160.3200.048
Table 8. Variance prediction and decomposition results for the explained variables as resources, environment, and green investment.
VariableForecast PeriodAll RegionsEastern RegionCentral RegionWestern Region
lnRElnGIlnRElnGIlnRElnGIlnRElnGI
lnGE10.0000.0000.0000.0000.0000.0000.0000.000
lnGW10.0000.0000.0000.0000.0000.0000.0000.000
lnRE10.9890.0000.9940.0000.8530.0000.9900.000
lnGI10.0010.9690.0190.9610.0020.9930.0010.954
lnGE100.1110.3320.0640.3650.0820.4110.1900.263
lnGW100.0740.3570.0510.4050.0560.4410.1220.277
lnRE100.1490.3480.0680.4050.1080.4320.2510.262
lnGI100.0520.3890.0350.4170.0390.4830.0920.322
lnGE150.1350.4400.0790.4840.0960.5200.2330.351
lnGW150.1140.4600.0720.5070.0810.5410.1950.366
lnRE150.1330.4550.0760.5040.0940.5360.2310.361
lnGI150.1060.4330.0650.4700.0770.5160.1850.350
lnGE200.1540.4980.0910.5490.1070.5750.2650.396
lnGW200.1410.5110.0860.5630.0990.5890.2430.407
lnRE200.1500.5080.0880.5610.1040.5850.2600.404
lnGI200.1370.4900.0820.5370.0970.5690.2380.393
Disclaimer/Publisher’s Note: The statements, opinions and data contained in all publications are solely those of the individual author(s) and contributor(s) and not of MDPI and/or the editor(s). MDPI and/or the editor(s) disclaim responsibility for any injury to people or property resulting from any ideas, methods, instructions or products referred to in the content.

