Article

Influence of Dry-Wet Cycles on the Structure and Shear Strength of Loess

1
School of Civil Engineering and Architecture, Xi’an University of Technology, Xi’an 710048, China
2
Shaanxi Railway Institute, Weinan 714000, China
3
Loess Soil Mechanics and Engineering Key Laboratory of Shaanxi Province, Xi’an 710048, China
*
Author to whom correspondence should be addressed.
Sustainability 2023, 15(12), 9280; https://doi.org/10.3390/su15129280
Submission received: 10 May 2023 / Revised: 5 June 2023 / Accepted: 6 June 2023 / Published: 8 June 2023
(This article belongs to the Special Issue Achieving and Communicating Sustainability in Geotechnical Design)

Abstract

:
The dry-wet cycle is an important factor that causes slope instability and foundation settlement in loess regions. In order to study the effects of the dry-wet cycle on the structure and shear strength of loess, isotropic compression tests and triaxial shear tests were carried out on loess with different numbers of dry-wet cycles. The results show that the dry-wet cycles mainly reduce the cohesion of loess, and the most obvious decline is after the first cycle; however, they have no effect on the angle of internal friction of loess. The structural yield strength and structural parameters of loess can represent the structure of loess well, which gradually decrease with the increase in the number dry-wet cycles and water content. The initial yield surface is approximately an ellipse, which gradually shrinks with the increase in water content and dry-wet cycles. The structure and cohesion of loess have similar changes, and there is an obvious exponential function relationship between them.

1. Introduction

Natural undisturbed soils have structures that are quite different from those of saturated remolded soils [1,2,3,4,5,6]. Many well-established theories and constitutive models have been developed on the basis of saturated remolded soils [7,8,9,10], but these models are not accurate in describing the mechanical properties of undisturbed soils, which is mainly caused by the structure of soils [11]. Therefore, in order to accurately describe the mechanical properties of undisturbed soils, the structure must be introduced into constitutive models. In 1974, Desai proposed the disturbed state theory [12], which provided an effective mathematical simulation method for the study of soil structure [13]. The disturbed state theory assumes that the internal microstructure of soil changes due to forces and transitions from an initial relatively intact state to a final fully adjusted state. The disturbance process is described by a disturbance function to simulate the constitutive relationship of soils [14,15,16,17,18,19]. Shen Zhujiang introduced the continuum damage theory into soil mechanics [20] and considered that the failure process of soil was the transition from undamaged soils to completely damaged remodeled soils. A damage function was used to describe this process, and a damage model of structured soils was established [21,22,23,24,25]. Li studied compression curves of undisturbed soils and saturated remodeled soils, described the structure changes in terms of volume hardening and deconstruction, and proposed a structured Cam Clay model [26,27,28,29], which has been widely used [30,31,32,33]. A modified-structure Cam Clay model for artificially structured clays was obtained based on this improvement [34,35]. Xie suggested that the study of mechanical effects of soil structure and its changes should be undertaken from the perspective of soil mechanics. A structural parameter-comprehensive structural potential was proposed to reflect the stability and variability of soil structure [36,37,38]. Based on this idea, other structural parameters have been proposed to quantitatively describe the soil structure changes during compression and shear [39,40,41,42,43,44]. Structural strength can also be used as a structural parameter to describe the structure of undisturbed soils [45,46,47], which is expressed by the inflection point stress of the isotropic compression curve or the peak stress of the difference curve between the stress–strain curves of undisturbed soil and remodeled soil. Some scholars have studied the changes in soil microstructure from a microscopic point of view and achieved fruitful results by establishing the connection between the microscopic structure and the macroscopic mechanical behavior of soils [48,49,50,51,52,53,54,55]. Obviously, there is no uniform standard for the quantitative description of soil structure. However, there are too many assumptions in the establishment of the disturbed state theory and damage theory, and the assumption of elliptical yield surface in Li’s volume hardening and deconstruction theory does not accord with the actual situation of structured soil. There are still difficulties in combining the micro-research method with engineering practice because of poor operability and the strong theory. As a strength characteristic of structured soil, structural strength cannot be used to describe the structure dynamically since it is only an important aspect of the structure, which is suitable for describing the structure in the case of isotropic compression. The comprehensive structural potential theory is entirely from the perspective of soil mechanics without too many assumptions and can dynamically describe the structure changes in the process of shear.
Loess is a kind of silty clay with large pores, incomplete consolidation, and collapsibility. Based on a large number of studies [56,57,58,59,60], undisturbed loess is observed to have the following remarkable properties:
(1)
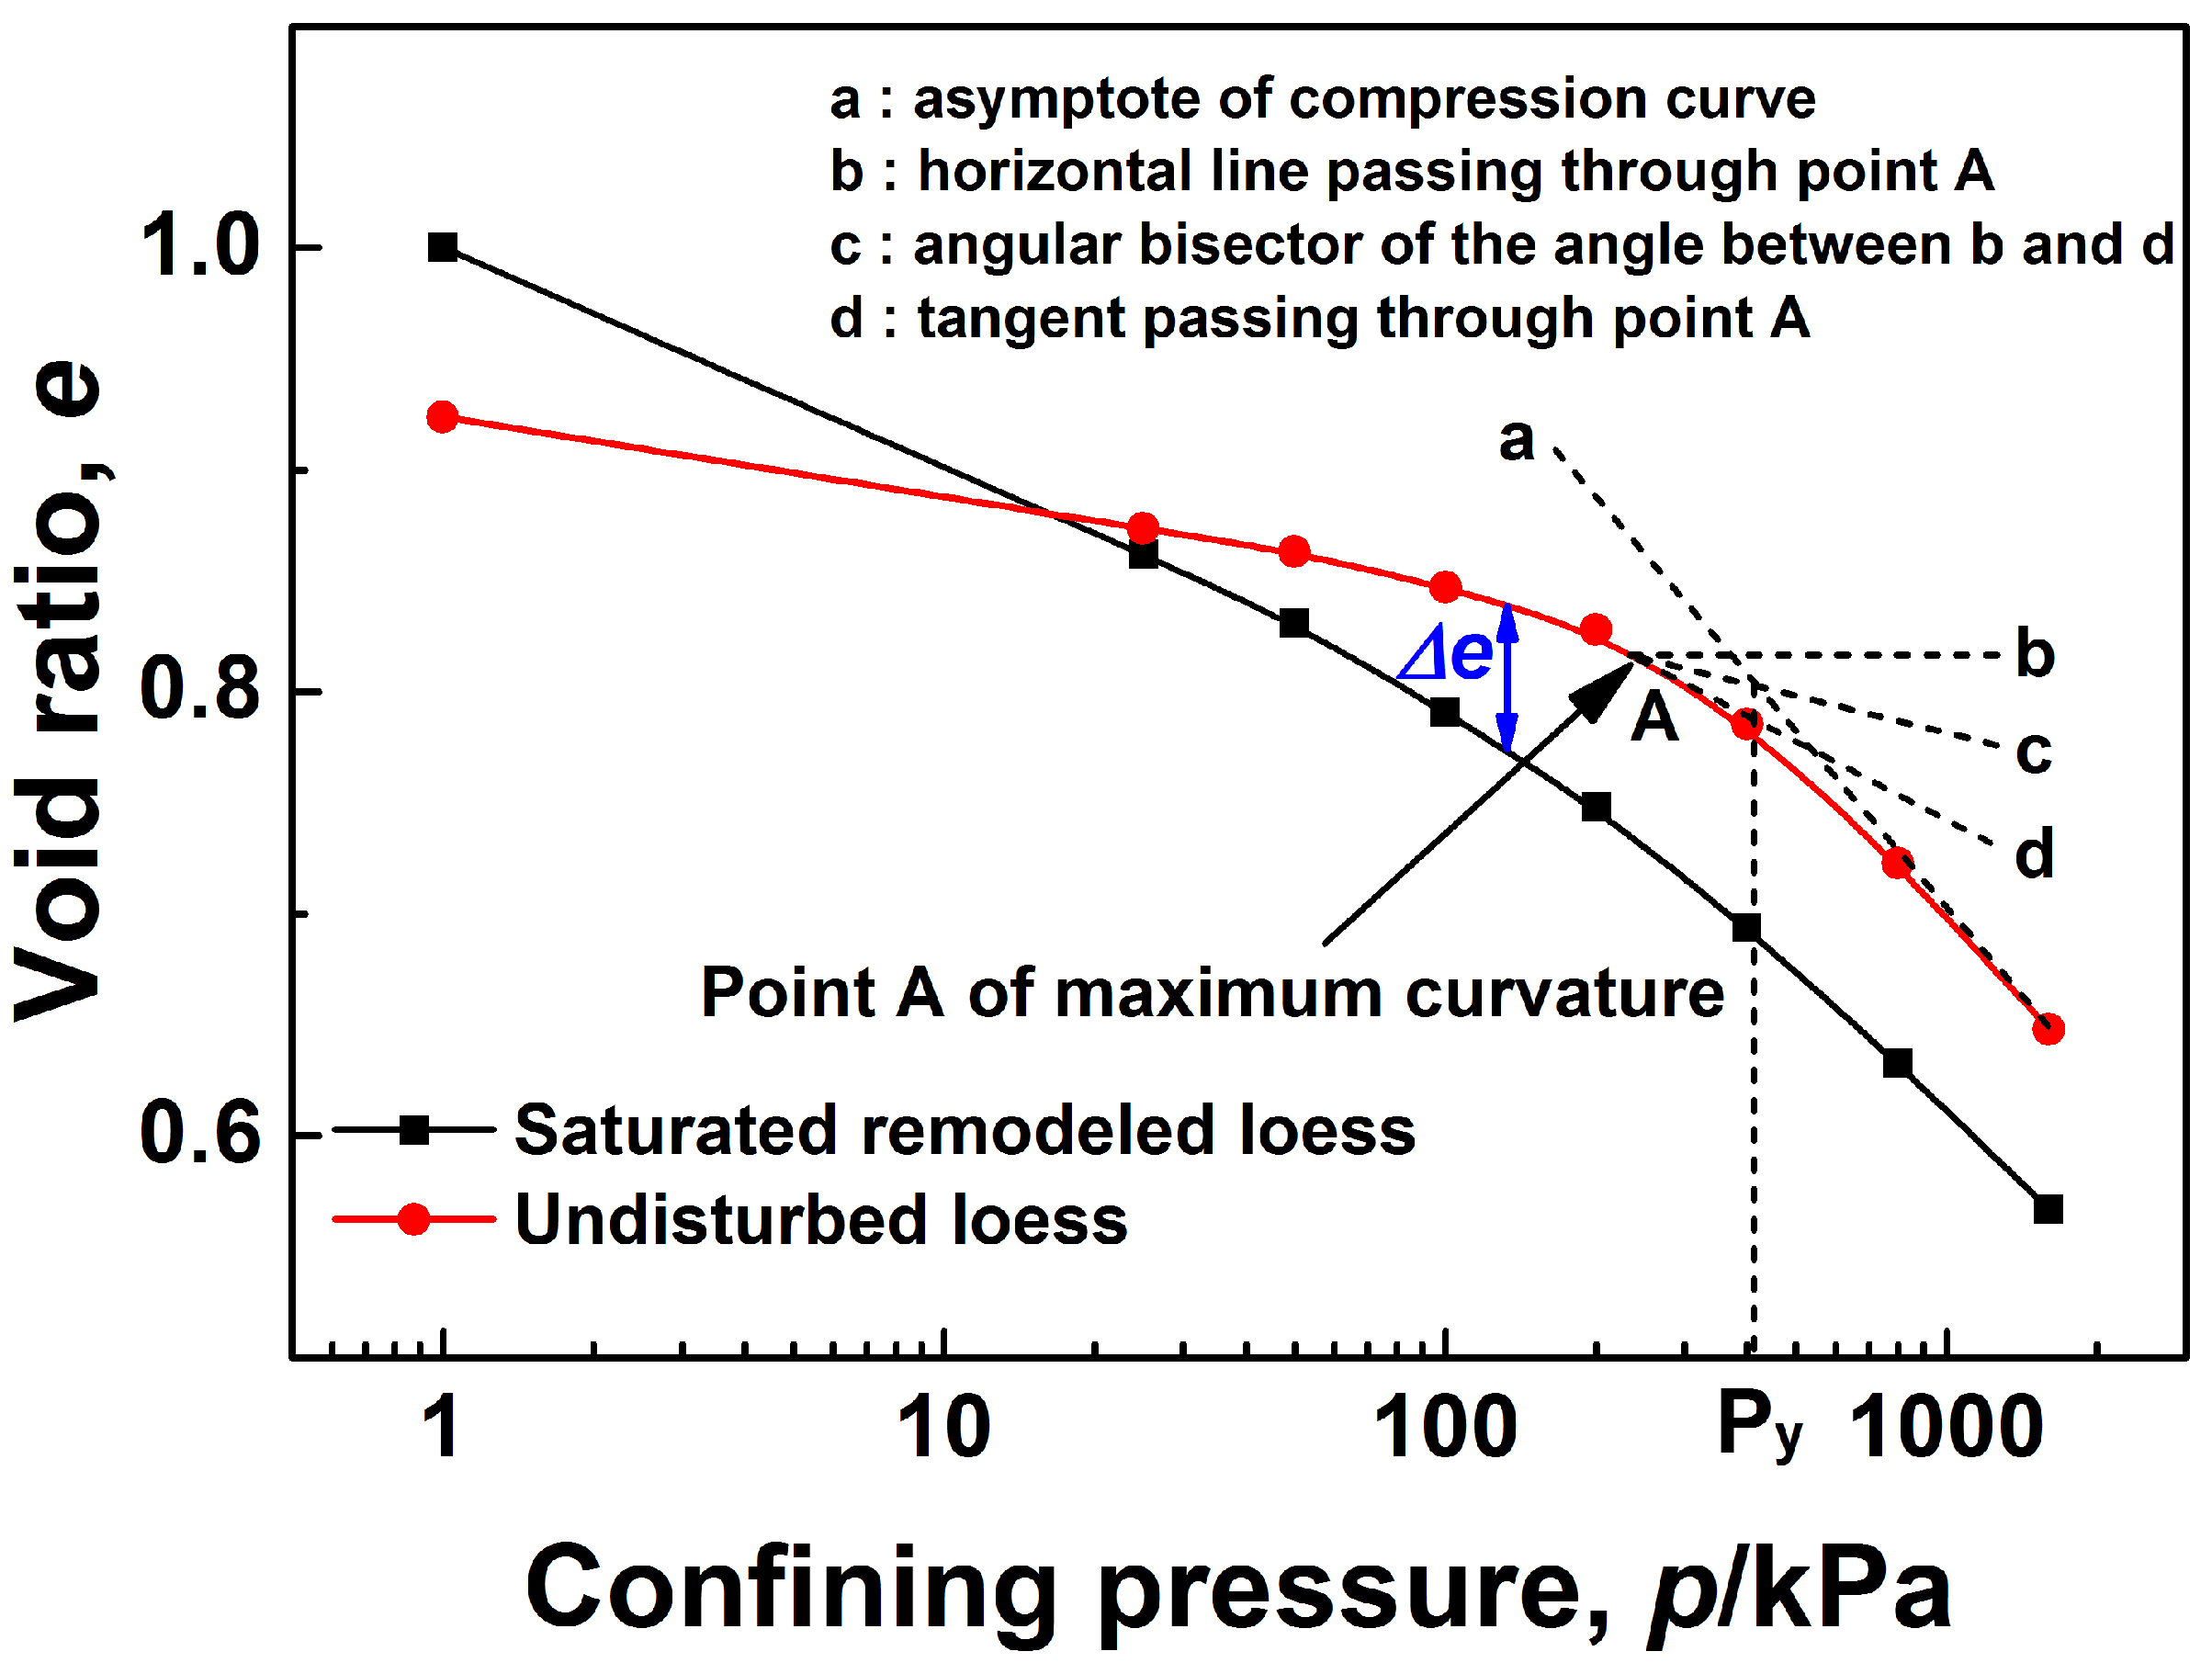
Undisturbed loess has structure. The relationship curves between void ratio (e) and confining pressure (p) are different for the isotropic compression tests of undisturbed loess and saturated remolded loess, as shown in Figure 1. The compression curves of undisturbed loess are higher than those of saturated remolded loess. Under the same confining pressure, the undisturbed loess has an additional void ratio (Δe). There is a yield stress in undisturbed loess. Before yield stress, undisturbed loess maintains its intact structure, and only elastic deformation occurs as the stress increases. When the stress exceeds the yield stress, with the increase in stress, the structure of undisturbed loess is rapidly destroyed, elastic–plastic deformation occurs, and the additional void ratio decreases gradually. Finally, the compression curve of the undisturbed loess tends to be the same as that of the remolded soil. The yield stress is the maximum stress that the intact structure can bear, so the yield stress is called the structural strength Py of undisturbed loess. There is a significant relationship between Py and the water content w of loess.
(2)
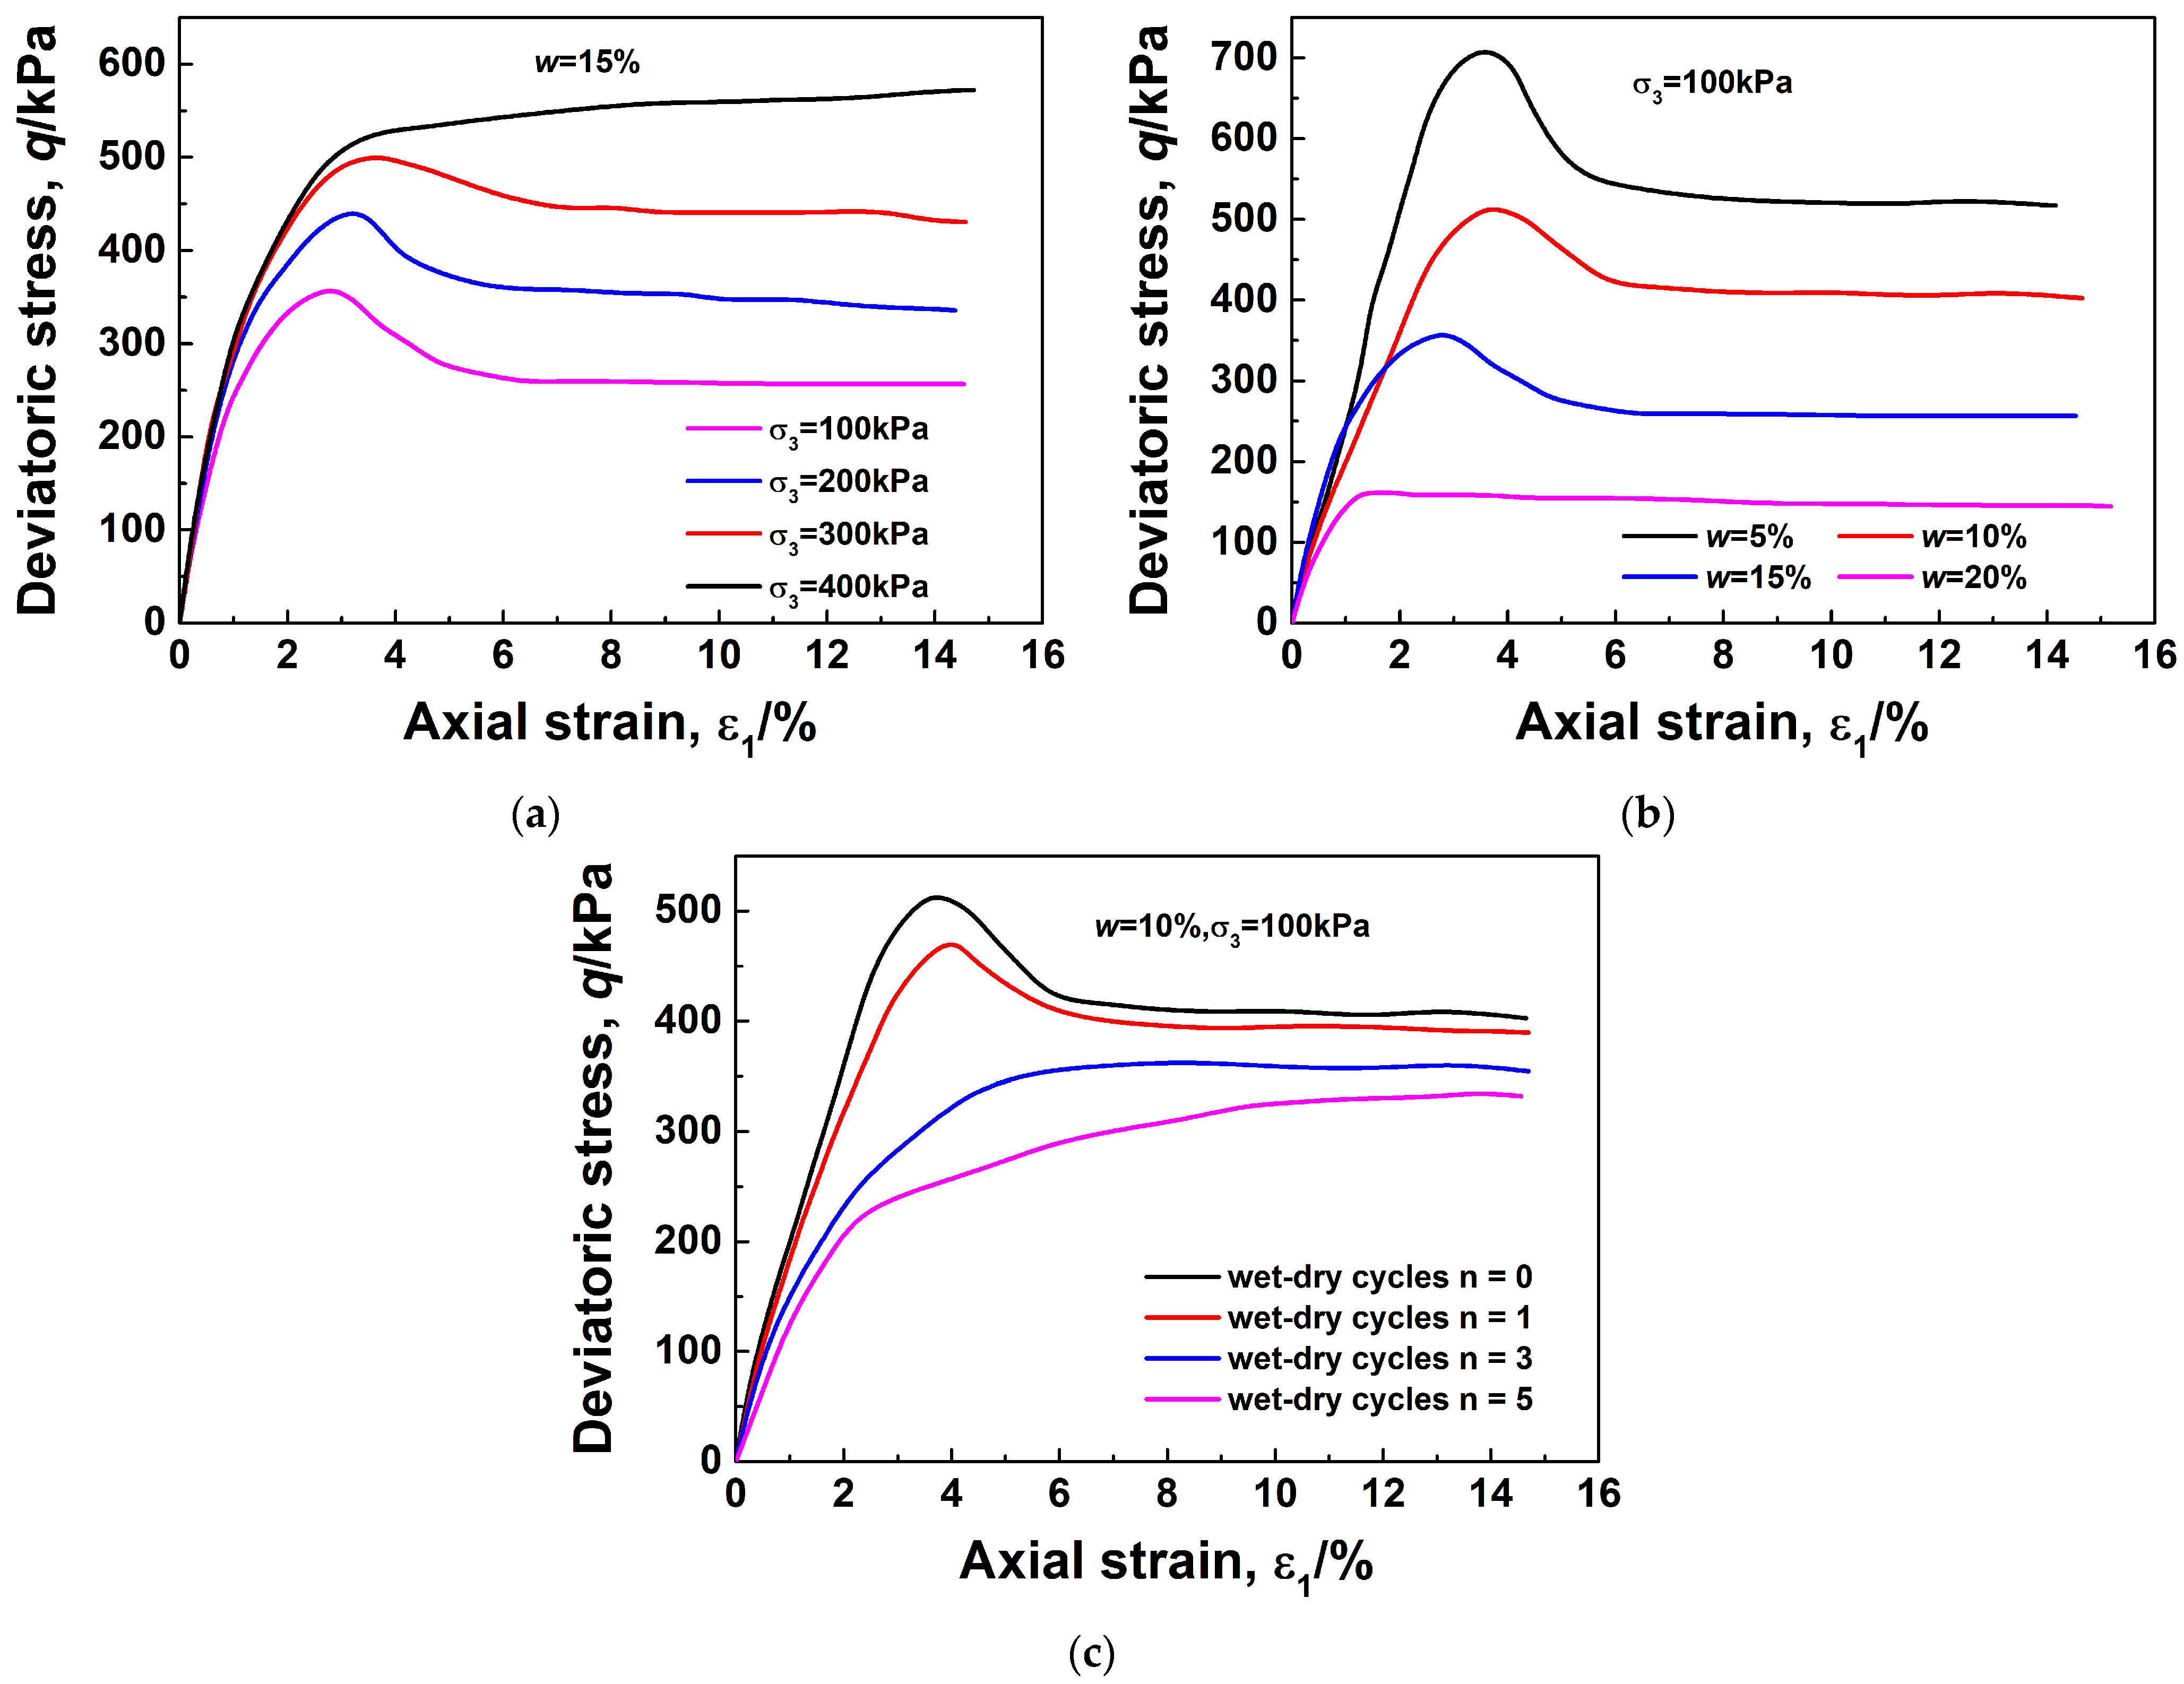
Due to the influence of structure, the stress–strain curves of undisturbed loess and remolded loess are obviously different in triaxial tests, as shown in Figure 2. The typical stress–strain curve of undisturbed loess is higher than that of remolded loess, and the stress decreases after reaching the peak value. With the development of shear strain, the stress–strain curves of the two kinds of loess samples tend to be the same [45,46].
Loess is widely distributed in arid and semi-arid areas of northwest China. Due to the cyclical changes of climate, loess is always in the alternating state of saturation and unsaturated under the dry-wet cycles of rainfall and evaporation; therefore, its physical and mechanical properties also change dynamically. After repeated dry-wet cycles, loess shows the characteristics of decreasing strength and increasing deformation, which have an important influence on the long-term stability of slopes, building foundations, and embankment projects in the loess region [61,62,63,64,65,66]. The structure of soils is a comprehensive reflection of the arrangement and connection characteristics of soil particles. Different arrangements and connection characteristics of soil particles make soils exhibit different mechanical properties. When soils are subjected to loading, disturbance, soaking, and other effects, the arrangement and connection characteristics change, and corresponding changes in strength, stiffness, and collapsibility occur. It is obvious that the mechanical properties of soil such as shear strength are the external performances of the internal structure of soil. It is necessary to combine the mechanical properties with the structure to establish the relationship between them. Some recent research supports this view [62,63,67]. However, this research mainly studies the soil structure from a microscopic or image perspective, which have a strong theory and cannot be popularized well. Moreover, some research results still have the disadvantages of greater dispersion and less regularity.
In this study, the deformation and yield characteristics of dry-wet cycle loess were studied by isotropic compression tests, and structural strength was used to describe the structure of loess under isotropic compression. Triaxial shear tests were carried out to study the variation law of shear strength of loess under dry-wet cycles. A structural parameter was proposed based on soil mechanics according to the theory of comprehensive structural potential to describe the structure of loess in the shear process. Based on the results of isotropic compression tests and triaxial shear tests, the variation in the initial yield surface of loess with the number of dry-wet cycles and water content was analyzed, and the relationship between the structure and shear strength was established. These research results are helpful to deepen our understanding of the relationship between the structure and mechanical properties of soil and can provide theoretical support for engineering construction and research in loess regions.

2. Materials and Methods

2.1. Materials and Preparation of Samples

The tested loess was obtained from Xi’an city, Shaanxi, China (Figure 3). Through a one-year observation of soil water content at different depths in the field, it was found that the soil at a depth of 0–0.5 m was most affected by the environment’s dry-wet changes and the effect at a depth of 3.0 m can be ignored. In order to eliminate the effect of dry-wet cycles of the environment on the soil samples, the depth of in situ samples taken was 3.0–4.0 m, and the size of samples was 40 cm × 40 cm × 40 cm. The basic physical indices of tested loess are given in Table 1.
The water content of the topsoil at the sampling site varies from 5% to 31% (saturated water content). In this study, in order to study the influence of dry-wet cycles on the structure and shear strength of loess and consider the influence of water content on the test results, test water contents w = 5%, 10%, 15%, 20%, and 31%, and dry-wet cycles n = 0, 1, 3, 5 are proposed. Previous studies [68] have shown that the mechanical properties of loess are affected by the amplitude of the dry-wet cycle, and the greater the amplitude of the dry-wet cycle, the more serious the deterioration of the mechanical properties of loess. Considering the most unfavorable conditions, the dry-wet cycle amplitude selected in this study is 5–31%.
Cylindrical undisturbed and remolded samples are required in this study. The diameter of the samples is 39.1 mm, the height is 80 mm, and the dry density is 1.33 g·cm−3. The dry density error is controlled within 0.03 g·cm−3 to exclude the effect of dry density on the experimental results. The undisturbed samples are cut and formed into a mold with a soil chipper. The residual soil is air-dried and crushed, passed through a 2 mm sieve, the water content is configured to 12.1%, and then the remodeled samples are compacted into five layers according to the dry density of 1.33 g·cm−3.
The dry-wet cycle test should be carried out on the prepared undisturbed samples. The samples need to be air-dried and vacuum-saturated during the experiment. The air-drying method involves evaporating the water of samples that need to reduce the water content under natural conditions and controlling the water content by continuously weighing the sample’s mass. When samples reach the required mass of the target water content, the samples are placed in the moisturizing cylinder for at least 48 h, and the surface and internal water content is uniform through the transfer of the water film. The vacuum saturation method involves placing the samples that need to be saturated into a vacuum barrel, sealing the vacuum barrel, using a suction device to pull out the air in the vacuum barrel, and continuing to pump air for 1 h when the internal pressure reaches −1 atm. Then, the inlet valve of the vacuum barrel is opened, distilled water is sucked in, the water surface is set to be higher than the samples, and the suction device is kept working for at least 2 h. This way, the samples reach the saturation state. Figure 4 shows the sample preparation process of 3 dry-wet cycles with a test water content of 15%. The water content of the sample is first reduced to 5%, then the sample is saturated by the method of vacuum saturation and the water content is reduced to 15% by the method of air drying, which is a cycle. This process needs to be repeated 3 times.

2.2. Experimental Methods

2.2.1. Isotropic Compression Test

In order to study the effects of dry-wet cycles on the deformation and yield characteristics of loess, isotropic compression tests were carried out on saturated remolded loess samples and undisturbed loess samples with different water contents and different dry-wet cycles. Table 2 gives the isotropic compression tests program. The water content of the test was 5%, 10%, 15%, 20%, and 31%, the dry-wet cycles were 0, 1, 3, and 5, and the confining pressure of the test was gradually increased from 25 kPa to 1600 kPa. The criterion for the completion of the consolidation stage is that no further volume deformation of the specimen and no further change in the expelled water volume are observed.

2.2.2. Triaxial Shear Test

In order to study the effects of dry-wet cycles on the structure and shear strength of loess, strain-controlled triaxial consolidation drainage shear tests were carried out. The test samples were undisturbed loess with dry-wet cycles and remolded loess without dry-wet cycles. The test water content was 5%, 10%, 15%, 20%, and 31%, and the dry-wet cycles were 0, 1, 3, and 5. The confining pressure of consolidation was controlled at 100 kPa, 200 kPa, 300 kPa, and 400 kPa, and the shear rate was 0.033%/min. The test was terminated when the axial deformation reached 12.5 mm. The specific test program is provided in Table 3.

3. Results and Discussion

3.1. Analysis of Isotropic Compression Test

The corresponding void ratio (e) was calculated according to the volume change of the samples under different isotropic compression stresses (p), and then the e-lgp compression curves were plotted. Figure 5a shows the compression curves of the undisturbed samples with different water contents and without dry-wet cycles. Figure 5b–f shows the compression curves of the undisturbed samples with different water contents after different dry-wet cycles.
Figure 5 indicates that the compression curve of the saturated remolded specimen is approximately a straight line in the semilog coordinates. With the increase in confining pressure, the samples are gradually compressed, and the void ratio decreases. The compression curves of the undisturbed samples are higher than those of the saturated remolded samples, with an obvious turning point. The compressive deformation develops slowly before the turning point and increases sharply after it with the decrease in Δe.
At the same confining pressure, with the increase in water content, the void ratio decreases, and the samples are gradually compacted. When the water content and confining pressure are unchanged, the void ratio decreases with an increase in the number of dry-wet cycles. The loose structure with large pores is the main characteristic of loess. Once the loess is soaked by water, the bound water film between soil particles thickens, and the matric suction decreases with the decrease in the curvature and strength of the contraction membrane. At the same time, the water absorption and expansion of clay cement will increase the particle spacing, reduce the bonding strength, and compress the large pores. These all lead to the occurrence of collapsibility [69,70,71]. Repeated dry-wet cycles lead to the failure of the clay cement under expansion and contraction, and the soluble salts are gradually lost from the particle bond, which all reduce the bond strength of loess particles. When the pressure exceeds the bond strength, it causes the collapse of the macropores. It can be seen that increasing the water content or the number of dry-wet cycles can improve the compressibility of the undisturbed loess samples under the same confining pressure.
The turning point of the compression curve of the undisturbed loess samples represents the yield stress under isotropic compression, called structural strength Py. It varies with water content and the number of dry-wet cycles, and can comprehensively represent the magnitude of the loess structure under isotropic stress conditions, but cannot represent its dynamic changes. The Casagrande method is used to calculate structural strength quantitatively and to study its variation rule. The Casagrande method is shown in Figure 1.
Table 4 and Figure 6 give the structural strength values in different cases. It is obvious that the structural strength of loess will be reduced either by increasing the water content or by increasing the number of dry-wet cycles. The values of structural strength reduction at all levels of water content caused by five dry-wet cycles are 410 kPa, 222 kPa, 191 kPa, 103 kPa, and 30 kPa, respectively. It can be seen that with the increase in water content, the effect of dry-wet cycles is weakened.

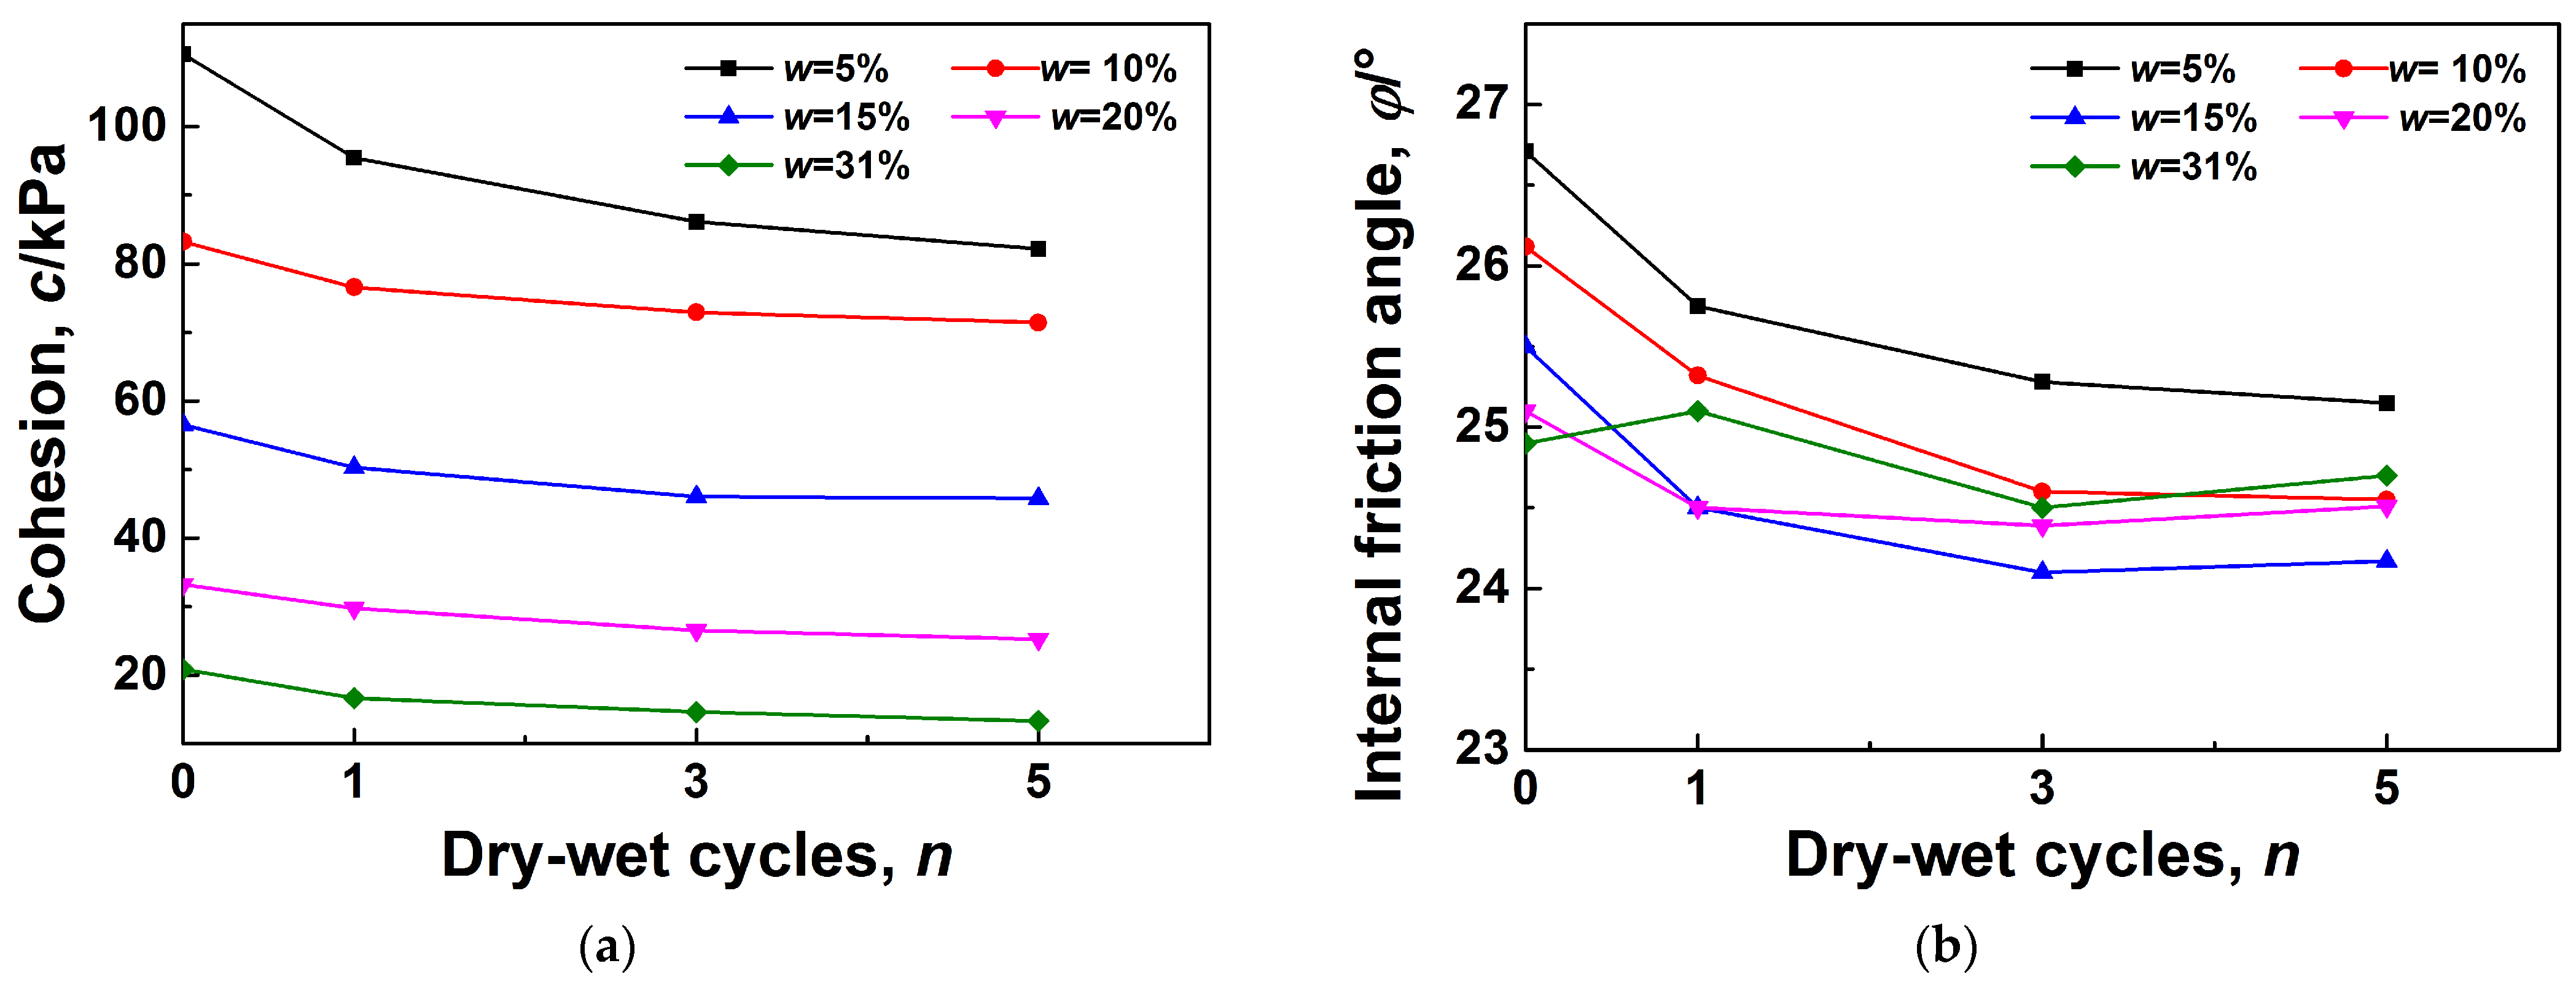
3.2. Analysis of Shear Strength of Loess under Dry-Wet Cycles

The shear strength τf of soils consists of two components, cohesion c and frictional resistance σtanφ, which can be expressed by Equation (1):
τ f = c + σ tan φ
where τf is the shear strength, c is the cohesion, φ is the internal friction angle, and σ is the normal stress.
The values of cohesion and internal friction angle under various water content and dry-wet cycles can be obtained by the stress–strain curves of the triaxial tests, and the results are shown in Table 5 and Figure 7.
It can be seen from Table 5 and Figure 7 that the increase in water content has a weakening effect on the shear strength of loess. With the increase in water content, the cohesion decreases rapidly, while the internal friction angle decreases insignificantly within two degrees. It can be considered that the internal friction angle is not affected by the water content. With the increase in the number of dry-wet cycles, the cohesion decreases, and the internal friction angle changes within 2 degrees, which can be considered to mean that the internal friction angle is not affected by the dry-wet cycles. When the water content is 5%, the cohesion decreases from 110.61 kPa to 95.46 kPa after one dry-wet cycle, with a decrease of 13.69%. After that, the cohesion continues to decline, but the rate slows down. After the third dry-wet cycle, the cohesion basically reaches stability, and after the fifth dry-wet cycle, the cohesion is 82.19 kPa, with a decrease in 25.69%. With the increase in water content in the test, the cn relationship curve gradually becomes flat, which indicates that the effect of dry-wet cycles on cohesion gradually decreases. In the saturated state, the cohesion decreases by only 4.2 kPa after the first dry-wet cycle and decreases by 7.58 kPa after the fifth dry-wet cycle.
The above analysis shows that in the process of dry-wet cycles of loess, the action of water can be regarded as a generalized force, and the dry-wet cycles process is actually a process of loading and unloading, which destroys the primary structure of the loess and causes the fatigue of the soil, resulting in a reduction in shear strength. During the dry-wet cycles, water mainly destroys the bond between soil particles, resulting in a decrease in cohesion. However, the dry-wet cycles process has little effect on the roughness of soil particles, so the internal friction angle does not change significantly.

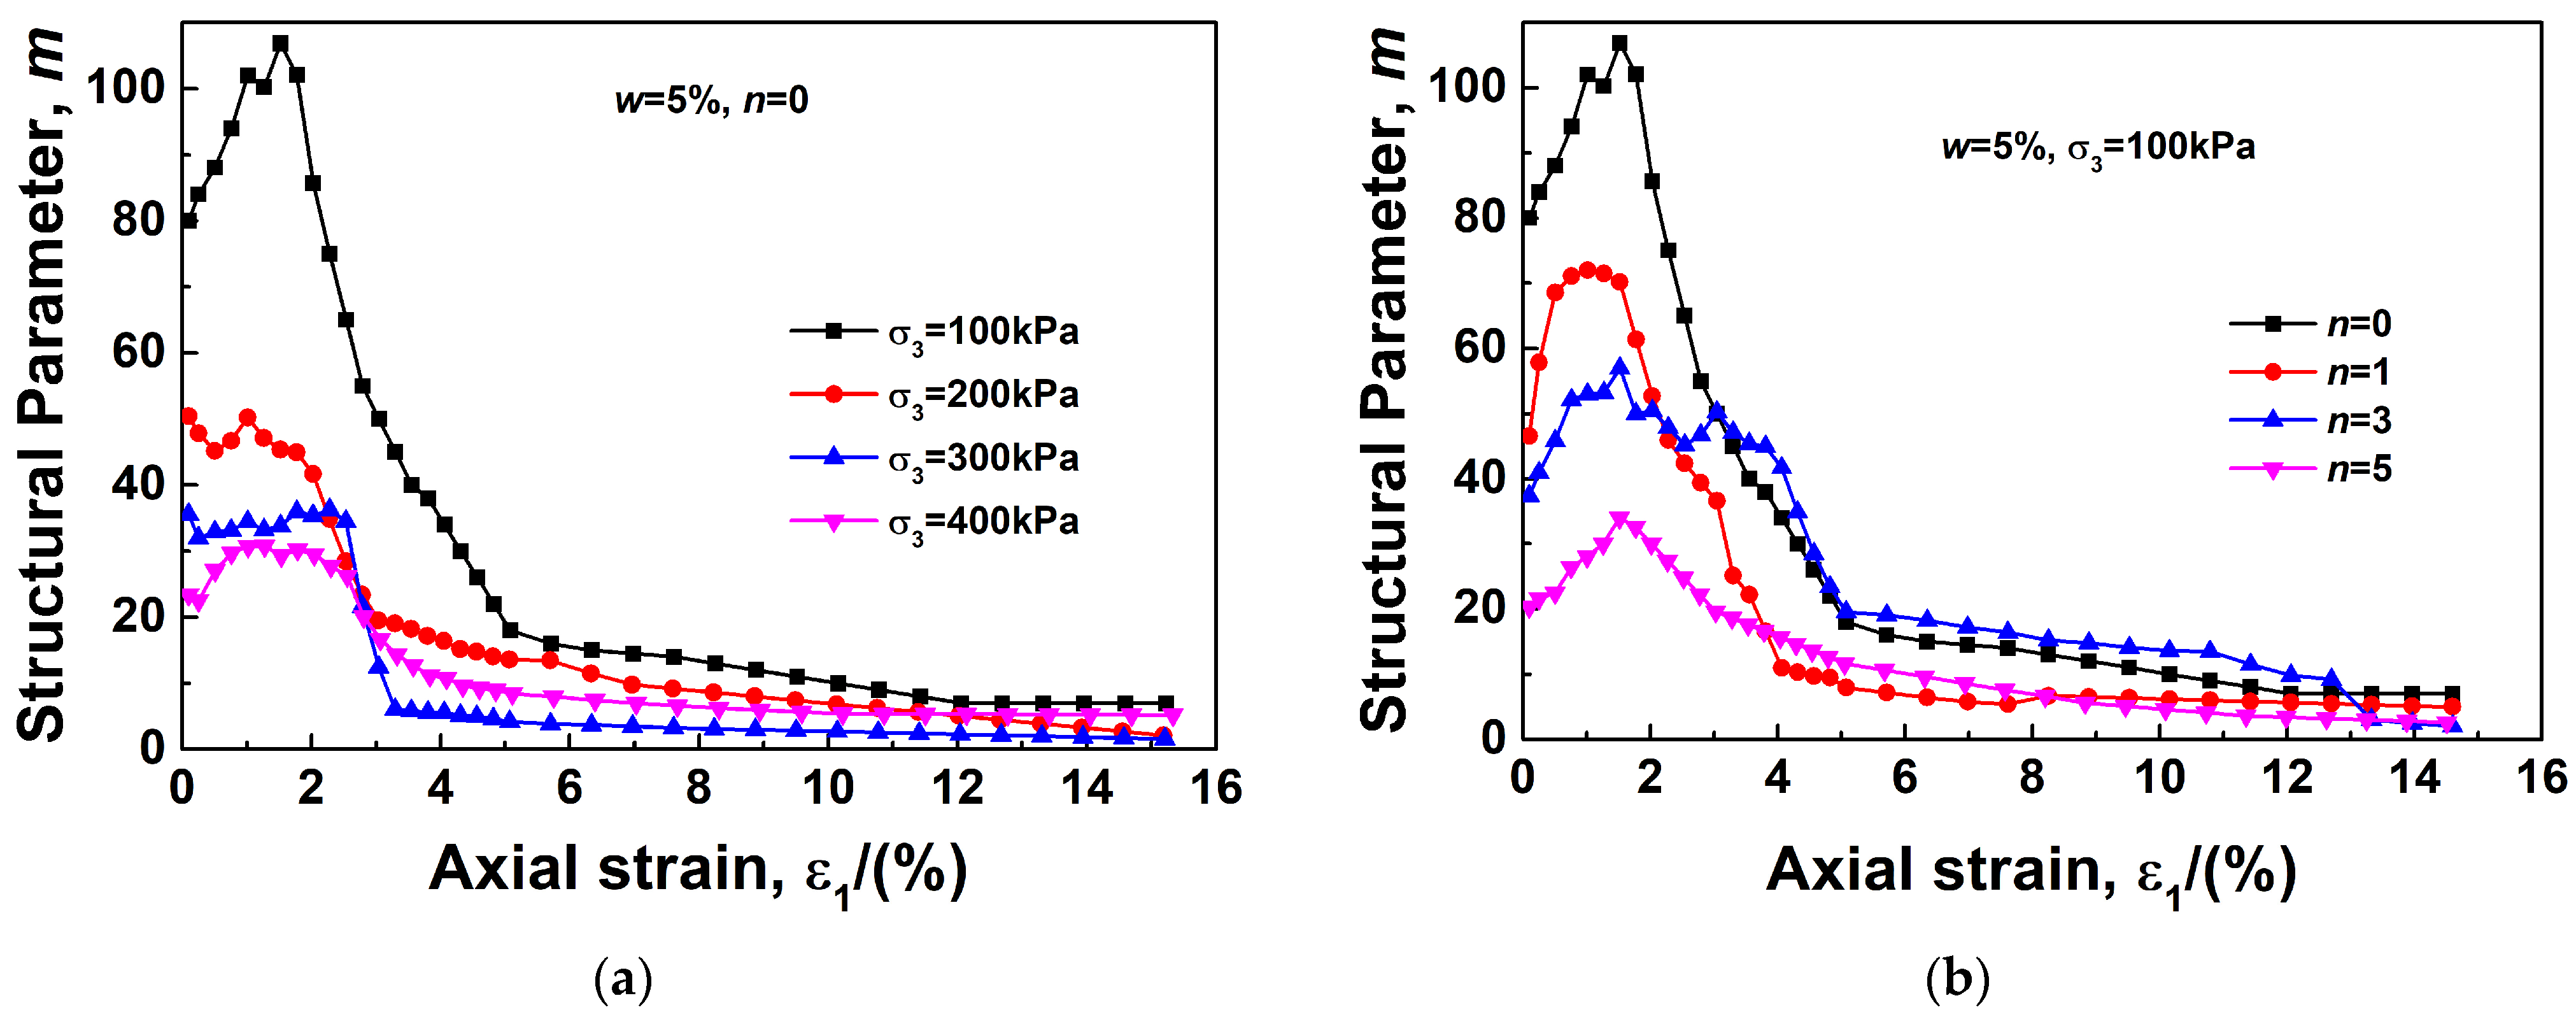
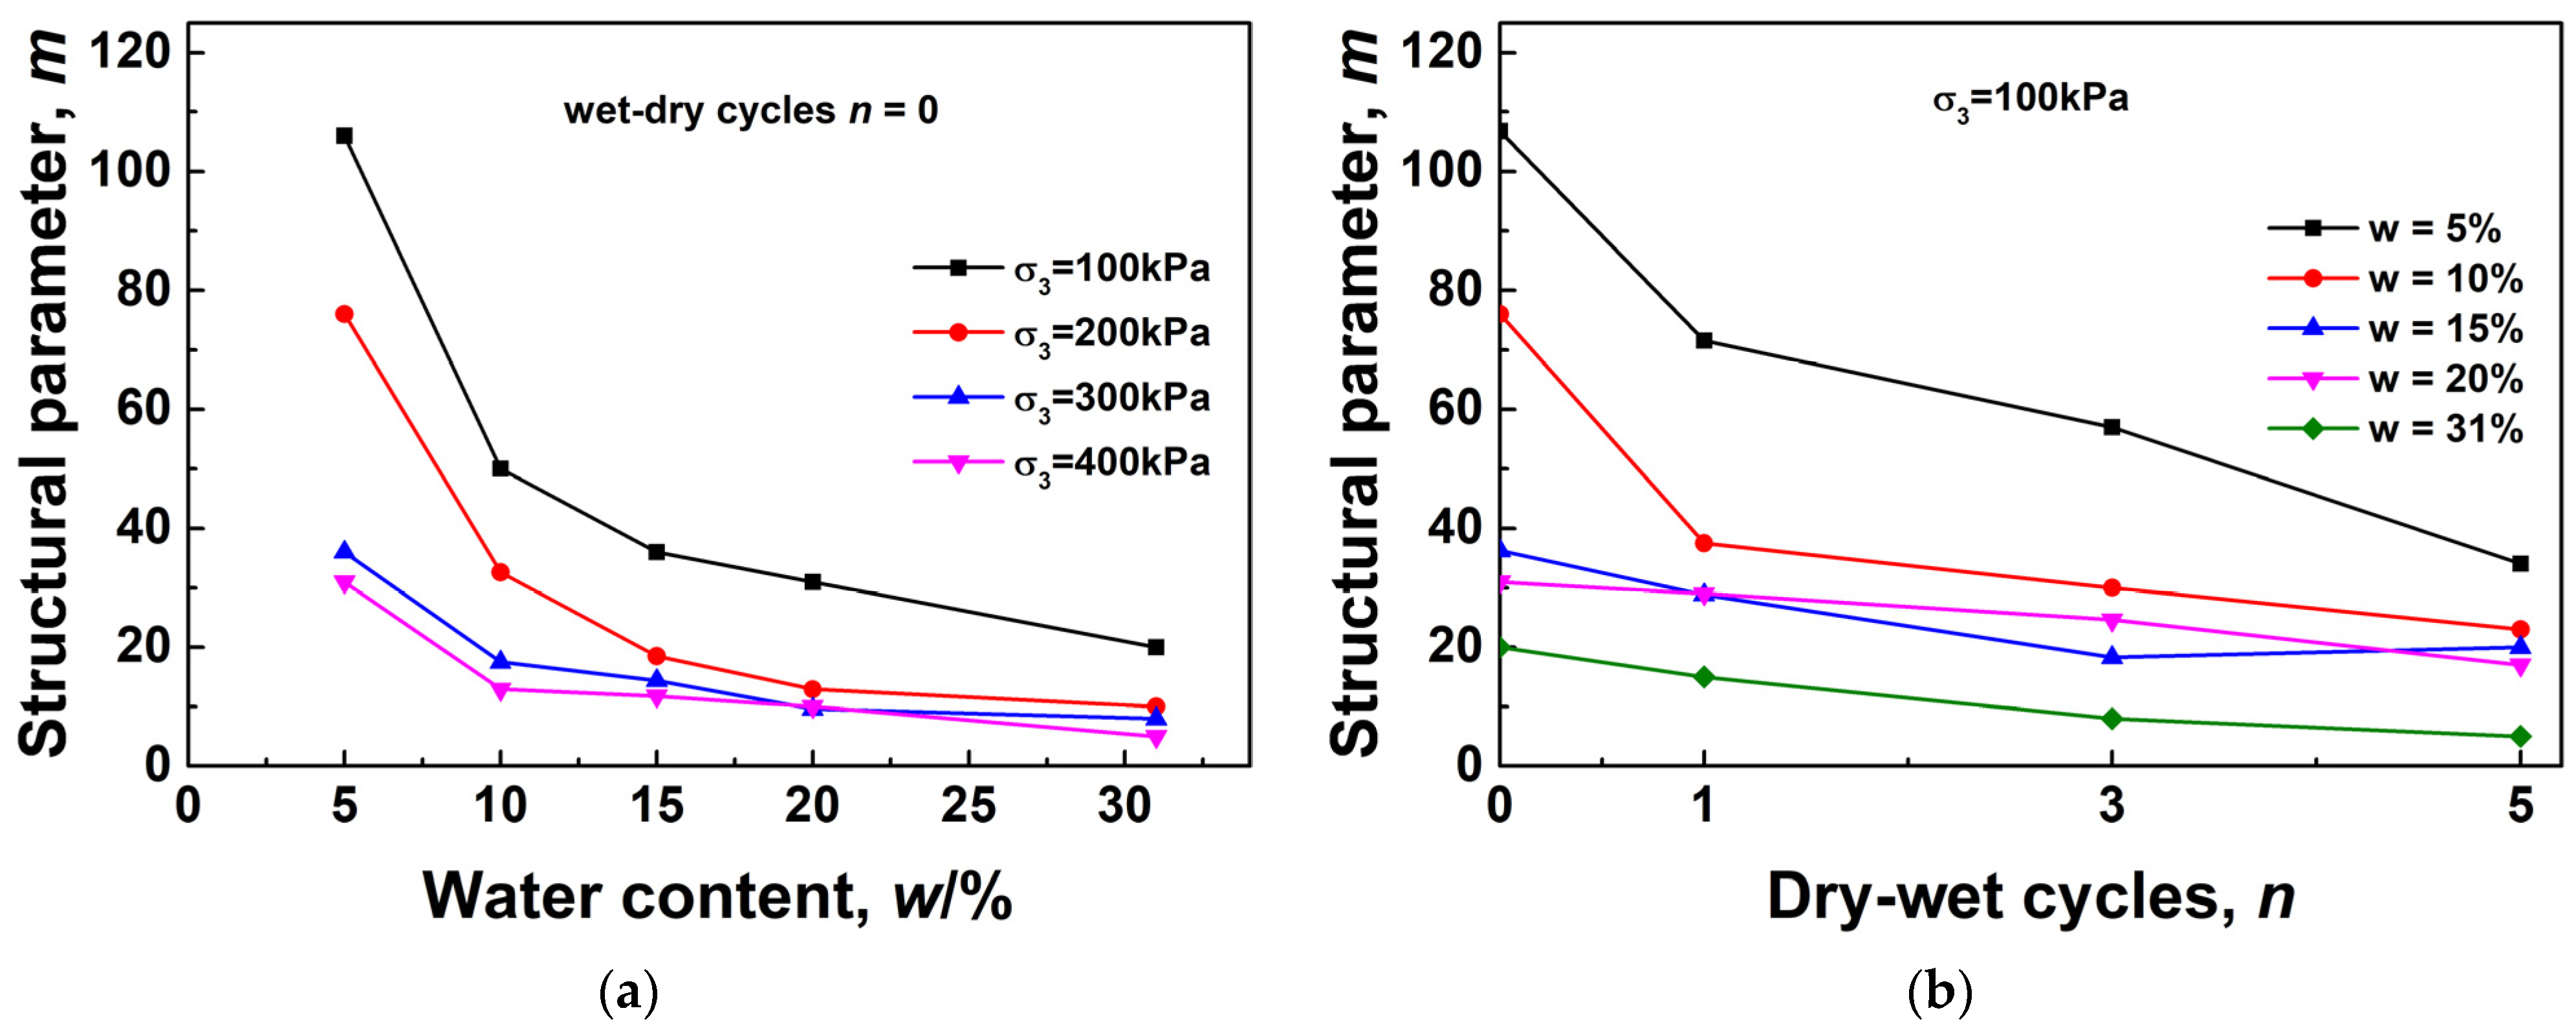
3.3. Analysis of Structural Parameters of Loess under Dry-Wet Cycles

Figure 8 shows the typical stress–strain curves of loess under different confining pressures, water contents, and dry-wet cycles. It can be seen from the figure that with the increase in confining pressure, water content, and dry-wet cycles, the stress–strain curves of loess transition from strain-softening to strain-hardening, that is, loess gradually changes from strong structured soil to weak structured soil. The above analysis is only qualitative, and then it is necessary to quantitatively describe the structure of loess in different states.

3.3.1. Description of Loess Structure

The structure of soils is caused by the arrangement and bond characteristics of soil particles, which is the fundamental difference between undisturbed soils and remolded soils. The bond characteristics between soil particles can maintain the arrangement characteristics of soil particles and produce small elastic deformations when the soil is loaded. However, once the bond between soil particles is weakened or lost, the arrangement characteristics of soil particles will be unstable, and large plastic deformation and loss of strength will occur. Based on the above analysis, the description of the structure should include two aspects: the ability to maintain the stability of the structure before the failure of the bond of soil particles (structural stability) and the ability to rapidly reduce the strength and greatly deform after the failure of the bond of soil particles (structural variability). A soil with a strong structure should have strong structural stability and strong structural variability.
The disturbance, loading, and soaking are the main reasons for weakening and breaking the bond between soil particles. Remodeling can destroy the bond and spatial arrangement of soil particles, destructure undisturbed soils, reduce the strength of soils, and reflect the role of structural stability compared with undisturbed soils. The saturation of undisturbed soils can eliminate the suction, dissolve the soluble salt, weaken the bond between soil particles, and increase deformation. Compared with undisturbed soils without saturation, the effect of structural variability can be fully reflected.
Based on the above understanding, according to the stress–strain curve in the case of a triaxial test, the principal stress difference of the undisturbed soils, remodeled soils, and saturated undisturbed soils can be obtained under the same strain and different structural states to reflect the structure changes under the action of disturbance, loading, and soaking. The following quantitative structural parameter can be defined:
m ( n ) = m 1 ( n ) m 2 ( n ) = ( σ 1 σ 3 ) y ( n ) / ( σ 1 σ 3 ) r ( σ 1 σ 3 ) s / ( σ 1 σ 3 ) y ( n ) = ( σ 1 σ 3 ) y ( n ) 2 ( σ 1 σ 3 ) r · ( σ 1 σ 3 ) s
where m ( n ) is the structural parameter for the dry-wet cycle n ; m 1 ( n ) is the structural stability of soils in the dry-wet cycle n ; m 2 ( n ) is the structural variability of soils in the dry-wet cycle n ; ( σ 1 σ 3 ) y ( n ) is the principal stress difference of undisturbed soils in the dry-wet cycle n ; ( σ 1 σ 3 ) r is the principal stress difference of remodeled soils; and ( σ 1 σ 3 ) s is the principal stress difference of saturated undisturbed soils.
It can be seen from the above equation that the greater the strength loss of the structured soil after saturation and remodeling, the greater the value of the structural parameter, which represents the larger the structure of the undisturbed soil. Therefore, m can be used as a quantitative parameter to describe the soil structure. With the development of strain, the structure of the undisturbed soil is gradually lost, and this parameter can reflect the dynamic change process of structure.
In critical state soil mechanics, the structural parameter m of unstructured saturated remolded soil always has a value of 1. Therefore, the value range of m is m ≥ 1.

3.3.2. Change Rule of Loess Structure

Through Equation (2), the structural parameters of loess in the process of triaxial shear are calculated, and the relationship curves between structural parameters and strain are given in Figure 9.
Figure 9 gives some of the test results for the structural parameter in the triaxial tests. It can be seen that as the shear proceeds, the values of structural parameters are constantly changing, with a pattern of first increasing and then decreasing as the strain increases, ultimately tending to a stable value.
The curves of structural parameters with the change in confining pressure for 5% water content and zero dry-wet cycles are given in Figure 9a. With the increase in confining pressure, the values of structural parameters under the same strain decreased, indicating that confining pressure had a destructive effect on the structure of loess. Figure 9b gives the curves of structural parameters with the number of dry-wet cycles at a water content of 5% and a confining pressure of 100 kPa. With the increase in dry-wet cycles, the loess bond was damaged under repeated expansion and contraction, resulting in structure damage and a decrease in the structural parameter values under the same strain.
The variation curves of the structural parameter with water content for zero dry-wet cycles with a confining pressure of 100 kPa are given in Figure 9c. With the increase in water content, the values of structural parameters under the same strain decrease, indicating that increasing water content causes soluble salt dissolution, weakening of particle bonds, and destruction of the structure. The increase in confining pressure, water content, and number of dry-wet cycles will cause a reduction in the structure of the loess, which is consistent with the results depicted in Figure 8.
The growth before the peak of the structural parameter curve reflects the continuous development of the structure with an increase in axial strain. After the structural parameter reaches its peak, the bond between soil particles begins to be damaged, the arrangement of soil particles is readjusted, the soil structure is damaged and begins to yield, plastic deformation occurs, and the structural parameter decreases rapidly. When shear continues, the particle bond is completely destroyed, the particle arrangement reaches stability, the soil reaches a critical state, the undisturbed soil reaches a remodeled state, and the structural parameter tends to 1. Therefore, the peak structural parameter can represent a complete state of loess structure, and the corresponding stress state is the initial yield stress state of loess under triaxial shear.
Figure 10 shows the curves of the peak structural parameters of loess with the variation of the surrounding pressure, water content, and the number of dry-wet cycles. The peak structural parameters of the loess gradually decrease with the increase in these three parameters, which is consistent with the results of the above analysis.

3.4. Initial Yield Characteristics of Loess

As has been analyzed above, with the progress of shear, the undisturbed loess eventually reaches the same critical state as the remodeled loess, and the dry-wet cycles will not affect the critical state. Now, the critical stress state of the remodeled loess in the triaxial test is drawn into the p-q coordinate system, and the critical state line of the remodeled loess under different water contents is fitted, as shown in Figure 11.
The position of the critical state line of loess is related to the water content. The critical state lines of loess with different water content are parallel to each other, with slope M = 0.984. The critical state line of saturated loess passes through the origin, and as the water content decreases, the critical state line is shifted to the left. The intersection with the p-axis is denoted by P0. The variation of P0 with water content is shown in Figure 12. It can be approximated as a straight line.
Taking 5% water content and 0–5 dry-wet cycles as an example, the yield stress states of isotropic compression and triaxial shear are plotted into the p-q coordinate system. It is found that these points all fall on an ellipse with P0 and Py as endpoints, and the critical state line passes through the vertex of the ellipse (Figure 13). At constant water content, Py decreases continuously with the dry-wet cycles, and the initial yield surface shrinks. Given that P0, Py, and the critical state line are constantly changing with water content, the initial yield surface will also be constantly changing with water content. The dynamic change of the initial yield surface with the water content and the number of dry-wet cycles is a specific reflection of the structure change of loess with the environment. The increase in water content and dry-wet cycles will make the loess enter the yield state earlier and produce plastic deformation.

3.5. Limitations of Tests and Analysis Methods

Both the isotropic compression tests and the triaxial shear tests adopted isobaric consolidation, which was not consistent with the actual stress condition of the undisturbed loess and did not consider the influence of stress-induced anisotropy on the soil structure. Confining pressure σ2 = σ3 was controlled in the triaxial shear test without considering the influence of intermediate principal stresses. The structural parameter used in this study can only describe the structure changes of loess in the shear process and cannot describe the structure changes of loess in the consolidation process. Moreover, the volumetric strain of remolded soil, undisturbed soil, and saturated undisturbed soil is not the same in the consolidation process. All of the above issues will have an impact on test results and analysis, but these impacts cannot be evaluated and require further study.

4. Relationship between Structure and Shear Strength of Loess

The magnitude of structure under isotropic stress conditions can be expressed by the structural strength Py. Under triaxial shear conditions, the structural parameter is a variable quantity that can represent the dynamic change of the structure with the development of confining pressure and axial strain during shear. Therefore, in this paper, we study the relationship between the structural strength Py and the cohesion c, and the relationship between the average value of the maximum structural parameters m ¯ under different confining pressures and the cohesion c.
With the increase in water content and the number of dry-wet cycles, the particle bond of loess is gradually weakened or even destroyed, the particles are rearranged, and the structure of soil is decreased, which, in turn, causes a change in the cohesion of loess. The change in the structure and cohesion of loess has the same inducement, so there must be a relationship between them.
Figure 14, Figure 15 and Figure 16 show the relationship between cohesion c, structural strength Py, and the average structural parameter m ¯ with the water content and the number of dry-wet cycles. From the figures, it can be found that these three parameters have the same variation rules. Compared with the dry-wet cycle, the cohesion c, the structural strength Py, and the average structural parameter m ¯ are more significantly affected by the water content. The effect of the dry-wet cycle is more intense at low water content, and the effect decreases with the increase in water content.
The relationship between the loess structure and cohesion is shown in Figure 17 under isotropic compression and triaxial shear conditions. It can be seen that the relationship between the structural strength Py, the average structural parameter m ¯ , and the cohesive force c is independent of the water content and the number of dry-wet cycles.
The relationships expressed in Figure 17 meet the exponential function as in Equation (3):
y = y 0 + A exp ( ( x + x 0 ) / t ) ,
Table 6 lists the specific parameter values.
Based on the above analysis, the structural strength and average structural parameters of loess have a direct correlation with cohesion, while the water content and the number of dry-wet cycles are only external factors.

5. Applications of Study Results

From the above research results, the influence of dry-wet cycles on the structure and shear strength of loess with different water contents is obtained. Notably, there are several practical applications for this research. First, the research results on the shear strength of loess are very important for the evaluation of the long-term strength of loess foundations, slopes, etc., which can be used as the basis for the design of such engineering projects or future stability prediction and safety warnings. When the influence of the amplitude of dry-wet cycles is taken into account, it can also be used as the basis for the progressive failure of loess. In addition, the structure of loess can be used as an index to evaluate the sudden occurrence of engineering accidents. Soil with strong structure will cause a sharp decline in strength and a sharp increase in deformation after structural failure, and the dry-wet cycle will reduce this sudden occurrence, but it should also be combined with the reduction in strength for comprehensive analysis. For specific engineering projects, if the water content of loess is low, the negative effects of dry-wet cycles should be fully considered, while for loess with a high water content, the effects of cycles can be ignored.

6. Conclusions

In this study, the influence of dry-wet cycles on the structure and shear strength of loess were studied through isotropic compression tests and triaxial shear tests. The main conclusions are as follows:
(1)
The dry-wet cycle reduces the cohesion c of loess, and the decrease degree is the greatest after the first dry-wet cycle, while the effect on the internal friction angle φ is negligible. In the case of low water content, the dry-wet cycle effect is obvious, but with the increase in water content, the effect weakens.
(2)
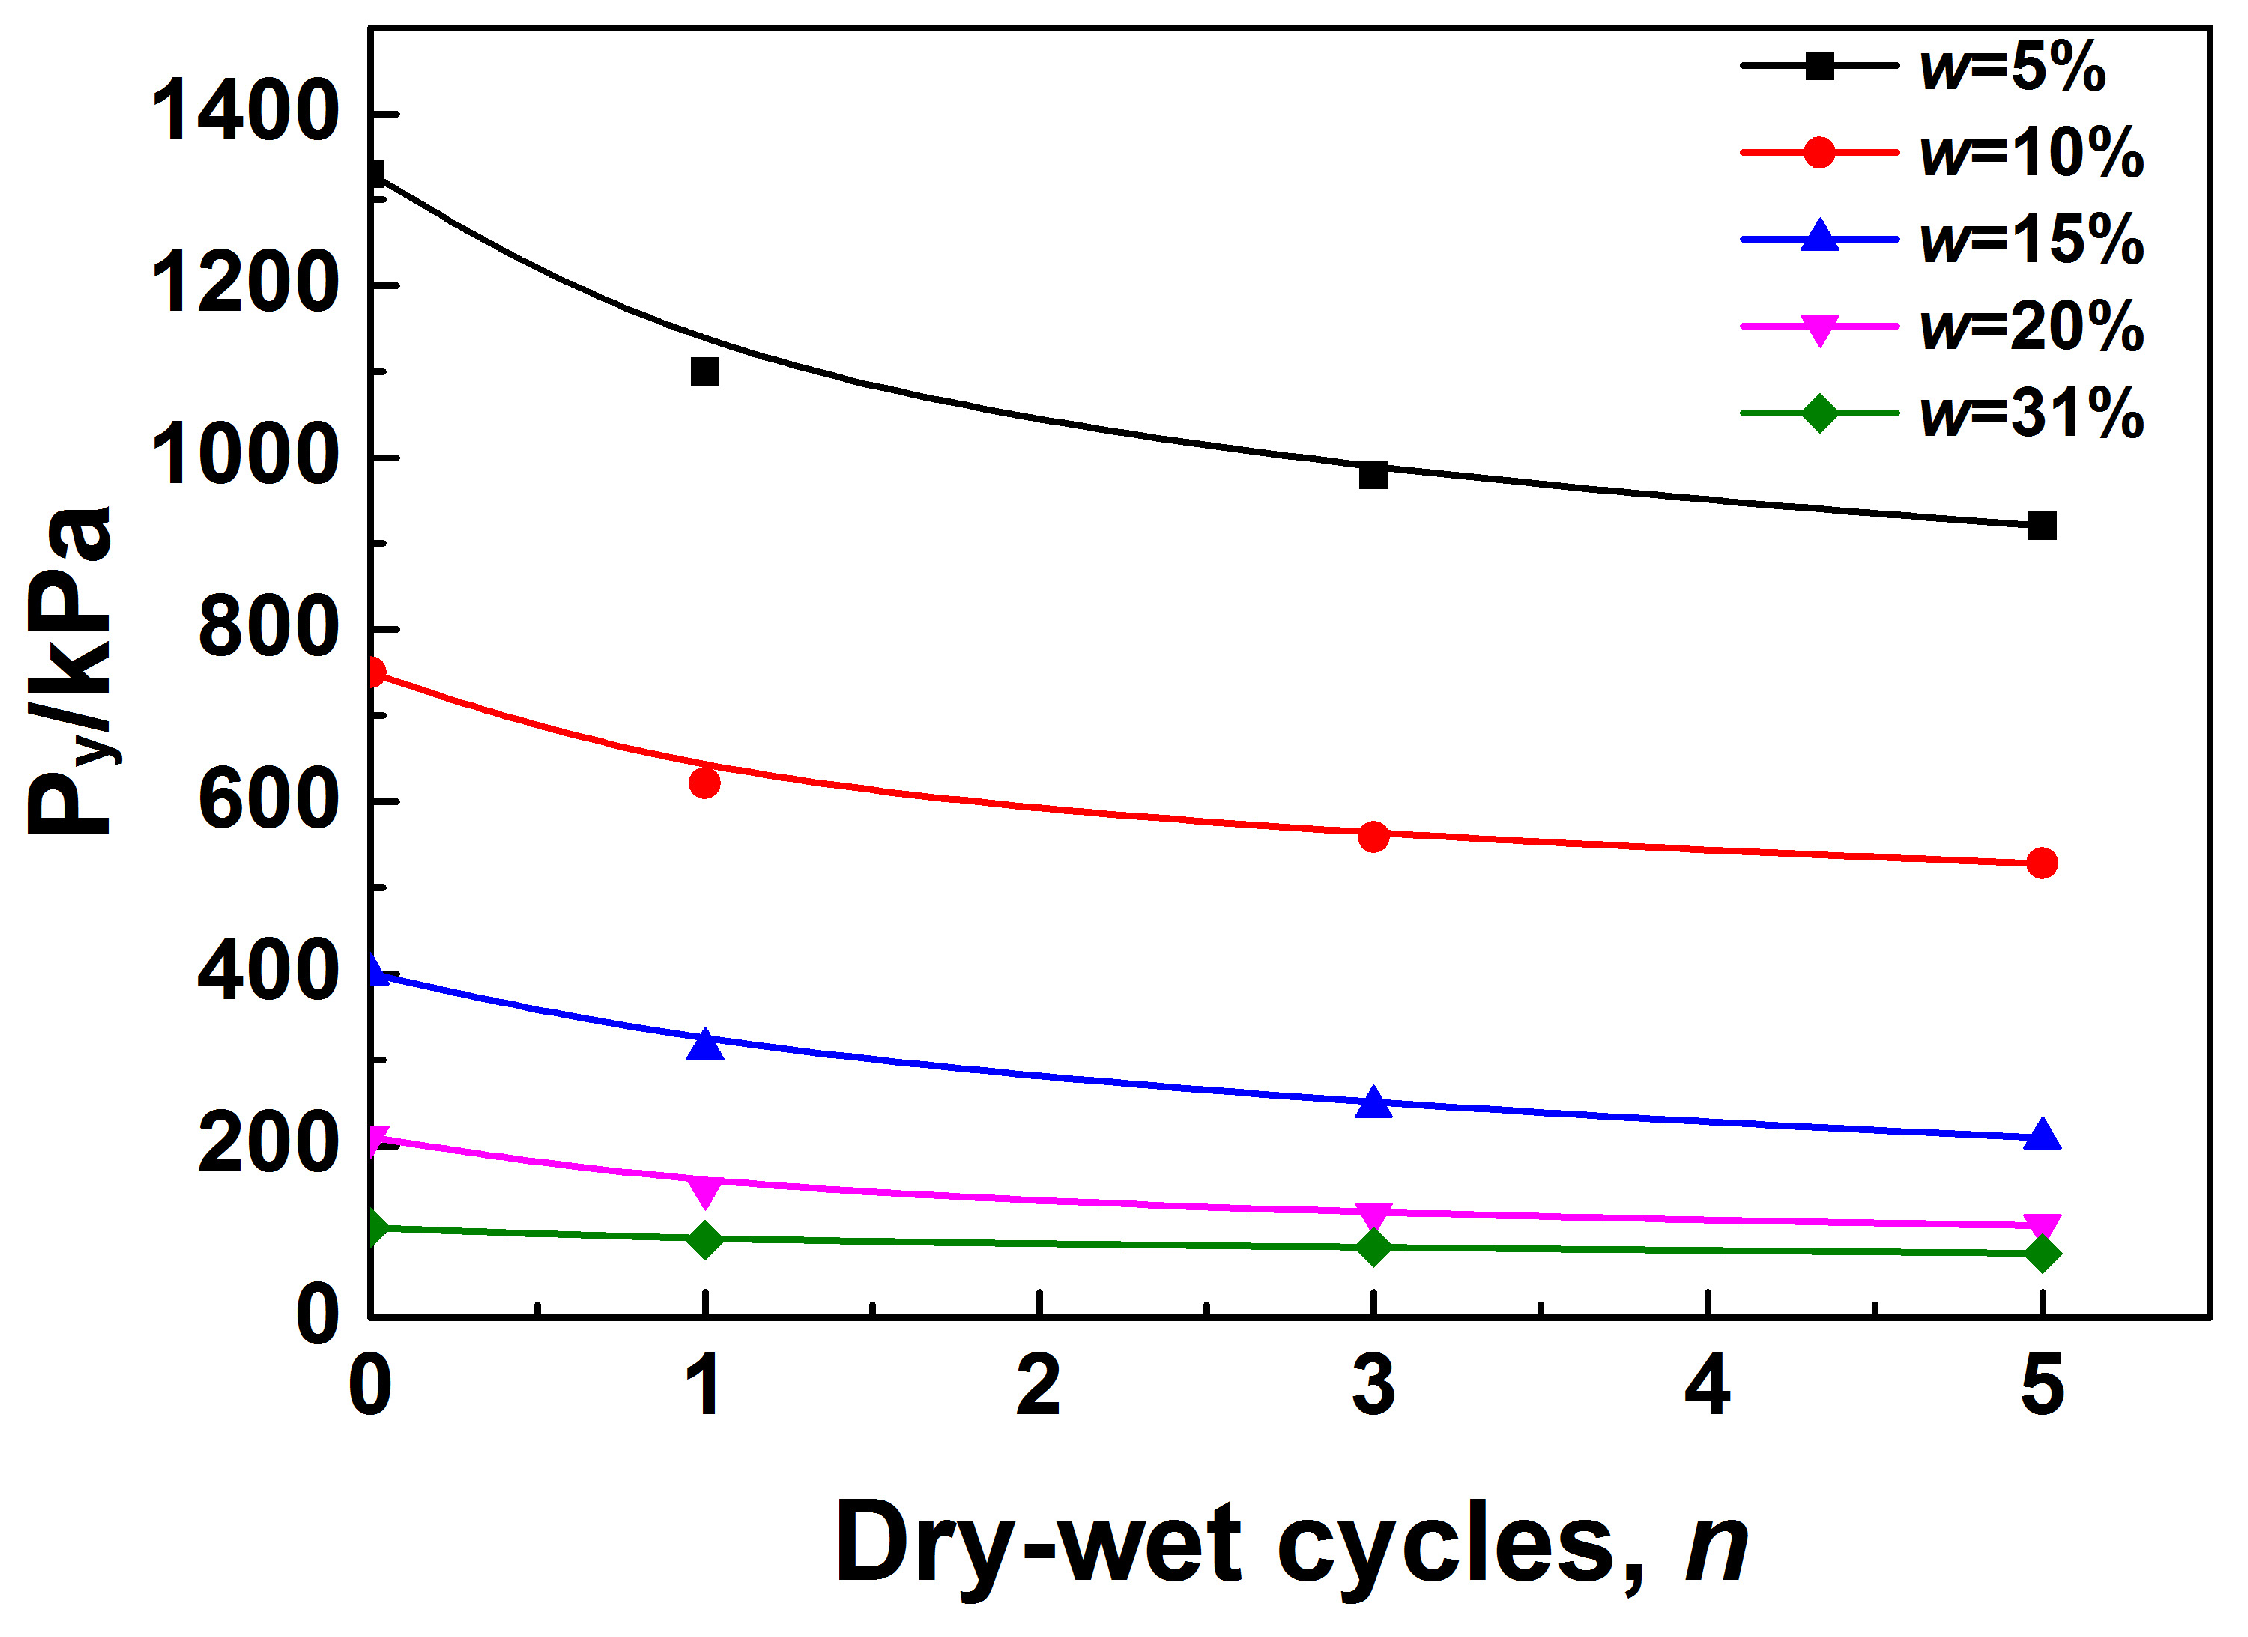
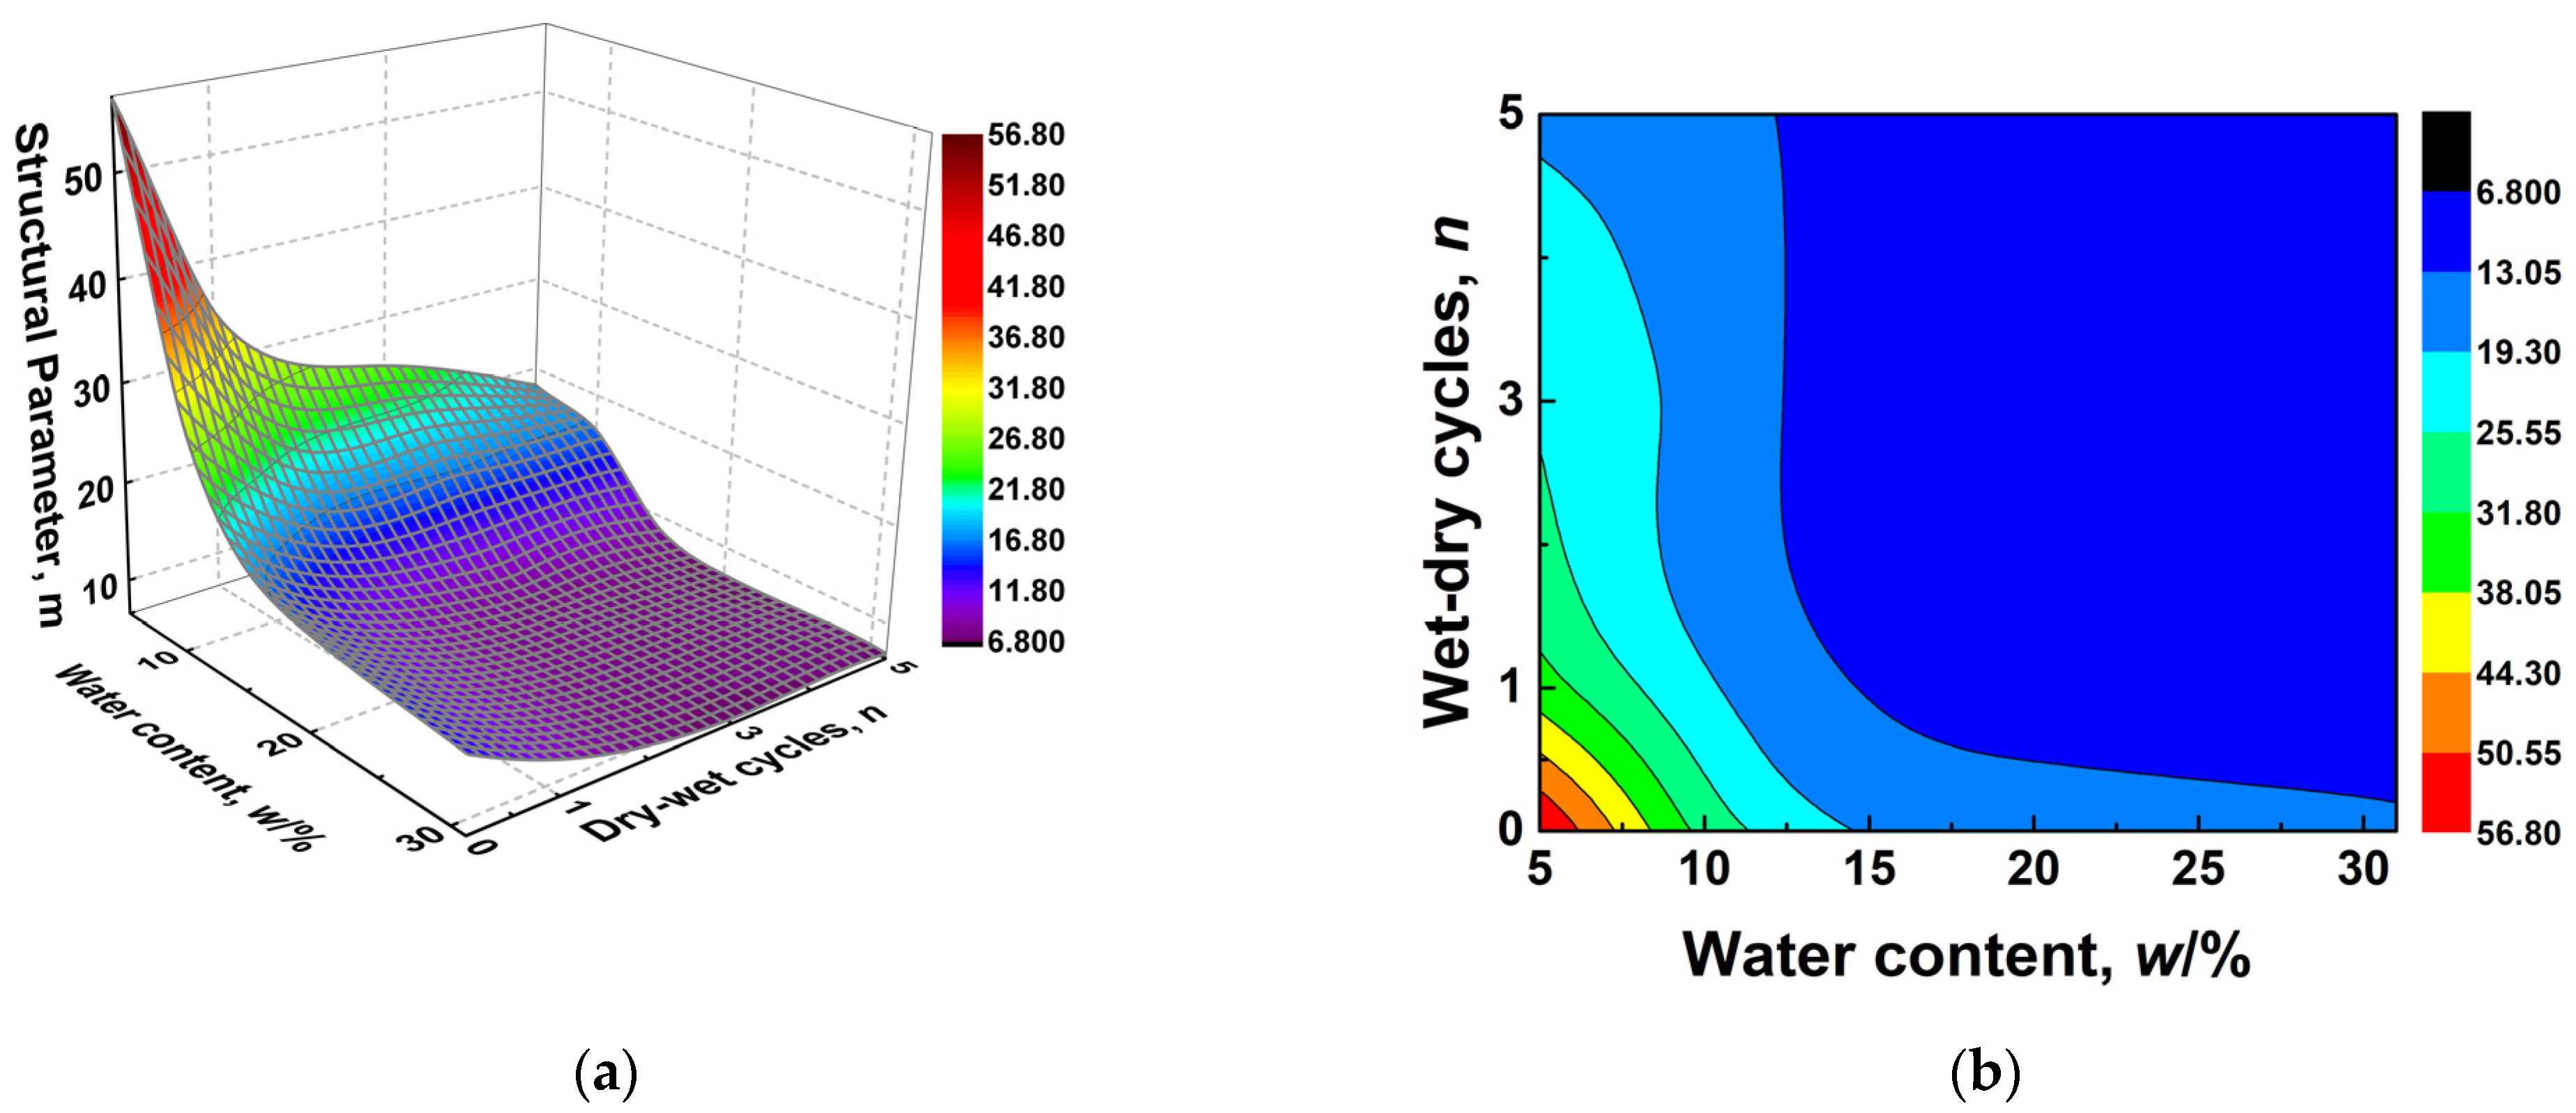
The structural strength Py and structural parameter m can represent the structure of loess well; both decrease with increasing water content and dry-wet cycles.
(3)
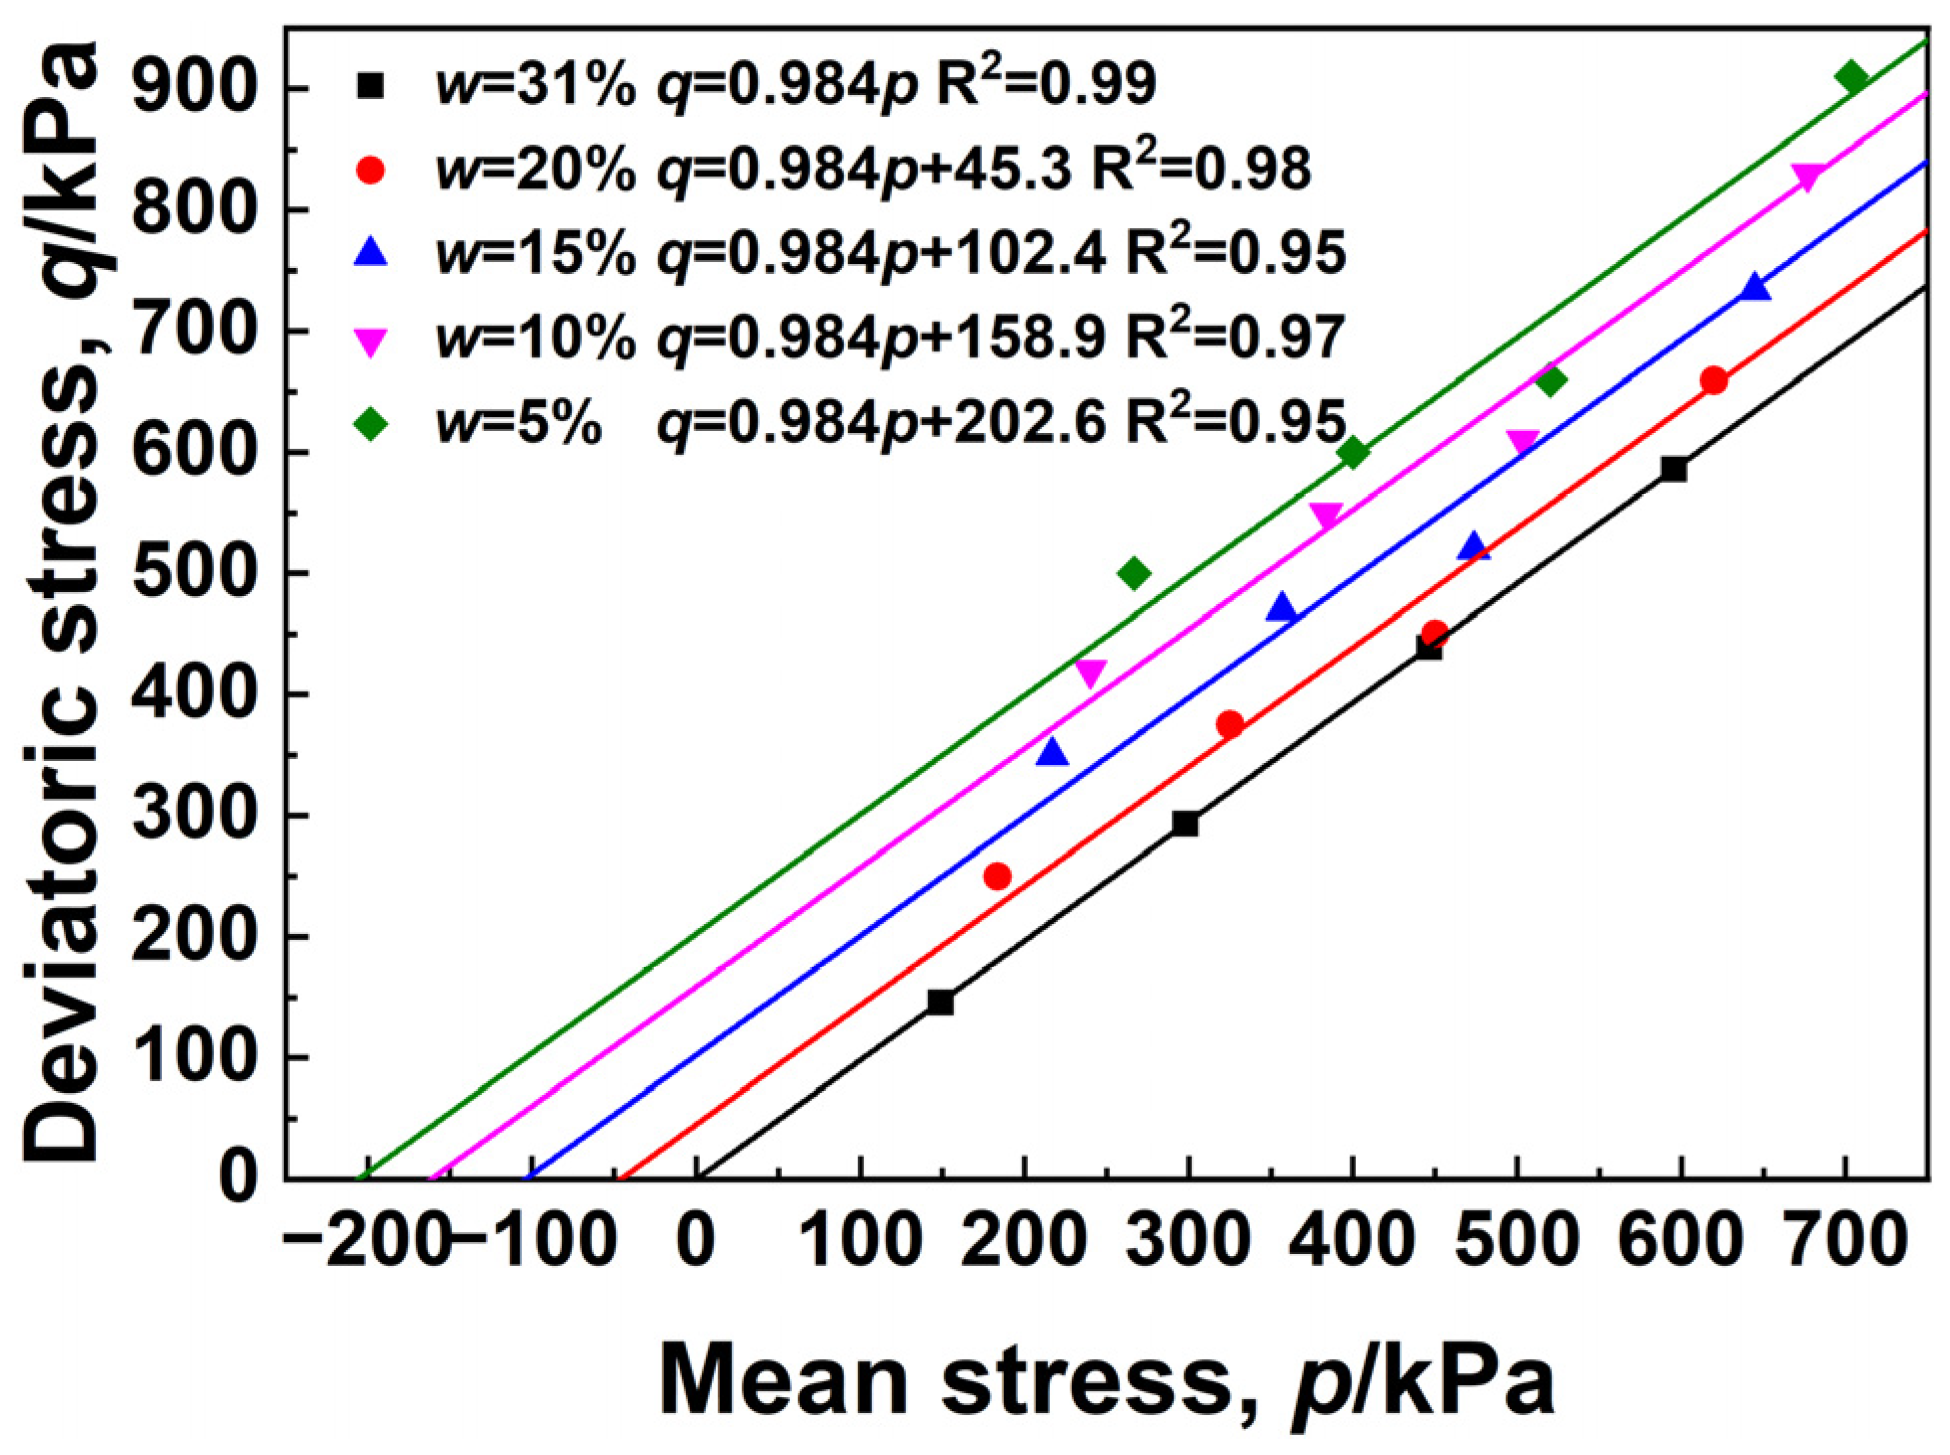
In a p-q coordinate system, the initial yield surface of loess can be approximated by an ellipse, and the position and size of the ellipse vary with the water content and dry-wet cycles.
(4)
The cohesion c of loess has similar variation rules with the structural strength Py and the average structural parameter m ¯ . Py and m ¯ increase with cohesion, according to an exponential function relationship.
The results of this study can be used for long-term stability evaluation and safety warning of engineering projects in loess regions, and to make a comprehensive assessment of sudden disasters. More studies and advanced methods are available for this study. True triaxial tests considering initial shear stress and consolidated strain are an effective method to solve the limitations of this study and can introduce stress anisotropy, intermediate principal stress, and consolidation processes into the analysis of shear strength and structure.

Author Contributions

Conceptualization, X.W. and H.L.; methodology, X.W.; software, Y.Z. and X.H.; validation, X.W. and L.Z.; formal analysis, Y.Z. and X.W.; investigation, X.Y.; resources, H.L.; data curation, Z.H.; writing—original draft preparation, X.W.; writing—review and editing, X.W. and Y.Z.; visualization, X.W.; supervision, Z.H. and X.H.; project administration, Z.H.; funding acquisition, H.L. All authors have read and agreed to the published version of the manuscript.

Funding

This research was funded by Loess Soil Mechanics and Engineering Key Laboratory of Shaanxi Province Foundation, grant number 13JS073 and Natural Science Foundation of Shaanxi Province, grant number 2017JM5059.

Institutional Review Board Statement

Not applicable.

Informed Consent Statement

Not applicable.

Data Availability Statement

Due to the nature of this research, participants of this study did not agree for their data to be shared publicly, so supporting data is not available.

Acknowledgments

The authors would like to express their sincere gratitude to Jiulong Ding from the School of Civil Engineering and Architecture, Xi’an University of Technology for providing technical support for the experiments and equipment.

Conflicts of Interest

The authors declare no conflict of interest.

References

  1. Terzaghi, K.T. Theoretical Soil Mechanics; Wiley: New York, NY, USA, 1943. [Google Scholar] [CrossRef]
  2. Burland, J.B. On the compressibility and shear strength of natural clays. Géotechnique 1990, 40, 329–378. [Google Scholar] [CrossRef]
  3. Leroueil, S.; Vaughan, P.R. The general and congruent effects of structure in natural soils and weak rocks. Géotechnique 1990, 40, 467–488. [Google Scholar] [CrossRef]
  4. Cotecchia, F.; Cafaro, F.; Aresta, B. Structure and mechanical response of sub-Apennine Blue Clays in relation to their geological and recent loading history. Géotechnique 2007, 57, 167–180. [Google Scholar] [CrossRef]
  5. Haeri, S.M.; Khosravi, A.; Garakani, A.A.; Ghazizadeh, S. Effect of Soil Structure and Disturbance on Hydromechanical Behavior of Collapsible Loessial Soils. Int. J. Geomech. 2017, 17, 04016021. [Google Scholar] [CrossRef]
  6. Xu, Y.L.; Guo, P.P.; Zhu, C.G.; Lei, G.; Cheng, K. Experimental Investigation into Compressive Behaviour and Preconsolidation Pressure of Structured Loess at Different Moisture Contents. Geofluids 2021, 2021, 5585392. [Google Scholar] [CrossRef]
  7. Roscoe, K.H.; Schofield, A.N.; Wroth, C.P. On yielding of soils. Géotechnique 1958, 8, 22–53. [Google Scholar] [CrossRef]
  8. Novello, E.A.; Johnston, L.W. Geotechnical Materials and the Critical State. Géotechnique 1995, 45, 223–235. [Google Scholar] [CrossRef]
  9. Hachey, J.; Been, K.; Jefferies, M.G. The critical state of sands. Géotechnique 1991, 41, 365–381. [Google Scholar] [CrossRef]
  10. Newson, T.A. Validation of A Non-associated Critical State Model. Comput. Geotech. 1998, 23, 277–287. [Google Scholar] [CrossRef]
  11. Shen, Z.J. Mathematical model of soil structure—The core issue of soil mechanics in the 21st century. Chin. J. Geotech. Eng. 1996, 18, 95–97. [Google Scholar]
  12. DESAI, C.S. A consistent finite element technique for work softening behavior. In Proceedings of the International Conference on Computer Methods in Nonlinear Mechanics, Austin, TX, USA, 12 September 1974; University of Texas Press: Austin, TX, USA, 1974; pp. 403–418. [Google Scholar]
  13. Desai, C.S.; Ma, Y. Modeling of joints and interfaces using the disturbed state concept. Int. J. Numer. Anal. Methods Geomech. 1992, 16, 623–653. [Google Scholar] [CrossRef]
  14. Armaleh, S.H.; Desai, C.S. Modeling and testing of cohesion-less material using disturbed state concept. J. Mech. Behav. Mater. 1994, 50, 279–295. [Google Scholar] [CrossRef]
  15. Pal, S.; Wathugala, G.W. Disturbed state model for sand-geosynthetic interfaces and application to pull-out tests. Int. J. Numer. Anal. Methods Geomech. 1999, 23, 1873–1892. [Google Scholar] [CrossRef]
  16. Katti, D.R.; Desai, C.S. Modeling and Testing of Cohesive Soil Using Disturbed-State Concept. J. Eng. Mech. 1995, 121, 648–658. [Google Scholar] [CrossRef]
  17. Wang, G.X.; Xiao, S.F.; Huang, H.W.; Wu, C.Y. Study of Constitutive Model of Structural Clay based on the Disturbed State Concept. Chin. J. Solid Mech. 2004, 25, 191–197. [Google Scholar]
  18. Jin, X.; Zhao, C.G.; Chen, T.L. Study on Constitutive Model for Unsaturated Structural Loess. J. Eng. Geol. 2010, 18, 548–553. [Google Scholar]
  19. Shao, S.; Chu, F.; Shao, S.J. Experimental study on constitutive model of structural Q3 loess based on disturbed state concept. Chin. J. Rock Mech. Eng. 2016, 35, 1494–1500. [Google Scholar]
  20. Shen, Z.J.; Zhang, W.M. Application of damage mechanics in soil mechanics. In Proceedings of the 3th Conference of Numerical Analysis and Analytic Method on Rock and Soil Mechanics in China, Zhuhai, China, 1 November 1988; pp. 595–609. [Google Scholar]
  21. Shen, Z.J. A masonry model for structured clays. Rock Soil Mech. 2000, 21, 1–4. [Google Scholar]
  22. Shen, Z.J. An Elasto-plastic Damage Model for Cemented Clays. Chin. J. Geotech. Eng. 1993, 15, 21–28. [Google Scholar]
  23. Shen, Z.J. A nonlinear damage model for structured clay. Hydro-Sci. Eng. 1993, 3, 247–255. [Google Scholar]
  24. He, K.S.; Shen, Z.J. Elasto-viscoplastic damage model for structural clays. Hydro-Sci. Eng. 2002, 4, 7–13. [Google Scholar]
  25. Jin, X.; Zhao, C.G.; Liu, Y.; Cai, G.Q. An Elasto–Plastic Damage Constitutive Model of Unsaturated Natural Soils. J. Beijing Jiaotong Univ. 2010, 34, 78–82. [Google Scholar]
  26. Liu, M.D.; Carter, J.P. Virgin compression of structured soils. Géotechnique 1999, 49, 43–57. [Google Scholar] [CrossRef] [Green Version]
  27. Liu, M.D.; Carter, J.P. Modelling the destructuring of soils during virgin compression. Géotechnique 2000, 50, 479–483. [Google Scholar] [CrossRef] [Green Version]
  28. Liu, M.D.; Carter, J.P. A structured Cam Clay model. Can. Geotech. J. 2002, 39, 1313–1332. [Google Scholar] [CrossRef] [Green Version]
  29. Carter, J.P.; Liu, M.D. Review of the Structure Cam Clay model. Geotech. Spec. Publ. 2005, 128, 99–132. [Google Scholar] [CrossRef]
  30. Horpibulsuk, S.; Liu, M.D.; Liyanapathirana, D.S.; Suebsuk, J. Behaviour of cemented clay simulated via the theoretical framework of Structured Cam Clay model. Comput. Geotech. 2010, 37, 1–9. [Google Scholar] [CrossRef]
  31. Li, W.G.; Yang, G.; Liu, W.H.; Sun, X.L. Study of constitutive model for soils based on structural parameter. J. Dalian Univ. Technol. 2021, 61, 84–91. [Google Scholar]
  32. Li, W.G.; Yang, Q.; Liu, W.H.; Yang, G.; Sun, X.L. Structured quantitative characterization and elastoplastic constitutive model of clay. Chin. J. Geotech. Eng. 2022, 44, 678–686. [Google Scholar]
  33. Hou, L.L.; Weng, X.L.; Li, L.; Zhou, R.M. A critical state model for structural loess considering water content. Rock Soil Mech. 2022, 43, 737–748. [Google Scholar]
  34. Suebsuk, J.; Horpibulsuk, S.; Liu, M.D. Modified Structured Cam Clay: A generalised critical state model for destructured, naturally structured and artificially structured clays. Comput. Geotech. 2010, 37, 956–968. [Google Scholar] [CrossRef]
  35. Suebsuk, J.; Horpibulsuk, S.; Liu, M.D. A critical state model for overconsolidated structured clays. Comput. Geotech. 2011, 38, 648–658. [Google Scholar] [CrossRef]
  36. Xie, D.Y.; Qi, J.L. Soil structure characteristics and new approach in research on its quantitative parameter. Chin. J. Geotech. Eng. 1999, 21, 651–656. [Google Scholar]
  37. Xie, D.Y.; Qi, J.L.; Zhu, Y.L. Soil structure parameter and its relations to deformation and strength. J. Hydraul. Eng. 1999, 10, 1–6. [Google Scholar]
  38. Xie, D.Y.; Qi, J.L.; Zhang, Z.Z. A Constitutive Laws Considering Soil Structural Properties. China Civ. Eng. J. 2000, 33, 35–41. [Google Scholar]
  39. Shao, S.J.; Zhou, F.F.; Long, J.Y. Structural properties of loess and its quantitative parameter. Chin. J. Geotech. Eng. 2004, 26, 531–536. [Google Scholar]
  40. Luo, Y.S.; Xie, D.Y.; Shao, S.J. Structural parameter of soil under complex stress conditions. Chin. J. Rock Mech. Eng. 2004, 23, 4248–4251. [Google Scholar]
  41. Chen, C.L.; Hu, Z.Q.; Gao, P. Research on relationship between structure and deformation property of intact loess. Rock Soil Mech. 2006, 27, 1891–1896. [Google Scholar]
  42. Chen, C.L.; Hu, Z.Q.; Gao, P. Moistening deformation characteristic of loess and its relation to structure. Chin. J. Rock Mech. Eng. 2006, 25, 1352–1360. [Google Scholar]
  43. Chen, C.L.; Gao, P.; He, J.F. Equivalent linear model of intact loess considering structural effect. Chin. J. Geotech. Eng. 2007, 29, 1330–1336. [Google Scholar]
  44. Luo, Y.S.; Hu, Y.Z.; Zhang, A.J. Regularity of relation between structural parameter and strength indexes of unsaturated loess. Rock Soil Mech. 2009, 30, 943–948. [Google Scholar]
  45. Dang, J.Q.; Hao, Y.Q. Effect of water content on the structure strength of loess. J. Water Resour. Water Eng. 2000, 33, 35–41. [Google Scholar]
  46. Dang, J.Q.; Li, J. The structural strength and shear strength of unsaturated loess. J. Hydraul. Eng. 2001, 7, 79–83. [Google Scholar]
  47. Yuan, Z.H.; Ni, W.K.; Tang, C.; Hu, S.M.; Gan, J.J. Experimental study of structure strength and strength attenuation of loess under wetting-drying cycle. Rock Soil Mech. 2017, 38, 1894–1902. [Google Scholar]
  48. Delage, P.; Lefebvre, G. Study of the structure of a sensitive Champlain clay and evolution during consolidation. Can. Geotech. J. 1984, 21, 21–25. [Google Scholar] [CrossRef]
  49. Miao, T.D.; Wang, Z.G. Deformation Mechanism of Collapsible Loess Considering Microstructural Instability. Sci. Sin. (Chim.) 1990, 1, 86–96. [Google Scholar]
  50. Tovey, N.K. A digital computer technique for orientation analysis of micrographs of soil fabric. J. Microsc. 1992, 120, 303–315. [Google Scholar] [CrossRef]
  51. Kruyt, N.P.; Rothenburg, L. Micromechanical definition of the strain tensor for granular materials. J. Appl. Mech. 1996, 63, 706–711. [Google Scholar] [CrossRef]
  52. PAUL, G.J. Physical Basis and Validation of a Constitutive Model for Soil Shear Derived from Microstructural Changes. Int. J. Geomech. 2013, 13, 365–383. [Google Scholar] [CrossRef]
  53. Jiang, M.J.; Liu, J.D.; Sun, Y.G. Constitutive model for structured soils based on microscopic damage law. Chin. J. Geotech. Eng. 2013, 35, 1134–1139. [Google Scholar]
  54. Jiang, M.J.; Zhou, W.; Sun, Y.G. A constitutive model for anisotropic structured sandy soil based on micromechanical mechanism. Rock Soil Mech. 2016, 37, 3347–3355. [Google Scholar]
  55. Fang, H.L.; Zheng, H.; Zheng, J. Micromechanics-based Multimechanism Bounding Surface Model for Sands. Int. J. Plast. 2017, 90, 242–266. [Google Scholar] [CrossRef]
  56. Gao, G.R. A Structure Theory for Collapsing Deformation of Loess Soils. Chin. J. Geotech. Eng. 1990, 12, 1–10. [Google Scholar]
  57. Hu, Z.Q.; Shen, Z.J.; Xie, D.Y. Constitutive model of structural loess. Chin. J. Rock Mech. Eng. 2005, 24, 565–569. [Google Scholar]
  58. Shao, S.J.; Tao, H.; Xu, P. Discussion on research of mechanical characteristics of loess considering structural behavior and its application. Rock Soil Mech. 2011, 32, 42–50. [Google Scholar]
  59. Wang, F.; Li, G.Y.; Mu, Y.H.; Zhang, P.; Wu, Y.H.; Fan, S.Z. Experimental study of deformation characteristics of compacted loess subjected to drying-wetting cycle. Rock Soil Mech. 2016, 37, 2306–2320. [Google Scholar]
  60. Wu, J.H.; Yang, N.N.; Li, P.Y.; Yang, C.L. Influence of Moisture Content and Dry Density on the Compressibility of Disturbed Loess: A Case Study in Yan’an City, China. Sustainability 2023, 15, 6212. [Google Scholar] [CrossRef]
  61. Hu, C.M.; Yuan, Y.L.; Wang, X.Y.; Mei, Y.; Liu, Z. Experimental study on strength deterioration model of compacted loess under wetting-drying cycles. Chin. J. Rock Mech. Eng. 2018, 37, 2804–2818. [Google Scholar]
  62. Qin, Y.Y.; Li, G.Y.; Chen, X.J.; Fan, K.F. Study on shear strength and structure of Malan loess under wetting–drying cycles. Arabian J. Geosci. 2021, 14, 2854. [Google Scholar] [CrossRef]
  63. Ye, W.J.; Sai, Y.; Cui, C.Y.; Duan, X. Deterioration of the Internal Structure of Loess under Dry-Wet Cycles. Adv. Civ. Eng. 2020, 2020, 8881423. [Google Scholar] [CrossRef]
  64. Xu, X.T.; Shao, L.J.; Huang, J.B.; Xu, X.; Liu, D.Q.; Xian, Z.X.; Jian, W.B. Effect of wet-dry cycles on shear strength of residual soil. Soils Found. 2021, 61, 782–797. [Google Scholar] [CrossRef]
  65. Bai, Y.; Ye, W.J.; Wu, Y.T.; Chen, Y.Q. Multiscale Analysis of the Strength Deterioration of Loess under the Action of Drying and Wetting Cycles. Adv. Mater. Sci. Eng. 2021, 2021, 6654815. [Google Scholar] [CrossRef]
  66. Shi, G.M.; Li, X.Y.; Guo, Z.K.; Zhang, Z.Z.; Zhang, Y.Y. Effect of Mica Content on Shear Strength of the Yili Loess under the Dry-Wet Cycling Condition. Sustainability 2022, 14, 9569. [Google Scholar] [CrossRef]
  67. Xu, J.; Wu, Z.P.; Chen, H.; Shao, L.T.; Zhou, X.G.; Wang, S.H. Influence of dry-wet cycles on the strength behavior of basalt-fiber reinforced loess. Eng. Geol. 2022, 302, 106645. [Google Scholar] [CrossRef]
  68. Wang, X.L. Research on the Effect of Shear Strength and Structural Property and Slope Stability of Loess Under Dry-Wet Cycle. Master’s Thesis, Xi’an University of Technology, Xi’an, China, 2017. [Google Scholar]
  69. Wei, Y.N.; Fan, W.; Ma, G.L. Characteristics of Microstructure and Collapsible Mechanism of Malan Loess in Loess Plateau, China. J. Earth Sci. Environ. 2022, 44, 581–592. [Google Scholar]
  70. Zheng, F.; Shao, S.J.; Wang, J.; Shao, S. Experimental Study on the Mechanical Behaviour of Natural Loess Based on Suction-Controlled True Triaxial Tests. KSCE J. Civ. Eng. 2020, 24, 2304–2321. [Google Scholar] [CrossRef]
  71. Ge, M.M.; He, X.; Gu, C.; Li, N.; Liu, N.F. Study on the Microstructure Evolution of a Compacted Loess along Compression, Wetting and Drying. J. Eng. Geol. 2023, 1–13. Available online: https://kns.cnki.net/kcms/detail/11.3249.p.20220829.1928.001.html (accessed on 9 May 2023).
Figure 1. Isotropic compression curves of undisturbed and saturated remolded loess.
Sustainability 15 09280 g001
Figure 2. Stress–strain curves of undisturbed and remolded loess.
Sustainability 15 09280 g002
Figure 3. Sampling overview. (a) Sampling site and (b) soil profile.
Sustainability 15 09280 g003
Figure 4. Schematic diagram of dry-wet cycles tests.
Sustainability 15 09280 g004
Figure 5. Isotropic compression curves. (a) n = 0 without dry-wet cycles. (b) Different dry-wet cycles for w = 5%. (c) Different dry-wet cycles for w = 10%. (d) Different dry-wet cycles for w = 15%. (e) Different dry-wet cycles for w = 20%. (f) Different dry-wet cycles for w = 31%.
Sustainability 15 09280 g005
Figure 6. Structural strength curves under different dry-wet cycles.
Sustainability 15 09280 g006
Figure 7. Shear strength parameters curves: (a) c–n curves and (b) φ–n curves.
Sustainability 15 09280 g007
Figure 8. Stress–strain curves of undisturbed loess: (a) w = 15%; (b) σ3 = 100 kPa; (c) w = 10% and σ3 = 100 kPa.
Sustainability 15 09280 g008
Figure 9. Structural parameter curves: (a) w = 5% and n = 0; (b) w = 5% and σ3 = 100 kPa; (c) σ3 = 100 kPa and n = 0.
Sustainability 15 09280 g009aSustainability 15 09280 g009b
Figure 10. Peak structural parameter curves. (a) n = 0 with different confining pressures. (b) σ3 = 100 kPa with different water contents.
Sustainability 15 09280 g010
Figure 11. Critical state lines under different water contents.
Sustainability 15 09280 g011
Figure 12. Relationship between P0 and water content.
Sustainability 15 09280 g012
Figure 13. Yield surfaces under different dry-wet cycles for w = 5%.
Sustainability 15 09280 g013
Figure 14. Relationships between cohesion c, dry-wet cycles n, and water contents w. (a) Three-dimensional diagram of c, w, and n relationships. (b) Contour plot of cohesion.
Sustainability 15 09280 g014
Figure 15. Relationships between structural strength Py, dry-wet cycles n, and water contents w. (a) Three-dimensional diagram of Py, w, and n relationships. (b) Contour plot of structural strength.
Sustainability 15 09280 g015
Figure 16. Relationships of average structural parameter m ¯ , dry-wet cycles n and water contents w. (a) Three-dimensional diagram of m ¯ , w, and n relationships. (b) Contour plot of average structural parameter.
Sustainability 15 09280 g016
Figure 17. Relationship curves between structure and cohesion. (a) Relationship curves between structural strength and cohesion. (b) Relationship curves between average structural parameters and cohesion.
Sustainability 15 09280 g017
Table 1. Basic physical indices of tested loess.
Dry
Density,
ρ/g·cm−3
Water
Content,
w/%
Plastic
Limit
/%
Liquid Limit/%Plasticity
Index
Specific
Gravity
Particle Composition/%
>0.075 mm0.075–0.005 mm<0.005 mm
1.4112.122.1132.4610.352.721.285.4413.36
Table 2. Isotropic compression test program.
Water Content, w/%Cycle Number, nConfining Pressure, p/kPa
Undisturbed samples5, 10, 15, 20, 310, 1, 3, 525, 50, 100, 200, 400, 800, 1600
Saturated remolded samplesSaturated025, 50, 100, 200, 400, 800, 1600
Table 3. Triaxial shear tests program.
Water Content, w/%Cycle Number, nConfining Pressure, p/kPa
Undisturbed samples5, 10, 15, 20, 310, 1, 3, 5100, 200, 300, 400
Saturated remolded samples5, 10, 15, 20, 310100, 200, 300, 400
Table 4. Structural strength values.
Cycle NumberWater Content, w/%
510152031
Structural Strength, Py/kPa
01330750400210105
1110062131315090
398055924612082
592052820910775
Table 5. Shear strength parameters of undisturbed loess.
Water Content/%Cycle Number, n
01350135
Cohesion, c/kPaInternal Friction Angle, φ
5%110.6195.4686.1082.1928.4725.7525.2825.15
10%83.2376.5772.9371.4327.4325.3224.6024.55
15%56.5150.3146.0445.8025.5024.5024.8024.56
20%33.2229.7926.5025.2525.1024.5024.8024.56
31%20.8916.6414.6313.3124.9025.1024.5024.70
Table 6. Parameter values.
Parameters
y0x0At
Py−232.6510.59192.9656.16
m ¯ −10.95119.952.2370.47
Disclaimer/Publisher’s Note: The statements, opinions and data contained in all publications are solely those of the individual author(s) and contributor(s) and not of MDPI and/or the editor(s). MDPI and/or the editor(s) disclaim responsibility for any injury to people or property resulting from any ideas, methods, instructions or products referred to in the content.

