Article

Impact of Climate Change on Paddy Farming in the Village Tank Cascade Systems of Sri Lanka

1
School of Humanities, Arts and Social Sciences, University of New England, Armidale, NSW 2351, Australia
2
Applied Agricultural Remote Sensing Centre, School of Science and Technology, University of New England, Armidale, NSW 2351, Australia
3
Ministry of Environment, Battaramulla 10120, Sri Lanka
4
Natural Resources Management Centre, Department of Agriculture, Peradeniya 20400, Sri Lanka
5
Alliance of Bioversity International and CIAT, Via di San Domenico, 1, 00153 Rome, Italy
6
Faculty of Agriculture, Rajarata University of Sri Lanka, Mihintale 50300, Sri Lanka
7
GIS and Remote Sensing, EastCoast Geospatial Consultants, Bonnells Bay, NSW 2264, Australia
8
School of Environmental and Rural Science, University of New England, Armidale, NSW 2351, Australia
9
Faculty of Agriculture and Plantation Management; Wayamba University of Sri Lanka, Makandura, Gonawila 60170, Sri Lanka
*
Author to whom correspondence should be addressed.
Sustainability 2023, 15(12), 9271; https://doi.org/10.3390/su15129271
Submission received: 9 May 2023 / Revised: 3 June 2023 / Accepted: 4 June 2023 / Published: 8 June 2023

Abstract

:
Consequences of global climate change are predicted to increase risks to crop production in the future. However, the possible broader impact of climate change on social-ecological systems still needs to be evaluated. Therefore, the present study focuses on one such globally important agricultural social-ecological system referred to as the Village Tank Cascade System (VTCS) in the dry zone of Sri Lanka. The VTCS has considerable potential to withstand seasonal climate variability mainly through continuous supply of water by the village tank storage throughout the year. The current study aimed to investigate trends of climate variability and possible impacts on paddy production in the North and North-central VTCS zone. Observed and projected rainfall and temperature data were analysed to evaluate the past variability trends (1970 to 2020) and model future (up to 2100) scenarios of climate variability and trends. Long-term observed rainfall and temperature data (1946 to 2020) were analysed to identify possible anomalies. The Maximum Entropy (MaxEnt) model has been used to predict the situation of future paddy farming (2050 and 2070) under two climate scenarios (RCP4.5 and RCP8.5) of the Intergovernmental Panel on Climate Change (IPCC). Six variables that would affect paddy growth and yield quality were used alongside the average monthly rainfall and temperature of two Global Climate Models (MIROC5 and MPI-ESM-LR). Climate suitability for two paddy cultivation seasons (Yala and Maha) were predicted for current and future climate scenarios. The findings revealed that observed and projected climate changes show considerable deviation of expected rainfall and temperature trends across the VTCS zone. Temperature exhibits warming of approximately 1.0 °C during the declared Global Warming Period (1970 to 2020) in the study area. In addition, there is a trend of significant warming by 0.02 °C/year, RCP4.5 and 0.03 °C/year, RCP8.5 from 1950 to 2100. Rainfall (1970–2020) shows high interannual variability but trends were not significant and less discernible. However, long-term projected rainfall data (1950–2100) analysis detected a significant (p = 0) upward trend (2.0 mm/year, RCP4.5 and 2.9 mm/year, RCP8.5), which is expected to continue up to the end of this century. Further, the study revealed some shifts in temperature towards higher values and positive anomalies in rainfall affecting seasonality and the likelihood of more extreme occurrences in the future, especially during the Maha cultivation season. The MaxEnt model predicts the following under future climate scenarios: (i) spatio-temporal shifts (conversions) in climate suitability for paddy farming in the VTCS zone; (ii) substantial low and moderate suitability areas that are currently suitable will remain unchanged; (iii) up to 96% of highly suitable and 38% of moderately suitable paddy growing areas in the VTCS zone will be at risk due to a decline in future climate suitability; and (iv) expansion of lower suitability areas by approximately 22% to 37%, due to conversion from moderate suitability areas. The study provides evidence that the continuous warming trend with increasing variability in rainfall and shifting seasonality could increase the vulnerability of future paddy farming in the VTCS. Thus, findings of this study will help planners to make more targeted solutions to improve adaptive capacity and regain the resilience to adjust the paddy farming pattern to deal with predicted climate variability and change.

1. Introduction

Global climate change is one of the major causal factors affecting crop production, leading to declines in crop yield and increased vulnerability due to food insecurity [1,2]. According to the Sixth Assessment Report of the Intergovernmental Panel on Climate Change (IPCC), the increasing frequency and intensity of extreme climate events have become the greatest threat to social-ecological systems (SESs) [3]. Smallholder farms are one of the key components of the SESs, contributing approximately 30–34% of the world food production, and are central to the conservation of agrobiodiversity for ensuring food and nutrition security [4,5,6]. Social-ecological systems are likely to be more vulnerable to climate change because they are dominant by smallholder farming systems for food production that are dependent on ecosystem services, and thus are more sensitive to climate variability [7].
The Village Tank Cascade Systems (VTCSs) in the dry and intermediate zones of Sri Lanka are considered unique SESs, and Food and Agriculture Organization of the United Nations has recently declared it as a Globally Important Agricultural Heritage System (GIAHS). Village Tank Cascade Systems are rainwater harvesting-based irrigation systems that incorporate multifunctional social-ecological land uses at different spatial scales [8,9]. Food and water provisioning ecosystem services are the keys to sustaining the overall system productivity (economic, ecological, social and physical) in the VTCSs [10,11]. Paddy farming is a vital part of the Village Tank Cascade System (VTCS) environment as it provides not only food provisioning services, but is also linked with other important ecosystem services and biocultural elements that sustain the overall system productivity and well-being of people [12,13]. However, there is growing concern over the considerable impact of recent climate variability and change on paddy farming undertaken in VTCSs, which have evolved as self-sustaining, climate-resilient and efficient for surface rain-water harvesting during the last 2000 years or more [14,15,16].
Changes in climate, such as increased variability of rainfall and temperature, shifting onset of rainfall and seasonality and changing frequency and intensity of extreme weather events are likely to change agro-climatic suitability for seasonal crops, leading to a decrease in paddy farming productivity over most of the countries in South Asia [17]. Based on simulations of Global Climate Models (GCMs) and climate scenarios, a yield reduction of up to 10% in rice has been projected for South Asia (compared to 1998–2002) due to increased temperature and prolonged drought [18,19]. Sri Lanka, being one of the countries in the South Asian region, is no exception when it comes to the impacts of climate change on paddy cultivation. Paddy is the primary staple food crop that occupies 40% of the cultivated lands in the country. The crop is heavily fragmented with respect to ownership, with over 66% of the plots being less than one hectare. Approximately 23.3% of the paddy lands (35% of the irrigated paddy area) across the country are under VTCSs areas cultivated as smallholder farms that are heavily dependent on seasonal monsoon rainfall [20,21,22,23,24].
It is evident that Sri Lanka has experienced unusually heavy short rains and longer periods of droughts during the past years, and these types of extreme weather events are expected to continue in the future [25,26]. Apart from the IPCC regional projections at the coarse scale, few studies have attempted to project future climate change scenarios for Sri Lanka, based on downscaled climate data to identify climate change impacts on agricultural productivity for different cropping systems [27,28,29]. Projected climate variability and change would seriously affect the agricultural productivity of the VTCSs, since these systems comprise diverse smallholder farming patterns integrated with surface-water harvesting irrigation systems based on monsoonal precipitation [11,23,30,31,32,33]. Water availability for paddy cultivation in the VTCSs mostly depends on the distribution and amount of rainfall received for village tanks and upstream catchment areas during the inter-monsoon and major monsoon seasons of the year [34,35]. Thus, paddy cultivation in the dry zone is highly susceptible to seasonal variability of rainfall, temperature and soil moisture content during the cropping period [36]. In this context, it is important to have an in-depth understanding of variability (i.e., anomalies) and trends of monthly and seasonal rainfall and temperature in relation to different stages of paddy production during a cultivation season. A flow chart developed to present the possible indicators of climate variability and change analysis and their impact on VTCS paddy production is shown in Figure 1.
Shifting current climate-suitable areas for crop production is likely to occur due to the influence of climate change [37,38]. Though the effects of climate variability on crop yields have been broadly studied, the consequences of climate suitability changes in cropland areas are less well understood [39]. Therefore, modelling climate suitability for paddy in VTCSs is highly useful to identify future climate-risk areas for paddy production. With the recent advancements in the modelling techniques and increasing access to climate data, researchers have switched to rigorous multi-model ensemble techniques with downscaled country-specific climate data to analyse climate variables and climatic suitability for the specific crops under changing climatic conditions, based on GCMs and climate scenarios [17,20,40,41,42,43,44,45,46]. The application of Species Distribution Models (SDMs), coupled with GCMs and climate scenarios, to estimate crop suitability under the potential impact of climate change in different geographical regions has increased in recent years [40,46,47,48,49,50,51,52,53,54]. Among SDMs, the Maximum Entropy (MaxEnt) model is one of the widely used models to predict the climate suitability of target species based on climatic and environment variables [55,56]. More importantly, MaxEnt has been used in Sri Lanka to investigate the potential risk of climate change on area suitability for ecologically and economically important species, for example, the threat of invasive species [57,58], crop wild relatives [59], neglected and underutilised fruit species [60], economically significant fruit species such as pineapple (Ananas comosus (L.) Merr.) [61], and tea (Camellia sinensis L.) [62] and mammals [63]. However, despite paddy being a staple food crop and its socio-cultural importance in ensuring food security in Sri Lanka, there are relatively few studies that have investigated the potential suitability of areas for minor irrigated and rainfed paddy cultivation under future climate change.
This paper aimed to investigate climate change impact on suitability for paddy farming in the VTCSs of Sri Lanka. The specific objectives were to: (i) evaluate the past rainfall and temperature trends in a 75-year period (1946–2020); (ii) assess the future trends of rainfall and temperature up to 2100; and (iii) demarcate the future changes in the climate suitability of land areas for paddy farming in the North and North-central VTCSs zone by using the MaxEnt model for the medium-term (2050) and long-term (2070) climate changes. The findings of this study will help the process of reviewing Sri Lanka’s National Adaptation Plan for climate change impacts, which seeks to implement innovative adaptation strategies in response to the challenges and opportunities posed by climate change [26].

2. Materials and Methods

2.1. Study Area

This study focused on the North and North-central VTCS zone in the dry zone of Sri Lanka, the largest zone with 617 VTCSs that occupies approximately 10,000 km2, of which about 20% is classed as paddy farming land use system (approximately 16% of the total paddy land extent in Sri Lanka) (Figure 2) [11,23]. The entire North and North-central VTCS zone is located within the DL1 Agro Ecological Region of Sri Lanka [64,65]. Based on the last fifty years of weather data (1971–2020) recorded at Anuradhapura meteorological station, the average annual rainfall in the study area is 1320 mm, varying from 798 to 2483 mm. The rainfall pattern in the area is strongly influenced by two monsoon climate regimes: the South-West Monsoon (SWM) from May to September and the North-East Monsoon (NEM) from December to February [34,66]. There are two distinct inter-monsoonal periods from March to April and from October to November, being the First Inter-Monsoon (FIM) and the Second Inter-Monsoon (SIM), respectively [67]. Thus, the rainfall amount and a well-defined bi-modal distribution pattern create four climatic seasons with two major cultivation seasons—March to August (Yala) and September to February (Maha) in a year.
The average daily ambient temperature is 27 °C, ranging from 20.6 °C to 33.2 °C. Evaporation varies from 3.5 to 7.5 mm/day and evapotranspiration varies spatially from 1000 to 1400 mm/year [30]. Three major soil groups are prominent in the study area: Reddish Brown Earths—Rhodustalfs (60%), Low Humic Gley—Tropaqualfs (30%) and alluvial (10%) [66]. Geomorphological and substratum features of the study area favourably contribute to surface drainage patterns and efficient rainwater harvesting into the tank and ground water systems. The elevation of the study area varies from 100–300 m amsl with undulating terrain features of the VTCS landscape [23,66]. The ecological, hydrological and geomorphological features provide a favourable setting for the community to adopt more climate-resilient lowland paddy farming in VTCS areas. Paddy farming in the VTCSs also has symbiotic relationships with ecosystem functions and services generated in the area that largely reduce climate stresses and maintain adequate paddy productivity. However, seasonal and intra-annual climate variability significantly impacts on the supply of the vital ecosystem services linked with sustainable paddy production in the VTCSs [10,66,68].

2.2. Analysis of Observed Climate Data

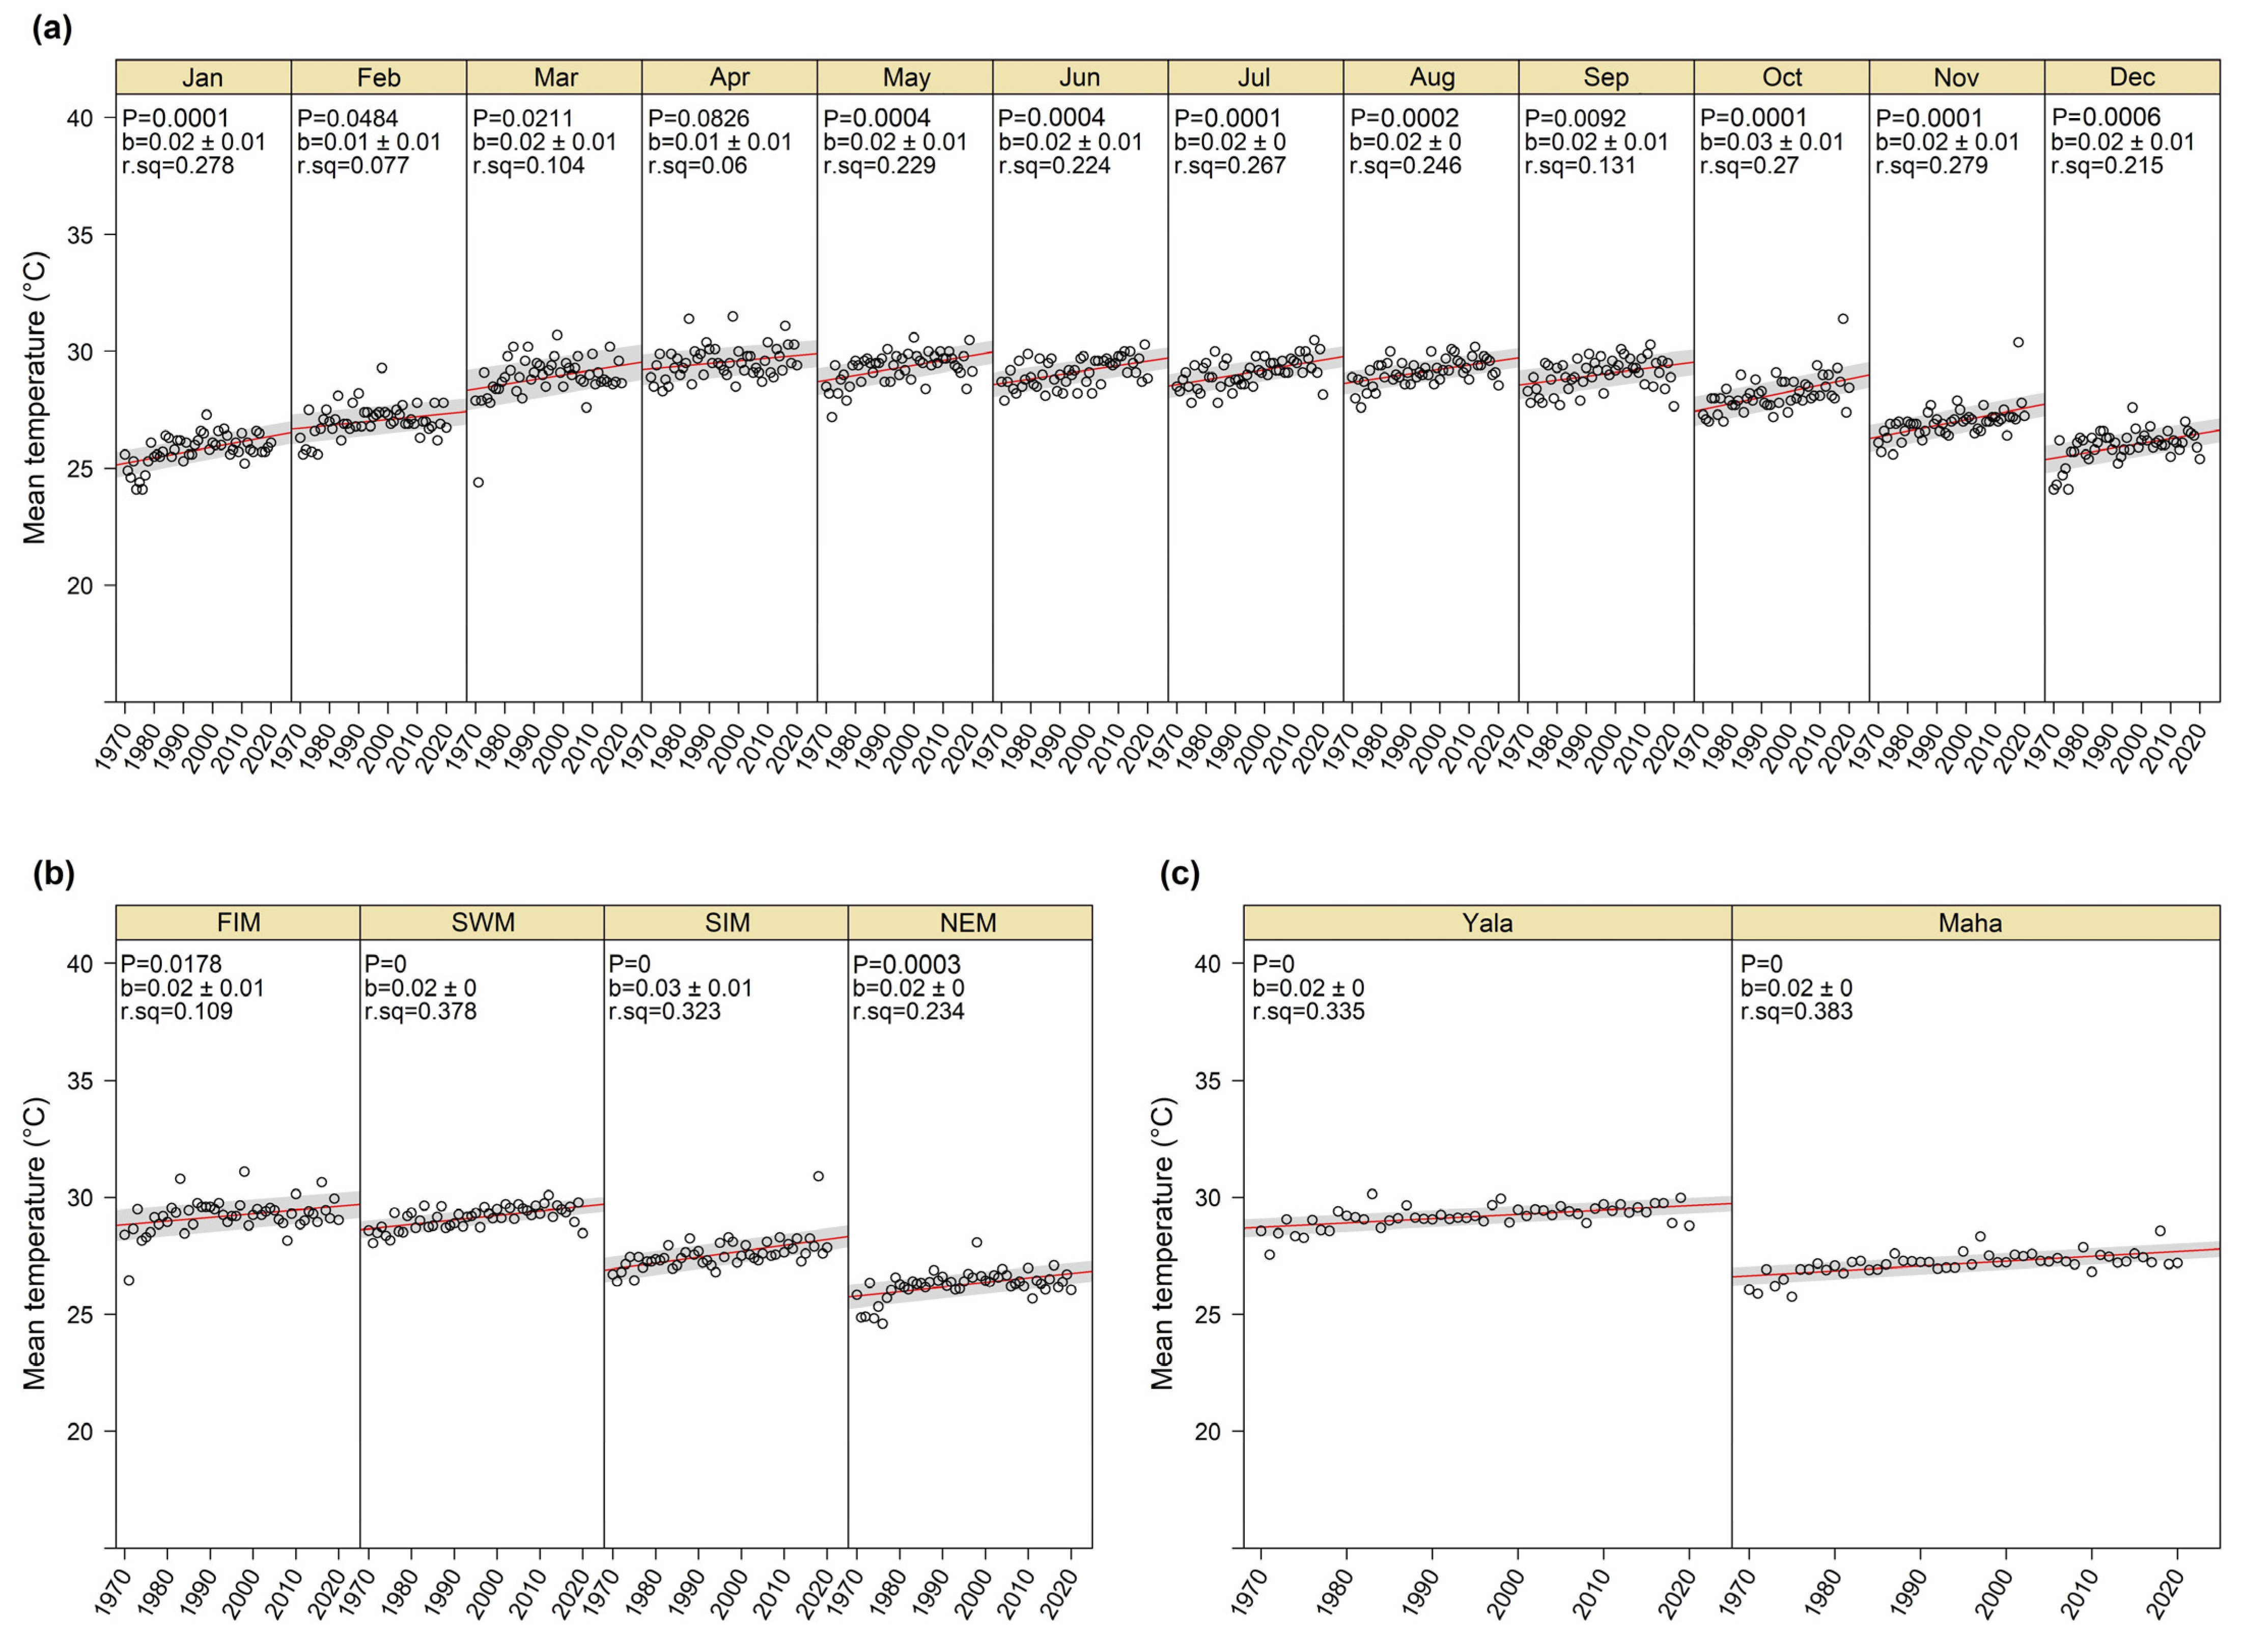
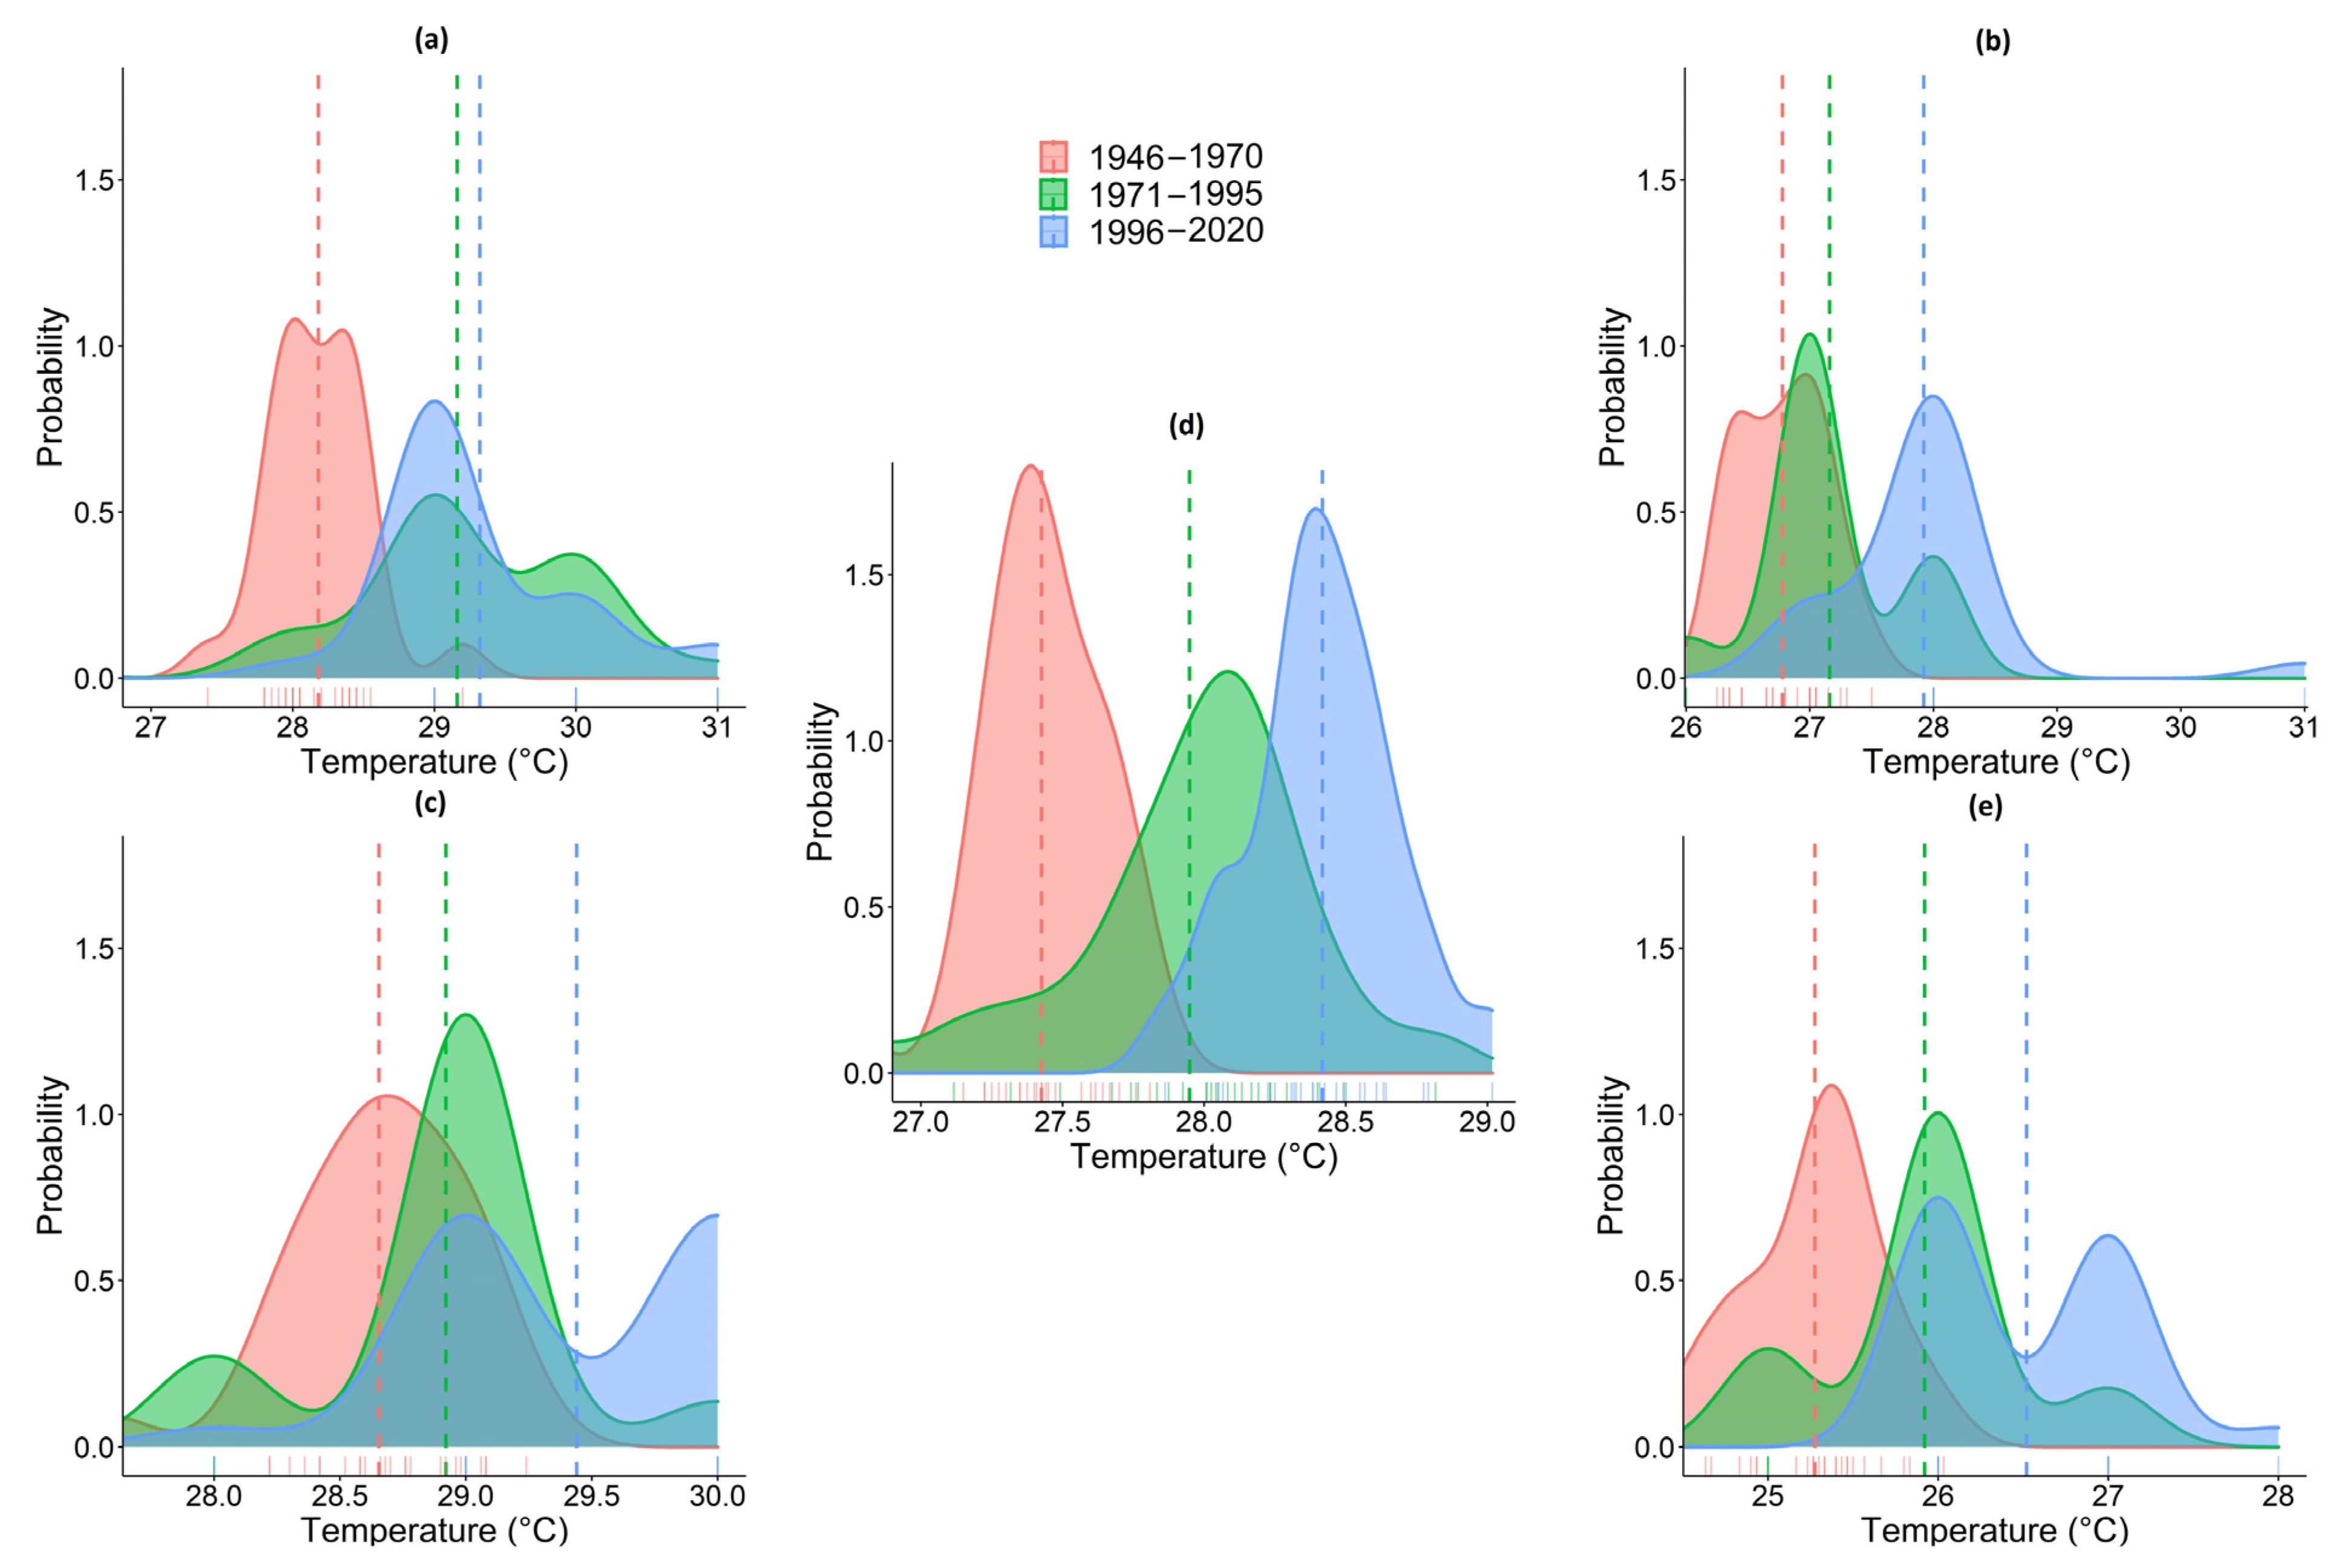
The monthly temperature and rainfall data obtained from the Department of Meteorology of Sri Lanka were analysed to examine variability and probability distribution of annual and seasonal temperature and rainfall of Anuradhapura, referring to the Non-Global Warming Period (NGWP) and Global Warming Period (GWP) [69,70,71]. Linear regression analysis was used to evaluate monthly and seasonal changes in rainfall and temperature over a period of the past fifty years (1970 to 2020). The regression results are reported as p-values (p value of the slope coefficient), b (the slope coefficient) and R2 (coefficient of determination), indicating trend and variability using 95% confidence intervals. Data analysis and visualisation were completed through ‘lattice’, ‘ggplot2′ and ‘ggpubr’ packages in R statistical software version 4.1.2. Probability distribution plots of seasonal and annual temperature and rainfall for NGWP (1946 to 1970) and GWP (1971 to 2020) were developed using an extension of ‘ggdensity’ function of ‘ggplot2′ [72,73,74].

2.3. Assessment of Long-Term Projected Climate Data

The study analysed projected downscaled (50 km × 50 km) monthly temperature and rainfall data pertaining to the period from 1950 to 2100 (observed data from 1979 to 2010 of the Anuradhapura Meteorological Station—8.35° N; 80.38° E), obtained from the climatedatafactory.com. (accessed on 7 July 2020). The study used two GCMs that have widely been used in previous literature and which perform better for the South Asian region, the improved fifth version of the GCM, MIROC (MIROC5—Model for Interdisciplinary Research on Climate) [75] and MPI-ESM-LR (Max Planck Institute Earth System Model, Low Resolution) [76]. The Mann-Kendall (M-K) statistical test [77,78] and Sen’s slope estimator [79] were used to analyse the long-term projected trends of annual rainfall and temperature data [22,34,80] using the ‘kendall’ and ‘trend’ packages in R statistical software [72,80,81]. In the M-K trend test, the study did not employ pre-whitening of climate data for eliminating the influence of auto-correlation, due to the large length of the dataset [71].

2.4. Modelling Future Climate Suitability Areas

2.4.1. Extraction of Paddy Cultivation Location Data

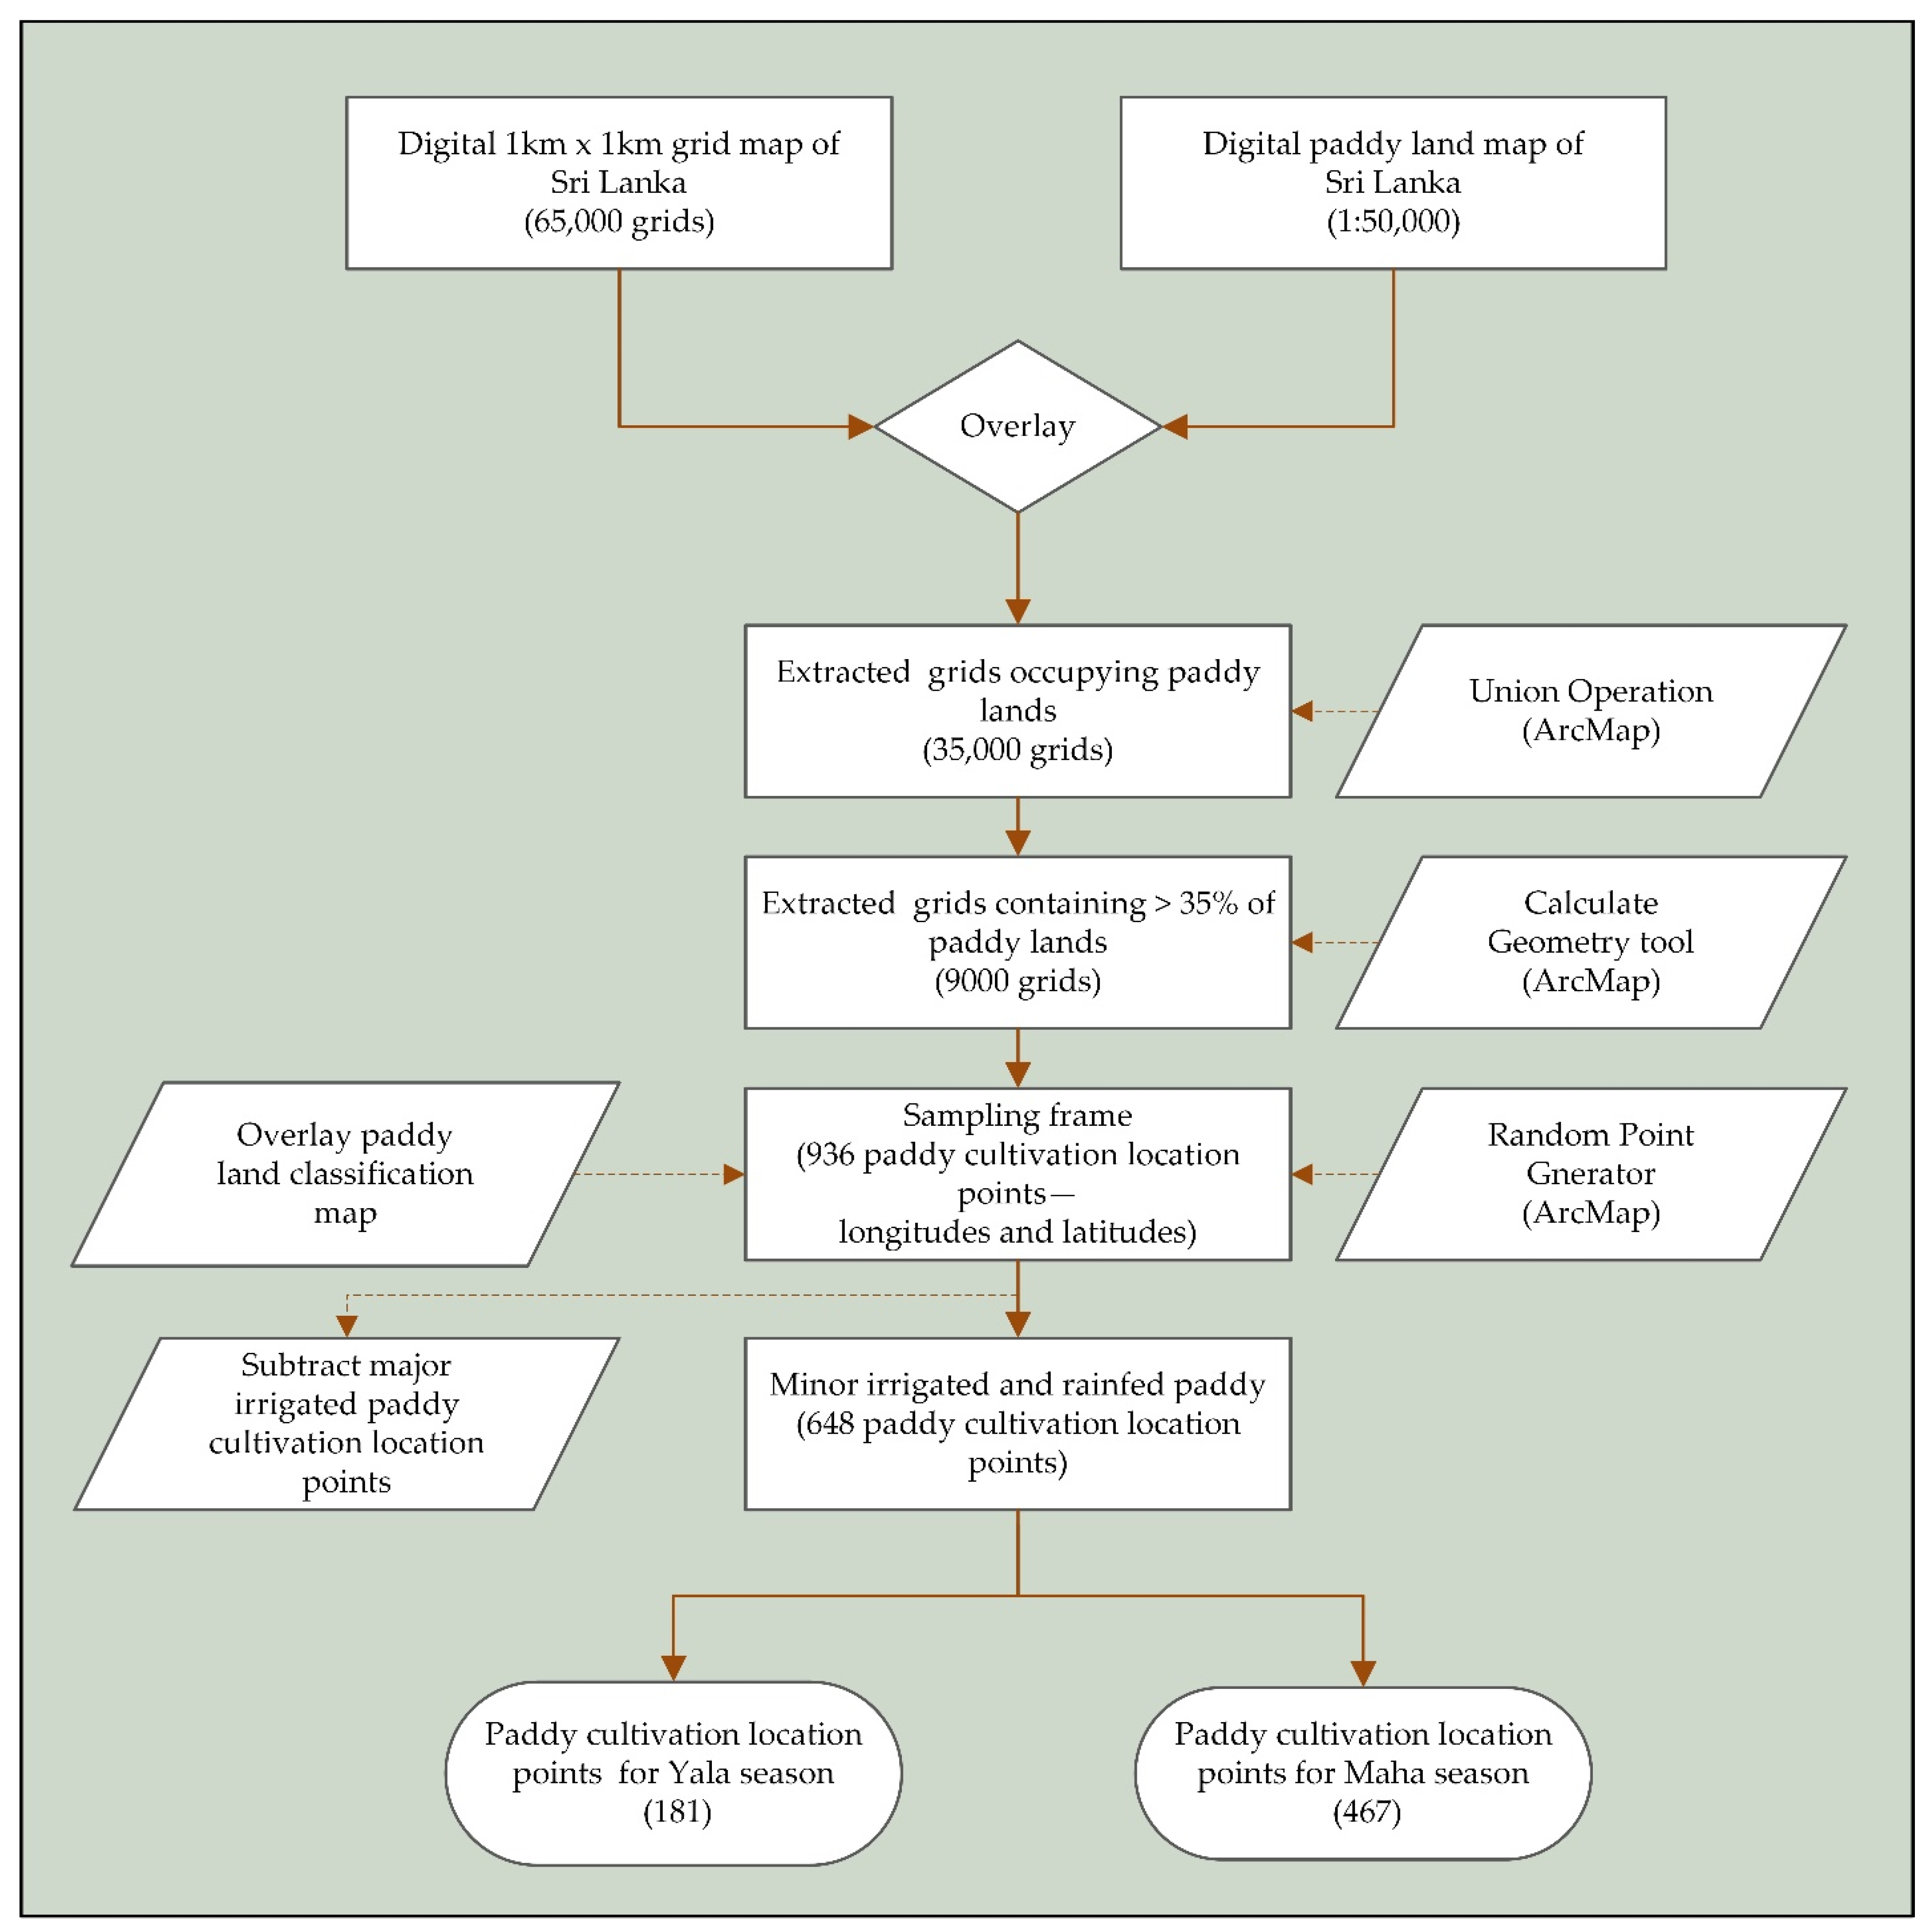
A digital grid-based map (1 km2) was overlaid on the national paddy land map (1:50,000 digital land use data from 1992 to 2017 of the Survey Department of Sri Lanka) and the entire island was divided into 65,610 grids using the Union Operation tool in ArcMap (version 10.4.1) software (ESRI, Redlands, CA, USA). The percentage area of paddy land in each grid was calculated using the Geometry Calculation option in ArcMap. Out of the total number of grids (65,610), paddy cultivation locations were distributed only in 35,537 grids. All grids that contained more than 35% paddy locations (9000 grids) were selected as per the method used in previous studies [82,83]. A total of 936 paddy cultivation locations were selected using a Random Point Generator tool in ArcMap software and used as the paddy location points data set with geographic coordinates for this study. The selected paddy cultivation location data were developed based on water source (minor irrigated and rainfed) under Yala and Maha cultivation seasons, following the process of extract and downscale paddy cultivation location data shown in Figure 3. Classification of paddy cultivation areas, considering the type of water sources used for paddy cultivation, was done using ArcMap (version 10.4.1) software overlay operations by integrating GIS maps acquired from different national agencies related to water governance. Five paddy land classes were identified accordingly. The extracted and downscaled paddy cultivation location data for the Yala and Maha cultivation seasons overlaid on the paddy land classification map is shown in Figure 4.

2.4.2. Selection of Environmental Variables

The productivity of paddy farming in VTCSs is determined by three main factors: (i) agro-climatology (rainfall, temperature, soil moisture, evapotranspiration); (ii) agroecology (geomorphology, soil properties, biodiversity, ecological functions); and (iii) socio-ecology (biocultural and traditional knowledge practices) [23,66]. The inclusion of both continuous and categorical variables is important to enhance the predictive performance of SDMs [84,85]. Hence, environmental data used in this study were divided into two main categories: (i) climatic—agroclimatic; and (ii) non-climatic—agroecological factors that determine paddy yield [85,86,87,88].
The current monthly climate data (temperature and rainfall) pertaining to 1970–2000, available as GIS raster files (spatial resolution 1 km2 grid size), were downloaded from the WorldClim web portal (version 2.1; https://www.worldclim.org/data/worldclim21.html; accessed on 2 September 2021). As adapted by recent studies in Sri Lanka and South Asia to model the area suitability for future climate change, the study used projected downscaled future climate data (averaged temperature and rainfall) of two GCMs that are mostly used in the region (MIROC5 and MPI-ESM-LR) under medium and high emission Representative Concentration Pathways (RCP4.5 and RCP8.5) from the Coupled Model Inter-Comparison Project Phase 5 (CMIP5) for 2050 and 2070, downloaded from the WorldClim web portal with same resolution to the current climate data. [49,50,52,58,60].
Paddy cultivation in the VTCSs mainly depends on the amount of rainfall received from inter-monsoonal and major monsoonal periods for the VTCS catchment areas during the current and previous cultivation seasons of the year [89]. This enables the storage of excess water in the village tanks to irrigate paddy in dry spells [34]. The ideal annual rainfall required for the optimum productivity of rice varies between 1100 mm and 1250 mm [90]. Similarly, temperature variations also affect different stages of paddy plant growth, development and grain filling. The optimum temperature required for paddy cultivation ranges from 25 °C to 35 °C [91]. Further, elevated maximum temperatures lead to increased evapotranspiration (ET), surface evaporation and depleted soil moisture, resulting in decreased water availability for paddy cultivation [69,88,89,92,93]. In consideration of the above facts, the study considered monthly mean temperature and monthly cumulative rainfall for Yala and Maha seasons as climatic variables for this study. The study also considered soil, slope and elevation as agroecological (non-climatic) variables that have a significant influence on paddy yield productivity [86,87]. This data was obtained from the Natural Resources Management Centre (NRMC) of the Department of Agriculture, Sri Lanka as raster layers with the same spatial resolution (1 km2) as WorldClim climate data. Thus, the study employed six variables (paddy cultivation locations, rainfall, temperature, slope, soil and elevation) for running the MaxEnt model for both Yala and Maha cultivation seasons (Table 1).

2.4.3. MaxEnt Modelling

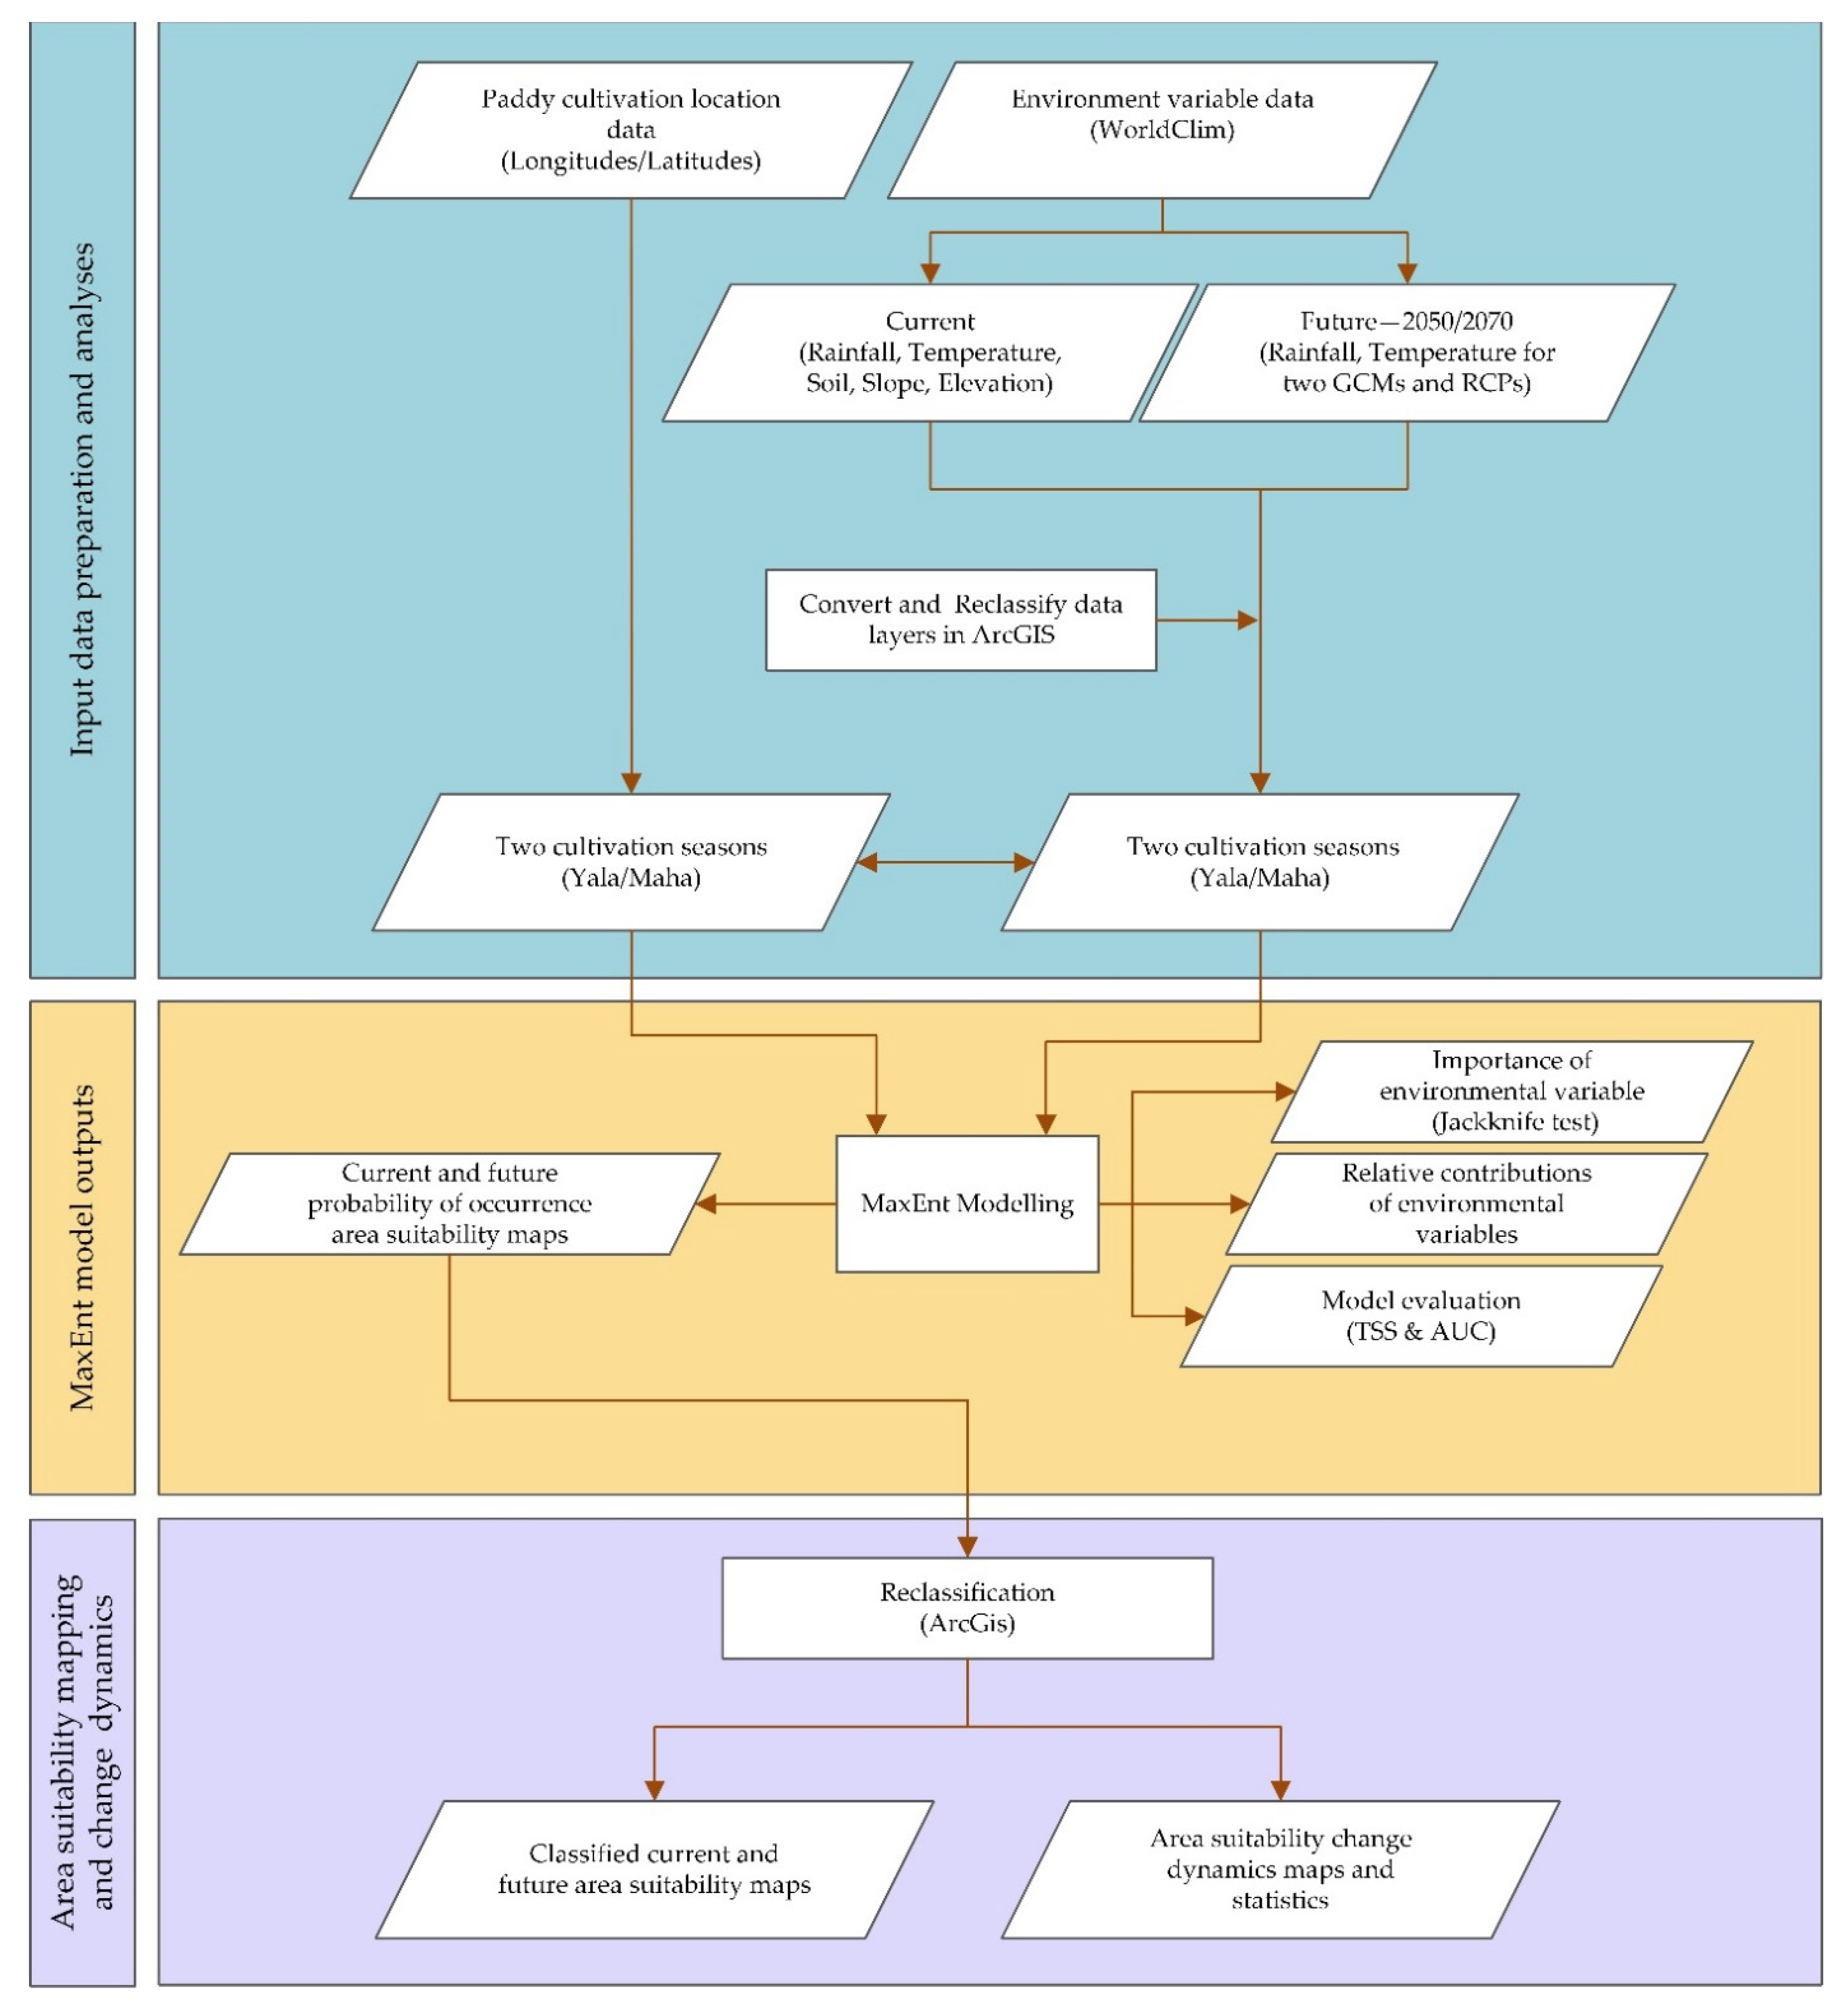
MaxEnt species distribution modelling technique (version 3.4.4) was used to identify the potential area of suitability for paddy cultivation in Sri Lanka [94,95]. MaxEnt is an extensively used modelling technique with demonstrated ability to correctly forecast the geographic distribution of species under changing climatic conditions [95,96]. The performance of MaxEnt is high compared to several other presence-only modelling methods [55]. Further, MaxEnt results in a continuous output (‘.asc’ file extension) that can be transformed into GIS-compatible output [94]. Out of the 648 paddy cultivation location points, MaxEnt was run for the Yala season with 181 location points and for the Maha season with 467 location points. Of the full set of location points, 80% were used for model development and the remaining 20% for accuracy testing. The maximum number of iterations was set to 1000, allowing the model to adequately converge for a better and uniform prediction. Auto features type was selected, enabling the model to select the best combination of feature types [94,95,96]. Cloglog was selected as the output format to represent the probability—ranging from 0 to 1 of potential distribution [50]. All the other parameters were set at MaxEnt software (version 3.4.3) 3.4.3 default values, since the use of default parameters has been verified to work well across a range of species with varying numbers of occurrences [95]. Model accuracy was tested using the Area Under the Curve (AUC), the True Skill Statistic (TSS), Sensitivity and Specificity [97,98,99].

2.4.4. Area Suitability Mapping and Change Dynamics

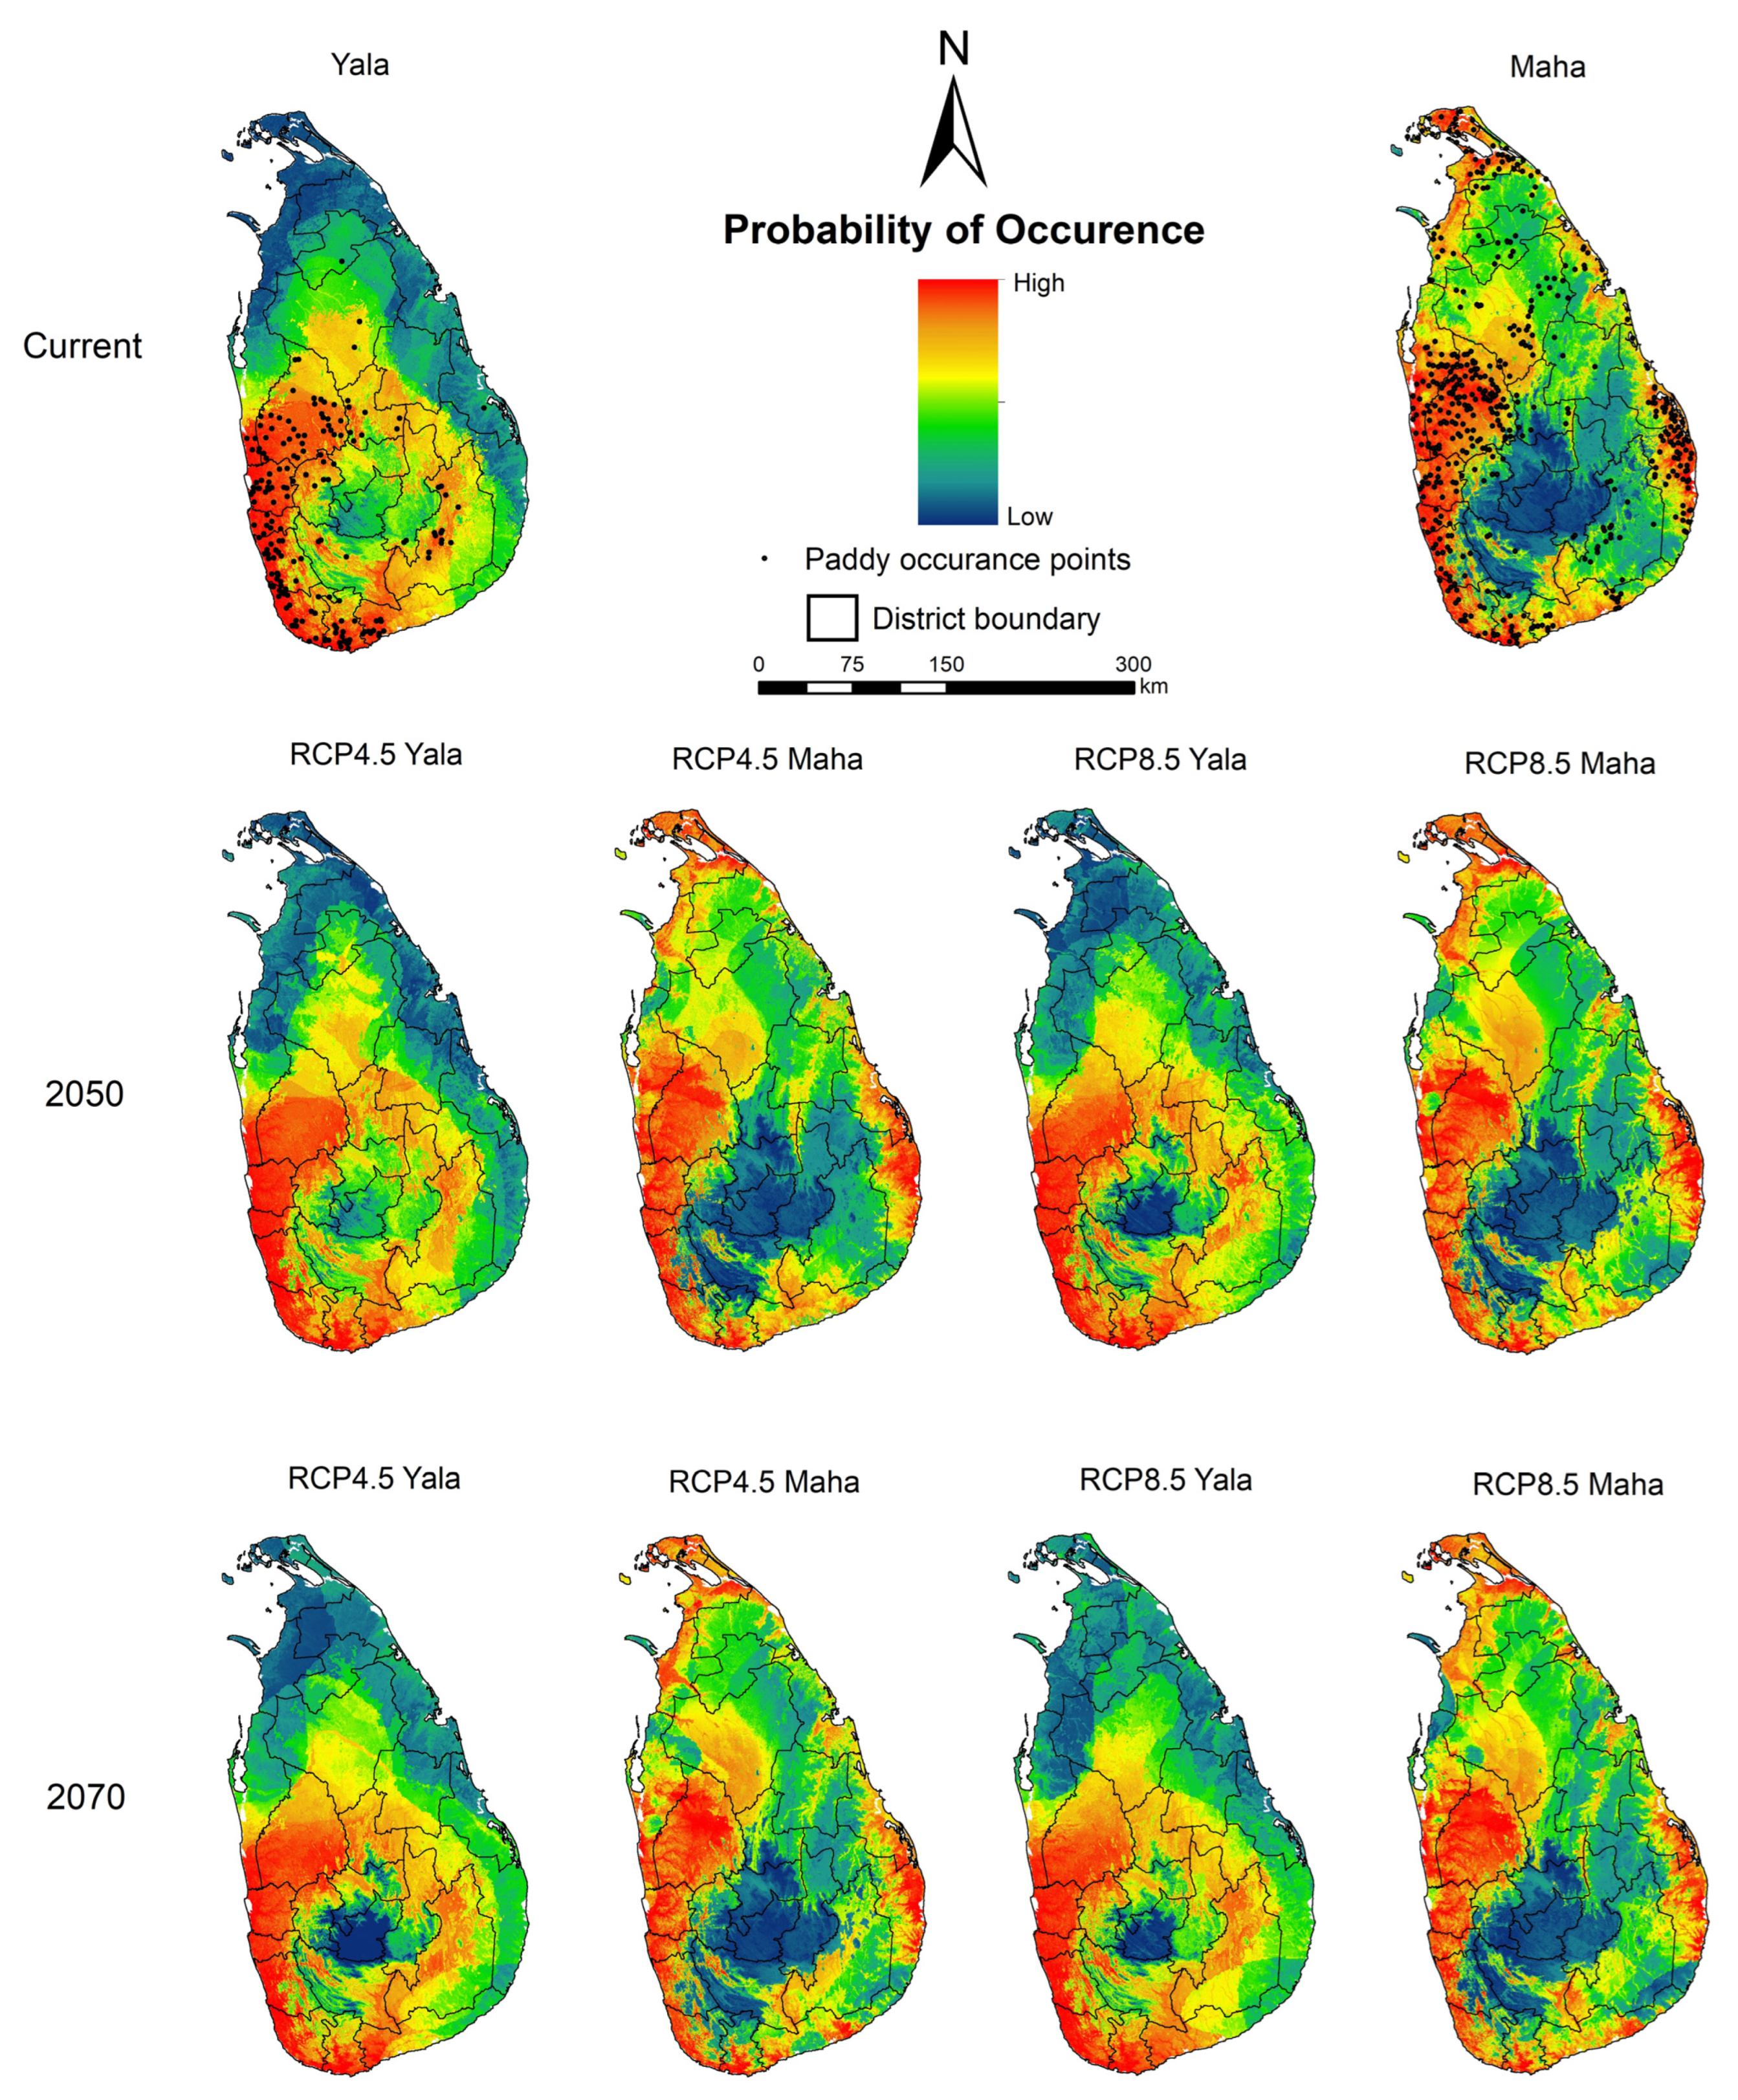
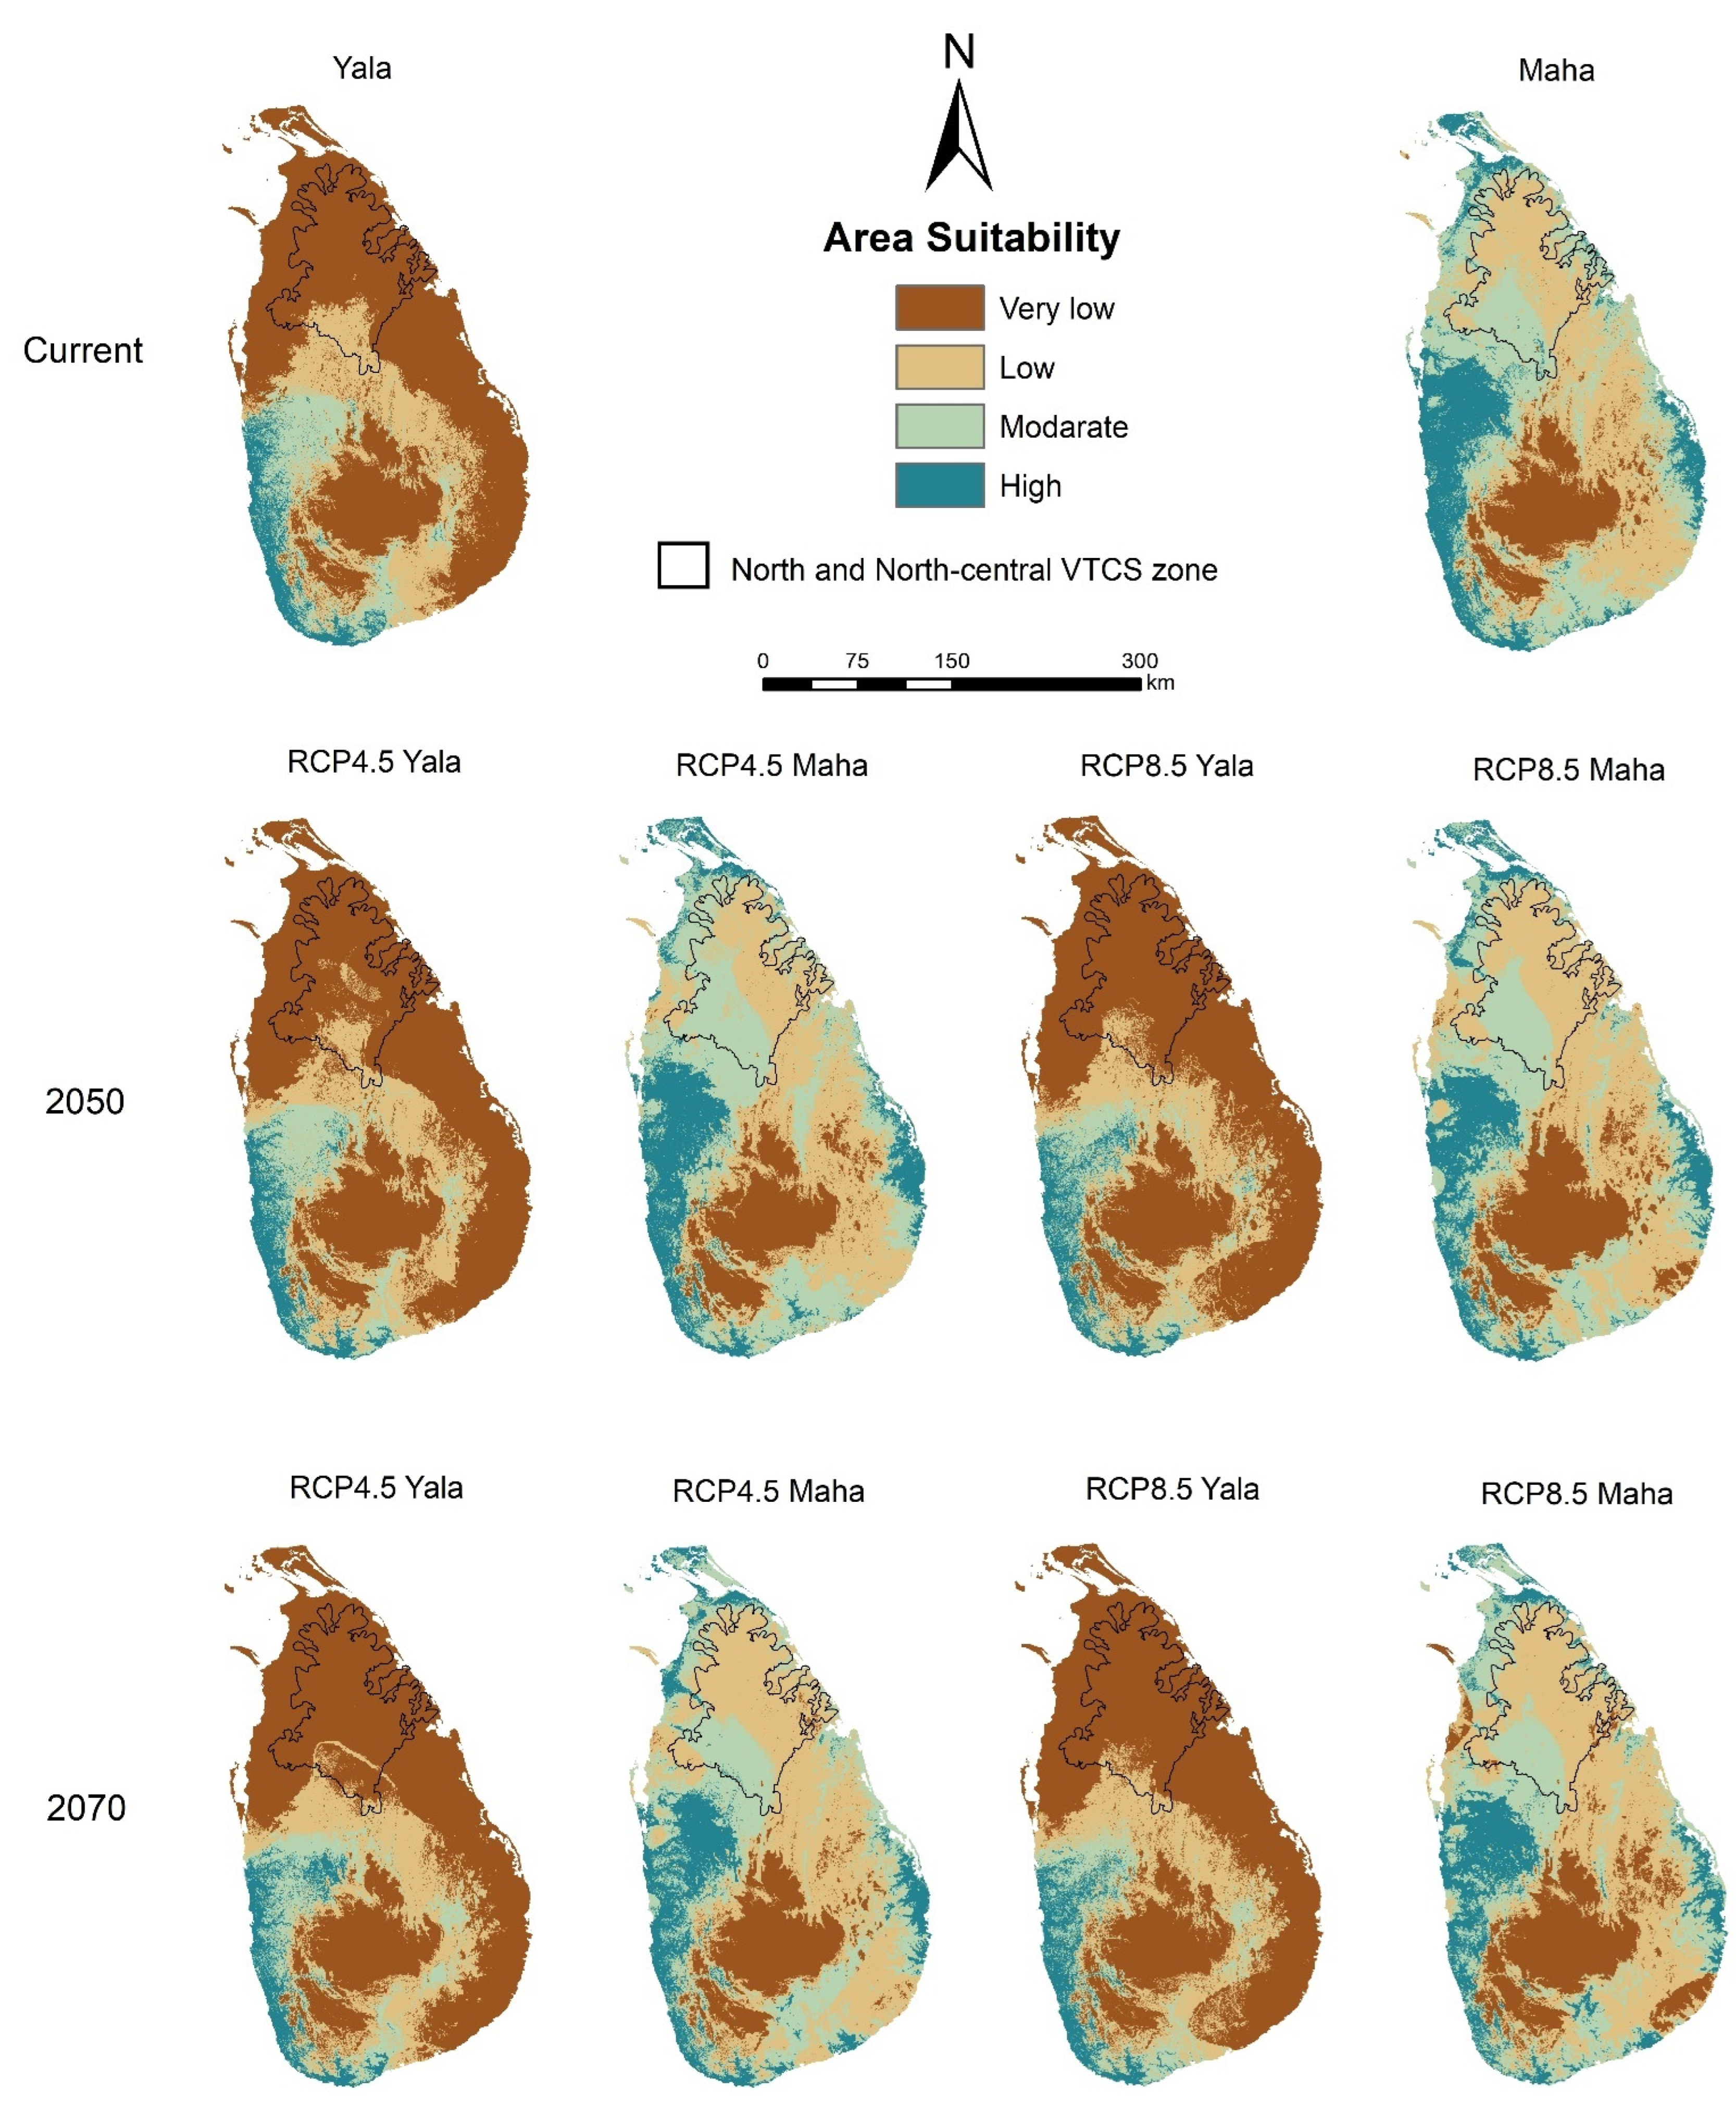
The Probability of occurrence (potential occurrence localities) maps for paddy (Oryza sativa L.) developed with MaxEnt model pertaining to the two cultivation seasons (Yala and Maha) and five climate scenarios (current, 2050/RCP4.5, 2050/RCP8.5, 2070/RCP4.5 and 2070/RCP8.5) were imported as gridded maps into ArcMap software environment for further analysis. The probability of occurrence maps was classified based on probability values ranging from 0 to 1, following the approach adopted by [40,46,49,50,100,101,102]. Accordingly, gridded maps for area suitability for paddy cultivation in Sri Lanka were developed by dividing into four classes considering the probability values of each grid, using the reclassify tool in ArcMap. The range of probability (p) values defined for each suitability class were: (i) Very low suitability (p < 0.1); (ii) Low suitability (0.1 ≤ p < 0.33); (iii) Moderate suitability (0.33 ≤ p < 0.66); and (iv) High suitability (p ≥ 0.66) for minor irrigated and rainfed paddy cultivation. Change detection of area suitability for paddy cultivation for future climate change scenarios was calculated with respect to the suitability for current climatic conditions, using pixel-based spatial analysis and expressed as positive (+), negative (−) and no change (0). The above four suitability classes were further reclassified in ArcMap with the aim of analysing spatiotemporal dynamics—shifts of suitability areas in the North and North-central VTCS from current to projected climate suitability under medium-term and long-term climate scenarios. The process followed for MaxEnt modelling, and area suitability analyses are shown in Figure 5.

3. Results

3.1. Changes in Observed Climate

3.1.1. Changes in Variability and Trends of Temperature and Rainfall

Changes in interannual monthly and seasonal temperature from 1970 to 2020 (GWP) in the North and North-central VTCS zone are given in Figure 6. Temperature exhibits an increasing trend that is significant at 95% confidence interval (p ≤ 0.04) in all months (except April) over the considered period (Figure 6a). The low R2 values (0.06–0.27) indicate high interannual variability of monthly mean temperature and seasonal temperature [103]. A significant increasing trend (p ≤ 0.01) in seasonal mean temperature by 0.02–0.03 °C/year is observed in four monsoon seasons (Figure 6b). The mean temperature of both cultivation seasons (Yala/Maha) of the North and North-central VTCS zone increases significantly (p = 0) by about 0.02 °C/year from 1970 to 2020 (Figure 6c).
Changes in interannual monthly and seasonal rainfall from 1970 to 2020 (GWP) in the North and North-central VTCS zone are given in Figure 7 and Figure 8. There are no significant trends observed in interannual rainfall in all months and monsoon seasons (p = 0.1–0.9) (Figure 7a,b). However, Yala cultivation records a significant positive trend (p = 0.03) (Figure 7c). Generally low R2 values recorded in all months and monsoon seasons indicate high interannual variability of rainfall during the period (Figure 7a,b). Relatively high interannual variability of rainfall is recorded during the Maha cultivation season compared to the Yala cultivation season (Figure 7c).

3.1.2. Anomalies of Probability Distribution of Temperature and Rainfall

Probability distributions for seasonal and annual temperature in the NGWP (1946 to 1970) and in the two consecutive twenty-five-year periods (1971–1995 and 1996–2020) during the GWP in the North and North-central VTCS zone are given in Figure 8. These distributions show shifts to the higher values (approximately 1.0 °C) from the 1946–1970 period (NGWP) to the 1971–1995 and 1996–2020 periods (GWP). Changes to variance in temperature are associated with these changes to higher annual and seasonal mean temperatures, suggesting greater interannual variability in annual and seasonal temperatures after 1946–1970. In addition, there is a likelihood of bimodal and trimodal distributions for seasonal temperature variations towards higher temperature values in the GWP.
Probability distributions for seasonal and annual rainfall in the NGWP (1946 to 1970) and in the two consecutive twenty-five-year periods (1971–1995 and 1996–2020) during the GWP in the North and North-central VTCS zone are given in Figure 9. Mean annual and seasonal (except SWM) rainfall decreased during the 1971–1995 period, but it increased for the most recent GWP (1996–2020) relative to NGWP (1946–1970). The mean annual rainfall decreased by 170 mm and increased by 47 mm in the period 1971–1995 and 1996–2020, respectively. During the GWP period, mean annual rainfall increased by 218 mm from the 1971–1995 period to the 1996–2020 period. Further, variance in probability distribution increases during the GWP (1971–1995 and 1996 to 2020). Similar patterns are observed for the four monsoon rainfall regimes. However, the North-east Monsoon (NEM) season rainfall pattern in 1971–2020 is more erratic, with extreme events.

3.2. Changes in Future Climate

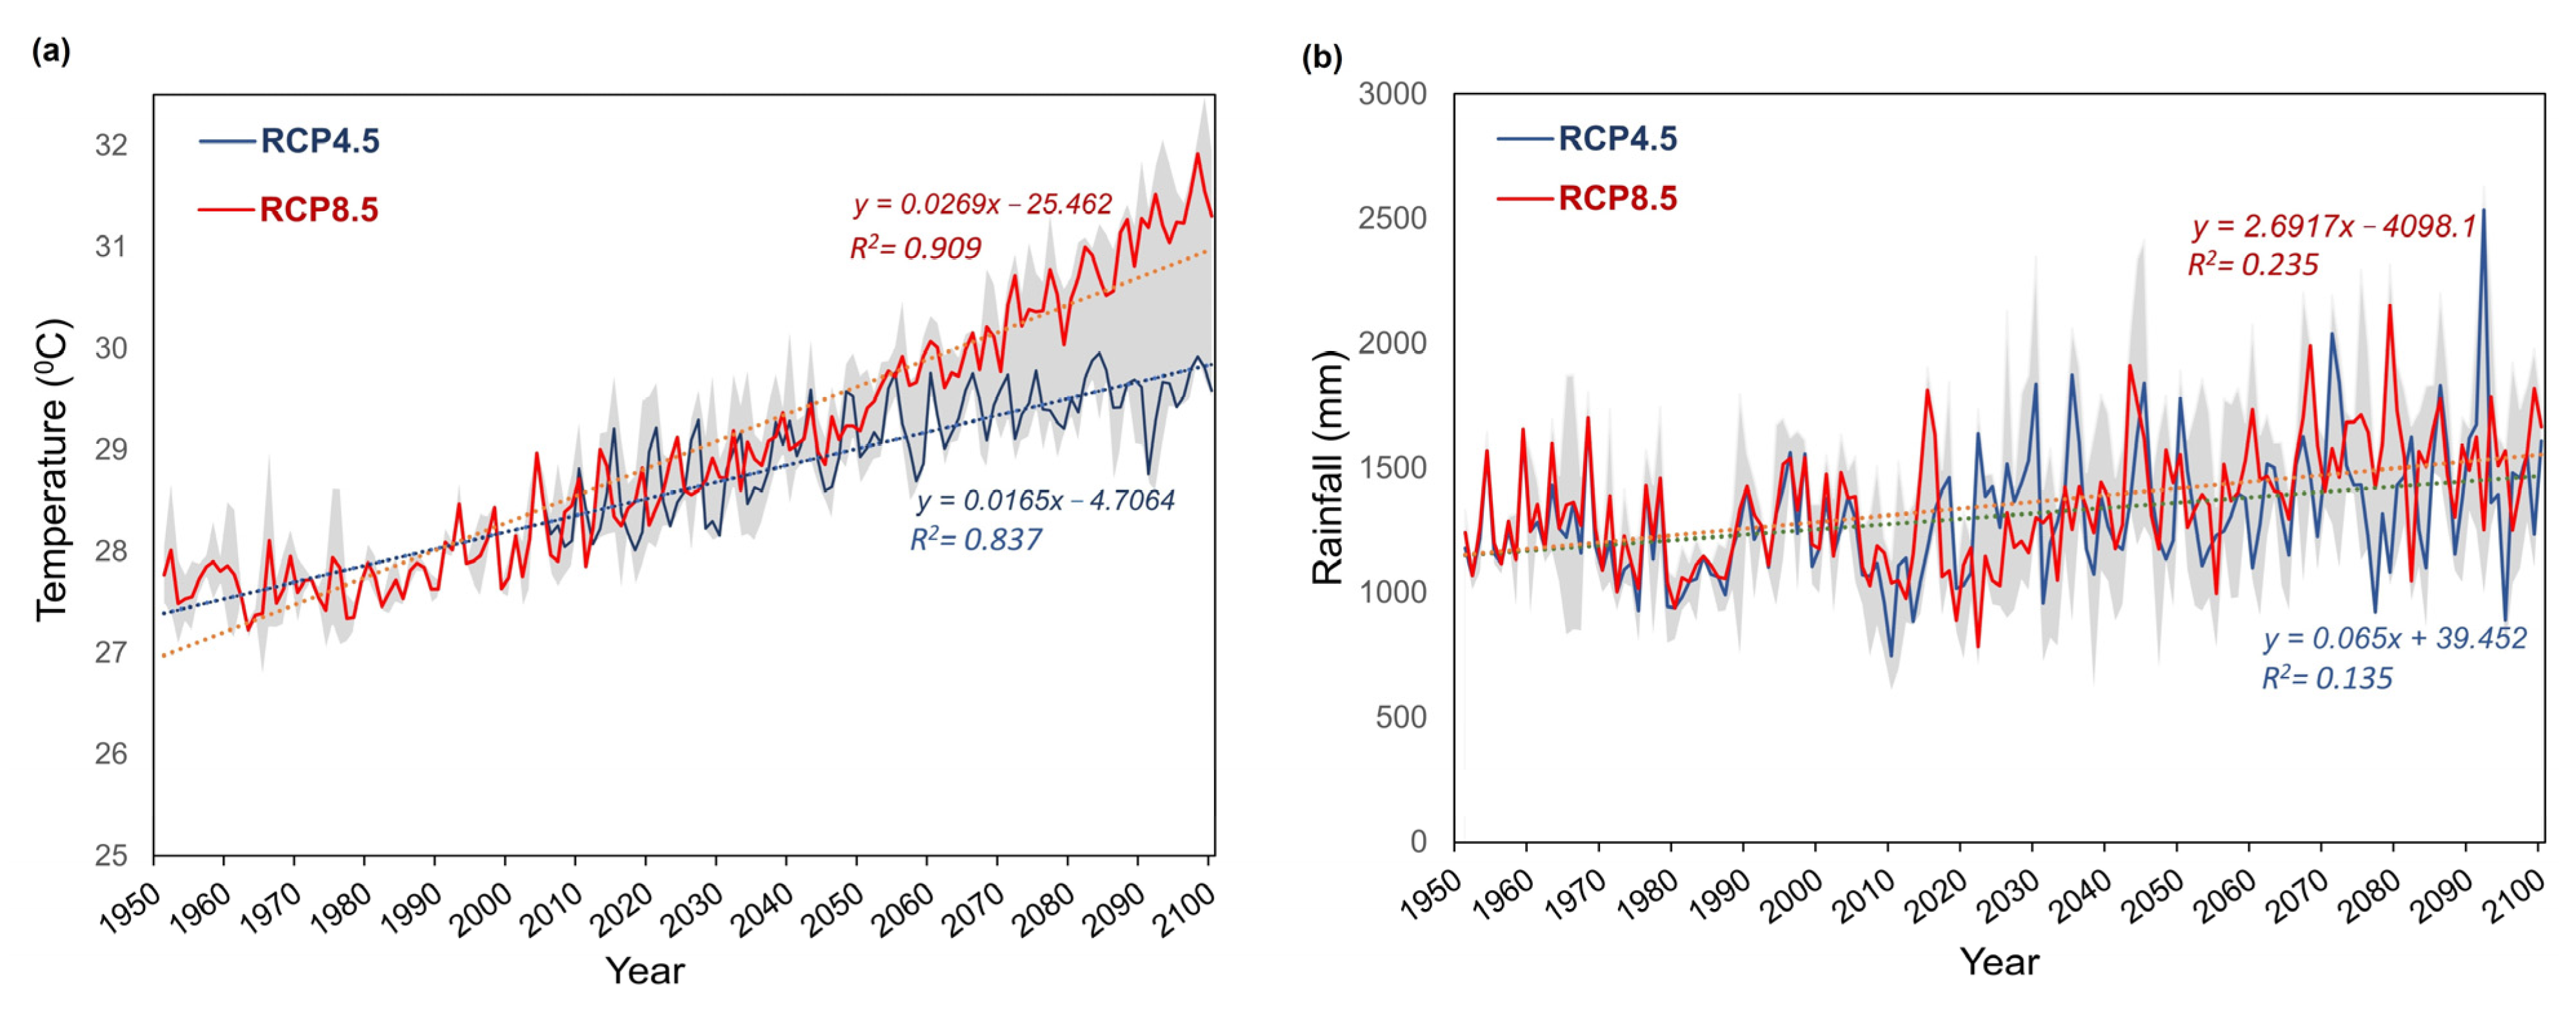
The analyses of projected temperature and rainfall time series data from 1950 to 2100 in the study area indicate trends of increasing temperature and rainfall in the North and North-central VTCS zone (Figure 10). The summary showing the projected mean annual temperature and rainfall trend analyses based on M-K and Sen’s slope statistical tests from 1950 to 2100 are presented in Table 2. Statistically significant trends (at 95% confidence interval) were detected for both temperature and rainfall for the considered period. Temperature for the projected period shows projected Sen’s slope increases of 0.02 °C/year and 0.03 °C/year for the RCP4.5 and RCP8.5 climate scenarios, respectively. Similarly, rainfall is projected to experience Sen’s slope increases of 2.0 mm/year and 2.9 mm/year for RCP4.5 and RCP8.5, respectively. Along with these increases, the rainfall projections are for increases in the interannual variability in rainfall towards the end of the 21st century (Figure 10b).

3.3. Changes in Future Climate Suitability Areas

Based on the probability of occurrence maps of the MaxEnt model (Figure 11), classified area suitability maps for minor irrigated and rainfed paddy cultivation in Sri Lanka were developed for the current and future climate scenarios (Figure 12). The accuracy assessment results of the MaxEnt model are presented in Table 3.
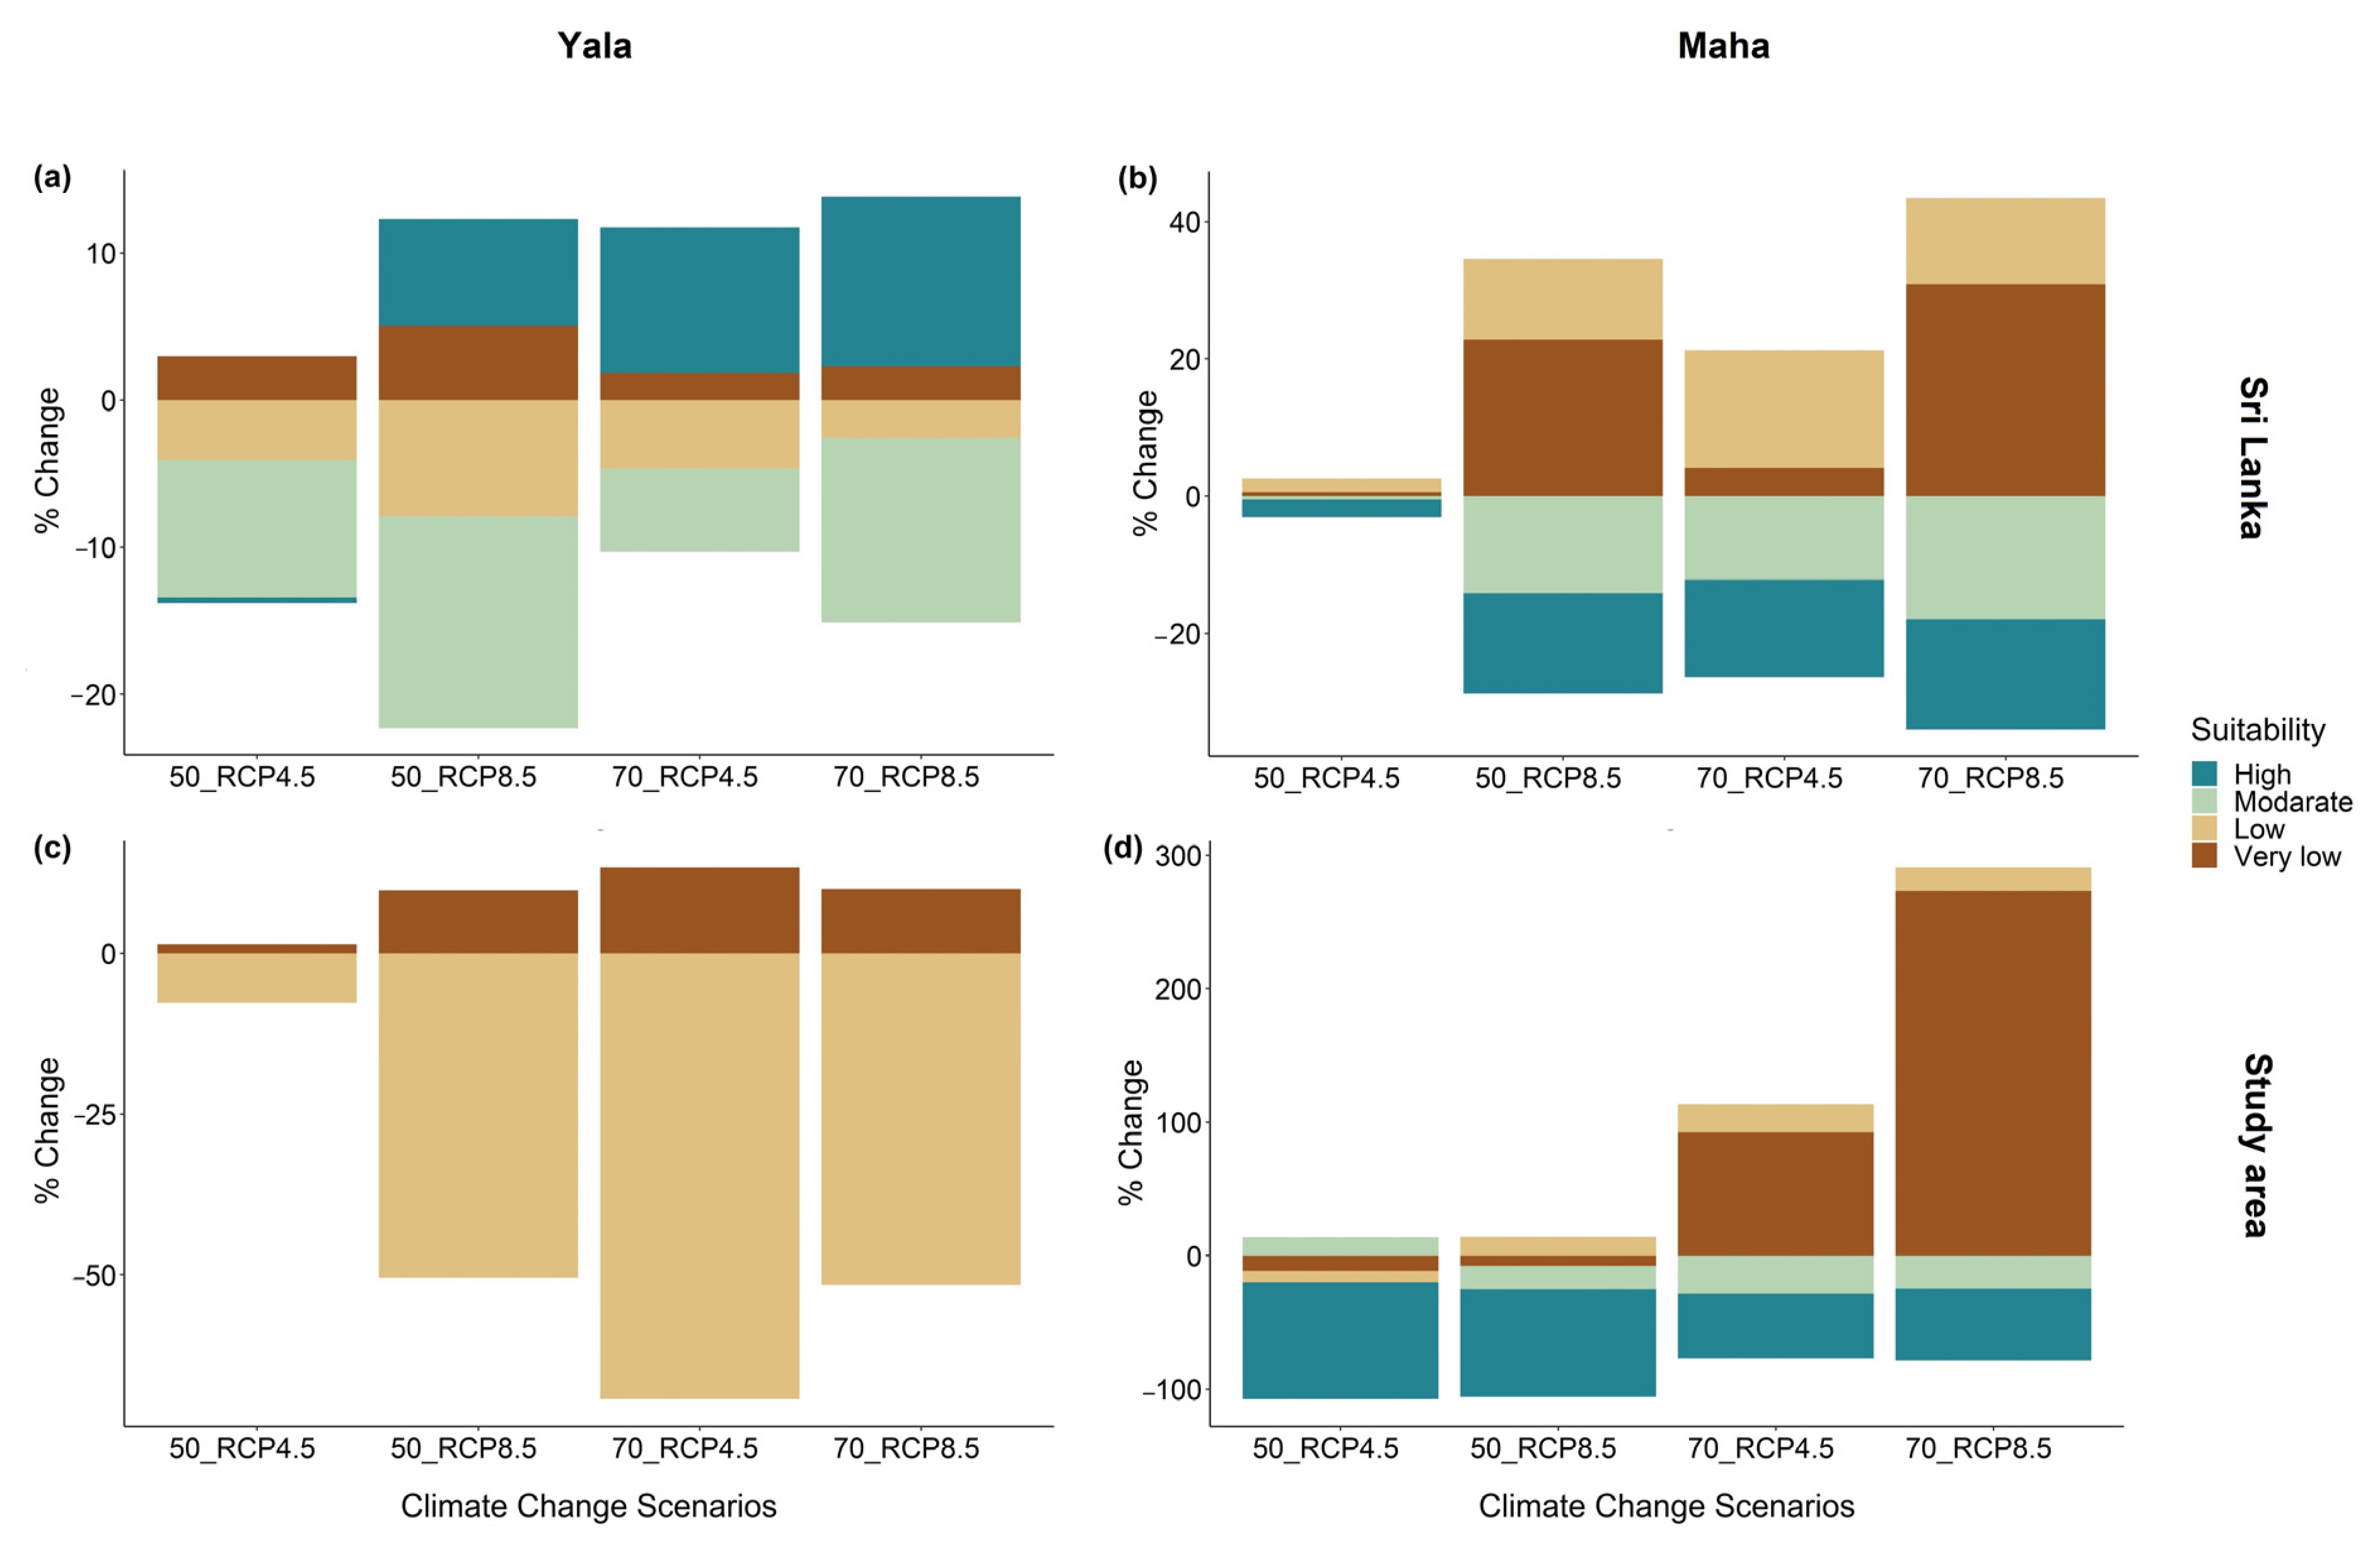
The projected change in areas by suitability for paddy production for all of Sri Lanka and within the North and North-central VTCS zone (study area) in both Yala and Maha cultivation seasons under each climate scenario are shown in Table 4 and Figure 13. These results show contrasting patterns for the whole country, compared to the North and North-central VTCS zone. For example, there are no highly and moderately suitable areas recorded for the Yala season in the North and North-central VTCS zone. Low suitability areas for the Yala season are projected to decrease by approximately 8% (RCP4.5) to 50% (RCP8.5) in the medium-term and 51% (RCP8.5) to 69% (RCP4.5) in long-term climate scenarios. The very low suitability areas are projected to increase by up to 10% (RCP8.5) in the medium-term and by 13% (RCP4.5) and 10% (RCP8.5) under long-term climate scenarios, compared to the current extent. In contrast, the extent of areas that are highly suitable for paddy cultivation for all of Sri Lanka will increase by approximately 7% (RCP8.5) in the medium-term and 10% (RCP4.5) to 11%(RCP8.5) in the long-term. The moderately suitable areas for all of Sri Lanka are projected to decrease by approximately 9% (RCP4.5) to 14% (RCP8.5) for the Yala season under the medium-term and 6% (RCP4.5) to 12% (RCP8.5) under the long-term climate scenarios, compared to the current extent. Similar to the VTCS zone, very low suitability areas in all of Sri Lanka will increase by approximately 3% (RCP4.5) to 5% (RCP8.5) in the medium-term and 2% in the long-term for the Yala season, compared to the current extent.
During the Maha cultivation season in all of Sri Lanka and within the North and North-central VTCS zone, it is projected that the extent of highly and moderately suitable areas will decrease in both medium and long-term climate scenarios. Within the VTCS zone, highly suitable areas are projected to decrease significantly by approximately 88% (RCP4.5) to 82% (RCP8.5) in the medium-term and 52% (RCP4.5) to 57% (RCP8.5) in the long-term climate scenarios, whereas for all of Sri Lanka, these areas are projected to decrease by approximately 2% (RCP4.5) to 15% (RCP8.5) in the medium-term and 14% (RCP4.5) to 16% (RCP8.5) in the long-term, compared to the current extent. Conversely, the extent of low and very low suitability areas for all of Sri Lanka and the VTCS zone is projected to increase in the Maha season in long-term climate projections, whereas very low suitable areas within the VTCS zone show a significant increase by approximately 92% (RCP4.5) to 273% (RCP8.5). For all of Sri Lanka, it will increase by approximately 0.5% (RCP4.5) and 23% (RCP8.5) in the medium-term and 4% (RCP4.5) and 31% (RCP8.5) in the long-term, compared to the current extent. However, in the medium-term, low suitable areas for Maha cultivation are projected to decrease in suitability by 11% (RCP4.5) and 8% (RCP8.5), compared to the current extent.

Spatio-Temporal Dynamics of Climate Suitability

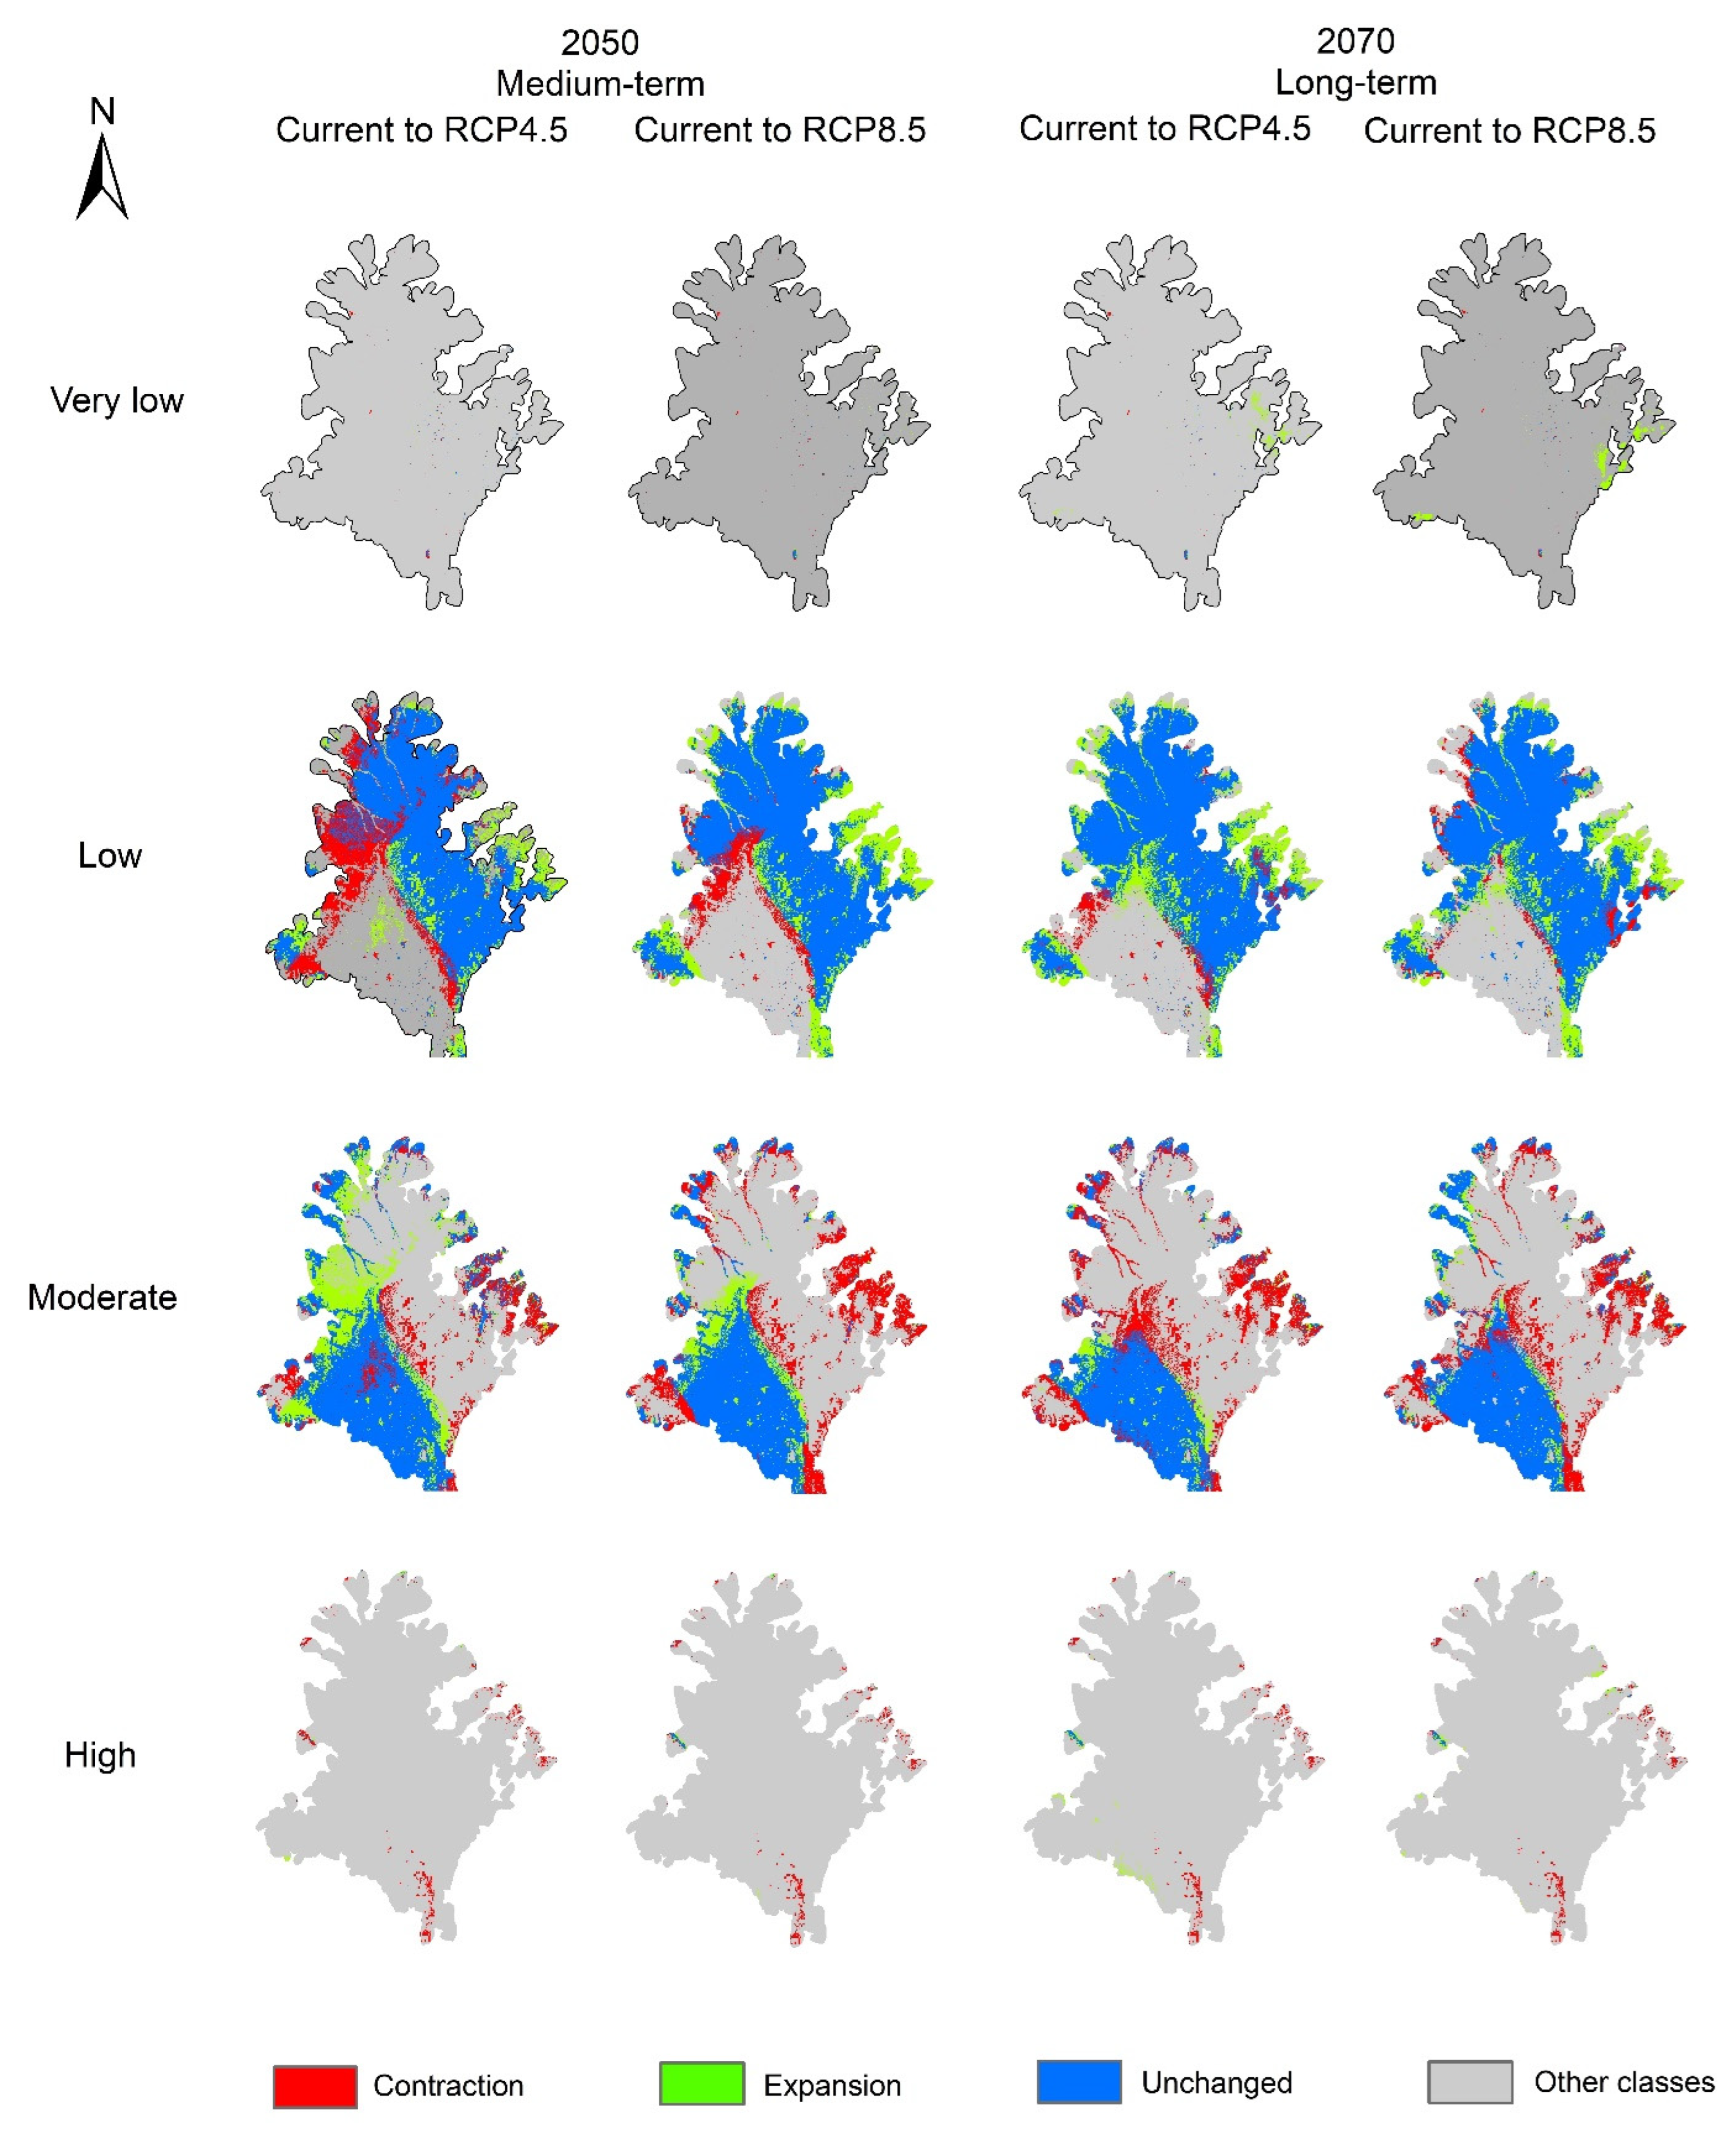
Spatio-temporal dynamics (spatial shifts/conversions) of climate suitability due to future climate change is described under three categories: (i) contraction (improvement or reduction of current suitability of a given class due to a shift/conversion to higher or lower suitability classes); (ii) expansion (expansion of current suitability of a given class due to a gain from other suitability classes); and (iii) constant (when the current suitability areas remain under current and future climate). The quantitative changes to climate suitability areas in relation to the current climate suitability under future climate change scenarios across the North and North-central VTCS zone in the Maha cultivation season are shown in Table 5 and Figure 14.
The study results indicate that highly suitable areas will reduce their current suitability by approximately 90% (RCP8.5) and 96% (RCP4.5) in the medium-term and 85% (RCP8.5) and 88% (RCP4.5) in the long-term climate scenarios. Likewise, moderate suitability areas will reduce current suitability to lower suitability by approximately 22% (RCP4.5) to 35% (RCP8.5) in the medium-term and 34% (RCP8.5) and 38% (RCP4.5) in the long-term climate scenarios. However, the extent of moderately suitable areas projected to remain unchanged is 65% (RCP8.5) and 78% (RCP4.5) in the medium-term and 62% (RCP4.5) and 66% (RCP8.5) in long-term climate scenarios, respectively. There is also a likelihood that areas with very-low suitability will substantially expand by approximately 35% (RCP4.5) and 38% (RCP8.5) in the medium-term and 277% (RCP4.5) and 511% (RCP8.5) in long-term, compared to the current extent. There is potential for expansion of lower suitability areas by approximately 17% (RCP4.5) to 27% (RCP8.5) in medium-term and 25% (RCP8.5) and 28% (RCP4.5) in long-term climate scenarios, due to a gain from moderate suitability areas. There is also a likelihood that approximately 76–89% and 94% of the low suitability areas will remain unchanged in the medium-term and the long-term climate scenarios, respectively.
The results show a reduction in the aggregate extent of low and moderate suitability classes in the future by approximately 23% (RCP4.5) and 21% (RCP8.5) in the medium-term, and 20% (RCP4.5) and 18% (RCP8.5) in long-term climate scenarios, compared to the current extent. Further spatial shifts of suitability areas from current suitability to future suitability classes occur in medium-term and long-term climate scenarios. Current lower suitability has converted to moderate suitability in the medium-term by approximately 24% (RCP4.5) and 11% (RCP8.5), and 5% and 4% for RCP4.5 and RCP8.5, respectively in long-term climate scenarios, compared to the current extent. There is also a likelihood of expansion of lower suitability due to conversion from moderate suitability areas by approximately 22% (RCP4.5) to 34% (RCP8.5) in the medium-term and 37% (RCP4.5) to 33% (RCP8.5) in long-term climate scenarios, compared to the current extent. Further, substantial extents of low and moderate suitability areas are projected to remain unchanged in the medium-term and long-term climate scenarios (Figure 15).

4. Discussion

4.1. Climate Variability and Trend

Predicted future climate change is likely to affect future global paddy production [2,50,104]. To study the impact of climate change, this study explored the effect of climate variability and change on rainwater-based (minor irrigated and rainfed) paddy farming in the North and North-central VTCS zone in Sri Lanka. The observed and projected climate data (temperature and rainfall) was analysed to explore past and future climate variability and trends in the study area. The M-K test and Sen’s slope estimator were used to examine the trend of the data series. Results show that the projected mean annual temperature of the North and North-central VTCS zone areas will undergo a significant (p = 0) warming trend (0.02 °C/year, RCP4.5 and 0.03 °C/year, RCP8.5) towards the end of the twenty-first century. A significant increasing trend in mean temperature in both cultivation seasons (Yala and Maha) was observed from 1970 to 2020, with high interannual variability, which is in agreement with recent studies conducted in the same area using Regional Climate Models (RCMs) and observed climate data and such as those of [20,22,36,105,106]. Temperature variations in January to February and June to July are important for the Maha and Yala cultivation seasons, respectively, as they affect the flowering and ripening stages of the paddy [29,46,107]. Extremely elevated temperatures may also lead to a decrease in water quality and availability for irrigation [88,89,92]. In summary, continued warming trends and increasing variability and more extreme temperature events are likely in the future, which will potentially impact rice production in the VTCS areas [69,104].
Paddy farming in the VTCSs is highly dependent on water availability during the cultivation seasons. Thus, although rainfall projections are less reliable compared to temperature in GCMs, particularly in island countries [46,108], an understanding of likely future rainfall is critical for evaluating climate change impact on paddy production in the VTCSs. According to [109] long-term variability and trend analysis of rainfall data is much more appropriate to understand erratic and extreme rainfall changes, compared to the secular trend analysis. The M-K and Sen’s slope test results showed that the trend of projected mean annual rainfall has been increasing significantly (p = 0) in the long-term, from 1950 to 2100, at a rate of 2.0 mm/year and 2.9 mm/year for RCP4.5 and RCP8.5, respectively. Further, the rainfall projections show a likelihood of increased interannual variation up to the end of the 21st century.
Analysis of climate data at interannual and multi-decadal time scales provides a better picture of climate variability in the tropics. [110]. Linear regression analysis of historical rainfall data from 1970 to 2020 showed high interannual variability of seasonal rainfall in the study area. Further, it was observed that there is high interannual variability of rainfall during the Maha cultivation season. High variability in September–October, January and March rainfall could detrimentally affect the establishment and flowering stages of paddy plant growth during the Maha cultivation season.

4.2. Anomalies of Probability Distribution of Temperature and Rainfall

Determining the probability of changes (mean and variance) in temperature and rainfall during multi-decadal time periods is important to understand anomalies of changing climate [109,111,112,113]. Anomalies of the probability distribution of rainfall and temperature may affect paddy productivity in the VTCS areas [39,114,115]. This study examined the temporal shifts of seasonal and annual temperature and rainfall during the period when the majority of global warming occurred (1975–2020) [69,70], in two consecutive twenty-five-year periods (1971–1995 and 1996–2020) relative to the NGWP (1946–1970). Changes in the probability of extreme temperature events increased mean temperature, and increased variability were projected during the GWP. The mean annual temperature of the GWP has increased by approximately 1.0 °C compared to that of NGWP. This is comparable with the observations of the global mean surface temperature data in the IPCC special report on the impact of global warming [111]. Increases in the probability of extreme rainfall events, annual and seasonal rainfall and variance were observed for the periods 1971–1995 and 1996–2020. Mean annual rainfall decreased by 170 mm and increased by 47 mm for the periods of 1971–1995 and 1996–2020, respectively, in the GWP relative to NGWP. With the projected increase in the trend of global warming and increasing ocean surface temperature, more intense variability in rainfall is likely to occur in future [93,110,116,117]. In addition, compounding and cascading effects of climate change such as the impact due to the interaction between the Indian Ocean Dipole (IOD) and El Niño-Southern Oscillation (ENSO) events in the Pacific Ocean could influence rainfall pattern anomalies and extreme events over the region [90]. This is likely to seriously disturb future paddy farming and food production in the VTCSs due to more uncertain and erratic rainfall patterns.

4.3. Changes in Climate Suitability

The study modelled the current suitability of areas within the North and North-central VTCS zone of Sri Lanka for paddy farming in the Maha cultivation season and how the extent and distribution of these areas are likely to change in the medium (2050) and long-term (2070) under RCP4.5 and RCP8.5 climate scenarios. Maha cultivation season in the VTCS areas is important for paddy production, due to high water productivity and cropping intensity compared to the Yala season [15,118]. Future climate change projections for the Maha season in the VTCS zone show a reduction of high and moderate suitability areas, whereas the extents of very low and low suitability areas are likely to increase. The moderate and low suitability areas are much more important for paddy production in the VTCS zone, since more than 98% of the current paddy cultivation areas are classed as moderate (50%) and low (48%) suitability, while high and very low suitability areas make up less than 2% of the current paddy cultivation extent. Therefore, the projected reduction in the extent of moderate and low suitability areas would have a great impact on future paddy production in the North and North-central VTCS zone.
Area suitability shifts (conversions) show expansion of areas likely to be suitable for paddy production under future climate scenarios. However, contraction of current suitability areas is likely to be more critical than the expansion of areas under future climate scenarios. Although the study results project expansion of areas likely to be suitable for paddy production through gain from other suitability classes, it is improbable that any expansion of newly suitable areas in a particular class would result in equal expansion of paddy cultivation into the newly suitable gain areas. This is because the areas with increased suitability may include non-arable land uses such as natural forests, water bodies, ecologically sensitive areas, built-up areas and areas planted with other field crops, due to the characteristics of highly diverse land use systems in SESs [39,104]. Thus, future research needs to be undertaken using finer scale land use assessments in VTCS areas, combined with modelling work to determine predicted suitability more consistent with reality.
The study findings are consistent with the observations in the Fifth Assessment Report of the IPCC [17], as well as the findings of [46,50] on the future potential change in areas suitable for rice growing throughout Asia. However, the modelling in this study has not taken into consideration (i) the changes in socioeconomic variables such as demographic and market trends which may have an effect on the paddy land use, and demand and supply of paddy production and (ii) the influence of future land use changes in the study area, which have impacts on ecosystem services linked with paddy farming system. Therefore, to further improve the model predictions of climate suitability of areas for paddy farming, socioeconomic and land use change variables could be used as an additional input layer in the modelling work.

5. Conclusions

This study assessed historical climate variability and trends over the past 75 years (1946–2020), and future trends (up to 2100) and evaluated their impacts on suitability areas of paddy farming in the VTCSs under two GCMs (MIROC5 and MPI-ESM-LR) for RCP4.5 and RCP8.5 climate scenarios for 2050 and 2070. Evaluation of historical climate change showed that the temperature increased by approximately 1.0 °C during the GWP. Further, positive secular warming trends of 0.02 °C/year, RCP4.5 and 0.03 °C/year under RCP8.5 are also projected in the future, until 2100. This period is also projected to experience high interannual variability in temperature. Rainfall shows high interannual variability during the last fifty years (1970–2020), but trends were not significant and were less discernible. However, projected rainfall data for 1950–2100 showed a significant (p = 0) upward trend of 2.0–2.9 mm/year. Further, analyses of rainfall and temperature probability distributions showed increases in long-term mean values during the last 50 years with temporal shifts of seasonality. Mean annual rainfall decreased by 170 mm and increased by 47 mm for the periods of 1971–1995 and 1996–2020, respectively, in the GWP relative to NGWP. In addition, there is a high possibility that the increasing trend of average ocean surface temperature and ENSO events will drive further changes to seasonal variability of rainfall and increase the number of extreme events in the future.
Changes to future climate suitability of areas for paddy were evaluated under medium-term (2050) and long-term (2070) for RCP4.5 and RCP8.5 climate scenarios based on five environment variables and paddy cultivation (rainfed and minor irrigated) location points. Both future scenarios project spatio-temporal shifts in climate suitability for paddy farming in the North and North-central VTCS zone. The MaxEnt model predicts that substantial extents of low and moderate suitability areas that are currently suitable will remain unchanged under future climate scenarios. However, the areas that are highly suitable for paddy cultivation are likely to decrease significantly in their suitability in the future compared to their current climate suitability. Further, the areas of moderate suitability are likely to reduce in the future by approximately 22% and 38%, compared to their current extent in the VTCS zone in the medium-term (2050) and long-term (2070), respectively, under the RCP4.5 climate scenario. The study provides evidence that the continuous warming trend with increasing variability in rainfall and shifting seasonality could increase the vulnerability of future paddy farming in the VTCSs. Therefore, it is imperative to adjust paddy farming patterns to deal with future climate change risks by enhancing adaptive capacity and building resilience of the paddy farming system in the VTCSs.

Author Contributions

Conceptualisation, S.S.R.; Methodology, S.S.R., P.B.D. and H.K.K.; Project administration; S.S.R.; Software, S.S.R. and H.K.K.; Data validation, S.S.R., M.R., P.B.D., H.K.K., K.H. and N.L.; Formal analysis, S.S.R. and H.K.K.; Visualisation, S.S.R. and H.K.K.; Investigation, S.S.R.; Data curation, S.S.R. and H.K.K.; Writing—original draft preparation, S.S.R.; Writing—review and editing, S.S.R., M.R., N.L., P.B.D., D.H., L.K., B.K., C.S.K. and K.H.; Supervision, M.R., N.L. and P.B.D. All authors have read and agreed to the published version of the manuscript.

Funding

This research was funded by an Australian Government Research Training Program (RTP) and Destination Australia Program (DAP) Scholarships through the University of New England (UNE), Australia to the first author.

Institutional Review Board Statement

Not applicable.

Informed Consent Statement

Not applicable.

Data Availability Statement

Not applicable.

Acknowledgments

The first author thankfully acknowledges the Alliance of Bioversity International and the International Center for Tropical Agriculture (CIAT), Italy for providing support for publishing this article. In addition, special thanks goes to the Director, Natural Resources Management Centre of the Department of Agriculture for facilitating to obtain spatial data, Azeem Khan, Department of Planning and Environment, NSW, Australia and Thilantha Dammalage, Applied Agricultural Remote Sensing Centre, School of Science and Technology, University of New England, NSW Australia for reviewing the article.

Conflicts of Interest

The authors declare no conflict of interest.

References

  1. Wheeler, T.; Von Braun, J. Climate change impacts on global food security. Science 2013, 341, 508–513. [Google Scholar] [CrossRef]
  2. Zhang, Z.; Li, Y.; Xinguo, C.; Wang, Y.; Niu, B.; Li Liu, D.; He, J.; Pulatov, B.; Hassan, I.; Meng, Q. Impact of climate change and planting date shifts on growth and yields of double cropping rice in southeastern China in future. Agric. Syst. 2023, 205, 103581. [Google Scholar] [CrossRef]
  3. IPCC. Summary for Policymakers. In Climate Change 2022: Impacts, Adaptation and Vulnerability. Contribution of Working Group II to the Sixth Assessment Report of the Intergovernmental Panel on Climate Change; Pörtner, H.-O., Roberts, D.C., Tignor, M., Poloczanska, E.S., Mintenbeck, K., Alegría, A., Craig, M., Langsdorf, S., Löschke, S., Möller, V., et al., Eds.; Cambridge University Press: Cambridge, UK; New York, NY, USA, 2022; pp. 3–33. [Google Scholar]
  4. Ricciardi, V.; Ramankutty, N.; Mehrabi, Z.; Jarvis, L.; Chookolingo, B. How much of the world’s food do smallholders produce? Glob. Food Secur. 2018, 17, 64–72. [Google Scholar] [CrossRef]
  5. Hlophe-Ginindza, S.N.; Mpandeli, N. The Role of Small-Scale Farmers in Ensuring Food Security in Africa. In Food Security in Africa; Barakat, M., Ed.; IntechOpen: London, UK, 2020; p. 11. [Google Scholar]
  6. Fanzo, J. From big to small: The significance of smallholder farms in the global food system. Lancet Planet. Health 2017, 1, e15–e16. [Google Scholar] [CrossRef]
  7. IPCC. Summary for Policymakers. In Climate Change and Land: An IPCC Special Report On Climate Change, Desertification, Land Degradation, Sustainable Land Management, Food Security, and Greenhouse Gas Fluxes in Terrestrial Ecosystems; Shukla, P.R., Skea, J., Buendia, E.C., Masson-Delmotte, V., Pörtner, H.-O., Roberts, D.C., Zhai, P., Slade, R., Connors, S., Diemen, R.V., et al., Eds.; Cambridge University Press: Cambridge, UK; New York, NY, USA, 2019; pp. 3–36. [Google Scholar]
  8. FAO. “Globally Important Agricultural Heritage Systems” (GIAHS). Available online: https://www.fao.org/giahs/giahsaroundtheworld/designated-sites/asia-and-the-pacific/the-cascaded-tank-village-system-ctvs-in-the-dry-zone-of-sri-lanka/detailed-information/en/ (accessed on 26 January 2021).
  9. Weerahewa, J.; Timsina, J.; Wickramasinghe, C.; Mimasha, S.; Dayananda, D.; Puspakumara, G. Ancient irrigation systems in Asia and Africa: Typologies, degradation and ecosystem services. Agric. Syst. 2023, 205, 103580. [Google Scholar] [CrossRef]
  10. Ratnayake, S.S.; Khan, A.; Reid, M.; Dharmasena, P.B.; Hunter, D.; Kumar, L.; Herath, K.; Kogo, B.; Kadupitiya, H.K.; Dammalage, T.; et al. Land Use-Based Participatory Assessment of Ecosystem Services for Ecological Restoration in Village Tank Cascade Systems of Sri Lanka. Sustainability 2022, 14, 10180. [Google Scholar] [CrossRef]
  11. Dharmasena, P. Cascaded Tank-Village System: Present status and prospects. In Agricultural Research for Sustainable Food Systems in Sri Lanka; Marambe, B., Weerahewa, J., Dandeniya, W.S., Eds.; Springer: Singapore, 2020; pp. 63–75. [Google Scholar]
  12. Sebastian, M.K.; Azeez, P. Ecological and Ethno-Cultural Examination of the Rise and Fall of Rice Culture in Southern India with Special Reference to the Western Ghats; Sálim Ali Centre for Ornithology and Natural History: Coimbatore, India, 2014; p. 159. [Google Scholar]
  13. FAO. Globally Important Agricultural Heritage Systems: Combining Agricultural Biodiversity, Resilient Ecosystems, Traditional Farming Practices and Cultural Identity; FAO: Rome, Italy, 2018; Available online: https://www.fao.org/documents/card/en/c/I9187EN (accessed on 26 January 2021).
  14. Dayananda, D.; Weerahewa, J.; Weerasooriya, S. Water availability, crop choices and profitability of farming: A case study of Mahakanumulla tank village. Trop. Agric. Res. 2021, 32, 81–94. [Google Scholar] [CrossRef]
  15. Sirimanna, S.; Prasada, D. Water productivity in tank cascade systems: A case study in Mahakanumulla tank cascade, Sri Lanka. Trop. Agric. Res. 2021, 32, 298–306. [Google Scholar] [CrossRef]
  16. Gunawardena, E. Proposed Research Areas Considering the Present-Day Challenges Associated with Minor Tanks/Tank Cascades. In Proceedings of the Cascade Ecology and Management, Peradeniya, Sri Lanka, 17–18 September 2021; Weerasooriya, S.A., Dayananda, M.D.T., Rajapaksha, R.W.W.K.A.D., Silva, P.S.H., Nayanathara, U.W.N.N., Wickramasinghe, M.R.C.P., Kulasinghe, H.P.G.T.N., Eds.; Faculty of Agriculture, University of Peradeniya: Peradeniya, Sri Lanka, 2021; pp. 16–17. [Google Scholar]
  17. IPCC. Climate Change 2014: Impacts, Adaptation, and Vulnerability. Part B: Regional Aspects. Contribution of Working Group II to the Fifth Assessment Report of the Intergovernmental Panel on Climate Change. In AR5-Fifth Assessment Report of the Intergovernmental Panel on Climate Change; Barros, V.R., Field, C.B., Dokken, D.J., Mastrandrea, M.D., Mach, K.J., Bilir, T.E., Chatterjee, M., Ebi, K.L., Estrada, Y.O., Genova, R.C., et al., Eds.; Cambridge University Press: Cambridge, UK; New York, NY, USA, 2014; p. 688. [Google Scholar]
  18. Lobell, D.B.; Gourdji, S.M. The influence of climate change on global crop productivity. Plant Physiol. 2012, 160, 1686–1697. [Google Scholar] [CrossRef] [Green Version]
  19. Lobell, D.B.; Burke, M.B.; Tebaldi, C.; Mastrandrea, M.D.; Falcon, W.P.; Naylor, R.L. Prioritizing climate change adaptation needs for food security in 2030. Science 2008, 319, 607–610. [Google Scholar] [CrossRef]
  20. APN. Climate Smart Agriculture through Sustainable Water Use Management: Exploring New Approaches and Devising Strategies for Climate Change Adaptation in South Asia; Asia-Pacific Network for Global Change Research: Kobe, Japan, 2018; p. 65. [Google Scholar]
  21. WFP. Sri Lanka food Security Atlas: Livelihoods, Food Security and Resilience; World Food Programme: Colombo, Sri Lanka, 2015; p. 27. [Google Scholar]
  22. Kariyawasam, C.S.; Kumar, L.; Kogo, B.K.; Ratnayake, S.S. Long-term changes of aquatic invasive plants and implications for future distribution: A case study using a tank cascade system in Sri Lanka. Climate 2021, 9, 31. [Google Scholar] [CrossRef]
  23. Ratnayake, R.S.S.; Kumar, L.; Dharmasena, P.B.; Kadupitiya, H.K.; Kariyawasam, C.S.; Hunter, D. Sustainability of village tank cascade systems of Sri Lanka: Exploring cascade anatomy and socio-ecological nexus for ecological restoration planning. Challenges 2021, 12, 24. [Google Scholar] [CrossRef]
  24. Wickramasinghe, M.R.C.P.; Dayawansa, N.D.K.; Jayasiri, M.M.J.G.C.N.; Silva, R.P.D. A study on external pressures of an ancient irrigation cascade system in Sri Lanka. Agric. Syst. 2023, 205, 13. [Google Scholar] [CrossRef]
  25. Jayawardena, I.S.P.; Darshika, D.T.; Herath, H.R.C. Recent trends in climate extreme indices over Sri Lanka. Am. J. Clim. Chang. 2018, 7, 586–599. [Google Scholar] [CrossRef] [Green Version]
  26. MOE. National Adaptation Plan for Climate Change Impacts in Sri Lanka: 2016–2025; Climate Change Secretariat, Ministry of Mahaweli Development and Environment: Colombo, Sri Lanka, 2016.
  27. Eriyagama, N.; Smakhtin, V. Observed and Projected Climatic Changes, Their Impacts and Adaptation Options for Sri Lanka: A Review. In Proceedings of the National Conference on Water, Food Security and Climate Change in Sri Lanka, BMICH, Colombo, Sri Lanka, 9–11 June 2009; Evans, A., Jinapala, K., Eds.; International Water Management Institute (IWMI): Colombo, Sri Lanka, 2010; p. 186. [Google Scholar]
  28. IOB. Adapting to Climate Change: A Sri Lankan Perspective; Institute of Biology Sri Lanka (IOBSL): Colombo, Sri Lanka, 2020; p. 198. [Google Scholar]
  29. Eriyagama, N.; Smakhtin, V.; Chandrapala, L.; Fernando, K. Impacts of Climate Change on Water Resources and Agriculture In Sri Lanka: A Review and Preliminary Vulnerability Mapping: IWMI Research Report 135; International Water Management Institute (IWMI): Colombo, Sri Lanka, 2010; p. 51. [Google Scholar]
  30. Dharmasena, P.B. Soil Erodibility and Rainfall Erosivity in the Dry Zone of Sri Lanka: Chapter 5 of the Ph.D. Thesis ‘Soil Erosion Control Measures for Rain-Fed Farming in the Dry Zone of Sri Lanka’. Ph.D. Thesis, University of Peradeniya, Peradeniya, Sri Lanka, 1992. [Google Scholar]
  31. Menike, A.R.M.M.P.; Hemachandra, E.M.G.P.; Dayawansa, N.D.K.; Galagedara, L.W.; Mowjood, M.I.M. Assessment of The Mitigation Capacity of Village Tank Cascade System (VTCS) on Climatic Extremes (Flood and Drought) Using Standard Precipitation Index (SPI). In Proceedings of the Cascade Ecology and Management (CEM), Peradeniya, Sri Lanka, 17–18 September 2021; Weerasooriya, S.A., Dayananda, M.T.D., Rajapaksha, A.D., Silva, P.S.H., Nayanathara, U.W.N.N., Wickramasinghe, M.R.C.P., Kulasinghe, G.T.N., Eds.; Faculty of Agriculture, University of Peradeniya: Peradeniya, Sri Lanka, 2021; pp. 47–49. [Google Scholar]
  32. Wickramasinghe, M.R.C.P.; Dayawansa, N.D.K.; De Silva, R.P.; Jayasiri, M.M.J.G.C.N. Impact of Human Interventions On The Ancient Village Tank Cascade Systems: A Case Study of Mahakanumulla Cascade System in Sri Lanka. In Proceedings of the Cascade Ecology and Management (CEM), University of Peradeniya, Peradeniya, Sri Lanka, 17–18 September 2021; Weerasooriya, S.A., Dayananda, M.T.D., Rajapaksha, A.D., Silva, P.S.H., Nayanathara, U.W.N.N., Wickramasinghe, M.R.C.P., Kulasinghe, G.T.N., Eds.; Faculty of Agriculture, University of Peradeniya: Peradeniya, Sri Lanka, 2021; pp. 50–53. [Google Scholar]
  33. De Silva, C.S. Impact of Climate Change on Water Resources and Agriculture in Sri Lanka. In Proceedings of the International Conference on Climate Change Impacts and Adaptations for Food and Environment Security on Sustaining Agriculture Under Changing Climate, Lunuwila, Sri Lanka, 30–31 July 2013; Gunasena, H.P.M., Gunathilake, H.A.J., Everard, J.M.D.T., Ranasinghe, C.S., Nainanayake, A.D., Eds.; Coconut Research Institute: Lunuwila, Sri Lanka; Ministry of Environment and Renewable Energy, Sri Lanka and World Agroforestry Center Regional Office: New Delhi, India, 2013; pp. 67–72. [Google Scholar]
  34. Muthuwatta, L.; Perera, H.; Eriyagama, N.; Upamali Surangika, K.; Premachandra, W. Trend and variability of rainfall in two river basins in Sri Lanka: An analysis of meteorological data and farmers’ perceptions. Water Int. 2017, 42, 981–999. [Google Scholar] [CrossRef]
  35. Leaker, A. An investigation of the factors affecting paddy yields from two districts of Sri Lanka. J. Natn. Sci. Coun. Sri Lanka 1984, 12, 71–92. [Google Scholar]
  36. De Silva, C.S.; Weatherhead, E.K.; Knox, J.W.; Rodriguez-Diaz, J.A. Predicting the impacts of climate change: A case study of paddy irrigation water requirements in Sri Lanka. Agric. Water Manage. 2007, 93, 19–29. [Google Scholar] [CrossRef]
  37. Hatfield, J.L.; Antle, J.; Garrett, K.A.; Izaurralde, R.C.; Mader, T.; Marshall, E.; Nearing, M.; Philip Robertson, G.; Ziska, L. Indicators of climate change in agricultural systems. Clim. Chang. 2020, 163, 1719–1732. [Google Scholar] [CrossRef] [Green Version]
  38. Hannah, L.; Roehrdanz, P.R.; K.C., K.B.; Fraser, E.D.; Donatti, C.I.; Saenz, L.; Wright, T.M.; Hijmans, R.J.; Mulligan, M.; Berg, A. The environmental consequences of climate-driven agricultural frontiers. PLoS ONE 2020, 15, e0228305. [Google Scholar]
  39. Zaveri, E.; Russ, J.; Damania, R. Rainfall anomalies are a significant driver of cropland expansion. Proc. Natl. Acad. Sci. USA 2020, 117, 10225–10233. [Google Scholar] [CrossRef]
  40. Dang, A.T.; Kumar, L.; Reid, M. Modelling the potential impacts of climate change on rice cultivation in Mekong Delta, Vietnam. Sustainability 2020, 12, 9608. [Google Scholar] [CrossRef]
  41. Jayawardena, S.; Darshika, T.; Herath, R. Observed Climate Trends, Future Climate Change Projections and Possible Impacts for Sri Lanka. In NeelaHaritha-Climate Change Magazine of Sri Lanka; The Climate Change Secretariat, Ministry of Mahaweli Development and Environment: Battaramulla, Sri Lanka, 2017; pp. 144–151. Available online: http://www.climatechange.lk/Publications_2016/NeelaHarithaMagazine_2017.pdf (accessed on 10 January 2021).
  42. Annisa, H.; Nugroho, B. Analysis and projections of rainfall using Representative Concentration Pathways (RCPs) scenarios in Sleman Yogyakarta. IOP Conf. Ser. Earth Environ. Sci. 2021, 653, 012099. [Google Scholar] [CrossRef]
  43. Okkan, U.; Kirdemir, U. Downscaling of monthly precipitation using CMIP5 climate models operated under RCPs. Meteorol. Appl. 2016, 23, 514–528. [Google Scholar] [CrossRef] [Green Version]
  44. Zhang, Y.; Wang, Y.; Niu, H. Spatio-temporal variations in the areas suitable for the cultivation of rice and maize in China under future climate scenarios. Sci. Total Environ. 2017, 601, 518–531. [Google Scholar] [CrossRef]
  45. Tangang, F.; Juneng, L.; Cruz, F.; Chung, J.X.; Ngai, S.T.; Salimun, E.; Mohd, M.S.F.; Santisirisomboon, J.; Singhruck, P.; PhanVan, T. Multi-model projections of precipitation extremes in Southeast Asia based on CORDEX-Southeast Asia simulations. Environ. Res. 2020, 184, 109350. [Google Scholar]
  46. Singh, K.; McClean, C.J.; Büker, P.; Hartley, S.E.; Hill, J.K. Mapping regional risks from climate change for rainfed rice cultivation in India. Agric. Syst. 2017, 156, 76–84. [Google Scholar] [CrossRef]
  47. Beck, J. Predicting climate change effects on agriculture from ecological niche modeling: Who profits, who loses? Clim. Chang. 2013, 116, 177–189. [Google Scholar] [CrossRef] [Green Version]
  48. Kogo, B.K.; Kumar, L.; Koech, R. Climate change and variability in Kenya: A review of impacts on agriculture and food security. Environ. Dev. Sustain. 2021, 23, 23–43. [Google Scholar] [CrossRef]
  49. Chhogyel, N.; Kumar, L.; Bajgai, Y.; Jayasinghe, L.S. Prediction of Bhutan’s ecological distribution of rice (Oryza sativa L.) under the impact of climate change through maximum entropy modelling. J. Agric. Sci. 2020, 158, 25–37. [Google Scholar] [CrossRef]
  50. Su, P.; Zhang, A.; Wang, R.; Wang, J.A.; Gao, Y.; Liu, F. Prediction of future natural suitable areas for rice under Representative Concentration Pathways (RCPs). Sustainability 2021, 13, 1580. [Google Scholar] [CrossRef]
  51. Heumann, B.W.; Walsh, S.J.; McDaniel, P.M. Assessing the application of a geographic presence-only model for land suitability mapping. Ecol. Inform. 2011, 6, 257–269. [Google Scholar] [CrossRef] [Green Version]
  52. Castro-Llanos, F.; Hyman, G.; Rubiano, J.; Ramirez-Villegas, J.; Achicanoy, H. Climate change favors rice production at higher elevations in Colombia. Mitig. Adapt. Strateg. Glob. Chang. 2019, 24, 1401–1430. [Google Scholar] [CrossRef]
  53. Akpoti, K.; Kabo-Bah, A.T.; Dossou-Yovo, E.R.; Groen, T.A.; Zwart, S.J. Mapping suitability for rice production in inland valley landscapes in Benin and Togo using environmental niche modeling. Sci. Total Environ. 2020, 709, 136165. [Google Scholar] [CrossRef]
  54. Liu, Z.; Yang, P.; Tang, H.; Wu, W.; Zhang, L.; Yu, Q.; Li, Z. Shifts in the extent and location of rice cropping areas match the climate change pattern in China during 1980–2010. Reg. Environ. Chang. 2015, 15, 919–929. [Google Scholar] [CrossRef]
  55. Elith, J.; Graham, C.H.; Anderson, R.P.; Dudík, M.; Ferrier, S.; Guisan, A.; Hijmans, R.J.; Huettmann, F.; Leathwick, J.R.; Lehmann, A. Novel methods improve prediction of species’ distributions from occurrence data. Ecography 2006, 29, 129–151. [Google Scholar] [CrossRef] [Green Version]
  56. Potter, R.; Halevi, G. Insights: Climate Change Collaboration: Why We Need An International Approach to Research; Clarivate: London, UK, 2022; p. 13. Available online: https://clarivate.com/webofsciencegroup/solutions/isi-institute-for-scientific-information/ (accessed on 20 March 2022).
  57. Kariyawasam, C.S.; Kumar, L.; Ratnayake, S.S.; Wijesundara, D. Potential risks of invasive alien plant species on native plant biodiversity in Sri Lanka due to climate change. Biodiversity 2021, 22, 24–34. [Google Scholar] [CrossRef]
  58. Kariyawasam, C.S.; Kumar, L.; Ratnayake, S.S. Potential distribution of aquatic invasive alien plants, Eichhornia crassipes and Salvinia molesta under climate change in Sri Lanka. Wetl. Ecol. Manag. 2021, 29, 531–545. [Google Scholar] [CrossRef]
  59. Ratnayake, S.; Kariyawasam, C.; Kumar, L.; Hunter, D.; Liyanage, A. Potential distribution of crop wild relatives under climate change in Sri Lanka: Implications for conservation of agricultural biodiversity. Curr. Res. Environ. Sustain. 2021, 3, 100092. [Google Scholar] [CrossRef]
  60. Ratnayake, S.S.; Kumar, L.; Kariyawasam, C.S. Neglected and underutilized fruit species in Sri Lanka: Prioritisation and understanding the potential distribution under climate change. Agronomy 2020, 10, 34. [Google Scholar] [CrossRef] [Green Version]
  61. Wijegunawardhana, A.; Abeynayake, N.; Kadupitiya, H. Mapping high-potential areas using maximum entropy modeling approach and constraints analysis of Pineapple (Ananas comosus) cultivation in Sri Lanka. Appl. Econ. Bus. 2019, 3, 35–46. [Google Scholar] [CrossRef]
  62. Jayasinghe, S.L.; Kumar, L. Modeling the climate suitability of tea [Camellia sinensis (L.) O. Kuntze] in Sri Lanka in response to current and future climate change scenarios. Agric. For. Meteorol. 2019, 272, 102–117. [Google Scholar] [CrossRef]
  63. Nekaris, K.; Arnell, A.P.; Svensson, M.S. Selecting a conservation surrogate species for small fragmented habitats using ecological niche modelling. Animals 2015, 5, 27–40. [Google Scholar] [CrossRef] [PubMed] [Green Version]
  64. Punyawardena, B.V.R. Rainfall of Sri Lanka and Agroecological Zones; Department of Agriculture: Peradeniaya, Sri Lanka, 2008.
  65. Panabokke, C.R. Soils and Agro-Ecological Environments of Sri Lanka; Natural Resources, Energy and Science Authority of Sri Lanka (NARESA): Colombo, Sri Lanka, 1996; p. 220.
  66. Dharmasena, P. Evolution of hydraulic societies in the ancient Anuradhapura Kingdom of Sri Lanka. In Landscapes and Societies; Martini, I.P., Chesworth, W., Eds.; Springer: Dordrecht, The Netherlands, 2010; pp. 341–352. [Google Scholar]
  67. Chandrapala, L. Long Term Trends of Rainfall and Temperature in Sri Lanka. In Climate Variability and Agriculture; Abrol, Y.P., Gadgil, S., Pant, G.B., Eds.; Narosa Publishing House: New Delhi, India, 1996; pp. 153–162. [Google Scholar]
  68. Nianthi, R. Drought Risk Reduction in the Dry Zone of Sri Lanka. In Droughts in Asian Monsoon Region; Shaw, R., Nguyen, H., Eds.; Emerald Group Publishing Limited: Bingley, UK, 2011; Volume 8, pp. 97–120. [Google Scholar]
  69. Joshi, M.K.; Rai, A.; Kulkarni, A.; Kucharski, F. Assessing changes in characteristics of hot extremes over India in a warming environment and their driving mechanisms. Sci. Rep. 2020, 10, 2631. [Google Scholar] [CrossRef] [PubMed] [Green Version]
  70. GISTEMP_Team. GISS Surface Temperature Analysis (GISTEMP), Version 4. NASA Goddard Institute for Space Studies. Available online: https://data.giss.nasa.gov/gistemp/ (accessed on 22 November 2022).
  71. Saini, A.; Sahu, N. Decoding trend of Indian summer monsoon rainfall using multimethod approach: (Century long Indian monsoon rainfall trend). Stoch. Environ. Res. Risk Assess. 2021, 35, 2313–2333. [Google Scholar] [CrossRef]
  72. R-Core-Team. R: A Language and Environment for Statistical Computing; R Foundation for Statistical Computing: Vienna, Austria, 2021. [Google Scholar]
  73. Sarkar, D. Lattice: Multivariate Data Visualization with R; Springer Science and Business Media: New York, NY, USA, 2008. [Google Scholar]
  74. Wickham, H. ggplot2: Elegant Graphics for Data Analysis; Springer: New York, NY, USA, 2016. [Google Scholar]
  75. Watanabe, M.; Suzuki, T.; O’ishi, R.; Komuro, Y.; Watanabe, S.; Emori, S.; Takemura, T.; Chikira, M.; Ogura, T.; Sekiguchi, M. Improved climate simulation by MIROC5: Mean states, variability, and climate sensitivity. J. Clim. 2010, 23, 6312–6335. [Google Scholar] [CrossRef]
  76. Giorgetta, M.A.; Jungclaus, J.; Reick, C.H.; Legutke, S.; Bader, J.; Böttinger, M.; Brovkin, V.; Crueger, T.; Esch, M.; Fieg, K. Climate and carbon cycle changes from 1850 to 2100 in MPI-ESM simulations for the Coupled Model Intercomparison Project phase 5. J. Adv. Model. Earth Syst. 2013, 5, 572–597. [Google Scholar] [CrossRef]
  77. Mann, H.B. Nonparametric tests against trend. Econom. J. Econom. Soc. 1945, 13, 245–259. [Google Scholar] [CrossRef]
  78. Kendall, M.G. Rank Correlation Methods; Griffin: London, UK, 1948. [Google Scholar]
  79. Sen, P.K. Estimates of the regression coefficient based on Kendall’s tau. J. Am. Stat. Assoc. 1968, 63, 1379–1389. [Google Scholar] [CrossRef]
  80. Panda, A.; Sahu, N. Trend analysis of seasonal rainfall and temperature pattern in Kalahandi, Bolangir and Koraput districts of Odisha, India. Atmos. Sci. Lett. 2019, 20, e932. [Google Scholar] [CrossRef] [Green Version]
  81. Pohlert, T. Non-parametric trend tests and change-point detection. CC BY-ND 2016, 4. Available online: https://scirp.org/reference/referencespapers.aspx?referenceid=2220745 (accessed on 8 May 2023).
  82. Kadupitiya, H.K.; Madushan, R.N.; Gunawardhane, D.; Sirisena, D.; Rathnayake, U.; Dissanayaka, D.; Ariyaratne, M.; Marambe, B.; Suriyagoda, L. Mapping productivity-related spatial characteristics in rice-based cropping systems in Sri Lanka. J. Geovis. Spat. Anal. 2022, 6, 26. [Google Scholar] [CrossRef]
  83. Kadupitiya, H.K.; Madushan, R.N.; Rathnayake, U.K.; Thilakasiri, R.; Dissanayaka, S.B.; Ariyaratne, M.; Marambe, B.; Nijamudeen, M.S.; Sirisena, D.; Suriyagoda, L. Use of smartphones for rapid location tracking in mega scale soil sampling. Open J. Appl. Sci. 2021, 11, 239. [Google Scholar] [CrossRef]
  84. Mod, H.K.; Scherrer, D.; Luoto, M.; Guisan, A. What we use is not what we know: Environmental predictors in plant distribution models. J. Veg. Sci. 2016, 27, 1308–1322. [Google Scholar] [CrossRef] [Green Version]
  85. West, A.M.; Kumar, S.; Wakie, T.; Brown, C.S.; Stohlgren, T.J.; Laituri, M.; Bromberg, J. Using high-resolution future climate scenarios to forecast Bromus tectorum invasion in Rocky Mountain National Park. PLoS ONE 2015, 10, e0117893. [Google Scholar] [CrossRef]
  86. Kihoro, J.; Bosco, N.J.; Murage, H. Suitability analysis for rice growing sites using a multicriteria evaluation and GIS approach in great Mwea region, Kenya. SpringerPlus 2013, 2, 265. [Google Scholar] [CrossRef] [PubMed] [Green Version]
  87. Ran, Y.; Chen, H.; Ruan, D.; Liu, H.; Wang, S.; Tang, X.; Wu, W. Identification of factors affecting rice yield gap in southwest China: An experimental study. PLoS ONE 2018, 13, e0206479. [Google Scholar] [CrossRef] [PubMed] [Green Version]
  88. Ariyaratne, W.M.T.P. Effect of Climate Change on Rice Production and Mitigation. In Adapting to Climate Change: A Sri Lankan Perspective; Caldera, H.I.U., Perera, S.A.C.N., Eds.; Institute of Biology: Colombo, Sri Lanka, 2020; pp. 85–97. [Google Scholar]
  89. Senaratne, A.; Scarborough, H. Coping with Climatic Variability by Rainfed Farmers in Dry Zone, Sri Lanka: Towards Understanding Adaptation to Climate Change. In Proceedings of the AARES 2011: Australian Agricultural & Resource Economics Society (AARES) 55th Annual Conference, Melbourne, Australia, 8–11 February 2011; AARES: Melbourne, Australia, 2011; pp. 1–22. [Google Scholar]
  90. Sahu, N.; Saini, A.; Behera, S.; Sayama, T.; Nayak, S.; Sahu, L.; Duan, W.; Avtar, R.; Yamada, M.; Singh, R. Impact of indo-pacific climate variability on rice productivity in Bihar, India. Sustainability 2020, 12, 7023. [Google Scholar] [CrossRef]
  91. Hussain, S.; Khaliq, A.; Ali, B.; Hussain, H.A.; Qadir, T.; Hussain, S. Temperature extremes: Impact on rice growth and development. In Plant Abiotic Stress Tolerance: Agronomic, Molecular and Biotechnological Approaches; Springer: Cham, Switherlands, 2019; pp. 153–171. [Google Scholar]
  92. Weerakoon, W.M.W.; Priyadarshani, T.N.N.; Piyasiri, C.H.; Silva, L.S. Impact of water saving irrigation systems on water use, growth and yield of irrigated lowland rice. In Proceedings of the National Conference on Water, Food Security and Climate Change in Sri Lanka, BMICH, Colombo, 9–11 June 2009; International Water Management Institute (IWMI): Colombo, Sri Lanka, 2010; pp. 57–64. [Google Scholar]
  93. Douville, H.; Allan, R.P.; Arias, P.A.; Betts, R.A.; Caretta, M.A.; Cherchi, A.; Mukherji, A.; Raghavan, K.; Renwick, J. Water remains a blind spot in climate change policies. PLOS Water 2022, 1, e0000058. [Google Scholar] [CrossRef]
  94. Phillips, S.; Anderson, R.P.; Schapire, R.E. Maximum entropy modelling of species geographic distributions. Ecol. Model. 2006, 190, 231–259. [Google Scholar] [CrossRef] [Green Version]
  95. Phillips, S.J.; Dudík, M. Modeling of species distributions with Maxent: New extensions and a comprehensive evaluation. Ecography 2008, 31, 161–175. [Google Scholar] [CrossRef]
  96. Merow, C.; Smith, M.J.; Silander, J.A. A practical guide to MaxEnt for modeling species’ distributions: What it does, and why inputs and settings matter. Ecography 2013, 36, 1058–1069. [Google Scholar] [CrossRef]
  97. Allouche, O.; Tsoar, A.; Kadmon, R. Assessing the accuracy of species distribution models: Prevalence, kappa and the true skill statistic (TSS). J. Appl. Ecol. 2006, 43, 1223–1232. [Google Scholar] [CrossRef]
  98. Fielding, A.H.; Bell, J.F. A review of methods for the assessment of prediction errors in conservation presence/absence models. Environ. Conserv. 1997, 24, 38–49. [Google Scholar] [CrossRef]
  99. Gallardo, B.; Aldridge, D.C. Is Great Britain heading for a Ponto–Caspian invasional meltdown? J. Appl. Ecol. 2015, 52, 41–49. [Google Scholar] [CrossRef] [Green Version]
  100. Khan, A.M.; Li, Q.; Saqib, Z.; Khan, N.; Habib, T.; Khalid, N.; Majeed, M.; Tariq, A. MaxEnt Modelling and impact of climate change on habitat suitability variations of economically important Chilgoza Pine (Pinus gerardiana Wall.) in South Asia. Forests 2022, 13, 715. [Google Scholar] [CrossRef]
  101. Duan, J.; Zhou, G. Dynamics of decadal changes in the distribution of double-cropping rice cultivation in China. Chin. Sci. Bull. 2013, 58, 1955–1963. [Google Scholar] [CrossRef] [Green Version]
  102. IPCC. Climate Change 2014: Synthesis Report. Contribution of Working Groups I, II and III to the Fifth Assessment Report of the Intergovernmental Panel on Climate Change. In AR5-Fifth Assessment Report of the Intergovernmental Panel on Climate Change; Core-Writing-Team, Pachauri, R.K., Meyer, L.A., Eds.; Intergovernmental Panel on Climate Change (IPCC): Geneva, Switzerland, 2014; p. 151. [Google Scholar]
  103. Jamal, M.R.; Kristiansen, P.; Kabir, M.J.; Kumar, L.; Lobry de Bruyn, L. Trajectories of cropping system intensification under changing environment in south-west coastal Bangladesh. Int. J. Agric. Sustain. 2022, 20, 722–742. [Google Scholar] [CrossRef]
  104. Wang, R.; Jiang, Y.; Su, P.; Wang, J.A. Global spatial distributions of and trends in rice exposure to high temperature. Sustainability 2019, 11, 6271. [Google Scholar] [CrossRef] [Green Version]
  105. Imbulana, N.; Manoharan, S. Hydrological and water balance studies to evaluate options for climate resilience in smallholder irrigation systems in Sri Lanka. Water Policy 2020, 22, 1024–1046. [Google Scholar] [CrossRef]
  106. Thevakaran, A.; McGregor, J.; Katzfey, J.; Thatcher, M.; Suppiah, R.; Sonnadara, U. Climate change projections over Sri Lanka. In Proceedings of the Computational and Simulation Perspectives: Looking ahead and Moving Across Boundaries, Sri Lanka Foundation Institute, Colombo, Sri Lanka, 17–19 May 2017; The Faculty of Science, University of Colombo: Colombo, Sri Lanka, 2017; pp. 210–213. [Google Scholar]
  107. Rathnayake, W.; De Silva, R.; Dayawansa, N. Assessment of the suitability of temperature and relative humidity for rice cultivation in rainfed lowland paddy fields in Kurunegala district. Trop. Agric. Res. 2016, 27, 370–388. [Google Scholar] [CrossRef] [Green Version]
  108. WBG; ADB. Climate Risk Country Profile, Sri Lanka; World Bank Group: Washington, DC, USA; Manila, Philippines, 2020; p. 32. [Google Scholar]
  109. Kambuaya, B.; Yuwono, A.; Rachmawaty, E. Climate Change Risk and Adaptation Assessment Greater Malang: Synthesis Report; Ministry of Environment: Jakarta, Indonesia, 2012; p. 213.
  110. Seneviratne, S.I.; Nicholls, N.; Easterling, D.; Goodess, C.M.; Kanae; Kossin, J.S.; Luo, Y.; Marengo, J.; McInnes, K.; Rahimi, M.; et al. Changes in climate extremes and their impacts on the natural physical environment. In Managing the Risks of Extreme Events and Disasters to Advance Climate Change Adaptation. A Special Report of Working Groups I and II of the Intergovernmental Panel on Climate Change (IPCC); Field, C.B., Barros, V., Stocker, T.F., Qin, D., Dokken, D.J., Ebi, K.L., Mastrandrea, M.D., Mach, K.J., Plattner, G.K., Allen, S.K., et al., Eds.; Cambridge University Press: Cambridge, UK; New York, NY, USA, 2012; pp. 109–230. [Google Scholar]
  111. IPCC. Summary for Policymakers. In Global Warming of 1.5 °C. An IPCC Special Report on the Impacts of Global Warming of 1.5 °C above Pre-Industrial Levels and Related Global Greenhouse Gas Emission Pathways, in the Context of Strengthening the Global Response to the Threat of Climate Change, Sustainable Development, and Efforts to Eradicate Poverty; Masson-Delmotte, V., Zhai, H.-O., Pörtner, D., Roberts, J., Skea, P.R., Shukla, A., Pirani, W., Moufouma-Okia, C., Péan, R.P.S., Connors, J.B.R., et al., Eds.; Cambridge University Press: Cambridge, UK; New York, NY, USA, 2018; pp. 3–24. [Google Scholar]
  112. Perkins-Kirkpatrick, S.; Pitman, A. Extreme events in the context of climate change. Public Health Res. Pract. 2018, 28, 2841825. [Google Scholar] [CrossRef] [PubMed] [Green Version]
  113. Rieman, B.E.; Isaak, D. Climate Change, Aquatic Ecosystems, and Fishes in the Rocky Mountain West: Implications and Alternatives for Management; United States Department of Agriculture, Forest Service, Rocky Mountain: Washington, DC, USA, 2010.
  114. de Silva, C.S. Climate change effects on the north-east monsoon and dry zone agriculture in Sri Lanka. In Proceedings of the Global Climate Change and its Impacts on Agriculture, Forestry and Water in the Tropics, Kandy, Sri Lanka, 10–11 September 2009; Nissanka, S.P., Sangakkara, U.R., Eds.; The Clean Development Mechanism (CDM) Study Centre, Department of Crop Science, Faculty of Agriculture, University of Peradeniya: Peradeniya, Sri Lanka, 2009; pp. 32–39. [Google Scholar]
  115. Premalal, K.H.M.S. Climate change in Sri Lanka. In Proceedings of the Global Climate Change and its Impacts on Agriculture, Forestry and Water in the Tropic, Kandy, Sri Lanka, 10–11 September 2009; Nissanka, S.P., Sangakkara, U.R., Eds.; The Clean Development Mechanism (CDM) Study Centre, Department of Crop Science, Faculty of Agriculture, University of Peradeniya: Peradeniya, Sri Lanka, 2009; pp. 21–31. [Google Scholar]
  116. NOAA. State of the Climate: Monthly Global Climate Report for Annual 2021. Available online: https://www.ncei.noaa.gov/access/monitoring/monthly-report/global/202113 (accessed on 1 July 2022).
  117. Krishna Kumar, K.; Rupa Kumar, K.; Ashrit, R.; Deshpande, N.; Hansen, J.W. Climate impacts on Indian agriculture. Int. J. Climatol. 2004, 24, 1375–1393. [Google Scholar] [CrossRef]
  118. Kahathuduwa, K.; Prasada, D. Variation of water productivity in paddy cultivation within a tank cascade: A case study in Ulagalla, Sri Lanka. Trop. Agric. Res. 2022, 33, 247–259. [Google Scholar] [CrossRef]
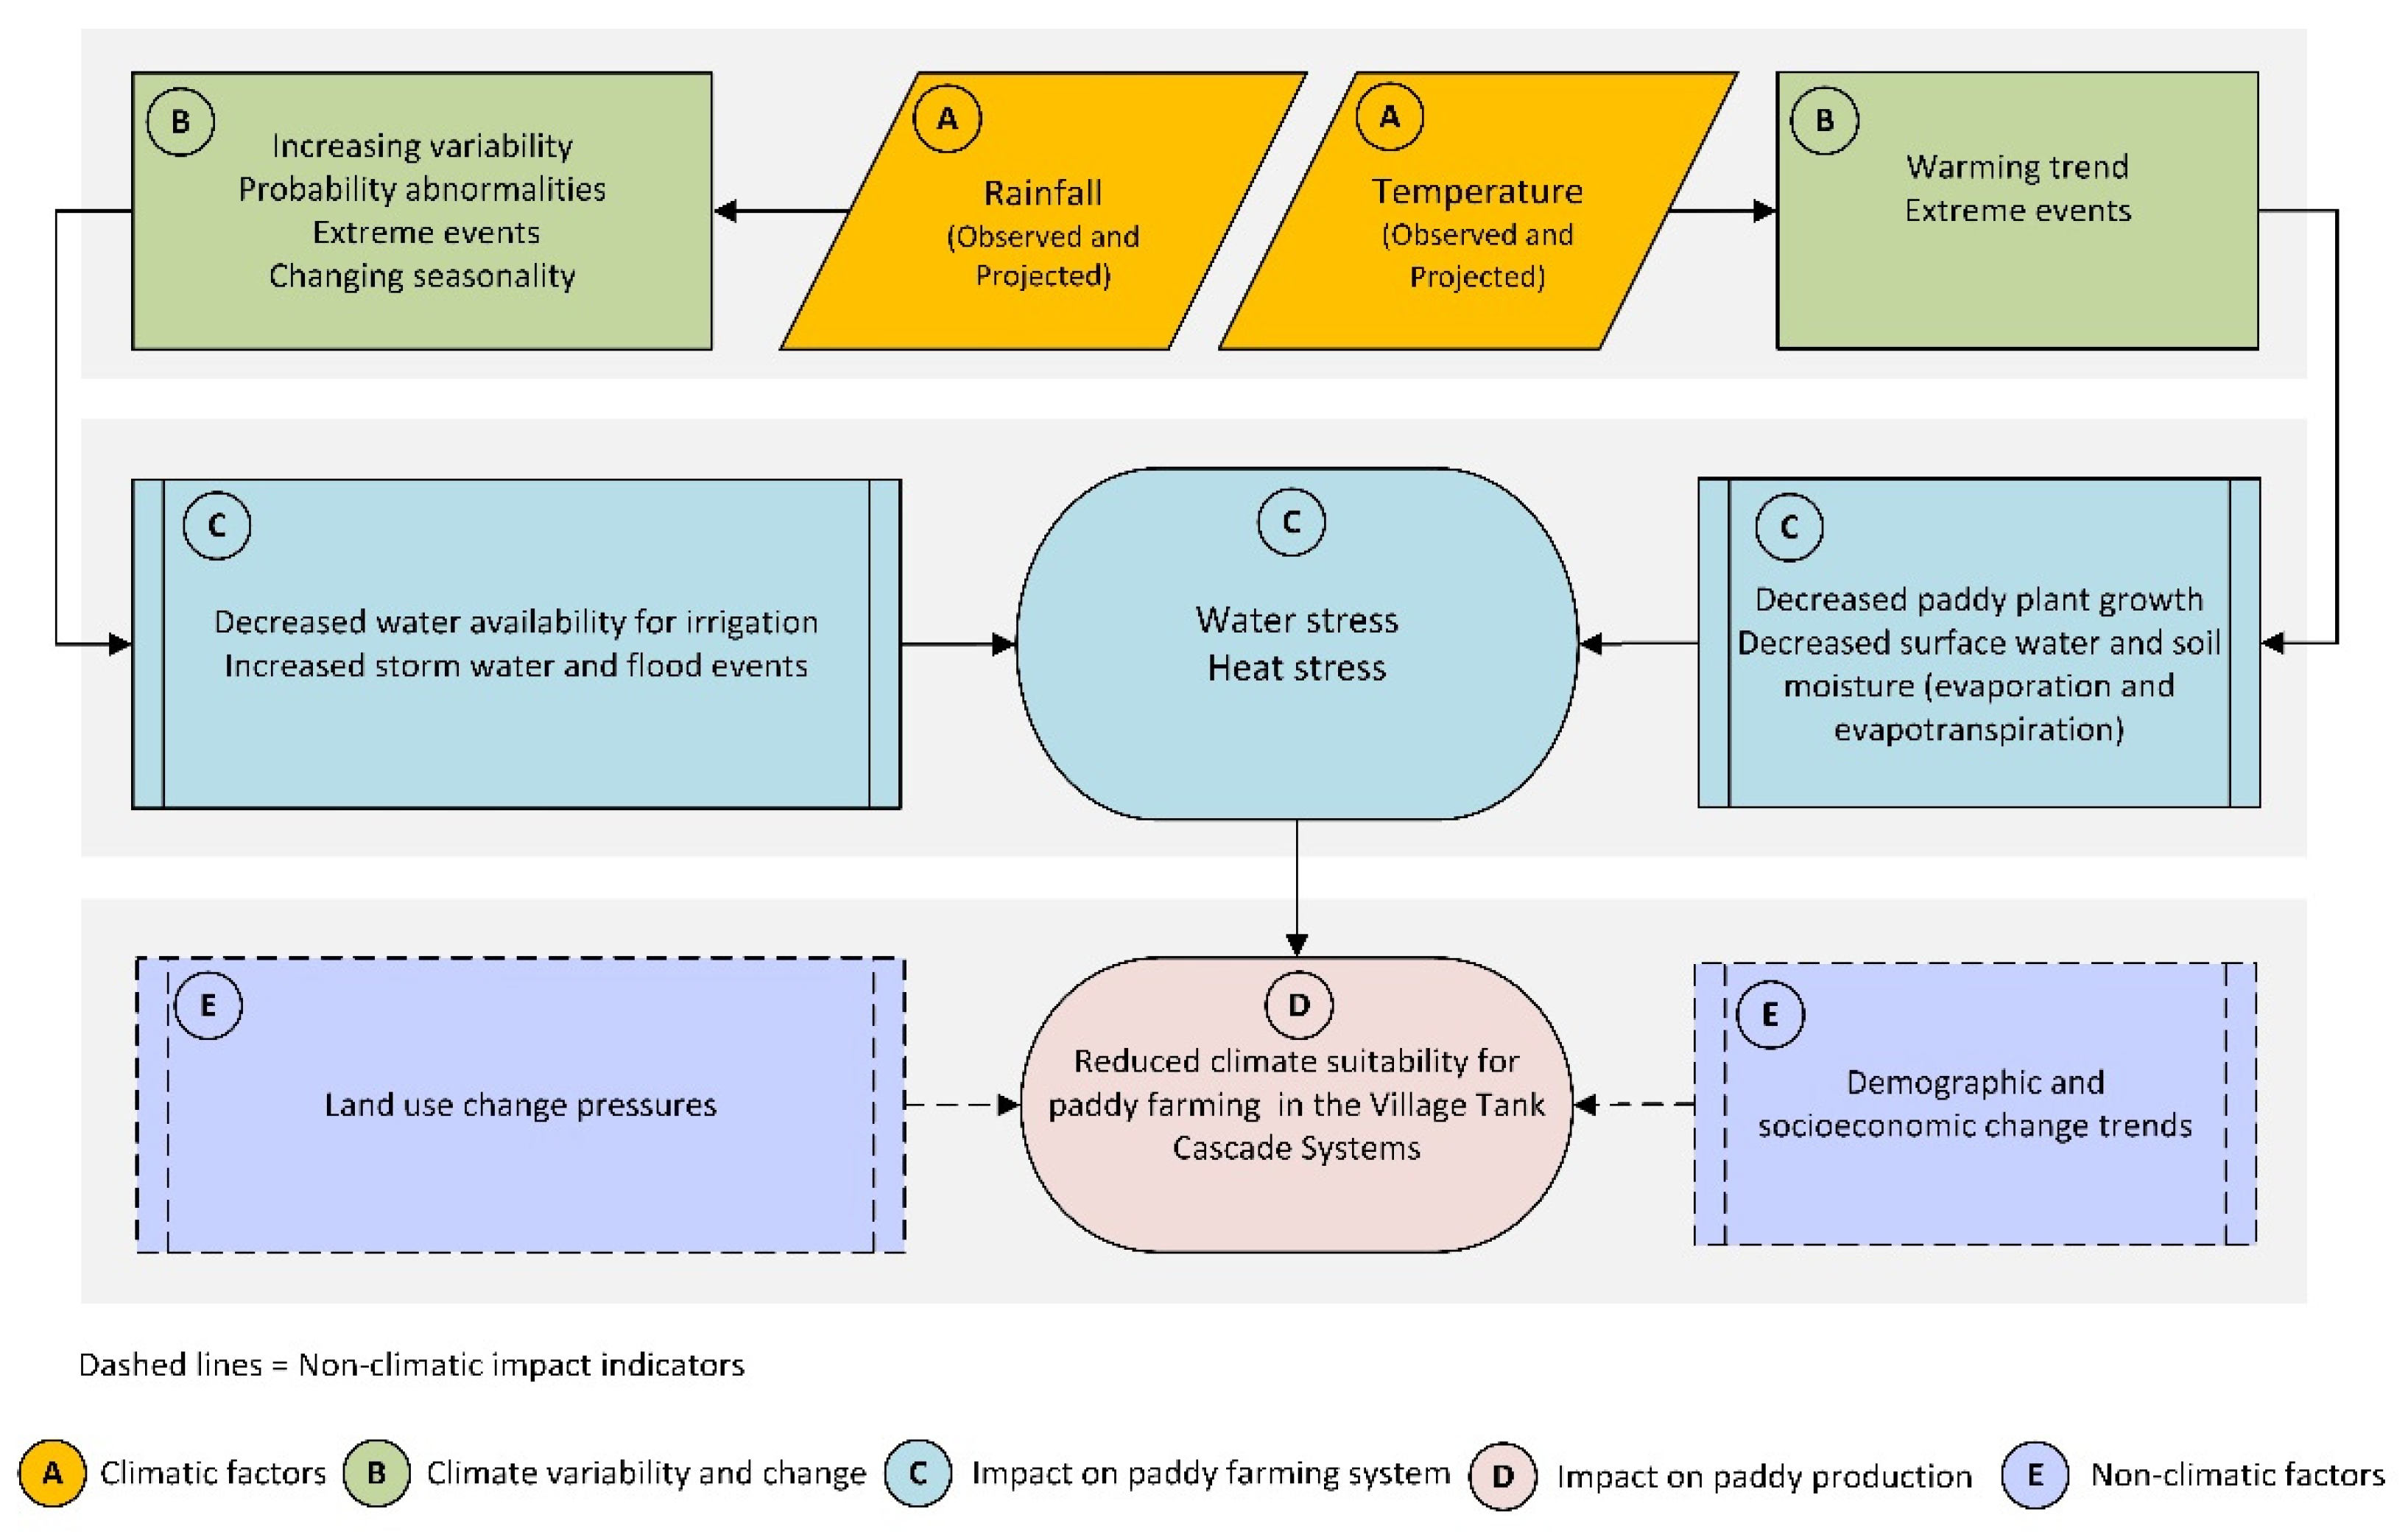
Figure 1. Potential indicator framework of climate variability and change analysis and their impacts on paddy farming productivity in Village Tank Cascade Systems.
Sustainability 15 09271 g001
Figure 2. Distribution of VTCSs in Sri Lanka (a) and North and North-central VTCS zone (b).
Sustainability 15 09271 g002
Figure 3. Process of extracting and downscaling paddy cultivation location data. Yala = Minor paddy cultivation season of the dry zone; Maha = Major paddy cultivation season of the dry zone.
Sustainability 15 09271 g003
Figure 4. Paddy cultivation location data related to two cultivation seasons overlaid on the paddy land classification map of Sri Lanka.
Sustainability 15 09271 g004
Figure 5. The process followed in MaxEnt modelling and area suitability analysis.
Sustainability 15 09271 g005
Figure 6. Temperature trend and variability from 1970 to 2020 in North and North-central VTCS zone: (a) monthly; (b) climatic seasons; and (c) cultivation seasons. Lines = linear regression; shading area = 95% confidence intervals; circles = temperature and rainfall values; p = p-value of slope coefficient; b = slope coefficient; and R2 = coefficient of determination. FIM = First Inter-monsoon; SWM = south-west monsoon; SIM = second inter-monsoon; NEM = north-east monsoon; Yala = minor cultivation season; and Maha = major cultivation season.
Sustainability 15 09271 g006
Figure 7. Rainfall trend and variability from 1970 to 2020 in North and North-central VTCS zone: (a) monthly; (b) climatic seasons; and (c) cultivation seasons. Lines = linear regression; shading area = 95% confidence intervals; circles = temperature and rainfall values; p = p-value of slope coefficient; b = slope coefficient; and R2 = coefficient of determination. FIM = first inter-monsoon; SWM = south-west monsoon; SIM = second inter-monsoon; NEM = north-east monsoon; Yala = minor cultivation season; and Maha = major cultivation season.
Sustainability 15 09271 g007
Figure 8. Shift in the probability distribution of seasonal and annual mean temperature during 1946–1970 (Non-Global Warming Period) and 1971—2020 (Global Warming Period) in the North and North-central VTCS zone: (a) first inter-monsoon (FIM) season; (b) second inter-monsoon (SIM) season; (c) south-west monsoon (SWM) season; (d) annual temperature; and (e) north-east monsoon (NEM) season. Dashed lines indicated the mean value of the temperature.
Sustainability 15 09271 g008
Figure 9. Anomalies in the probability distribution of seasonal and annual rainfall during 1946–1970 (Non-Global Warming Period) and 1971–2020 (Global Warming Period) in the North and North-central VTCS zone: (a) first inter-monsoon (FIM); (b) second inter-monsoon (SIM); (c) south-west monsoon (SWM); (d) annual rainfall; and (e) north-east monsoon (NEM). Dashed lines indicated the mean value of the rainfall.
Sustainability 15 09271 g009
Figure 10. Projected trends and variability (a) mean annual temperature and (b) mean annual rainfall in the North and North-central VTCS zone (averaged MIROC5 and MPI-ESM-LR models), under the two climate scenarios (RCP4.5 and RCP8.5). The range of projected variability is given by the shaded area.
Sustainability 15 09271 g010
Figure 11. Potential occurrence localities for minor irrigated and rainfed paddy (Oryza sataiva L.) for Yala and Maha cultivation seasons in Sri Lanka, modelled using the MaxEnt model under the current climate and future climate scenarios.
Sustainability 15 09271 g011
Figure 12. Potential area suitability for minor irrigated and rainfed paddy (Oryza sataiva L.) in Yala and Maha cultivation seasons in Sri Lanka, under the current climate and future climate scenarios.
Sustainability 15 09271 g012
Figure 13. Predicted area suitability changes for minor irrigated and rainfed paddy cultivation in Yala (a,c) and Maha (b,d) cultivation seasons for all of Sri Lanka (a,b) and within the North and North-central VTCS zone (c,d), compared to the current extent. The percentage denotes the portion of the suitability area change, increase (+), decrease (−) and no change (0).
Sustainability 15 09271 g013
Figure 14. Spatiotemporal dynamics of climate suitability for minor irrigated and rainfed paddy cultivation across the North and North-central VTCS zone in Maha cultivation season under the future climate scenarios.
Sustainability 15 09271 g014
Figure 15. Spatial shifts of suitability areas for paddy cultivation between current and future suitability classes in the Maha cultivation season of the North and North-central VTCS zone. The percentages in parentheses denote the portion of the suitability area change, increase (+) and decrease (−) of a particular class in future climate scenarios compared to the current climate suitability.
Sustainability 15 09271 g015
Table 1. Environmental variables used in MaxEnt modelling.
CategorySourceVariableSymbolClimatic
Season
Cultivation SeasonUnit
Agro-
climatological
WorldClim-Global Climate Data
http://www.worldclim.org/
(accessed on 1 September 2021)
Rainfall/Temperature (March)rf03/tm03FIMYalamm/°C
Rainfall/Temperature (April)rf04/tm04FIMmm/°C
Rainfall/Temperature (May)rf05/tm05SWMmm/°C
Rainfall/Temperature (June)rf06/tm06SWMmm/°C
Rainfall/Temperature (July)rf07/tm07SWMmm/°C
Rainfall/Temperature (August)rf08/tm08SWMmm/°C
Rainfall/Temperature (September)rf09/tm09SWMMahamm/°C
Rainfall/Temperature (October)rf10/tm10SIMmm/°C
Rainfall/Temperature (November)rf11/tm11SIMmm/°C
Rainfall/Temperature (December)rf12/tm12NEMmm/°C
Rainfall/Temperature (January)rf01/tm01NEMmm/°C
Rainfall/Temperature (February)rf02/tm02NEMmm/°C
AgroecologicalNRMC, Sri LankaSlope (Inclination angle)slope--Degrees
Soilsoil--N/A
Elevationdem--m
SWM = south-west monsoon season; NEM = north-east monsoon season; FIM = first inter-monsoon season; SIM = second inter-monsoon season; Yala = minor cultivation season of the dry zone; Maha = major cultivation season of the dry zone; NRMC = Natural Resources Management Centre.
Table 2. The summary results of Mann–Kendall and Sen’s slope test analysis.
Time Series Climate DataKendall’s Taup-ValueSen’s Slope
Mean annual temperature—RCP4.50.73077100.000.02 °C/year
Mean annual temperature—RCP8.50.83703240.000.03 °C/year
Mean annual rainfall—RCP4.50.25601790.002.06 mm/year
Mean annual rainfall—RCP8.50.34353470.002.90 mm/year
Table 3. Results of accuracy assessment of the paddy (Oryza sativa L.) model.
Accuracy MeasureValue
AUC0.763
TSS0.441
Sensitivity0.832
Specificity0.609
Table 4. Area suitability for minor irrigated and rainfed paddy cultivation in Yala and Maha cultivation seasons in Sri Lanka and the North and North-central VTCS zone under the current climate and future climate scenarios.
SuitabilityArea of
Interest
Area (km2) under
Current Climate
2050
(Medium-Term)
2070
(Long-Term)
Area (km2) under RCP4.5Area (km2) under RCP8.5Area (km2) under RCP4.5Area (km2) under RCP8.5
YalaMahaYala
(%)
Maha
(%)
Yala
(%)
Maha
(%)
Yala
(%)
Maha
(%)
Yala
(%)
Maha
(%)
HighSri Lanka369611,3203682
(−0.38%)
11,033
(−2.54%)
3965
(+7.28%)
9665
(−14.62%)
4062
(+9.90%)
9718
(−14.15%)
4122
(+11.53%)
9502
(−16.06%)
Study area01390
(0.00%)
16
(−88.49%)
0
(0.00%)
25
(−82.01%)
0
(0.00%)
67
(−51.80%)
0
(0.00%)
60
(−56.83%)
ModerateSri Lanka704620,9576385
(−9.38%)
20,855
(−0.49%)
6031
(−14.41%)
17,992
(−14.15%)
6646
(−5.68%)
18,403
(−12.19%)
6160
(−12.57%)
17,201
(−17.92%)
Study area043330
(0.00%)
4865
(+12.28%)
0
(0.00%)
3532
(−18.49%)
0
(0.00%)
3055
(−29.49%)
0
(0.00%)
3220
(−25.69%)
LowSri Lanka14,69122,77214,096
(−4.05%)
23,225
(+1.99%)
13,532
(−7.89%)
25,448
(+11.75%)
14,010
(−4.64%)
26,664
(+17.09%)
14,316
(−2.55%)
25,643
(+12.61%)
Study area166558161537
(−7.69%)
5412
(−6.95%)
824
(−50.51%)
6735
(15.80%)
511
(−69.31%)
7105
(+22.73%)
807
(−51.53%)
6889
(+19.31%)
Very lowSri Lanka39,061933440,226
(+2.98%)
9388
(+0.58%)
41,038
(+5.06%)
11,463
(+22.81%)
39,788
(+1.86%)
9721
(+4.15%)
39,966
(+2.32%)
12,215
(+30.87%)
Study area8649268773
(+1.43%)
23
(−11.54%)
9491
(+9.74%)
24
(−7.69%)
9804
(+13.35%)
88
(+92.31%)
9509
(+9.94%)
147
(+273.08%)
Note: The percentages in parentheses denote the portion of the suitability area change, increase (+), decrease (−) and no change (0), compared to the current climate suitability.
Table 5. Spatiotemporal dynamics between climate suitability classes across the North and North-central VTCS zone in Maha cultivation season under the future climate scenarios.
SuitabilityChange Category2050
(Medium-Term)
2070
(Long-Term)
Area (km2) under
RCP4.5
Area (km2) under
RCP8.5
Area (km2) under
RCP4.5
Area (km2) under
RCP8.5
Very lowContraction12 (46.15%)12 (46.15%)9 (34.62%)12 (46.15%)
Expansion9 (34.62%)10 (38.46%)72 (276.92%)133 (511.54%)
Constant14 (53.85%)14 (53.85%)16 (61.54%)14(53.85%)
LowContraction1399 (24.05%)632 (10.87%)343 (5.90%)373 (6.41%)
Expansion994 (17.09%) 1550 (26.65%) 1632 (28.06%)1446 (24.86%)
Constant4418 (75.96%)5185 (89.15%)5473 (94.10%)5443 (93.59%)
ModerateContraction965 (22.27%)1506 (34.76%)1658 (38.26%)1476 (34.06%)
Expansion1518 (34.55%)705 (16.27%)380 (8.77%)363 (8.38%)
Constant3368 (77.73%)2827 (65.24%)2675 (61.74%)2857 (65.94%)
HighContraction133 (95.68%)125 (89.93%)123 (88.49%)118 (84.89%)
Expansion10 (7.19%)12 (8.63%)51 (36.69%)39 (28.06%)
Constant6 (4.32%)13 (9.35%)16 (11.51%)21 (15.11%)
Note: The percentages in parentheses denote the portion of the change in relation to the extent of current suitability.
Disclaimer/Publisher’s Note: The statements, opinions and data contained in all publications are solely those of the individual author(s) and contributor(s) and not of MDPI and/or the editor(s). MDPI and/or the editor(s) disclaim responsibility for any injury to people or property resulting from any ideas, methods, instructions or products referred to in the content.