

Role of Urban Planning Standards in Improving Lifestyle in a Sustainable System


Abstract
1. Introduction
- Developing standards for public services, educational and care-upbringing;
- Access to public green areas, leisure and sports;
- Percentage share of greenery in the residential investment area;
- Determination of optimal relations between the intensity of development (also related to population density) and the share of built-up and green areas.
2. Background
2.1. Urban Standards in Residential Areas
- When preparing spatial development plans for residential areas, the following should be taken into account: nurseries for 0.3% of the number of residents, kindergartens for 3% of residents, primary schools for not less than 6% and junior high schools for not less than 3% of the population.
- At the same time, it is stipulated that the rate of demand for places in kindergartens will increase to 4%, if the care of upbringing and education of children aged 3–6 years old is given importance. It is worth noting that the currently recommended indicators of demand for care and educational services significantly differ from the values in the previous standard (Table 2, line 5) [28,29,30,31].
2.2. Urban Standards in Landscaped Green Areas, Sports and Recreation
- A total of 30 m2/1 apartment for a community garden;
- A total of 5 m2/1 apartment for a playground for children from 0 to 5 years, with an area of 60–100 m2;
- For the number of apartments greater than 50–5 m2/1 apartment for a playground for children from 5 to 10 years, a minimum area of 250 m2;
- For more than 75 apartments, an open recreational space with an area of 2 hectares/1000 inhabitants, including 5 m2/1 apartment with an available sports area for adults.
- -
- Directly or indirectly take into account (referring to the number of apartments) the number of inhabitants and the required area of green, sports and recreational areas which depend on it;
- -
- Give the minimum size of areas (e.g., housing estate parks, children’s gardens) while striving to concentrate green areas and prevent their dispersion;
- -
- Introduce hierarchy in the system of green areas associated with appropriate isochrones of pedestrian access;
- -
- Adopt a similar summary requirements area—about 30 m2/one inhabitant.
3. Materials and Methods
- In residential areas, planning is required for generally accessible greenery, recreational and sports areas with an area of no less than 2 hectares (ha). Areas with a basic program (greenery, playgrounds and sports fields for team games) should be within reach, with a pedestrian distance maximum of 500 m. Areas with a secondary program (sports and recreational complexes with a sports hall, indoor swimming pool, a complex of sports fields and a park) should be available within a radius of up to 1000 m.
- The area of generally accessible green areas (with playgrounds and sports games) should be estimated according to the minimum indicator of 8 m2/inhabitant, and the area of common sports areas with a minimum of 4 m2/inhabitant.
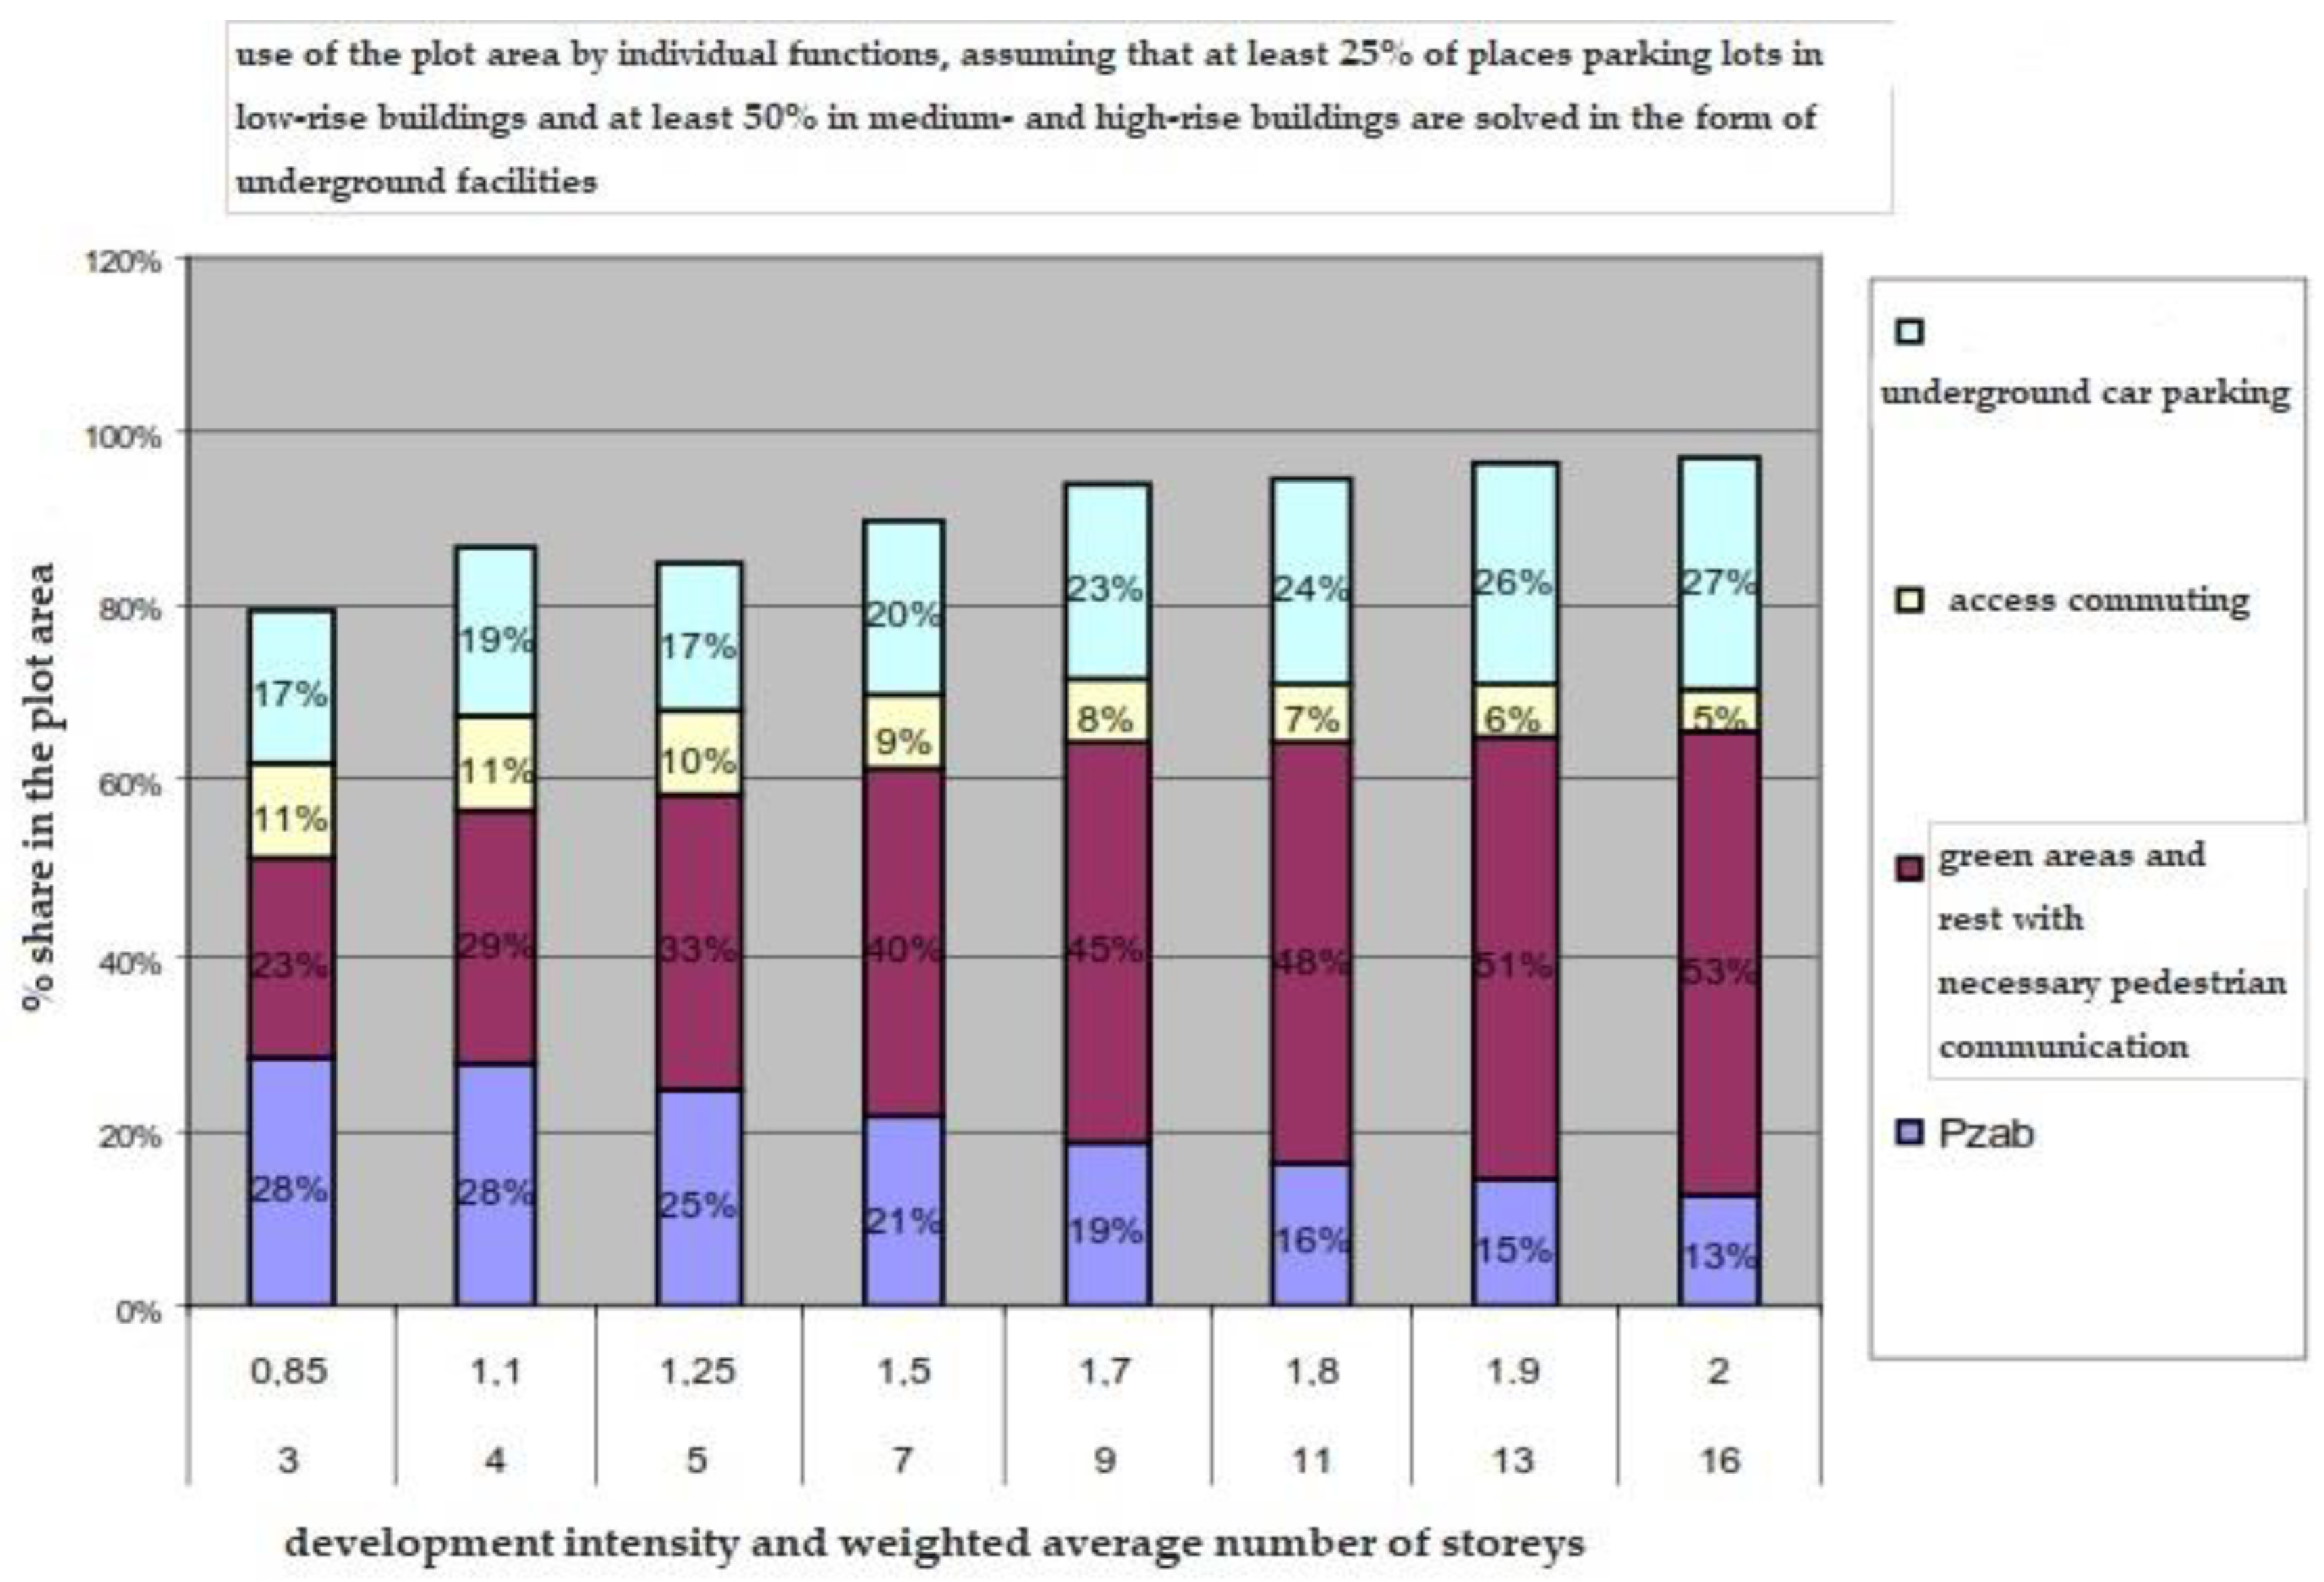
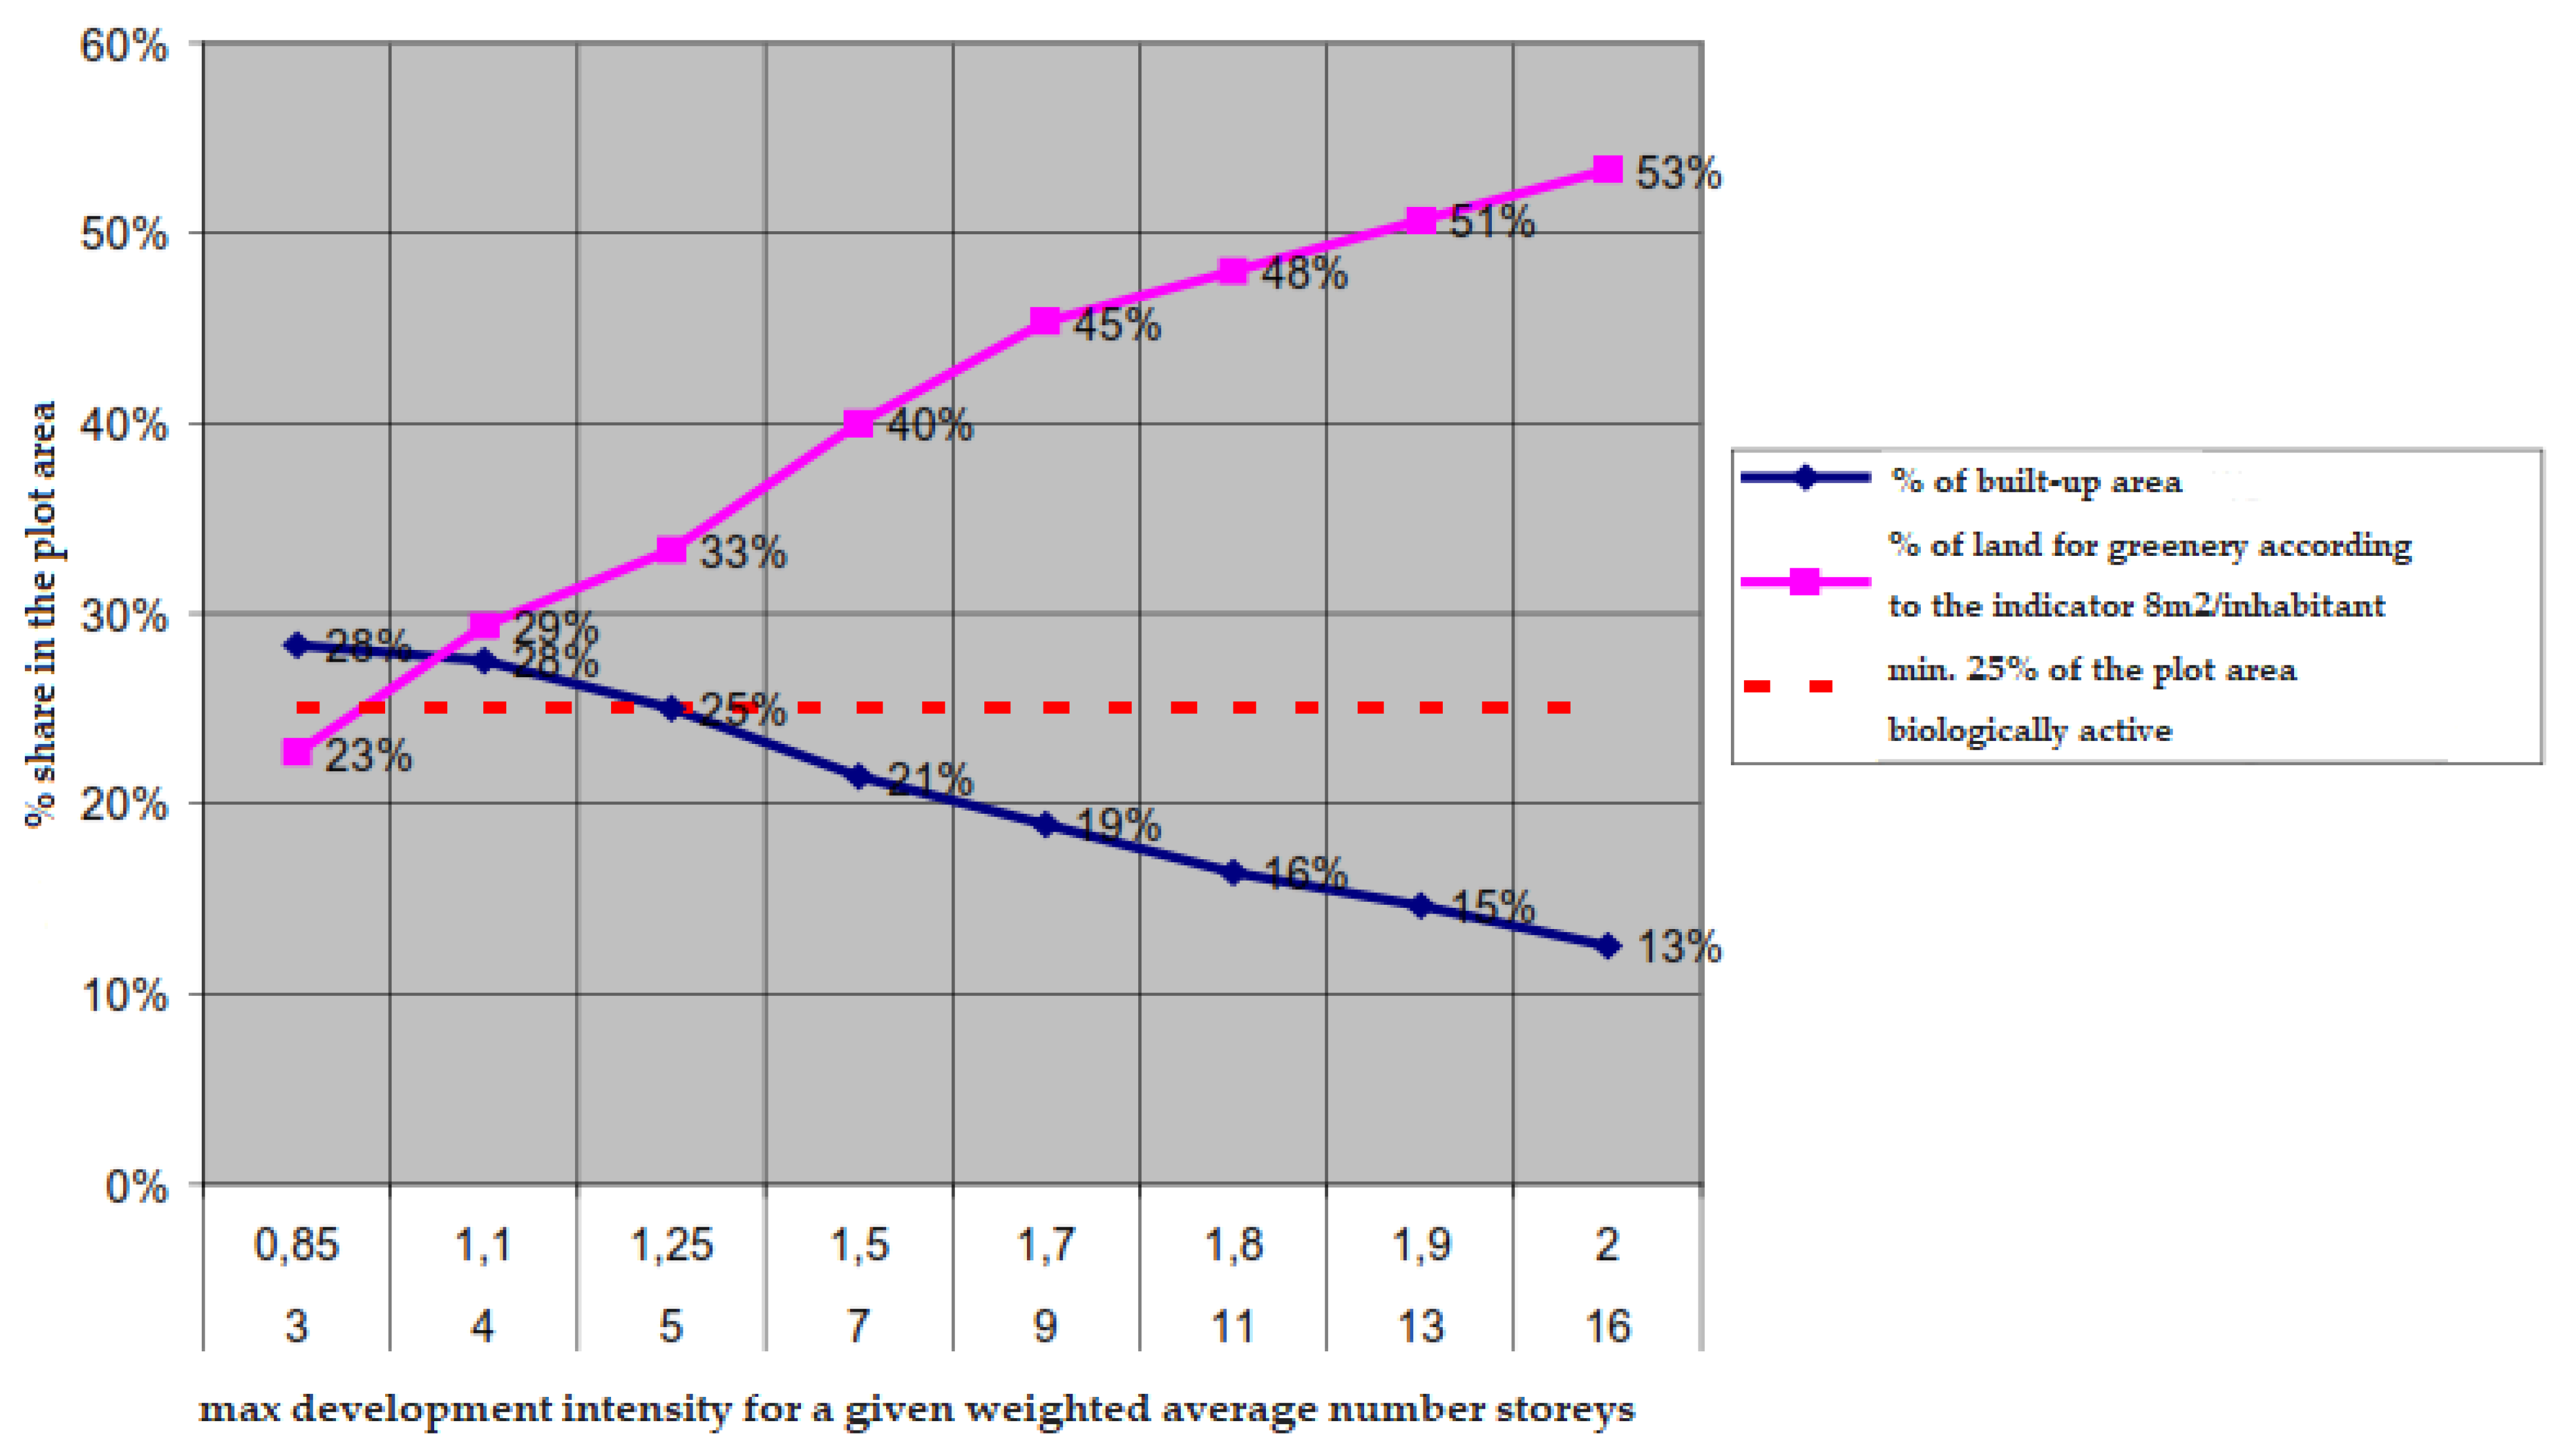
- The area of estate greenery (including playgrounds) cannot be smaller than the biologically active area required in the planning arrangements. It should be no less than 25% of the plot area.
- The area of estate greenery should be estimated according to the indicator of 8 m2 per 1 inhabitant, which can be reduced by 50% in the downtown area.
3.1. Infrastructure Planning and Education Building: Urban Indicators and Standards
3.2. Building Intensity Multi-Family Housing: Land Use Indicators
- -
- The structure of residential areas, defined at the stage of drawing up local plans and zoning;
- -
- The development of a building plot (area investments).
4. Results and Discussion
5. Conclusions
Funding
Institutional Review Board Statement
Informed Consent Statement
Conflicts of Interest
References
- Al-Hathloul, S.A.; Anis-ur-Rahmaan, S. The evolution of urban and regional planning in Saudi Arabia. Ekistics 1985, 52, 206–212. [Google Scholar]
- Al-Soliman, T.M. Environmental impacts and the need for a national environmental policy in Saudi Arabia. J. Archit. Plan. Res. 1993, 10, 219–241. [Google Scholar]
- Shiber, S.G. Report on city growth in the Eastern Province, Saudi Arabia. In SG Shiber, Recent Arab City Growth; Kuwait Government Print: Kuwait City, Kuwait, 1967; p. 430. [Google Scholar]
- Glasze, G.; Alkhayyal, A. Gated housing estates in the Arab world: Case studies in Lebanon and Riyadh, Saudi Arabia. Environ. Plan. B Plan. Des. 2002, 29, 321–336. [Google Scholar] [CrossRef]
- Ur Rahmaan, A. Optimizing the Performance of Environmental Planners and Designers in Saudi Society. In The Imperatives of Urban and Regional Planning: Concepts and Case Studies from the Developing World; Xlibris: Bloomington, IN, USA, 2011; pp. 419–442. [Google Scholar]
- Alzain, E.; Alshebami, A.S.; Aldhyani, T.H.H.; Alsubari, S.N. Application of Artificial Intelligence for Predicting Real Estate Prices: The Case of Saudi Arabia. Electronics 2022, 11, 3448. [Google Scholar] [CrossRef]
- Mandeli, K.N. The realities of integrating physical planning and local management into urban development: A case study of Jeddah, Saudi Arabia. Habitat Int. 2008, 32, 512–533. [Google Scholar] [CrossRef]
- Torkildsen, G. Leisure and Recreation Management; Psychology Press: East Sussex, UK, 2005. [Google Scholar]
- Saleh, M.A.E. The transformation of residential neighborhood: The emergence of new urbanism in Saudi Arabian culture. Build. Environ. 2002, 37, 515–529. [Google Scholar] [CrossRef]
- Sessoms, H.D. New eascs for recreation planning. J. Am. Inst. Plan. 1964, 30, 26–33. [Google Scholar] [CrossRef]
- Distasio, J.; Dudley, M.; Moradzadeh, F. Churchill Sustainability Planning Framework (CSPF); Institute of Urban Studies: Arlington, TX, USA, 2011. [Google Scholar]
- Jones, P.; Hillier, D. Urban leisure complexes in the UK: Planning and management issues. Manag. Res. News 2002, 25, 75–83. [Google Scholar] [CrossRef]
- Al-But’hie, I.M.; Saleh, M.A.E. Urban and industrial development planning as an approach for Saudi Arabia: The case study of Jubail and Yanbu. Habitat Int. 2002, 26, 1–20. [Google Scholar] [CrossRef]
- Mubarak, F.A. Urban growth boundary policy and residential suburbanization: Riyadh, Saudi Arabia. Habitat Int. 2004, 28, 567–591. [Google Scholar] [CrossRef]
- Alkadi, A.H. Affordable Housing Standards for Low-Income Communities in Saudi Arabia; King Faisal University: Al-Hofuf, Saudi Arabia, 2005; Volume 15. [Google Scholar]
- Addas, A.; Maghrabi, A. A proposed planning concept for public open space provision in Saudi Arabia: A study of three Saudi cities. Int. J. Environ. Res. Public Health 2020, 17, 5970. [Google Scholar] [CrossRef] [PubMed]
- Alotibi, A. Determining the Designer's Awareness of Sustainable Interior Materials in Saudi Arabia; Arizona State University: Tempe, AZ, USA, 2019. [Google Scholar]
- Al-Yami, A.; Sanni-Anibire, M.O. BIM in the Saudi Arabian construction industry: State of the art, benefit and barriers. Int. J. Build. Pathol. Adapt. 2021, 39, 33–47. [Google Scholar] [CrossRef]
- Banani, R.; Vahdati, M.M.; Shahrestani, M.; Clements-Croome, D. The development of building assessment criteria framework for sustainable non-residential buildings in Saudi Arabia. Sustain. Cities Soc. 2016, 26, 289–305. [Google Scholar] [CrossRef]
- Al-Homoud, M.S.; Khan, M.M. Assessing safety measures in residential buildings in Saudi Arabia. Build. Res. Inf. 2004, 32, 300–305. [Google Scholar] [CrossRef]
- Almalki, M.; FitzGerald, G.; Clark, M. Health care system in Saudi Arabia: An overview. EMHJ-East. Mediterr. Health J. 2011, 17, 784–793. [Google Scholar] [CrossRef]
- Aina, Y.A.; Wafer, A.; Ahmed, F.; Alshuwaikhat, H.M. Top-down sustainable urban development? Urban governance transformation in Saudi Arabia. Cities 2019, 90, 272–281. [Google Scholar] [CrossRef]
- Alshuwaikhat, H.M.; Mohammed, I. Sustainability matters in national development visions—Evidence from Saudi Arabia's Vision for 2030. Sustainability 2017, 9, 408. [Google Scholar] [CrossRef]
- Helmi, M.; Hegazy, I.; Qurnfulah, E.; Maddah, R.; Ibrahim, H.S. Using sustainable development indicators in developing Saudi cities—Case study: Makkah city. Int. J. Low-Carbon Technol. 2021, 16, 1328–1340. [Google Scholar] [CrossRef]
- Alqahtany, A.; Aravindakshan, S. Urbanization in Saudi Arabia and sustainability challenges of cities and heritage sites: Heuristical insights. J. Cult. Herit. Manag. Sustain. Dev. 2022, 12, 408–425. [Google Scholar] [CrossRef]
- Anisurrahman, M.; Alshuwaikhat, H.M. Determining sustainability assessment indicators for the Holy City of Makkah, Saudi Arabia. Arab. J. Sci. Eng. 2019, 44, 5165–5178. [Google Scholar] [CrossRef]
- Garau, C.; Pavan, V.M. Evaluating urban quality: Indicators and assessment tools for smart sustainable cities. Sustainability 2018, 10, 575. [Google Scholar] [CrossRef]
- Rothenberg, R.; Stauber, C.; Weaver, S.; Dai, D.; Prasad, A.; Kano, M. Urban health indicators and indices—Current status. BMC Public Health 2015, 15, 494. [Google Scholar] [CrossRef] [PubMed]
- Badland, H.; Whitzman, C.; Lowe, M.; Davern, M.; Aye, L.; Butterworth, I.; Hes, D.; Giles-Corti, B. Urban liveability: Emerging lessons from Australia for exploring the potential for indicators to measure the social determinants of health. Soc. Sci. Med. 2014, 111, 64–73. [Google Scholar] [CrossRef] [PubMed]
- Webster, P.; Sanderson, D. Healthy cities indicators—A suitable instrument to measure health? J. Urban Health 2013, 90, 52–61. [Google Scholar] [CrossRef]
- Binsaedan, L.; Alshuwaikhat, H.M.; Aina, Y.A. Developing an Urban Computing Framework for Smart and Sustainable Neighborhoods: A Case Study of Alkhaledia in Jizan City, Saudi Arabia. Sustainability 2023, 15, 4057. [Google Scholar] [CrossRef]
- Gurran, N.; Whitehead, C. Planning and affordable housing in Australia and the UK: A comparative perspective. Hous. Stud. 2011, 26, 1193–1214. [Google Scholar] [CrossRef]
- Wolff, M.; Wiechmann, T. Urban growth and decline: Europe's shrinking cities in a comparative perspective 1990–2010. Eur. Urban Reg. Stud. 2018, 25, 122–139. [Google Scholar] [CrossRef]
- Al Rashidi, B.; Al Wahaibi, A.H.; Mahomed, O.; Al Afifi, Z.; Al Awaidy, S. Assessment of key performance indicators of the primary health care in oman: A cross-sectional observational study. J. Prim. Care Community Health 2020, 11, 2150132720946953. [Google Scholar] [CrossRef]


| Population in City (Thousands) | Number and Percentage of the Population of Individual Age Groups in the Range of 0–15 Years | |||||||||
|---|---|---|---|---|---|---|---|---|---|---|
| 0–2 Years | 3–6 Years | 7–12 Years | 13–15 Years | 0–15 Years | ||||||
| Number | % | Number | % | Number | % | Number | % | % | ||
| 2009 | 23,200.4 | 6915 | 3 | 8253 | 3.6 | 12,235 | 5.3 | 7067 | 3.0 | 14.9 |
| 2010 | 23,145.5 | 7041 | 3 | 8501 | 3.7 | 12,001 | 5.2 | 6727 | 2.9 | 14.8 |
| 2015 | 22,897.7 | 7008 | 3.1 | 9438 | 4.1 | 12,519 | 5.5 | 5856 | 2.6 | 15.2 |
| 2020 | 22,649.7 | 6398 | 2.8 | 918 | 4.1 | 13,881 | 6.1 | 6274 | 2.8 | 15.8 |
| 2025 | 22,299.0 | 5568 | 2.5 | 8256 | 3.7 | 13,558 | 6.1 | 6932 | 3.1 | 15.4 |
| 2030 | 21,799.5 | 4941 | 2.3 | 7187 | 3.3 | 12,220 | 5.6 | 6696 | 3.1 | 14.2 |
| 2035 | 21,215.1 | 479 | 2.3 | 6524 | 3.1 | 10,658 | 5.0 | 5983 | 2.8 | 13.2 |
| Type of Educational and Upbringing Services | |||||
|---|---|---|---|---|---|
| Nursery | Kindergarten | Primary School | Junior High School | ||
| 1 | Age range | 0–2 years | 3–6 years | 7–12 years | 13–15 years |
| 2 | Age group share in the structure population | 3% | 4% | 6% | 3% |
| 3 | % of the age group of users from services | 10% | 75% | 100% | 100% |
| 4 | % of the number of inhabitants for whom places should be provided in facilities | 0.3% | 3% | 6% | 3% |
| 5 | Comparative data from urban planning [28,29,30,31] | 0.75–1.5% | 4.5% | 12% (7–14 years) | |
| The Size of the City, the Number of Residents | Protection of Green Areas in m2/Inhabitant | |||
|---|---|---|---|---|
| Built-in Housing | General Use | |||
| District Mean | Of Urban Significance | |||
| 1 | Over 1,000,000 | 9–10 | 8–10 | 9–11 |
| 2 | 250,000–1,000,000 | 10–11 | 7–9 | 8–10 |
| 3 | 100,000–250,000 | 11–15 | 6–8 | 8–10 |
| 4 | 20,000–100,000 | 15–20 | 3–5 | 6–8 |
| Type of Services | Nurseries | Preschool | Basic School | Gymnasiums | |
|---|---|---|---|---|---|
| Type of Indicator | |||||
| 1 | % of the number of residents using services | 0.3% | 3% | 6% | 3% |
| 2 | recommended absorbency of the facility | 60 children | 120 children | 500–700 students | 300–600 students |
| 3 | land area | 0.3 hectare | 0.4 hectare | 1.2–2 hectares | 1.2–2 hectares |
| 4 | number of inhabitants/1 facility | 20,000 | 4000–5000 | 10,000 | 10,000–20,000 |
| 5 | land area/1 inhabitant | 0.15 m2 | 0.9 m2 | 1.8 m2 | 1.0–1.5 m2 |
| 6 | recommended maximum pedestrian access radius | 1000 m | 500 m | 500 m800 m * | 500 m1000 m * |
| 7 | maximum radius of pedestrian access according to the given standards | 500 m | 500 m | 500 m | … |
| Town Planning Regulation | Multi-Family Housing Development | Single-Family Housing Development | |||
|---|---|---|---|---|---|
| High | Medium–High | Short | |||
| 1 | primary schools and middle schools | 6 areas on 2500 m2 total area of apartments | 4 areas on 2500 m2 total area of apartments | ||
| 2 | preschool | 2 areas on 2500 m2 total area of apartments | 1 area on 2500 m2 total area of apartments | ||
| Program | Minimal Surface | Min. Indicator Surface | Max. Access Radius | |
|---|---|---|---|---|
| Backyard areas, on the plot construction (net) | playgrounds for children under 7 and older (above 50 apartments) | 250 m2 250 m2 | 5 m2 | 50 m 100 m |
| Basic public areas ofleisure and sports | housing estate gardens | 2 hectares | 4.0 m2 | 500 m |
| sports fields for team games | 1.5 m2 | |||
| Secondary recreational areas and sports | parks | 2 hectares | 4.0 m2 | 1000 m |
| indoor swimming pools sports halls | 2.5 m2 |
| Town Planning Regulation | All Types of Multi-Family Housing, Regardless of the Size of the City | |
|---|---|---|
| 1 | Neighborhood greenery | 20% of estate greenery concerning the plot area |
| 2 | Size and number of squares games for children | 25% of the estate green area (as above) is intended for playgrounds for children, 25% for teenagers (aged 12–18), equipped playgrounds in the number of 1 square per 2500 m2 of the total area of apartments, and for each another 2500 m2 |
| Year | Net Development Intensity | Weighted Average Number of Stories |
|---|---|---|
| 1970 | 1.1 | 6.2 |
| 1975 | 1.15 | 7.4 |
| 1980 | 0.95 | 5.5 |
| 1990 | 1.07 | 4.9 |
| 1992 | 1.16 | 4.3 |
| 1994 | 1.19 | 4.0 |
| Mean Weighted Number Stories | Factor Intensity Buildings | According to the Standard 20 m2 per Capita | |||
|---|---|---|---|---|---|
| Number Inhabitants (ha) | % of Terrain Intended to Be Green According to the Indicator 8 m2/Inhabitant | Number Inhabitants (ha) | % of Terrain Intended to Green According to the Indicator 8 m2/Inhabitant | ||
| 3.1–4 | 0.85 | 425 | 34% | 283 | 23% |
| 4.1–5 | 0.95 | 475 | 38% | 317 | 25% |
| 5.1–7 | 1.15 | 575 | 46% | 383 | 31% |
| 7.1–9 | 1.3 | 650 | 52% | 433 | 35% |
| 9.1–11 | 1.4 | 700 | 56% | 467 | 37% |
| 11.1–13 | 1.5 | 750 | 60% | 500 | 40% |
| 13.1–16 | 1.65 | 825 | 66% | 550 | 44% |
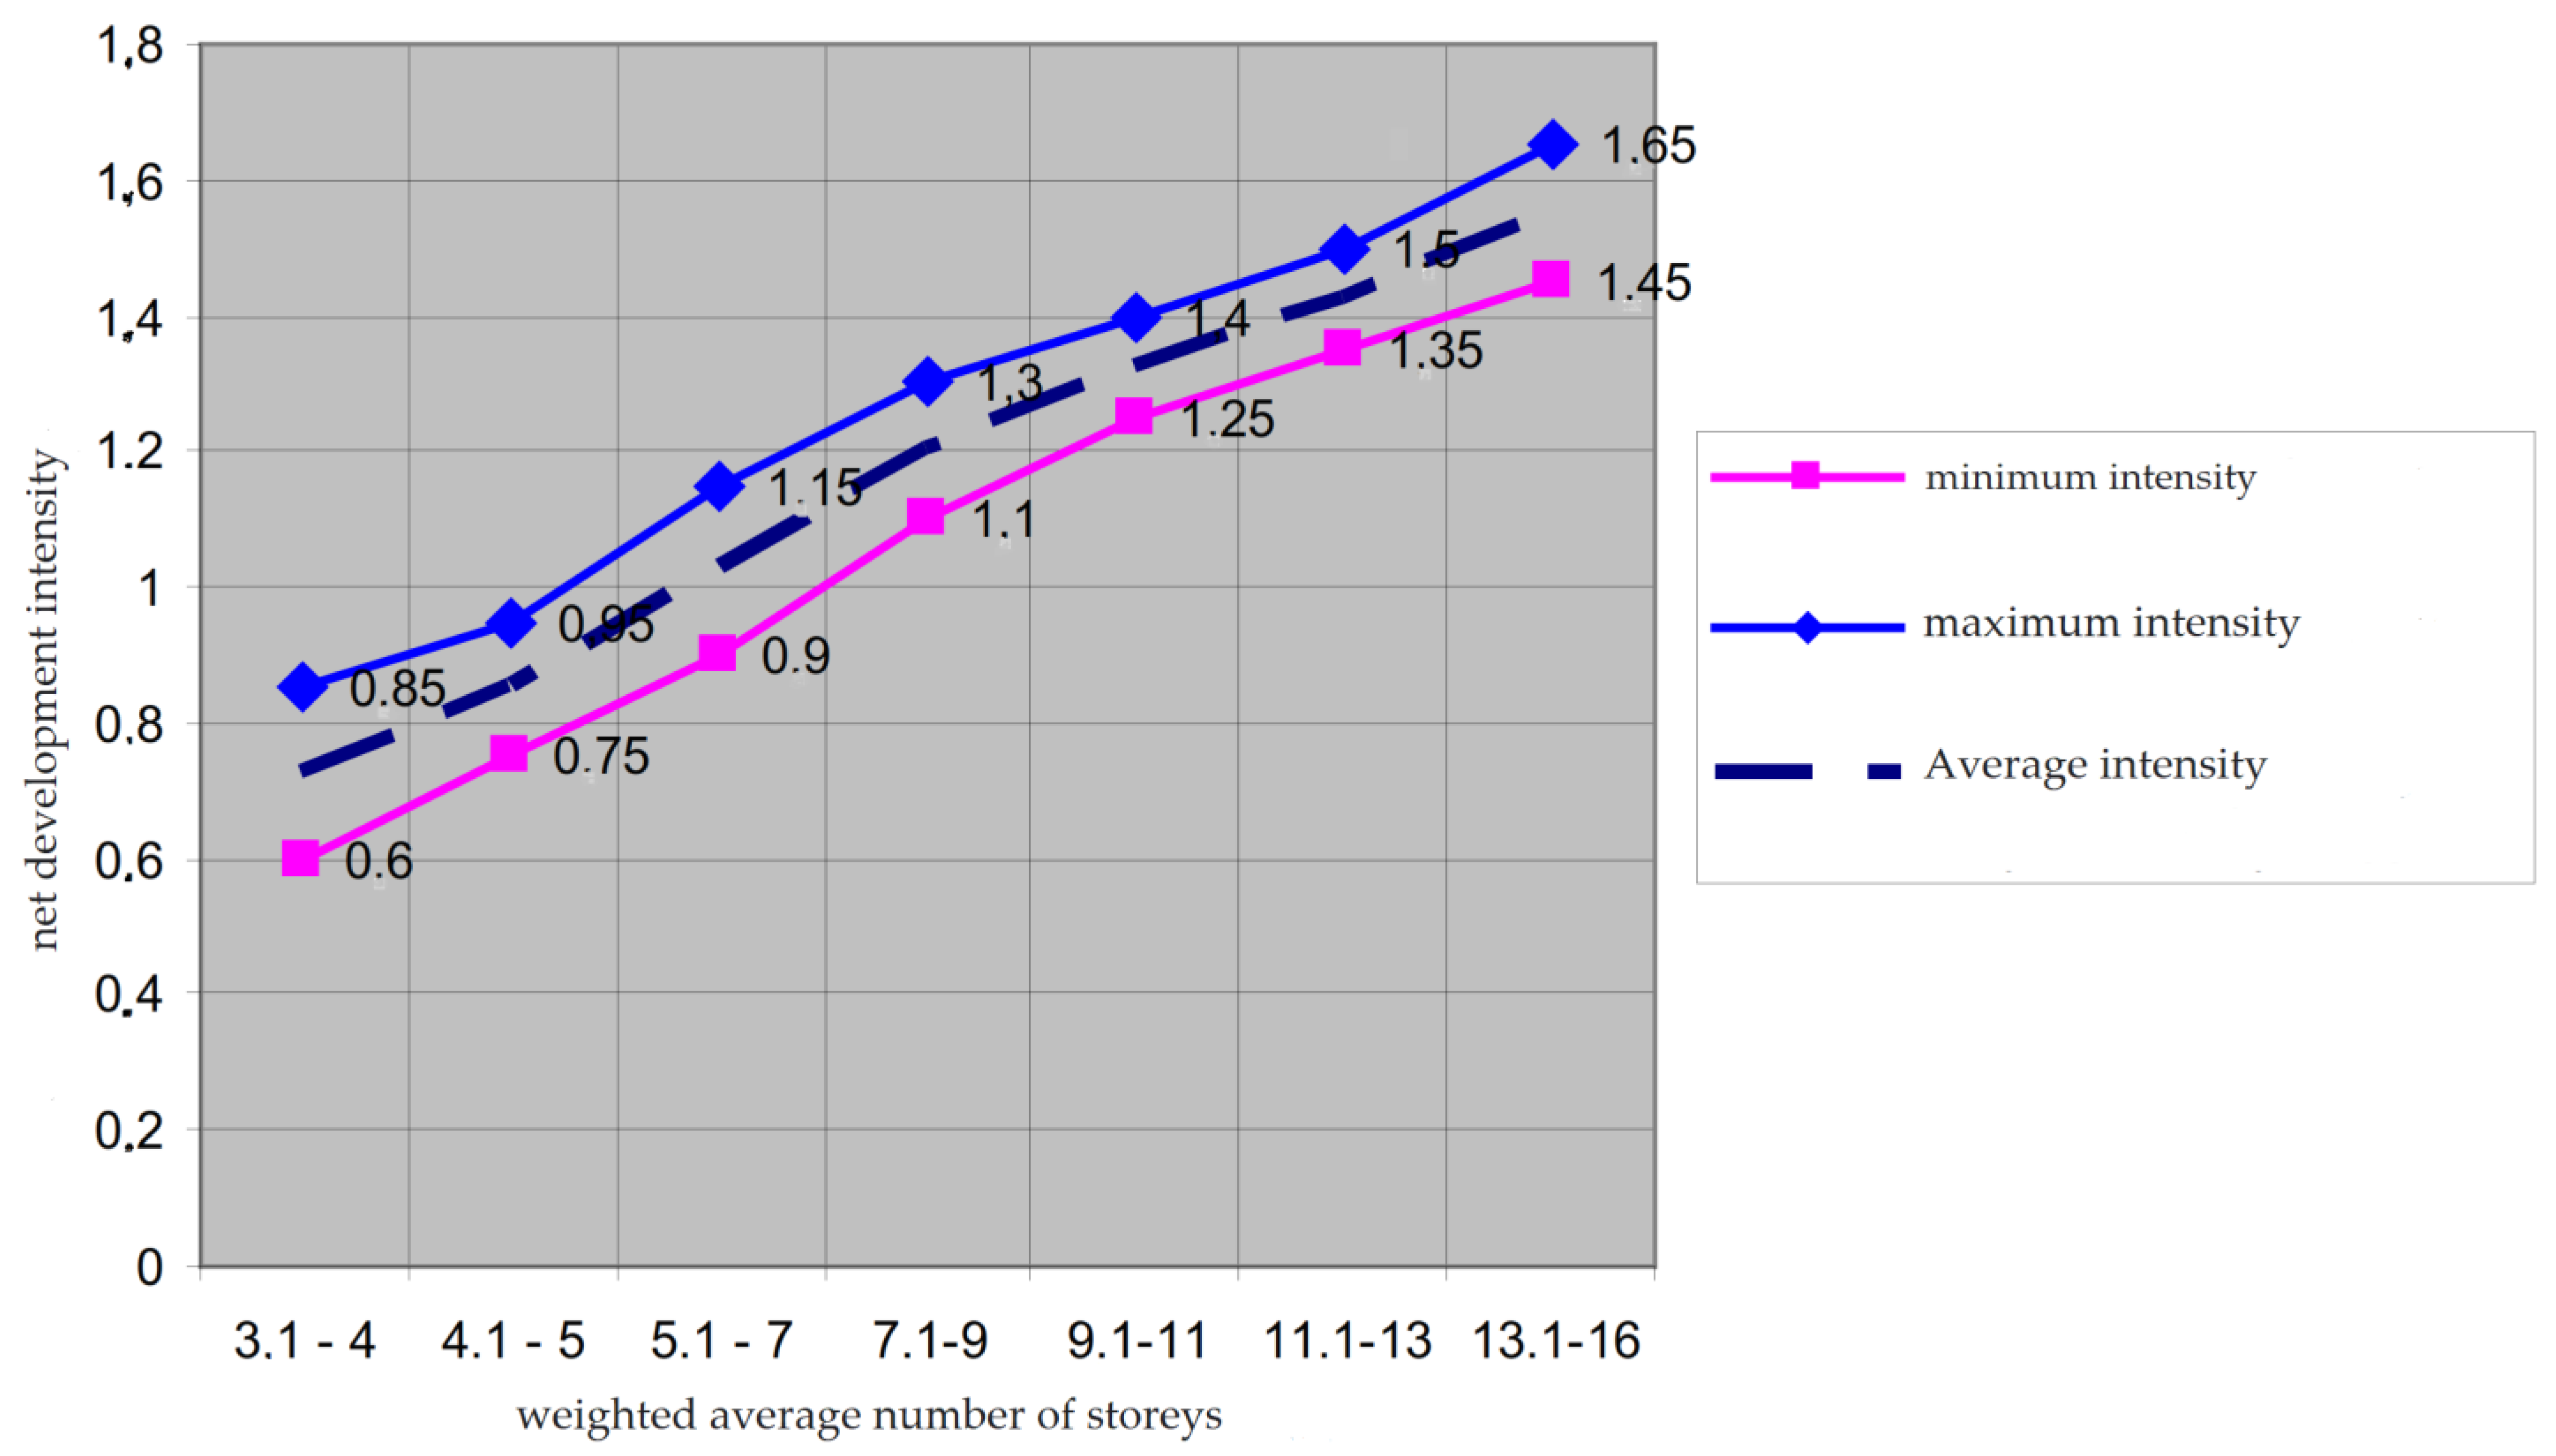
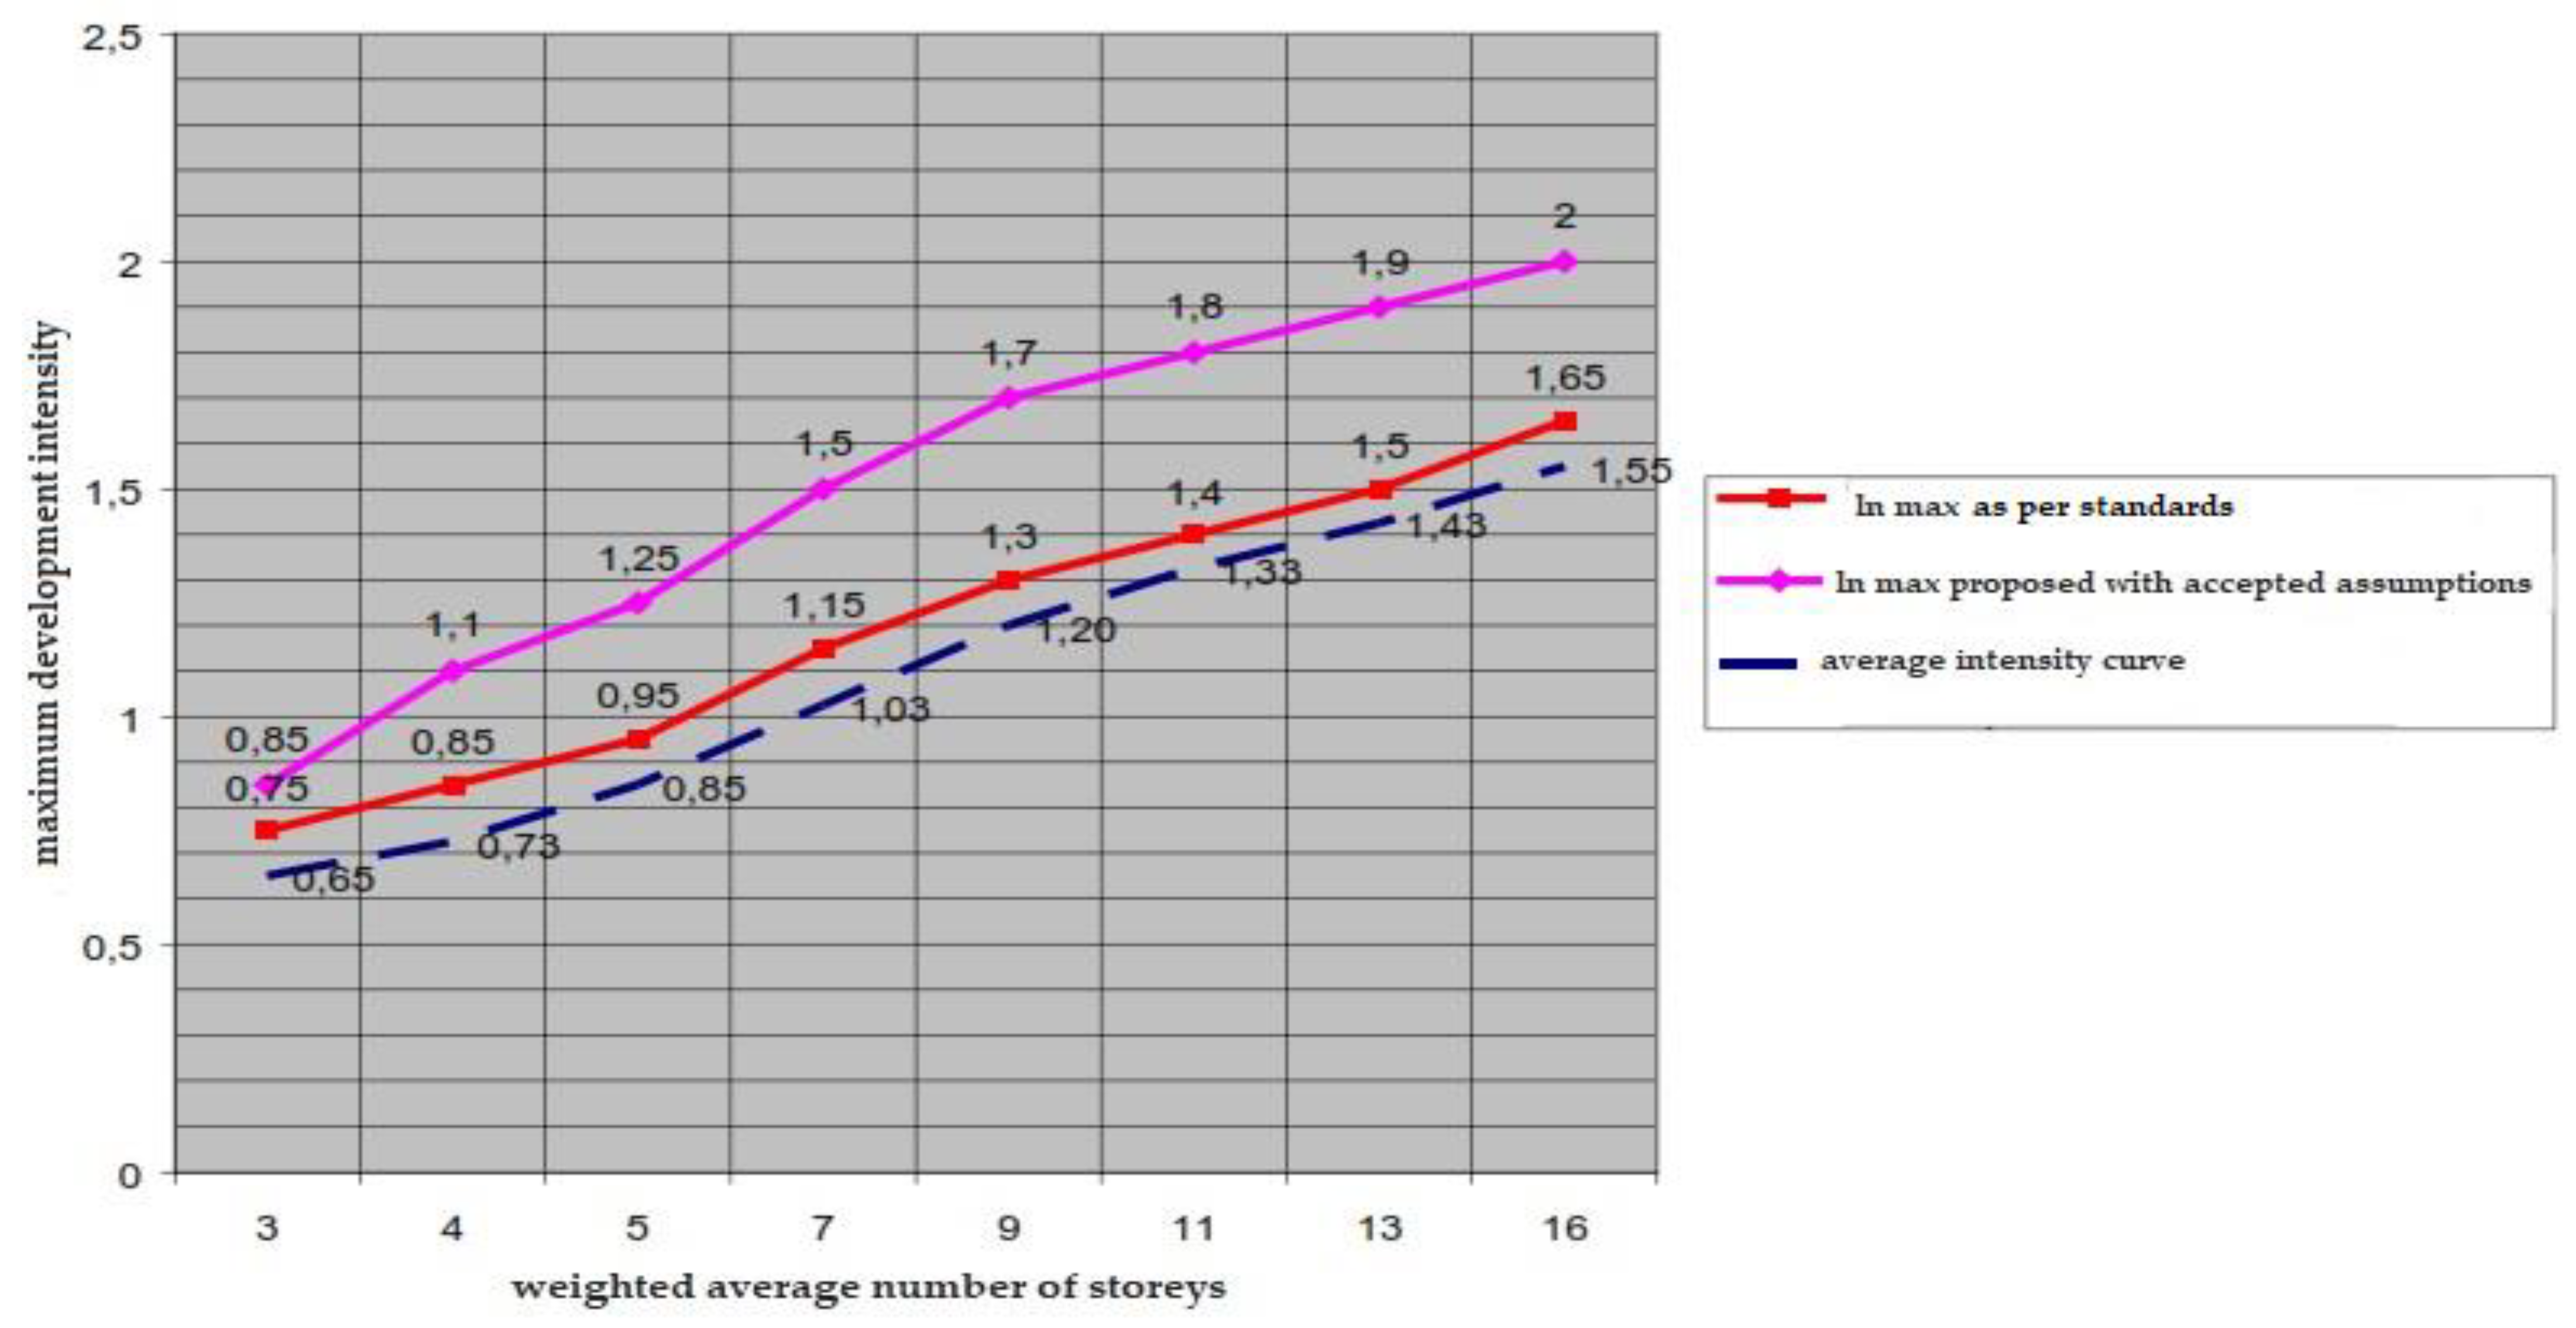
| The Weighted Average Number of Stories | Net Development Intensity | |
|---|---|---|
| According to the Standards | Proposed | |
| 3.1–4 | 0.6–0.85 | 0.75–1.10 |
| 4.1–5 | 0.75–0.95 | 0.95–1.25 |
| 5.1–7 | 0.9–1.15 | 1.15–1.50 |
| 7.1–9 | 1.1–1.30 | 1.45–1.70 |
| 9.1–11 | 1.25–1.45 | 1.45–1.80 |
| 11.1–13 | 1.35–1.50 | 1.50–1.95 |
| 13.1–16 | 1.45–1.65 | 1.65–2.0 |
Disclaimer/Publisher’s Note: The statements, opinions and data contained in all publications are solely those of the individual author(s) and contributor(s) and not of MDPI and/or the editor(s). MDPI and/or the editor(s) disclaim responsibility for any injury to people or property resulting from any ideas, methods, instructions or products referred to in the content. |
© 2023 by the author. Licensee MDPI, Basel, Switzerland. This article is an open access article distributed under the terms and conditions of the Creative Commons Attribution (CC BY) license (https://creativecommons.org/licenses/by/4.0/).
Share and Cite
Addas, A. Role of Urban Planning Standards in Improving Lifestyle in a Sustainable System. Sustainability 2023, 15, 9171. https://doi.org/10.3390/su15129171
Addas A. Role of Urban Planning Standards in Improving Lifestyle in a Sustainable System. Sustainability. 2023; 15(12):9171. https://doi.org/10.3390/su15129171
Chicago/Turabian StyleAddas, Abdullah. 2023. "Role of Urban Planning Standards in Improving Lifestyle in a Sustainable System" Sustainability 15, no. 12: 9171. https://doi.org/10.3390/su15129171
APA StyleAddas, A. (2023). Role of Urban Planning Standards in Improving Lifestyle in a Sustainable System. Sustainability, 15(12), 9171. https://doi.org/10.3390/su15129171