Article

Assessment of Variability in Hydrological Droughts Using the Improved Innovative Trend Analysis Method

by
Muhammad Shehzad Ashraf
1,2,
Muhammad Shahid
3,
Muhammad Waseem
1,
Muhammad Azam
4 and
Khalil Ur Rahman
5,*
1
Centre of Excellence in Water Resources Engineering, University of Engineering & Technology, GT-Road, Lahore 54890, Pakistan
2
Department of Civil Engineering, University of Central Punjab, Lahore 54590, Pakistan
3
Department of Civil Engineering, University of Engineering & Technology, Lahore 54890, Pakistan
4
Faculty of Agricultural Engineering and Technology, PMAS Arid Agriculture University, Rawalpindi 46000, Pakistan
5
State Key Laboratory of Hydroscience and Engineering, Department of Hydraulic Engineering, Tsinghua University, Beijing 100084, China
*
Author to whom correspondence should be addressed.
Sustainability 2023, 15(11), 9065; https://doi.org/10.3390/su15119065
Submission received: 15 April 2023 / Revised: 30 May 2023 / Accepted: 30 May 2023 / Published: 3 June 2023
(This article belongs to the Special Issue Hydro-Meteorology and Its Application in Hydrological Modeling)

Abstract

:
The use of hydro-climatological time series to identify patterns is essential for comprehending climate change and extreme events such as drought. Hence, in this study, hydrological drought variability based on the standard drought index (SDI) using DrinC was investigated at ten (10) hydrological stations in the Upper Indus River Basin (UIRB) of Pakistan on a monthly timescale for a period of 1961–2018. Moreover, the applicability of the improved innovative trend analysis by Sen Slope method (referred hereafter as the IITA) method was evaluated in comparison with innovative trend analysis (ITA) and Mann–Kendall (MK). The findings demonstrated a significant decreasing trend in the hydrological drought from October to March; on the other hand, from April through September, a significant increasing trend was observed. In addition to that, the consistency of the outcomes across the three trend analysis methods was also observed in most of the cases, with some discrepancies in trend direction, such as at Kharmong station. Conclusively, consistency of results in all three trend analysis methods showed that the IITA method is reliable and effective due to its capability to investigate the trends in low, median, and high values of hydrometeorological timeseries with graphical representation. A degree-day or energy-based model can be used to extend the temporal range and link the effects of hydrological droughts to temperature, precipitation, and snow cover on a sub-basin scale.

1. Introduction

Extreme climatic and hydrologic events have increased in frequency due to global warming, having a profound impact on biological systems, human activities, and the economic conditions of the country [1]. Recently, people have become increasingly conscious of both the local and global effects of climate change on rivers. Surface flow can endanger sustainability, water availability, mean daily flows, and annual flooding patterns, which are all well-known [2].
Compared to other weather and climatic extremes, droughts are much more complex and poorly understood phenomena that spread slowly yet have incredibly damaging impacts [3]. The intensity and frequency of drought events are now extensively acknowledged to be on the rise globally in many locations due to rising temperatures and climate change [4]. Due to a much smaller number of hydrological variables than usual, mostly hydrological droughts have been observed [5]. The hydrological cycle is considerably disrupted by drought, and the region’s streams are flowing at levels below average [6]. Agriculture, community, ecology, economy, and politics are all negatively impacted by drought [7]. There has been numerous research conducted worldwide to look into the patterns of drought in Canada [8], South Korea [9], North America [10], and Pakistan [11,12,13,14,15,16]. The complex interactions between hydrological drought timescales and meteorological droughts were examined by [17]. To gauge the severity of the drought, the Standardized Drought Index (SDI), a hydrological streamflow index, was combined with the Standardized Precipitation Evapotranspiration Index (SPEI). Overall, it was shown that natural basins bordering the United States revealed that SDI responded well to SPEI during shorter time periods. Similarly, [18] employed standardized runoff, precipitation, and water level metrics to monitor the Vistula basin drought in Poland. Using satellite pictures, Ref. [19] did another study to identify the dangers of drought for agriculture in Ukraine. In comparison to the rest of the world, eastern Asian countries, including China, have experienced more severe droughts [20]. Gridded air temperature and precipitation datasets based on observation are being used to study the spatiotemporal variations in meteorological drought in South Asia (SA) from 1981 to 2020. Run theory and the Standardized Precipitation Evapotranspiration Index (SPEI) on annual and seasonal timescales were used to calculate the drought characteristics, such as duration, area, frequency, intensity, and severity. Sen’s slope estimator and the modified Mann–Kendall (MMK) test were used to estimate trends. It was discovered that SA’s winter season has a considerable long-term drying trend, particularly in the southwest and northeast [21]. Another study looked at how the socioeconomic effects of rising drought risks under 1.5 °C and 2 °C climate warming will vary in SA and its subregions and found that under a 1.5 °C warming scenario, the frequency of 50-year historical droughts may double throughout 80% of the SA land area. In contrast, under 2 °C of warming, 12% of SA’s landmasses could experience significant droughts [22].
In many studies, both parametric and non-parametric tests were employed to examine the variability in hydro-meteorological variables at the annual, monthly, and seasonal scales [23,24]. Parametric trend identification approaches are thought to be more powerful for studying variations in hydro-meteorological timeseries data; however, these methods require the data’s normal distribution, which is uncommon [25]. Therefore, non-parametric trend detection tests do not have the restrictive measure of data normality, and they have been widely employed in various studies [26,27].
Earlier studies used generally used trend finding techniques, including Spearman’s rho (SR), Sen’s slope estimator (SSE), Mann–Kendall (MK), linear regression (LR) methods, and others, to examine changes in monotonic trends as well as in medium, high, and low values of hydro-meteorological timeseries. An innovative trend analysis (ITA) methodology was created and evaluated [28,29] for the purpose of assessing trends in hydrological, biological, and meteorological variables [30,31,32]. ITA is a method that is simple to use and intuitive, irrespective of the distribution conventions, such as serial independence of the data, length of timeseries data, and normal distribution, used to ascertain trends in subcategories of different time series [33]. ITA has been utilized to look at hidden trends in variables of hydro-meteorological timeseries in many parts of the world. When Ay and Kisi [34] conducted trend analysis using ITA for monthly precipitation in Turkey’s six different provinces, they found that Trabzon and Samsun had much higher trends than the other four regions, which they determined to be unimportant. The Macta watershed in Algeria showed an upward trend towards the southern parts and a falling trend towards the northern portions. Elouissi et al. [33] conducted trend analysis for 25 stations using the ITA method for monthly precipitation. In Shanxi Province, China, Wu and Qian [35] used the linear regression, MK, and ITA methods to evaluate the variations in annual and seasonal rainfall at 14 stations. They arrived at the conclusion that their findings showed excellent consistency between tests and perfect concordance among tests that demonstrated meaningful patterns. Using the modified MK and ITA tests, Tosunoglu and Kisi [36] evaluated drought characteristics for nine sites. The findings demonstrated that whereas the ITA demonstrated a significantly declining trend at a 10% significance level, the modified MK test produced trendless results for the analyzed stations. Şen [27] created a calculation method to calculate the significance of test statistics and monotonic trends and further upgraded the ITA approach, making it easier to obtain trend behavior for all subcategories of timeseries [37,38]. Traditional and innovative trend analysis (ITA) methodologies have been used to analyze spatial-temporal monotonic and non-monotonic trends in Assam, India, for yearly precipitation data. Percentile (quartile) intervals have been used for the first time to present the ITA method’s results by making an objective evaluation in sub-trend categories [39]. For hydrometeorology time series recorded in Oxford, England, since 1870, the trends, stabilities, and rainfall data have all been carefully examined. The chosen time series’ piecewise trends and stabilities have been identified and examined using the innovative trend analysis (ITA) method, and compared to studies in the literature such as the Modified Mann–Kendall (MMK), the piecewise ITA approach in this study delivers more in-depth information [40].
The Upper Indus River Basin (UIRB) is home to numerous mountain ranges with mountainous terrain and steep elevations. Six significant rivers make up Pakistan’s Indus River Basin (IRB): the Sutlej, Chenab, Jhelum, Ravi, Kabul, and Indus. There is a lot of discussion among scientists on how the ice masses in the Upper Indus River Basin (UIRB) will behave in the face of environmental change and what obligations they will have to runoff. The results of examining ice sheets using remote detection methods and the Geographic Information System are inconsistent. Himalayan ice sheet concerns have been a significant subject of open concern and reasoned discussion [41]. The majority of Asian rivers have their origins in the Himalayan and Tibetan Plateau, counting the Brahmaputra and Ganges in India, the Irrawaddy in Burma, the Yangtze in China, and the Indus in Pakistan. For their social and economic well-being, millions of people in Pakistan depend on UIRB’s water delivery through the biggest irrigation system in the world, which is made up of a network of reservoirs and dams [42]. The UIRB is a climate change hotspot due to competing hydro-meteorological features that favor the vast and complicated Hindukush-Karakoram-Himalaya region, as well as contradicting climate change signals [43,44]. Additionally, the Indus Basin is severely impacted by the water sector because of the gradual rise in population, industry, and agricultural expansion, which causes an excessive amount of groundwater to be drawn out of the ground [45,46,47].
Extreme hydrologic and climatic events are expected to grow increasingly intense and frequent in Pakistan in the near future, posing substantial hazards to the country’s economic development. Pakistan is already suffering from severe droughts, floods, and other natural disasters [48,49]. Sen’s Slope Estimator (SSE) and Mann–Kendall (MK) tests were employed at 15 stations in the Upper Indus River Basin (UIRB) to investigate annual and seasonal variations in precipitation [50]. Annual precipitation demonstrated substantial negative trends at 6 of the 15 examined stations (Astore, Chilas, Dir, Drosh, Crupis, and Kakul) and significantly increasing precipitation at Bungi, Chitral, and Skardu, but other stations depicted insignificant trends. The study revealed that UIRB was governed by a negative precipitation trend, both temporally and geographically.
The innovative trend analysis (ITA), Mann–Kendall (MK), and Sen’s slope estimator (SSE) methods were applied to examine fluctuations in hydro-meteorological variables throughout a high-elevation watershed in Pakistan’s western Himalayas, and the results were found to be consistent across all methodologies [51]. Sen’s slope estimator (SSE) and Mann–Kendall (MK) tests were used to explore runoff shifts in the UIRB, and the results revealed upward trends in spring and winter precipitation and streamflow [52]. The prior experience of drought occurrences in Pakistan encourages us to identify new hydrological drought trends and patterns within the Upper Indus River Basin (UIRB). However, it is still unclear if such recent, unusual events are connected to spatiotemporal drought trends that could be identified in historical streamflow observations. Research on the distribution of drought events over time and space, the shortage of water, and their length is still lacking. In order to improve analytical accuracy in the UIB, Pakistan’s data-scarce regions, it is necessary to use more precise, unique ways of identifying innovative trends. Understanding the pattern of hydrological drought occurrences is made more difficult by the lack of historical Upper Indus Basin (UIB) hydrological information. Additionally, the streamflow gauging stations located in remote places are difficult to access and lack records for various seasons. Ref. [53] examined the patterns of drought occurrences in UIRB in terms of extreme precipitation, return period, and time distribution. The characteristics of drought are still not fully understood. Since UIRB is a significant supply of water for industry and agriculture in Pakistan, it is necessary to accurately estimate the trend pattern of the hydrological drought for this area; therefore, the improved innovative trend (IITA) was employed. The SDI indices were calculated using DrinC software version: 1.7 using mean monthly streamflow measurements. So, the goals of this study are to (1) identify the statistical characteristics of the variables associated with hydrological drought events and to identify temporal trends in UIRB; (2) by comparing the outcomes of the IITA method to those of ITA and MK, the method’s dependability is determined. Thus, it is crucial to control the inflows and outflows of barrages and dams situated downstream of UIRBs by being aware of drought trend patterns. The results of this study will aid in managing local water resources and prevent harm to the nation’s economy.

2. Materials and Methods

2.1. Study Area and Data Used

One of the world’s biggest transboundary rivers, the Indus River Basin (IRB) drains an area of 1.08 × 10⁶ km2, and it is shared by Afghanistan (6.7%), India (26.6%), China (10.7%), and Pakistan (56%) [54]. The Upper Indus River Basin (UIRB) watershed is located in the Hindukush-Karakoram-Himalayas and Tibetan Plateau between 32.48° and 37.07° N latitude and 67.33° to 81.83° E longitude [55]. One of the world’s most glaciated basins is the UIRB, with about 11,000 glaciers and a 22,000 km2 surface [44,56]. Being the primary source of water for a number of downstream uses, including agriculture, hydropower, industry, and domestic consumption, the UIRB is essential to Pakistan’s socioeconomic growth. The Hindukush-Karakoram-Himalayas, the third-largest mountain region on Earth, stretches over 2000 km and is exposed to climatic variables such as shifting source areas of flows and precipitation [57,58].
The longest continuous irrigation system in the world, which obtains water from the Indus River, provides 90% of the country’s food. However, the country could experience serious food shortages if water resources are insufficient [59]. Due to its desert or hyper-arid environment, the country’s south is susceptible to destructive floods during the monsoon season and occasional droughts during the dry season [60]. Therefore, it is crucial to look into changes in the availability of water resources while planning and managing future projects in order to meet the constantly growing requirements for fiber and food. Ten (10) stations with daily streamflow datasets from the Pakistan Water and Power Development Authority (WAPDA) were chosen for additional research based on the records’ completeness, homogeneity, and extent. The age span of the data collected at the selected locations is 35 to 58 years old (1961 to 2018). Figure 1 displays the locations of numerous stream gauging stations that are situated within the UIRB. The average annual precipitation over the UIRB varies from 450 to 1567 mm at low-altitude locations and from 193 to 1750 mm at high altitude regions.

2.2. Assessment of Hydrological Drought

In the current study, the streamflow drought index (SDI) was employed for hydrological drought evaluation. Because of its efficacy, application, and compatibility at diverse time scales for several case studies. The SDI calculation comprises fitting distributions to runoff data, estimating PDF and CDF, and converting it into a standardized distribution, which yields the SDI value. Moreover, a positive SDI number indicates a wet condition, whereas a negative value indicates a dry condition. Considering the hydrological year (October to September), SDI was calculated as
V i , k = j = 1 3 k Q i , j i = 1 , 2 , 3 , , n     j = 1 , 2 , , 12     a n d   k = 1 , 2 , 3 , 4  
S D I i , k = V i , k V ¯ i , k S k
where V i , k the cumulative runoff for reference period k and i is the hydrological year; S k is the standard deviation; and V ¯ k is the mean value of runoff.
Based on SDI value, hydrological drought is characterized as [13,16] described in Table 1.

2.3. Trend Analysis Methods

2.3.1. Mann–Kendall Test

The MK test [61,62] is a well-established test unaffected by outliers and free from the requirement of normally distributed data [63]. In order to investigate the fluctuations in hydro-meteorological timeseries data, it has been widely employed in many studies [64,65,66,67,68,69,70]. The value of the MK statistic S is
S = k = 1 n 1 j = k + 1 n sgn ( Y j Y k )
sgn ( Y j Y k ) = i f ( Y j Y k ) < 0 ; t h e n 1 i f ( Y j Y k ) = 0 ; t h e n 0 i f ( Y j Y k ) > 0 ; t h e n 1
where n denotes the number of values, the function sgn accepts the values of −1, 0 and 1; if Yj < Yk, Yj = Yk and Yj > Yk, respectively. Yk and Yj are the successive data values of timeseries throughout time k and j.
Positive values of S indicate an upward trend in the timeseries, whereas negative values indicate a downward trend. Assuming a sample size of n > 10, the test is conducted with a normal distribution (σ2 = 1), a mean of 0, [71] and probabilities (E) and variance (Var), as shown below.
E S = 0
V a r ( S ) = n ( n 1 ) ( 2 n + 5 ) p = 1 q t p ( t p 1 ) ( 2 t p + 5 ) 18
where q is the number of tied groups, which are observations with the same value but exclude the positions of unique rank numbers, and tp represents number of values in the pth group.
However, this summary sequence may be omitted if the data contain no paired groups. Equation (7) is used to calculate the standardized statistic ZMK value after modifying the variance Var(S) from Equation (4).
Z M K = S 1 V A R ( S ) , i f S > 0 0 , i f S = 0 S + 1 V A R ( S ) , i f S < 0
To calculate the degree of variation, consistent ZMK values are distributed normally, with a variance of 1 and a mean of 0. The test statistic ZMK is employed to examine the (H0) null hypothesis. Data series show significant trends if ZMK is greater than Zα/2. The computed ZMK value is compared to the normal distribution table using a two-tailed test with a 10% level of significance. If the computed value of ZMK falls between −Z1-α/2 and Z1-α/2 in a two-tailed test, the null hypothesis (H0) for no trend is accepted, and H1 is therefore rejected.

2.3.2. Innovative Trend Analysis Method

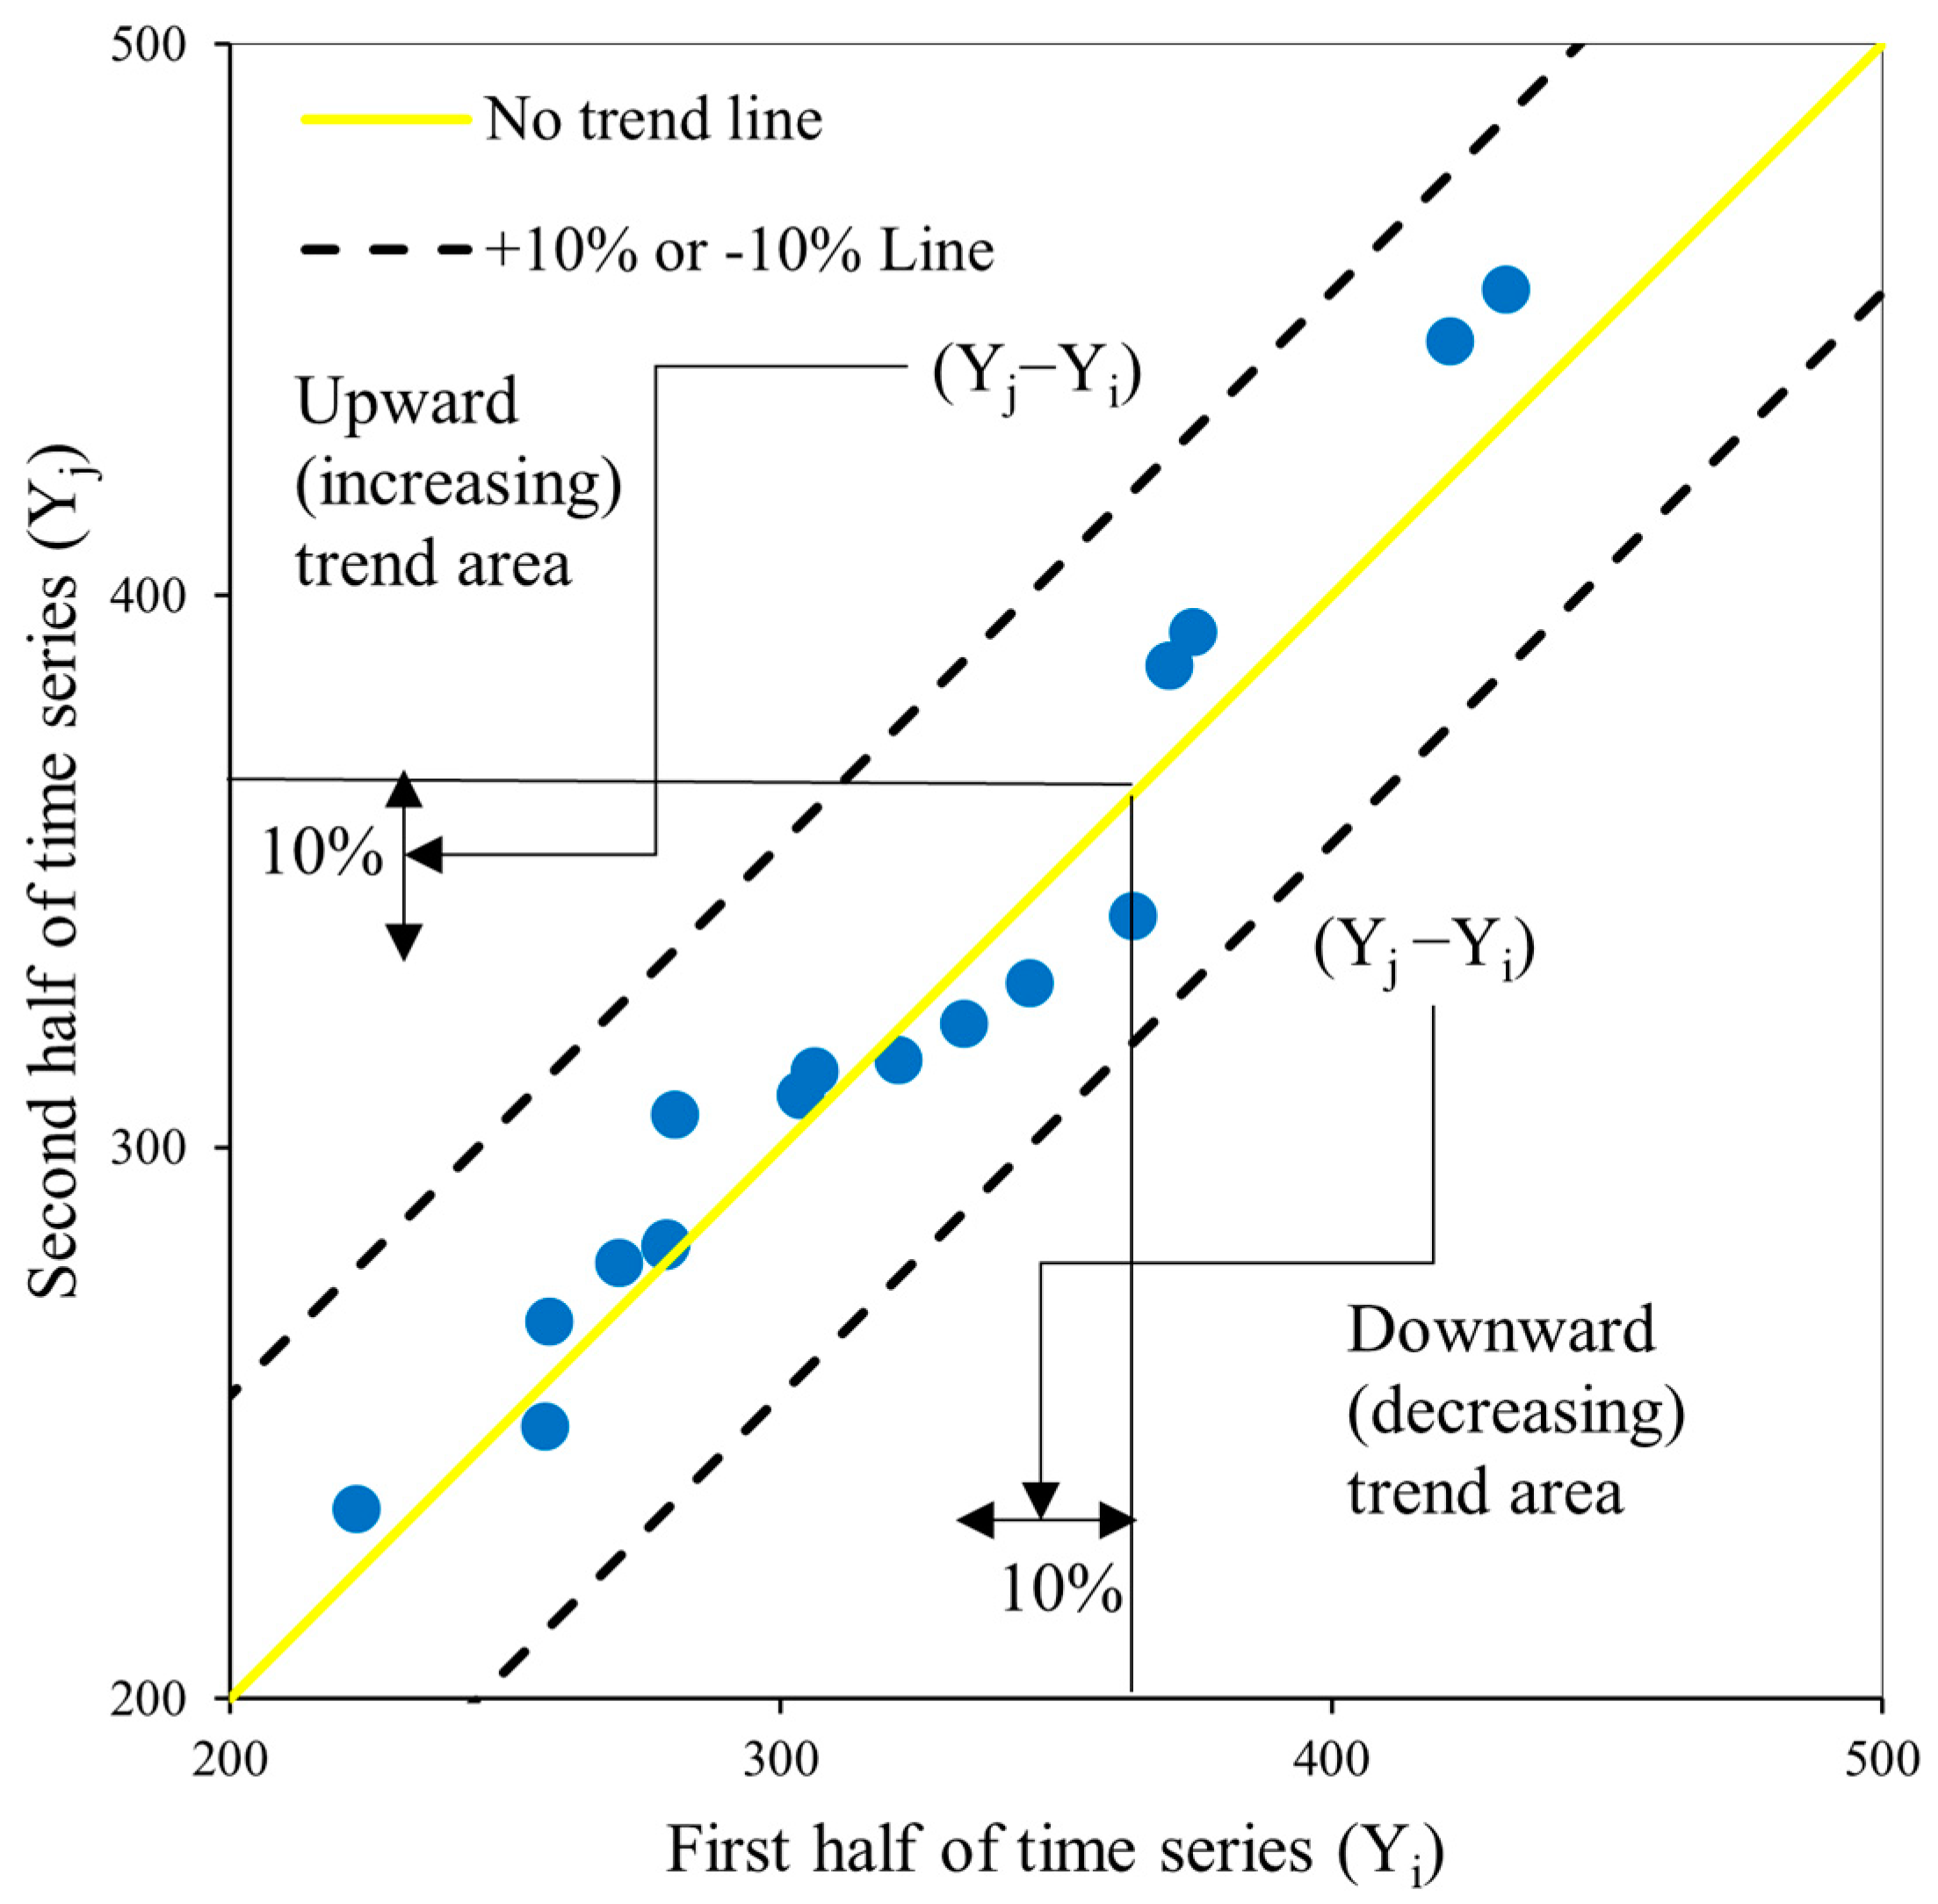
The strength of the ITA method over other non-parametric methods has led to its extensive use in many studies, along with other trend analysis techniques, to examine changes in climatological, meteorological, and hydrological data across the globe. The information needs to be separated into two portions of equal size and then put into two separate ascending-order categories for each half. Figure 2 depicts a Cartesian coordinate system, with the X-axis used to represent the first half of the data and the Y-axis used to represent the second. The deviation on each side would be grouped into a number of clusters. Blue data points gathered in the lower and upper triangular areas of the 1:1 yellow line, however, show a downward or upward trend, respectively [28].
To estimate the magnitude of the trend in a data series, apply Equation (8) [35]
B = 1 n i = 1 n 10 Y j Y i μ
In Equation (8), B stands for the trend indicator, n for each subseries’ number of values, Yi and Yj for the first and second subseries’ respective data points, and for the first subseries mean. A number for B that is negative or positive denotes a trend in either way.

2.3.3. Şen’s Innovative Trend Analysis Method

The concept of the Şen, Z. 2017 [29] innovative trend analysis (referred hereafter as improved ITA, i.e., IITA) method could be better explained by using the linear trend function between independent variables (x) and dependent variables (y) as follows:
y = m x + c
whereas m and c are the slope and intercept.
For the estimation of slope m, the easiest method is the calculation by using the formula m = y 2 y 1 x 2 x 1 , provided that the dependent and corresponding independent variables are known. Moreover, the calculation of the slope value and its substation in the above equation leaves only one unknown, which can then be calculated by substitution of coordinates in either one of the given points leading to
c = y 1 m x 1 ,   or c = y 2 m x 2
Given a regular sequence of n independent time variables (x1, x2,…, xn) and the corresponding dependent variable sequence (y1, y2,…, yn), the unknown parameters (m and c) can be determined by either utilizing any two points or by applying a linear regression methodology.
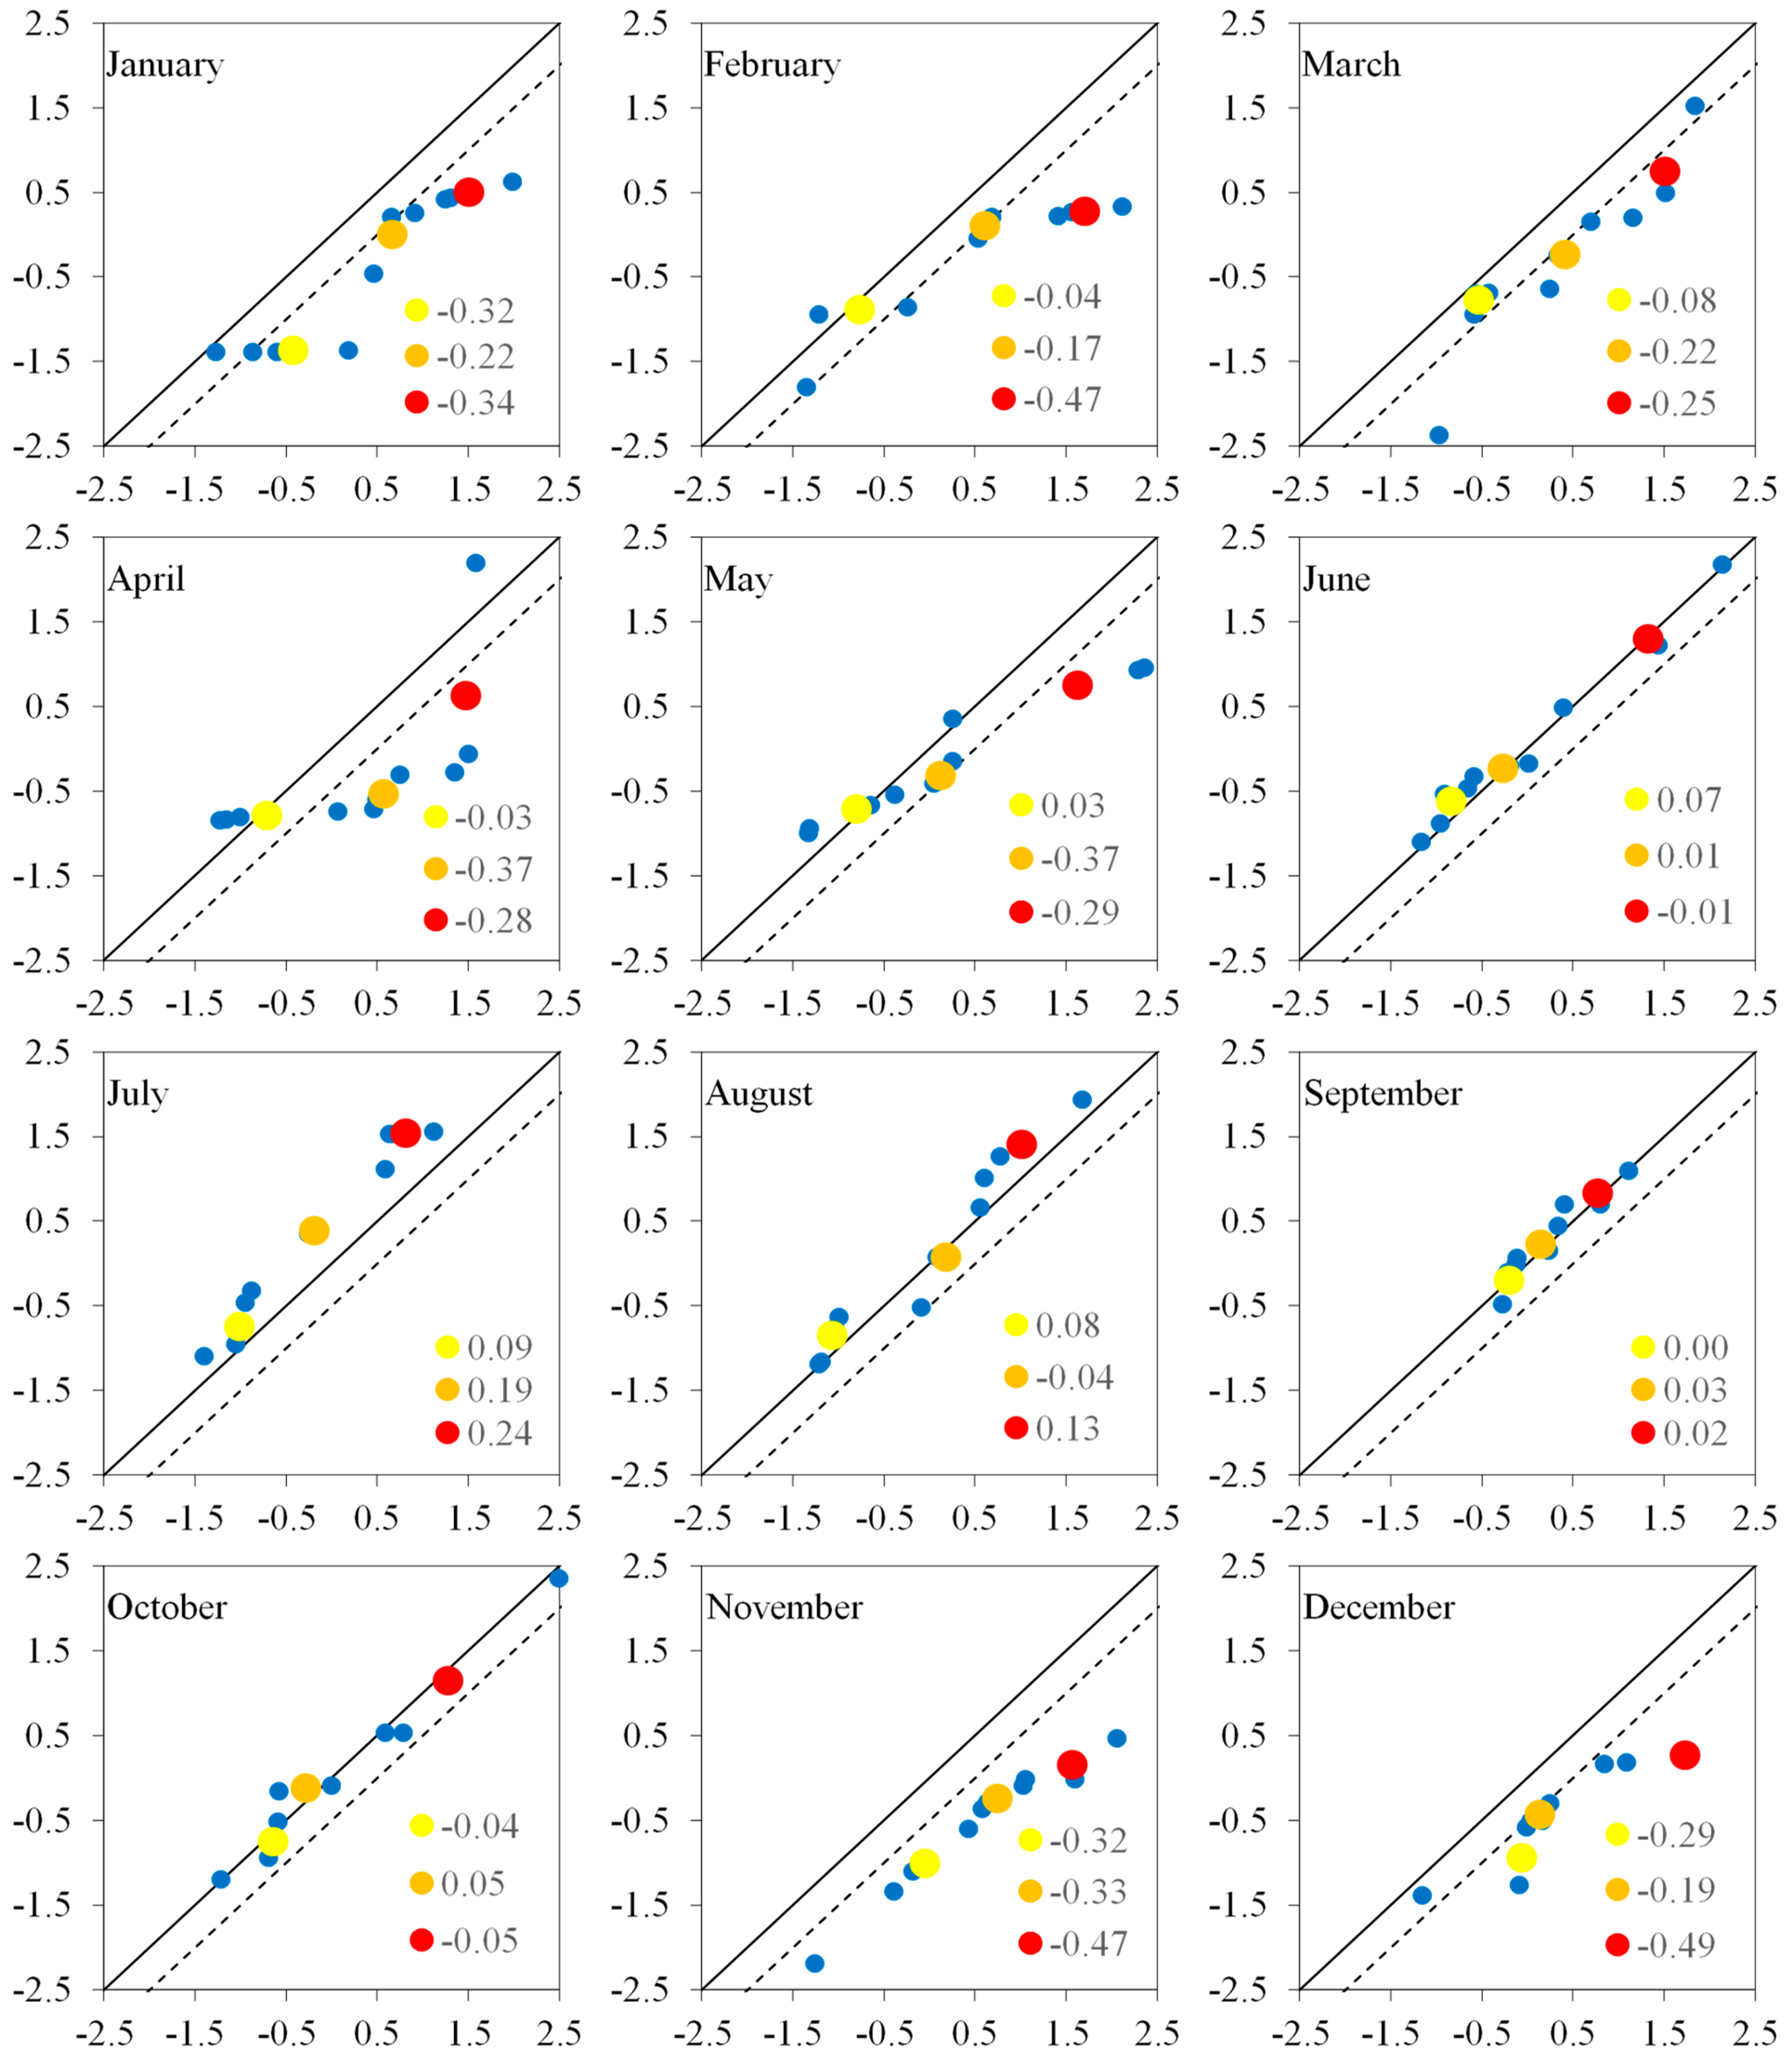
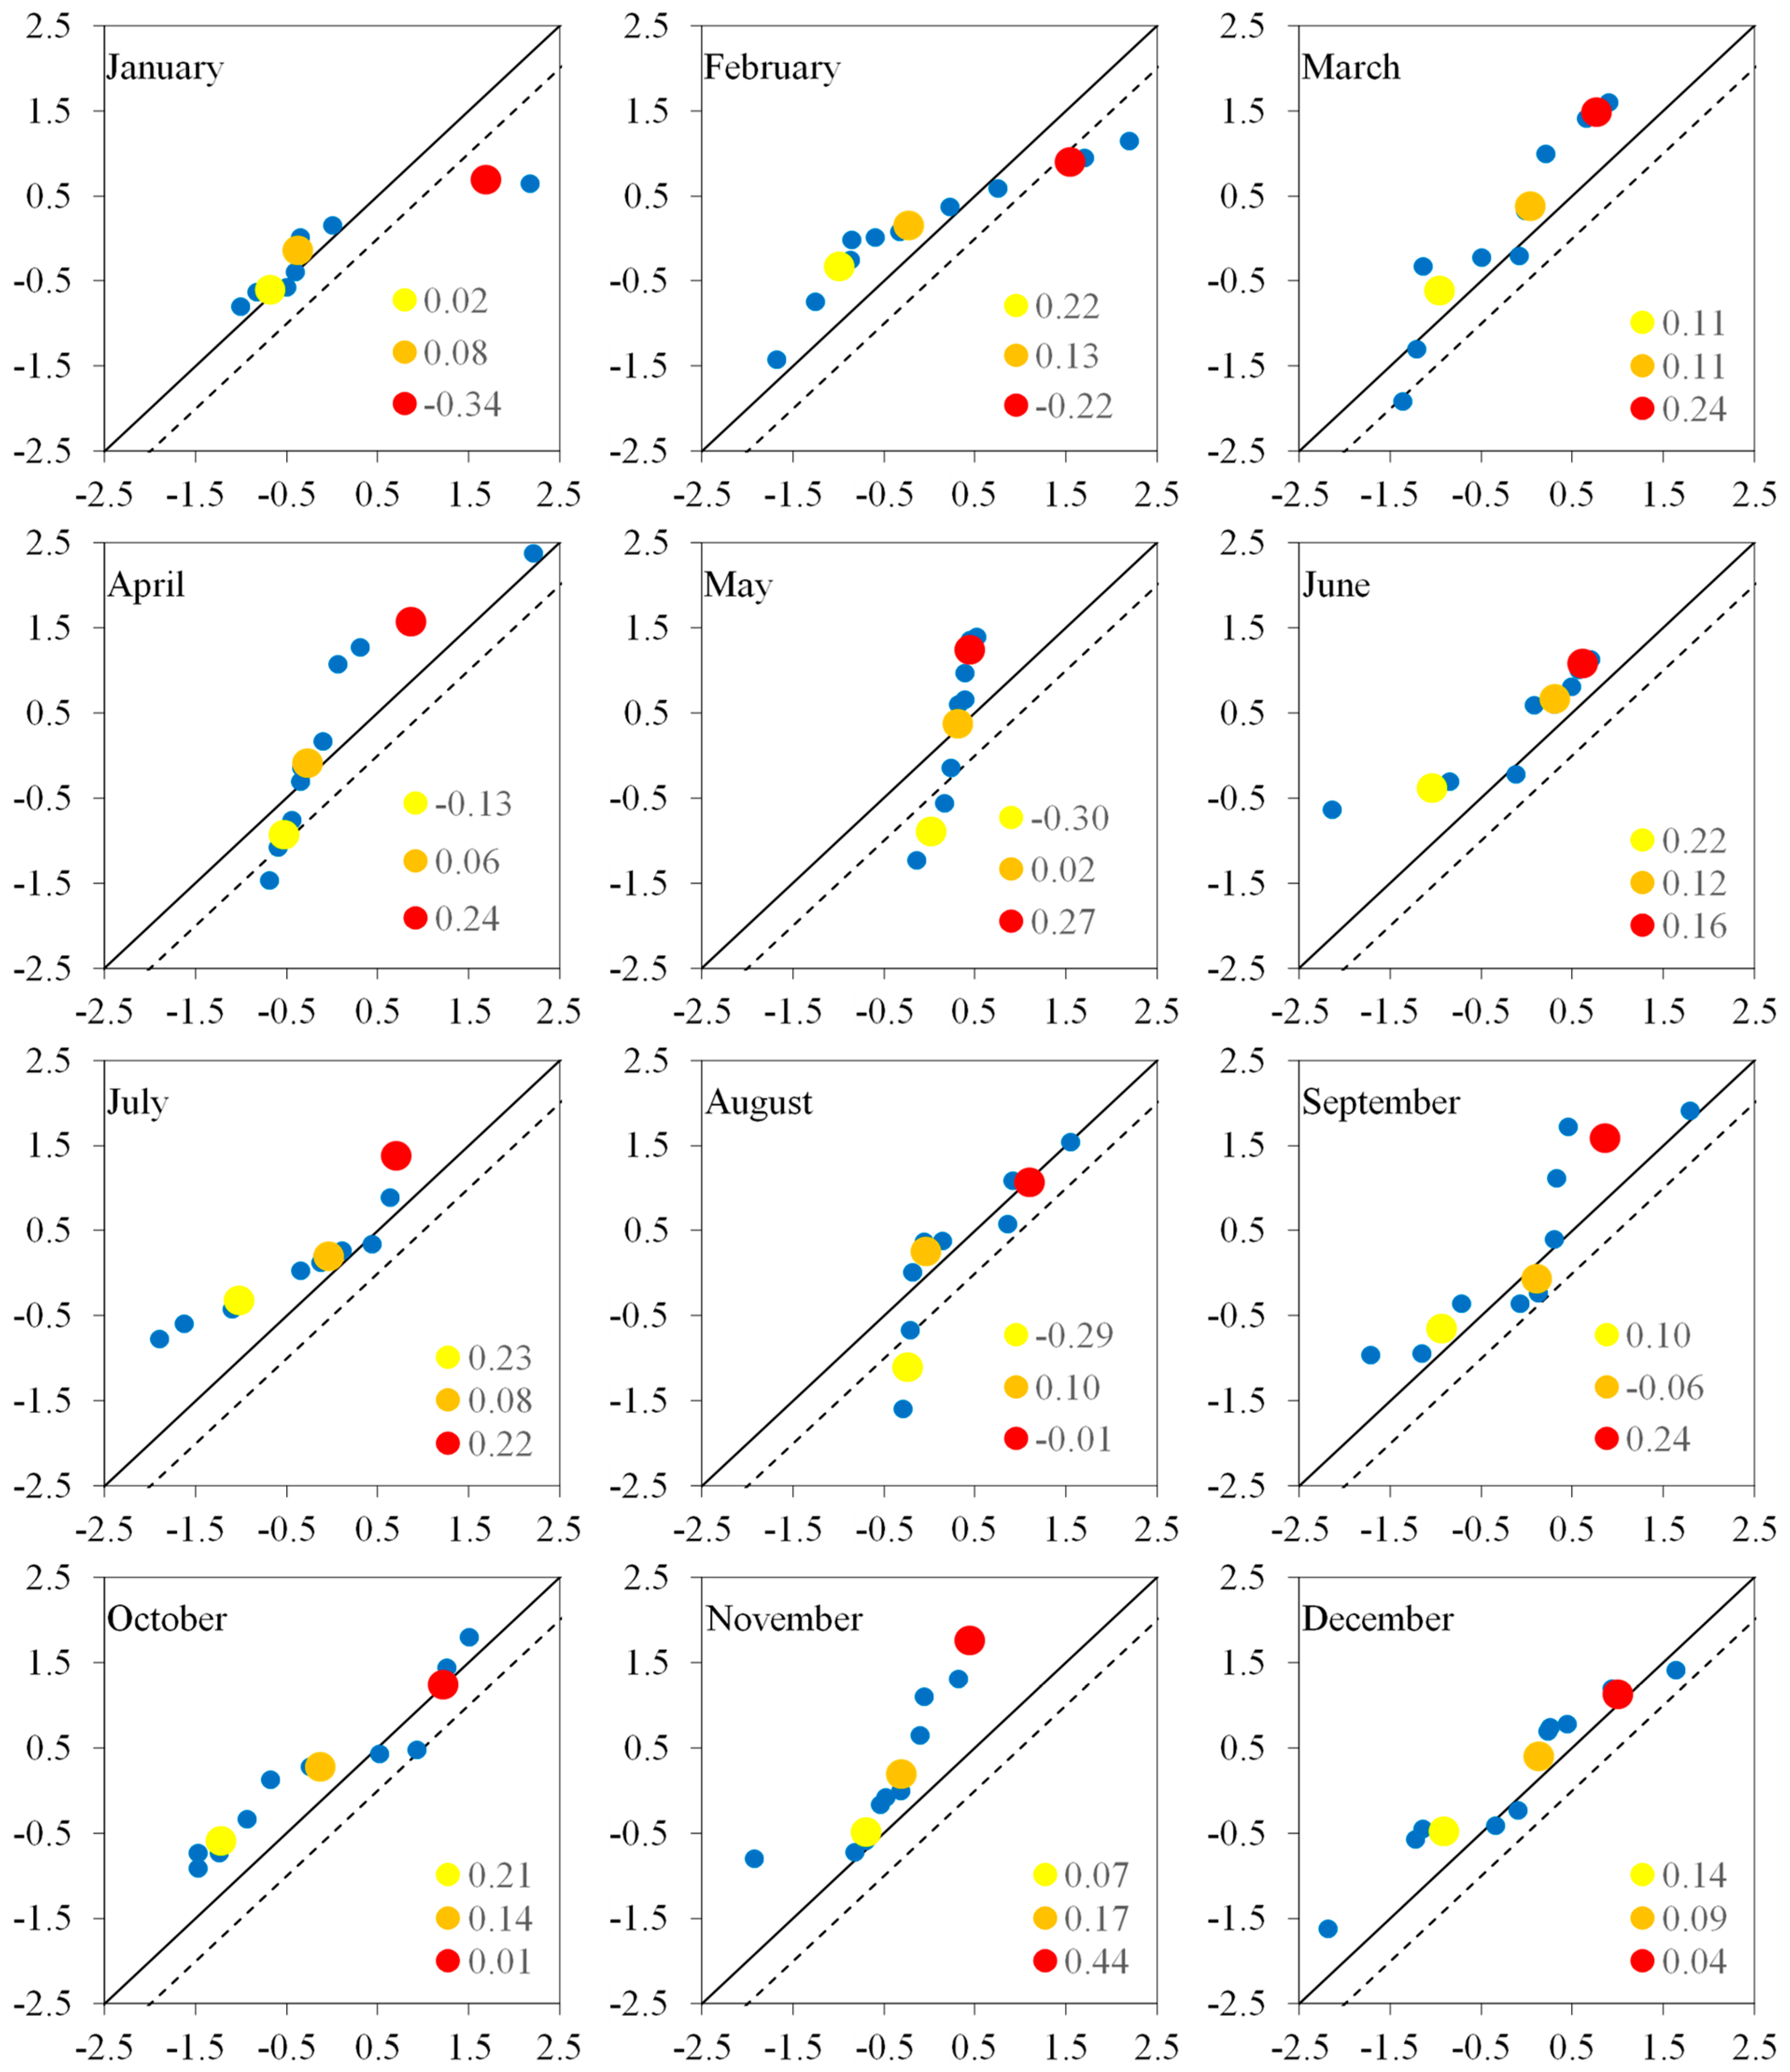
A similar concept for the estimation of slope m and intercept c was introduced in the improved innovative trend analysis (IITA) method. In the IITA time series, the dependent variable (y) was divided in half, with each subseries being sorted separately and in ascending order. The X-axis of the Cartesian coordinate system corresponds to the first half subseries, as well as the second half subseries on the Y-axis (Figure 3).
According to Sen, the dependent variable plotted in half should follow a 1:1 straight line, which is generally referred to as a data line and indicates no trend, whereas the deviation from the data line indicates the existence of a trend in a timeseries. Any data values above the 1:1 straight line indicate an upward trend, while any values below it indicate a downward trend [28]. The point where the data line, which is dashed in black and parallel to the 1:1 line, connects is known as the centroid (x, y) and is equal to the arithmetic average of two halves. Furthermore, the slope of the current trend in the dependent variable is the vertical distance between the time series and the 1:1 line [29]. Additionally, based on the placement of the data points, it provides trend detection in intermediate, high, and low categories [33]. Hence, the slope can be calculated as:
S = 2 ( y 2 ¯ y 1 ¯ ) n
where y 2 ¯ is the second subseries average, y 1 ¯ is the first subseries average, and n is the number of values in the time series. If the original observation of a time series was odd, it was removed to avoid losing the most recent data. S is a trend slope, and a negative value indicates that it is falling, while a positive number indicates that the time series is rising.
For estimation of the y-axis intercept c, the coordinates of a single point (logically the arithmetic average of x and y) are substituted in Equation (10)
c = y ¯ 2 ( y 2 ¯ y 1 ¯ ) n · x ¯
Hence, by using Equations (11) and (12), the final form of Equation (9) can be written as
y = y ¯ 2 ( y 2 ¯ y 1 ¯ ) n · x ¯ + 2 ( y 2 ¯ y 1 ¯ ) n · x

3. Results

3.1. Statistical Analysis

The statistical evaluation involved calculating the mean daily streamflow of ten (10) sites as well as the coefficients of skewness (Cs), kurtosis (Ck), standard deviation (SD), and coefficient of variation. For the years 1996 to 2018, Table 2 shows these statistical variables for daily streamflow timeseries data at different hydrological locations. The mean daily streamflow in the UIRB catchment region varied from 3741.5 m3/s in the southwest (at 218 m) (Massan) to 1.5 m3/s in the southeast (Chahan) and 453 m in elevation. The skewness and kurtosis values, as shown in Table 2, varied from 1.466 to 25.406 and 1.285 to 1046.472, respectively. For timeseries with normally distributed data, the coefficients of kurtosis and skewness must be equivalent to 3 and 0, respectively. Instead of being normally distributed, datasets are obviously positively biased. The daily streamflow distribution based on space for each location was also calculated using the measure of dispersion from the mean (coefficient of variation). Due to the non-normal scattering of the data, these statistical parameters demonstrated that parametric approaches would not be used for trend analysis.

3.2. Homogeneity Analysis

The homogeneity of daily streamflow timeseries at ten (10) stations was examined using four homogeneity tests, including the Pettitt’s test (PT), standard normal homogeneity test (SNHT), cumulative deviation (CD), and Buishand’s range (BR) tests. The findings revealed that all timeseries were homogeneous and useful for further analysis (Table 3). The autocorrelation test at lag-1 was used to evaluate the data dependability prior to the use of Mann–Kendall (MK), and it was discovered that monthly streamflow timeseries for all months were serially independent at all stations. After checking the reliability of the streamflow data, the standardized drought indices (SDI) were calculated using DrinC software utilizing mean monthly streamflow measurements. Standardized drought indices (SDI) were employed to record the hydrological conditions at unaltered and anthropogenically altered stations in the UIRB. The streamflow long-term time series data serves as the foundation for Standardized drought indices (SDI).

3.3. Variations in Monthly Hydrological Drought Indices

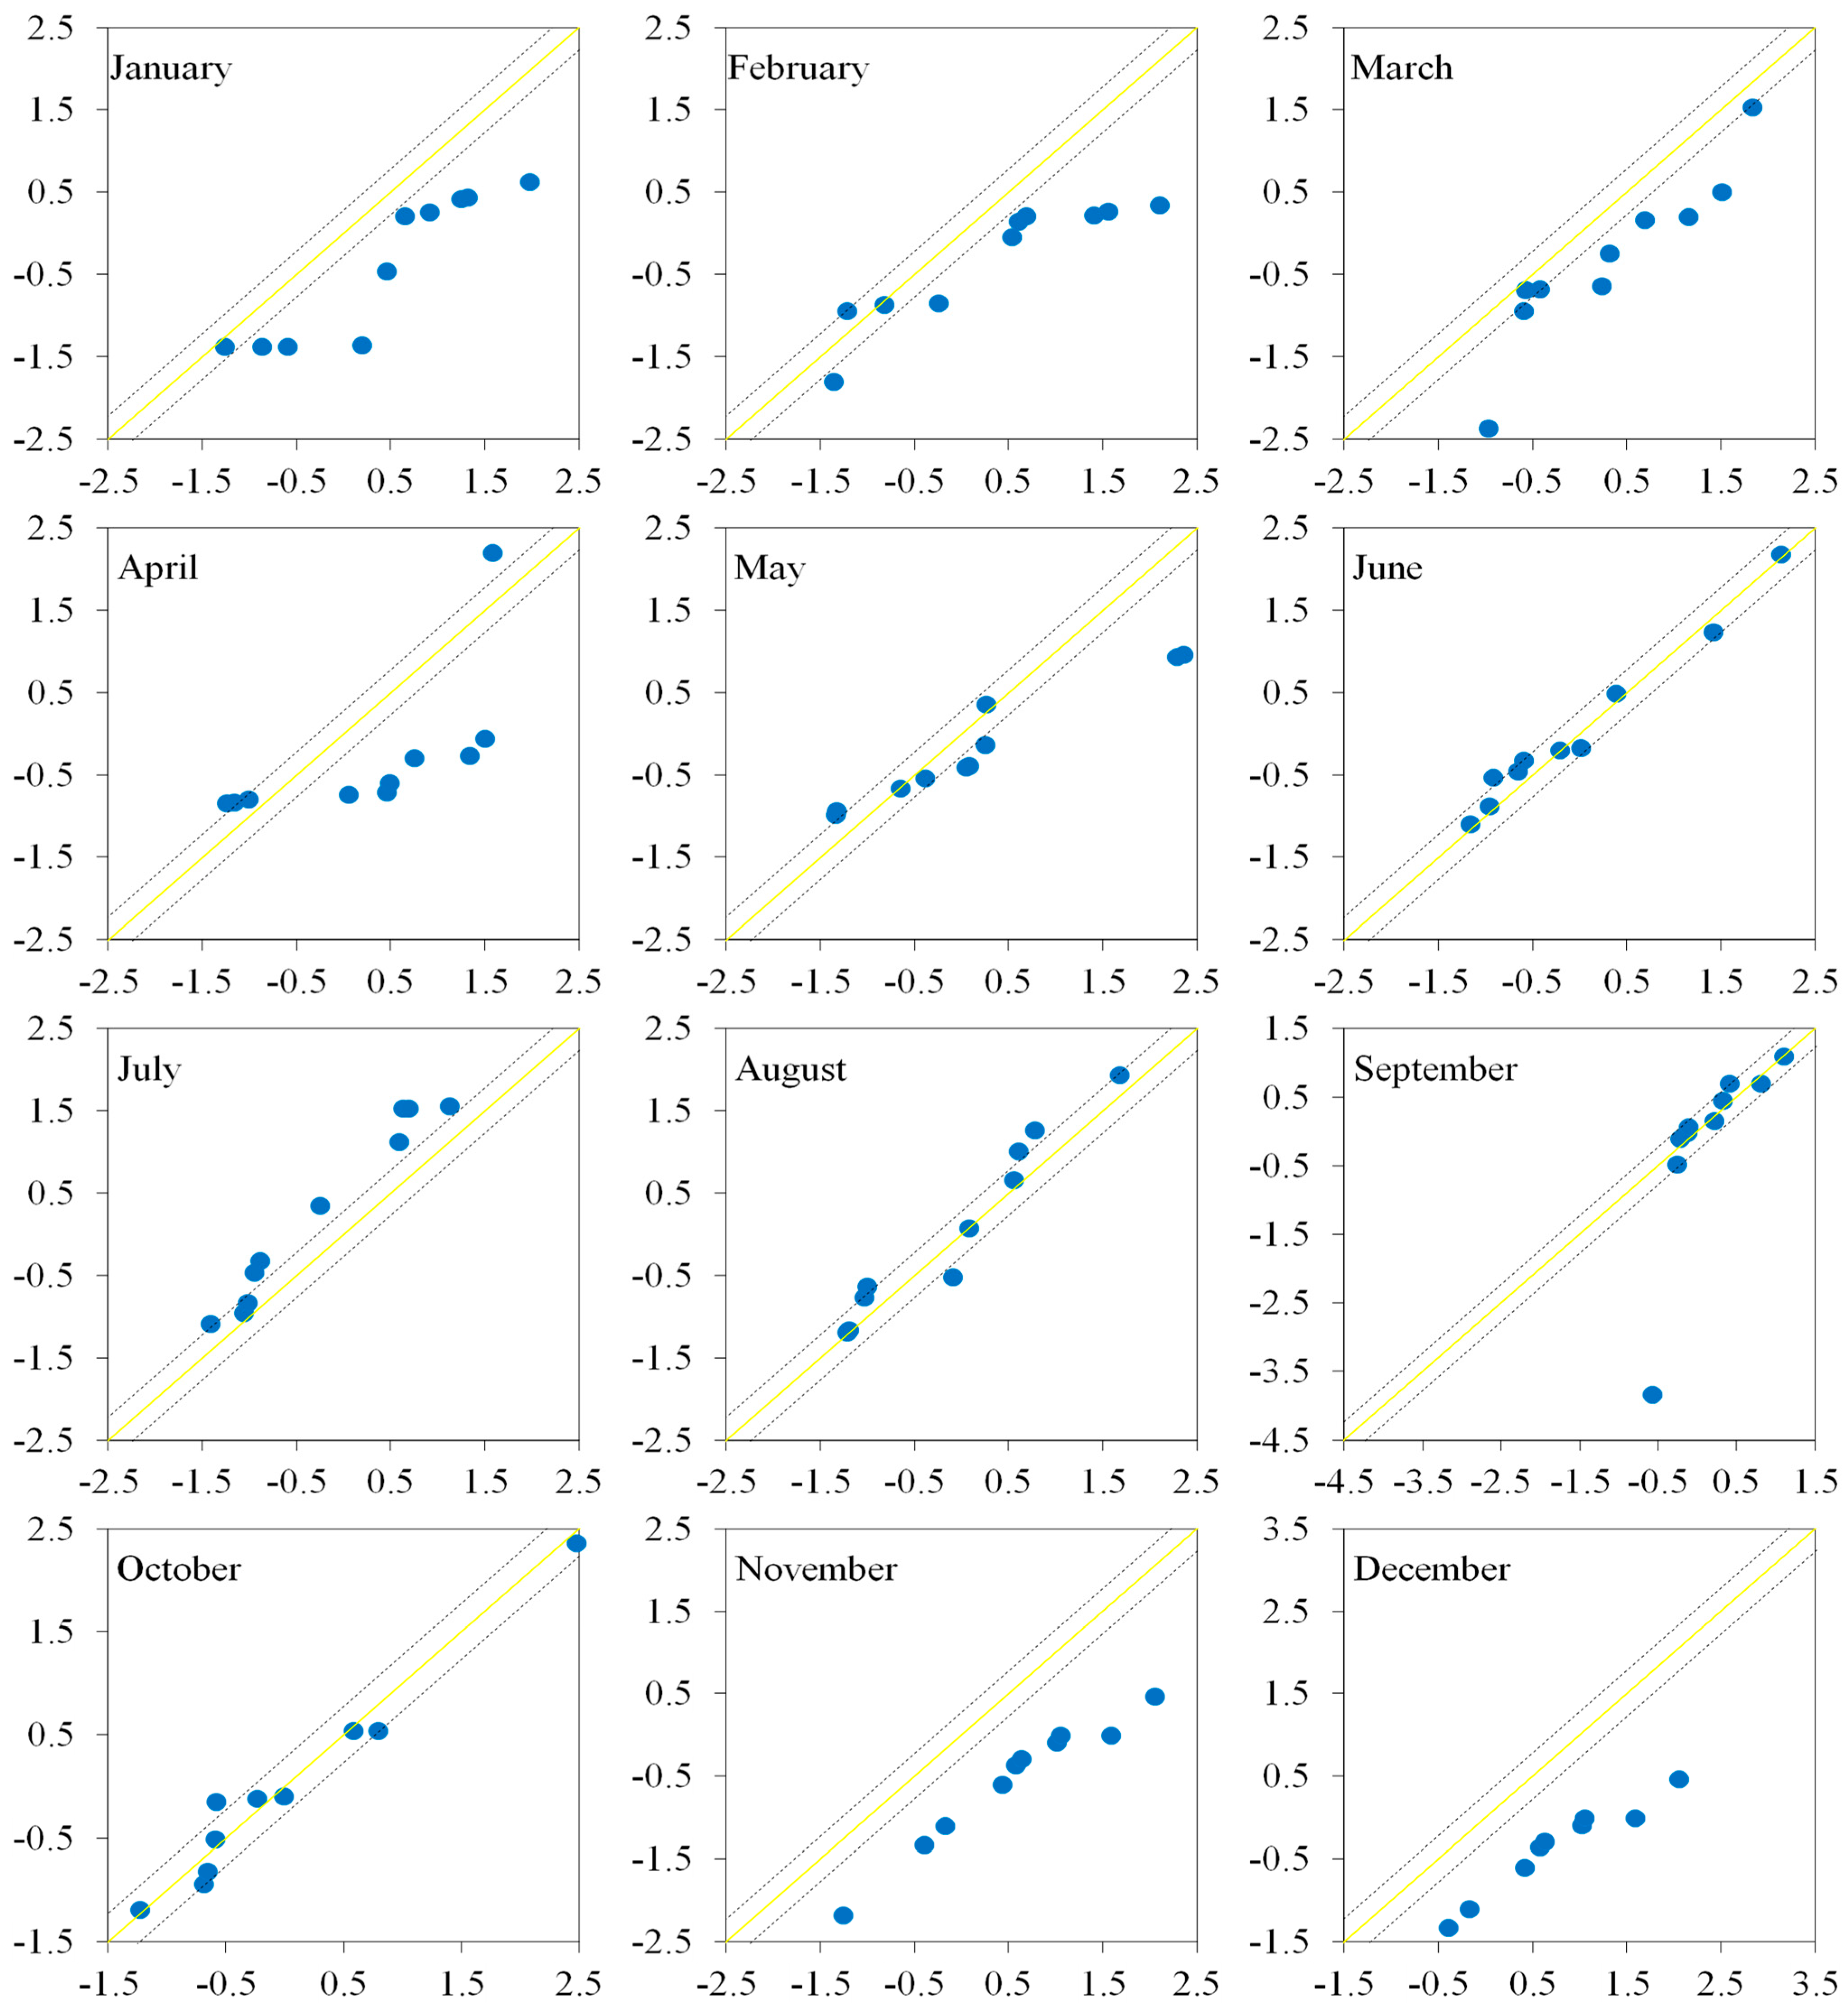
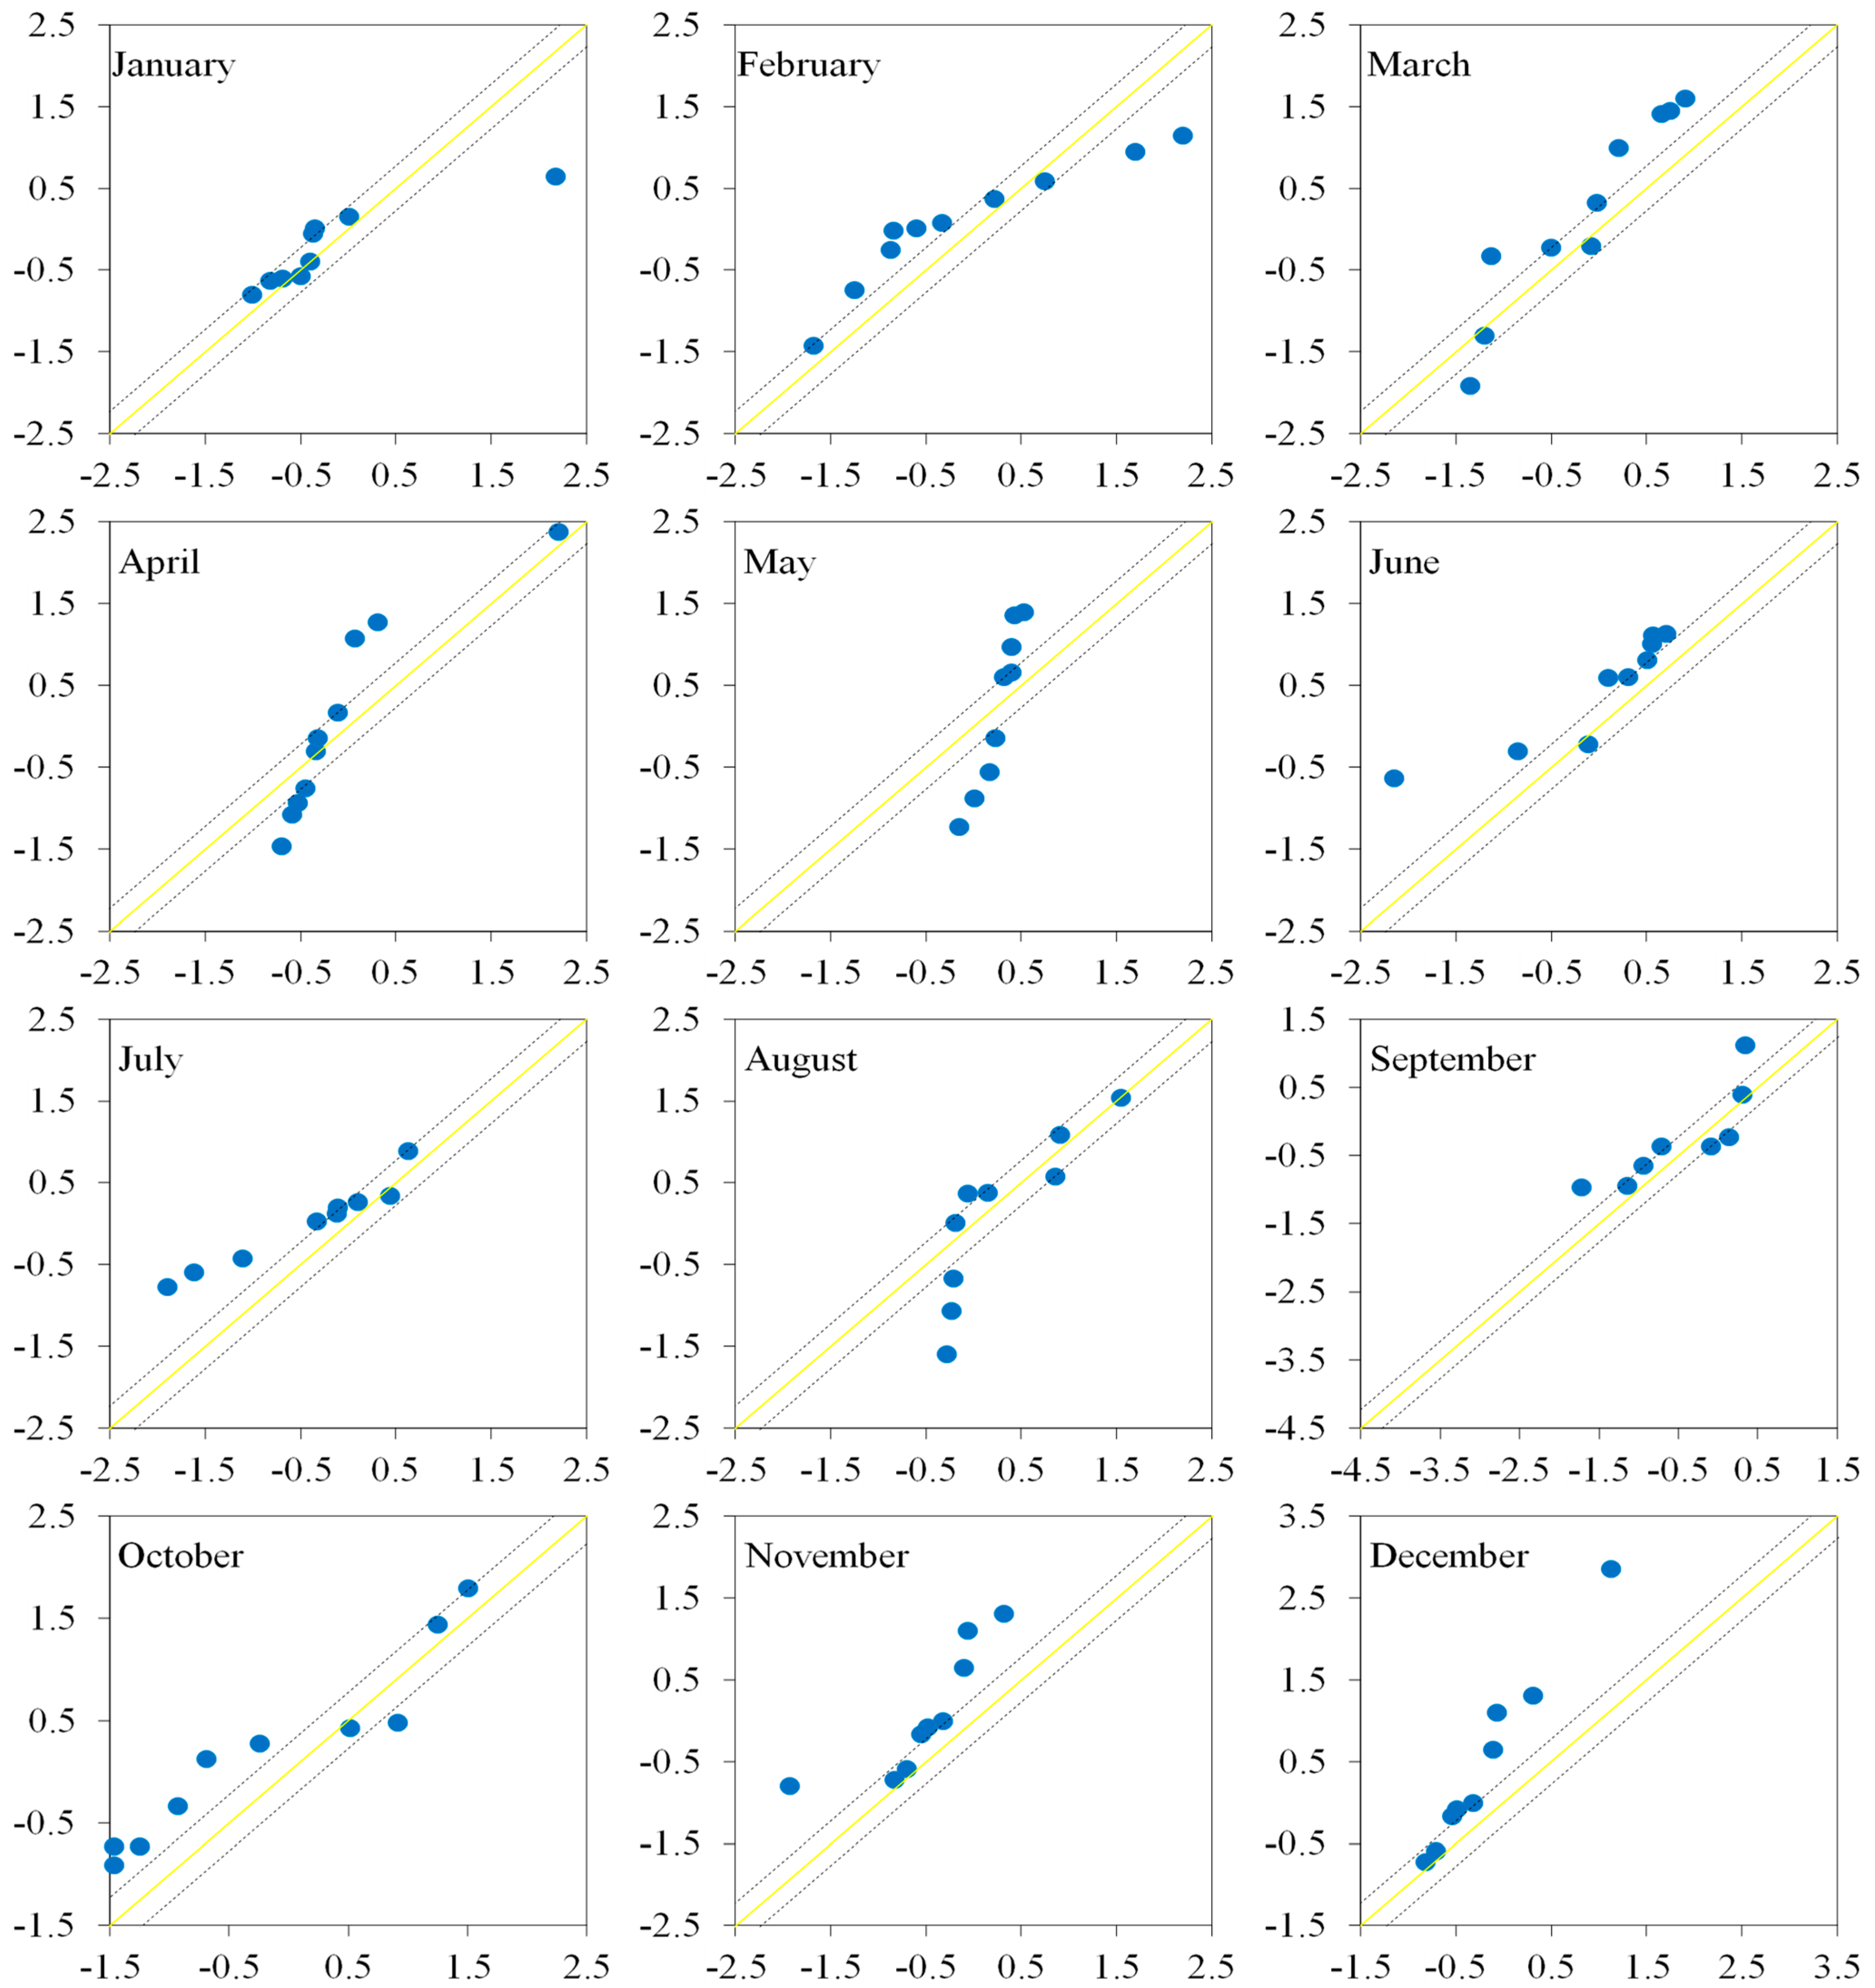
Using the ITA, MK, and IITA methods, the variations in monthly hydrological drought indices at different stations were investigated. Both negative and positive patterns were found at various stations on a monthly scale. The results of monthly hydrological drought index variations by using MK, ITA, and IITA methods are presented in Table 4. In the months of January through April and November through December, the MK test showed significant declining trends at Kharmong station, whereas the ITA and IITA tests exhibited insignificant trends. For the month of June, the ITA method exhibited a significant growing trend, but insignificant trends were found in the other two tests. Significant growth trends were detected during the months of Aug and Sep from the ITA test. Significant trends were detected at 48 timeseries out of 120 timeseries from which 16 displayed significant growth and the rest showed significant declining trends. A declining trend at most of the stations was perceived in all three tests. Figure 4, Figure 5, Figure 6 and Figure 7 display the graphic results of the ITA and IITA methods for the Kharmong and Massan stations.

3.4. Comparison of Trend Results

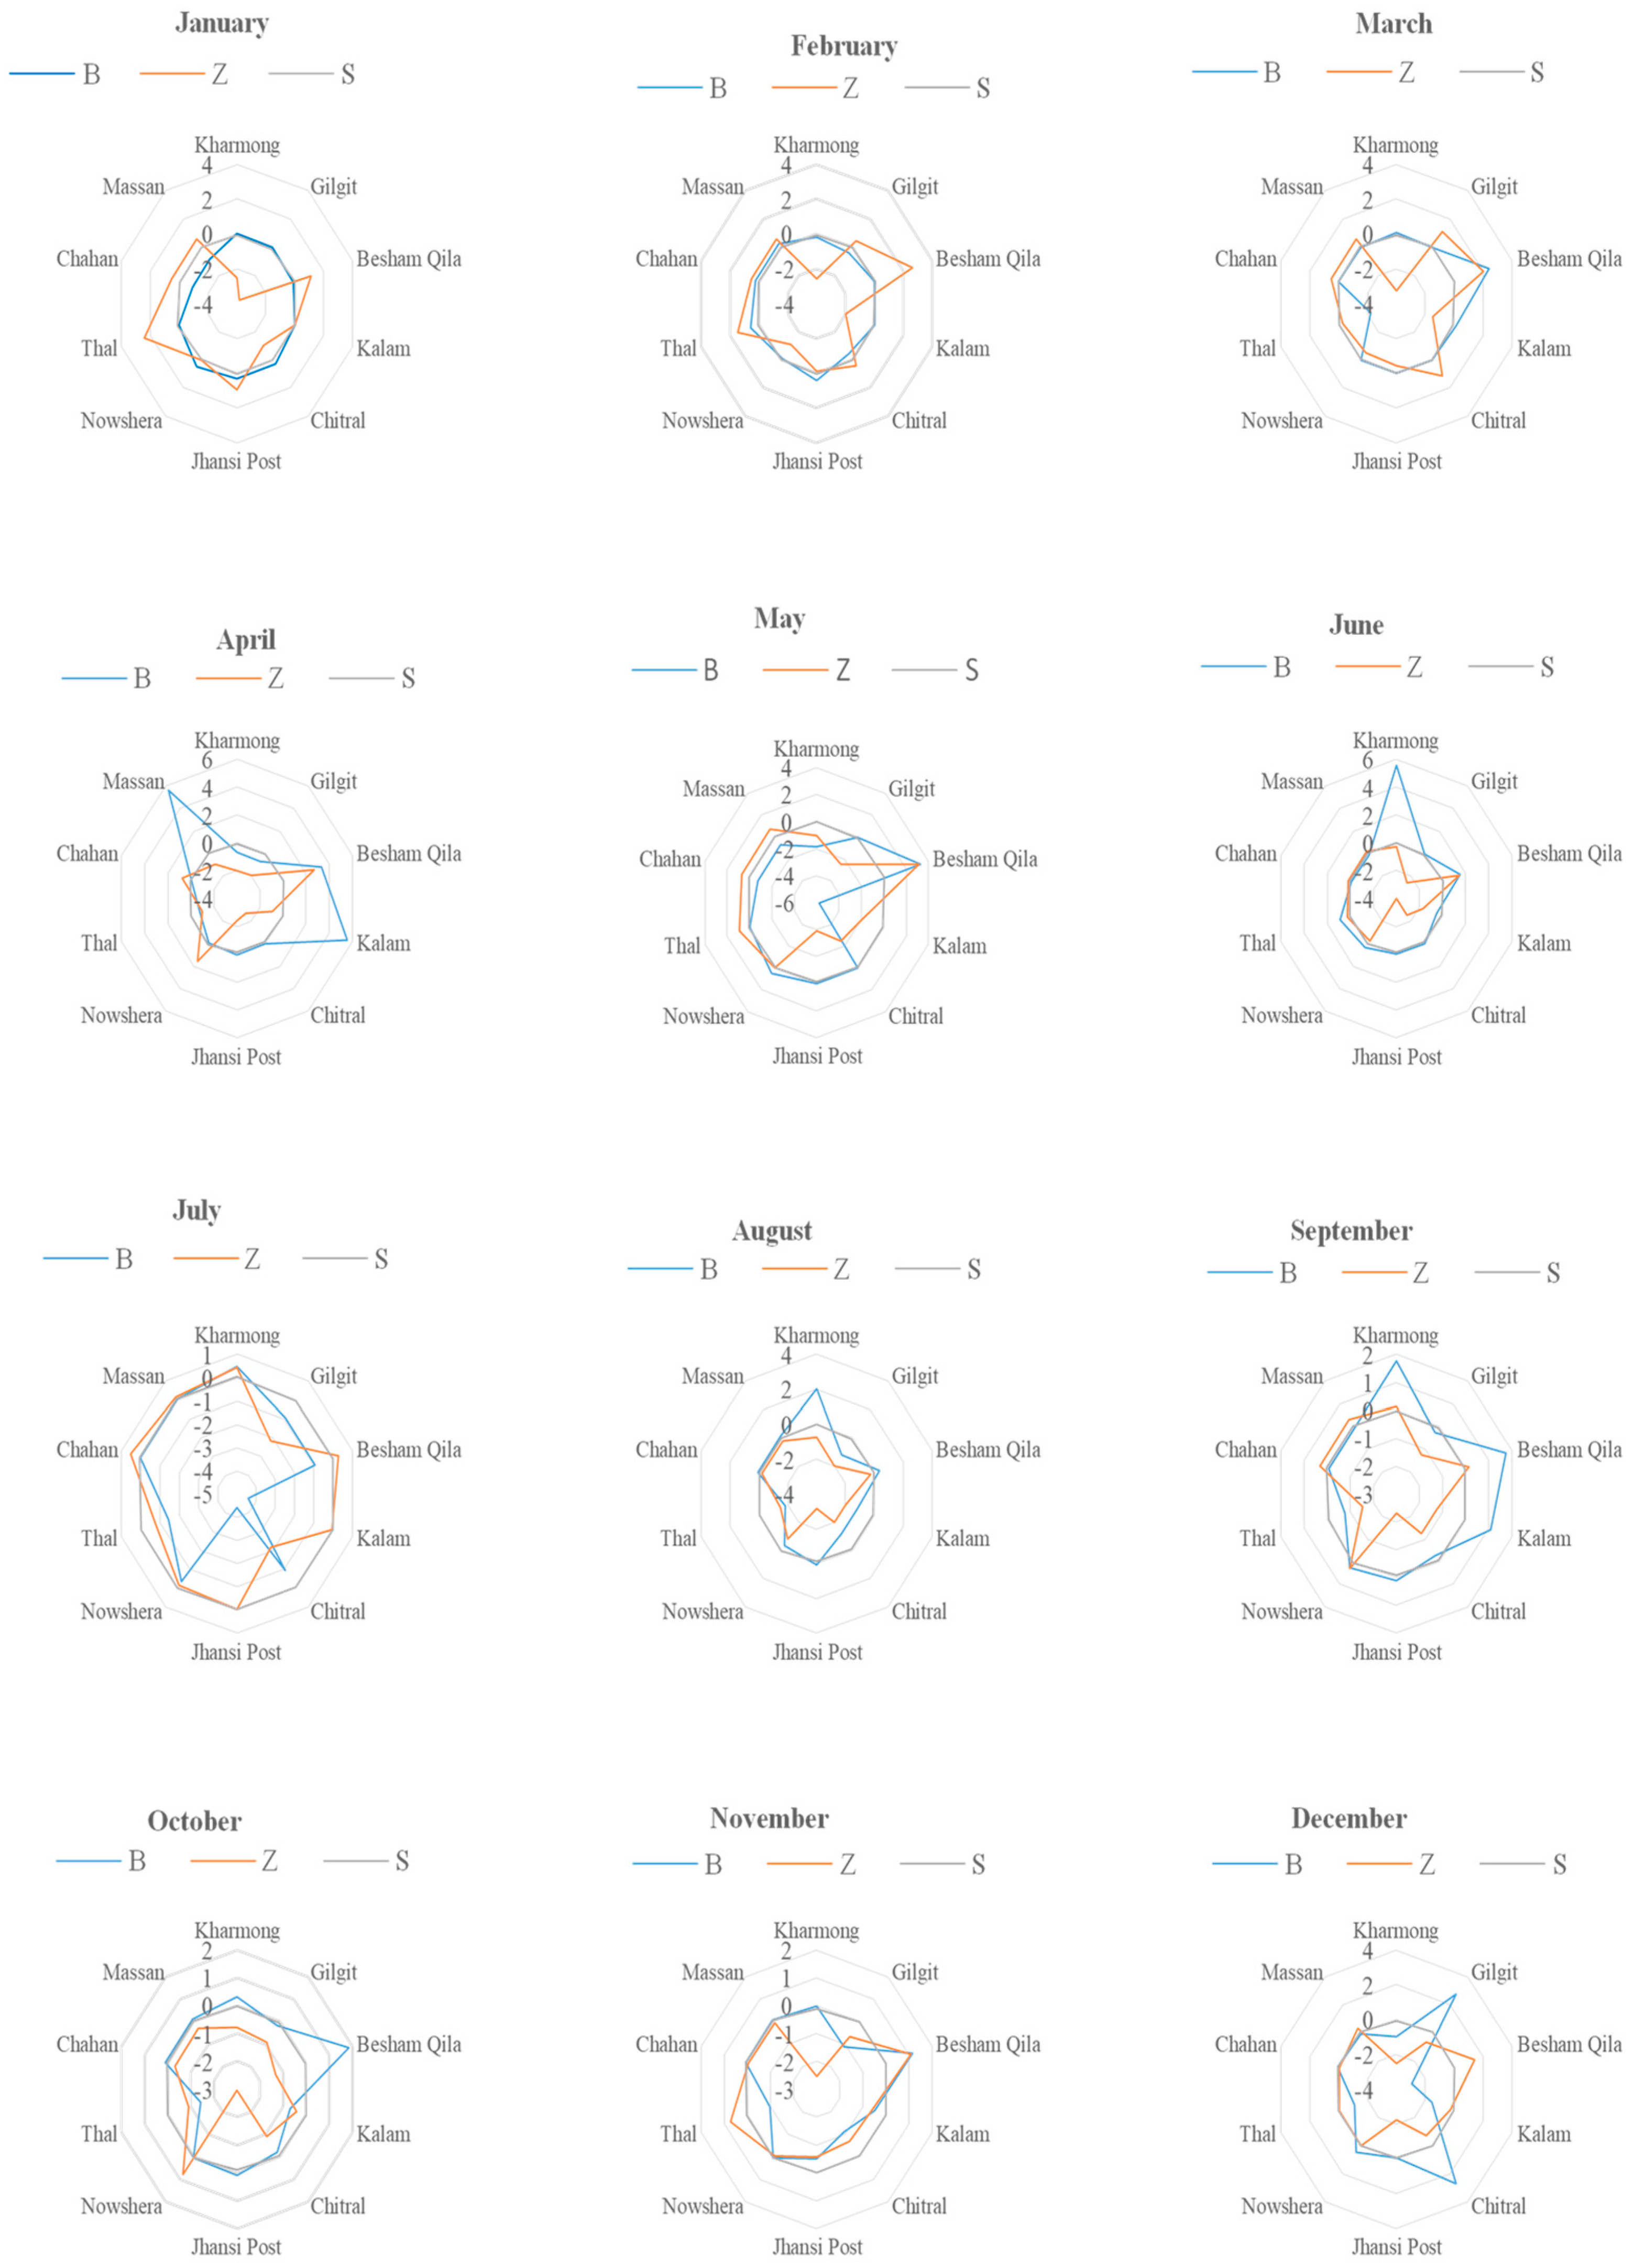
By comparing it with MK and ITA findings on a monthly basis, the improved innovative trend analysis (IITA) method’s applicability was examined, and results are presented in Figure 8 as radar graphs. Significant trends were detected by using the MK and ITA methods at 33 and 17 timeseries out of 120, respectively; however, 37 timeseries showed significant trends utilizing the IITA approach on a monthly basis. However, insignificant trends were consistent in all three methods. The IITA technique is a trustworthy and efficient method because it can analyze trends in the medium, high, and low values of hydrometeorological timeseries from its graphical representation based on the conclusions from all three trend analysis techniques being consistent. In comparison to other statistical techniques such as the MK and SR tests, which have limiting criteria such as serial independence of data, normal distribution, and length of timeseries data, the IITA approach has a more extensive use [35].

4. Discussion

This study uses the ITA, MK, and IITA methodologies to evaluate the variability of hydrological drought indices at the monthly scale over the UIRB. In order to meet the downstream water needs for various uses, such as irrigation, industrial, household, hydropower, etc., the UIRB water resources, which are susceptible to change due to climate change, are used [44,56,57]. In order to make better use of the limited water resources now accessible and to use them more effectively, an understanding of the variability of the hydrological drought over the UIRB is crucial. Prior research mainly concentrated on examining the climatological variables variations over the UIRB [44,50,55]. Furthermore, no study examined the fluctuations in low, mid, and high streamflow values while utilizing the IITA approach to account for the hydrological drought variability. As a result, this study used the IITA method to investigate the hydrological drought variability at a monthly scale and evaluated the IITA’s dependability by contrasting its findings with those of the ITA and MK tests.
Over a monthly time scale, several stations displayed a mix of decreasing and increasing trends. Although the remaining months showed insignificant trends, February and October showed significant decreasing trends at Kharmong Station. Streamflow is increasing at the Kharmong station, supporting the findings of the current study that hydrological drought decreases at Kharmong station [35,72]. Three (03) stations, i.e., Gilgit, Besham Qila, Kalam, and Chitral, detected significant decreasing trends in January, whereas Jhansi Post and Thal stations detected significant increasing trends. At Besham Qila, where the Indus River is flowing (upstream of Tarbela), it was found to be increasing at a rate of 6%, according to research [73]. The Besham flows from 1969 to 1995 were also examined by Ashraf et al. [72], who discovered an escalating trend. On the other hand, over the previous 20 years, Archer and Fowler (2004) [74] observed a pattern of falling Indus River flows. At four (04) locations, the standardized drought index (SDI) timeseries for the month of February showed significant decreasing trends. Two (02) sites recorded significant decreasing trends in the March SDI timeseries, while one (01) station recorded a significant increasing trend. At the majority of the locations, there were significant increasing trends from June to August, which were endorsed by the previous studies [54,72]. Hydrological drought timeseries from October to March showed substantial lowering trends on a monthly scale, which is similar to the findings of earlier research that found clear patterns towards increasing streamflow from October to March [54,73]. However, hydrological drought timeseries from April to September exhibited significant increasing trends, and these results were also found to be consistent with preceding research [54,72,75]. These rising trends in the timeseries of the hydrological drought suggest a shift in the trend of the highest hydrological drought from these months to other months.
By comparing it with MK and ITA findings on a monthly basis, the improved innovative trend analysis (IITA) method’s applicability was examined. Significant trends were detected by using the MK and ITA methods at 33 and 17 timeseries out of 120 timeseries, respectively; however, 37 timeseries showed significant trends utilizing the IITA approach on a monthly basis, which showed that the IITA method has the capability to identify the hidden trends present in the timeseries. However, insignificant trends were consistent in all three methods. The IITA technique is a trustworthy and efficient method because it can analyze trends in the medium, high, and low values of hydrometeorological timeseries from its graphical representation based on the conclusions from all three trend analysis techniques being consistent.

5. Conclusions

This study examined hydrological drought variability over the UIRB by using MK, ITA, and IITA methodologies at a monthly time scale. By contrasting the IITA method’s outcomes with those of the MK and ITA techniques, the method’s applicability was assessed. A total of 120 timeseries were examined on a monthly basis, and utilizing the MK, ITA, and IITA methodologies, respectively, 14.7%, 27.5%, and 30.83% of those timeseries showed significant patterns, demonstrating a general consensus across the board and across all tests with significant patterns. In the high-altitude portions of the UIRB (>2000 m), significant declining trends were seen during the months of June, July, and August, whereas significant increasing trends were observed in the low altitude reaches (500 m). From this study, the following are the key conclusions:
  • From October to March, hydrological drought timeseries at the monthly scale exhibited significant downward trends;
  • Hydrological drought timeseries from April to September exhibited significant increasing trends;
  • The lower Indus plains’ access to water resources, where the majority of the community depends on agriculture, is consistently negatively impacted by hydrological droughts;
  • IITA is a trustworthy and effective method because the results in all three methods were consistent, and it has the advantage of allowing researchers to examine patterns in the low, medium, and high values of hydrometeorological timeseries from its graphical representation over the other methods.
The findings of this research can help manage agricultural and water resources, safeguard the environment, foster social development, forecast future climate in the study area, and plan for future water resources. This study’s trend analysis was based on instrumental data collected over the preceding 20 years. It would be fascinating to find out if such a pattern exists outside of the range of variability recorded in the geologic record. This challenging topic requires extensive additional research, which is beyond the purview of this investigation. The scope of the current study was restricted to hydrological drought variability for the time period just up to 2018, but results were nevertheless interpreted in light of recent changes in temperature, precipitation, and snow cover in the Indus, Jhelum, and Kabul River basins of the Upper Indus River Basin (UIRB). A degree-day or energy-based model can be used to extend the temporal range and link the effects of hydrological droughts to temperature, precipitation, and snow cover on a sub-basin scale. Additionally, the hydrological drought index (SDI)’s relationship with other drought indices such as the standardized precipitation index (SPI) and standardized precipitation evapotranspiration index (SPEI) would be evaluated to determine the duration, severity, and frequency of the drought.

Author Contributions

Conceptualization, M.S.A. and M.W.; methodology, M.S.A. and M.W.; software, M.S.A. and M.S.; validation, M.S.A. and M.A.; formal analysis, M.S.A. and K.U.R.; investigation, M.S.A. and M.W.; resources, M.S. and M.A.; data curation, M.S.; writing—original draft preparation, M.S.A. and M.W.; writing—review and editing, M.W. and M.S.; visualization, M.A.; supervision, M.W. and M.S.; project administration, M.W. and M.S.; funding acquisition, K.U.R. All authors have read and agreed to the published version of the manuscript.

Funding

This research was funded by the Shuimu Scholar Program of Tsinghua University (Grant number 2020SM072), the National Natural Science Foundation of China (Grant number 52250410336), and the China Postdoctoral Science Foundation (Grant number 2022M721872).

Institutional Review Board Statement

Not Applicable.

Informed Consent Statement

Not Applicable.

Data Availability Statement

Data will be available on request.

Acknowledgments

The authors acknowledge the SWHP, WAPDA for making the availability of required data possible to coagulate this research work.

Conflicts of Interest

The authors declare no conflict of interest.

References

  1. Crosbie, R.S.; Scanlon, B.R.; Mpelasoka, F.S.; Reedy, R.C.; Gates, J.B.; Zhang, L. Potential Climate Change Effects on Groundwater Recharge in the High Plains Aquifer, USA. Water Resour. Res. 2013, 49, 3936–3951. [Google Scholar] [CrossRef] [Green Version]
  2. Reshmidevi, T.V.; Kumar, D.N.; Mehrotra, R.; Sharma, A. Estimation of the Climate Change Impact on a Catchment Water Balance Using an Ensemble of GCMs. J. Hydrol. 2017, 556, 1192–1204. [Google Scholar] [CrossRef] [Green Version]
  3. Van Loon, A.F.; Stahl, K.; Di Baldassarre, G.; Clark, J.; Rangecroft, S.; Wanders, N.; Gleeson, T.; Van Dijk, A.I.J.M.; Tallaksen, L.M.; Hannaford, J.; et al. Drought in a Human-Modified World: Reframing Drought Definitions, Understanding, and Analysis Approaches. Hydrol. Earth Syst. Sci. 2016, 20, 3631–3650. [Google Scholar] [CrossRef] [Green Version]
  4. Seneviratne, S.I.; Nicholls, N.; Easterling, D.; Goodess, C.M.; Kanae, S.; Kossin, J.; Luo, Y.; Marengo, J.; Mc Innes, K.; Rahimi, M.; et al. Changes in Climate Extremes and Their Impacts on the Natural Physical Environment. Manag. Risks Extrem. Events Disasters Adv. Clim. Chang. Adapt. Spec. Rep. Intergov. Panel Clim. Chang. 2012, 9781107025, 109–230. [Google Scholar] [CrossRef] [Green Version]
  5. Yu, M.; Li, Q.; Hayes, M.J.; Svoboda, M.D.; Heim, R.R. Are Droughts Becoming More Frequent or Severe in China Based on the Standardized Precipitation Evapotranspiration Index: 1951–2010? Int. J. Climatol. 2014, 34, 545–558. [Google Scholar] [CrossRef] [Green Version]
  6. Stringer, L.C.; Akhtar-Schuster, M.; Marques, M.J.; Amiraslani, F.; Quatrini, S.; Abraham, E.M. Combating Land Degradation and Desertification and Enhancing Food Security: Towards Integrated Solutions. Ann. Arid Zone 2011, 50, 1–23. [Google Scholar]
  7. Sohrabi, M.M.; Ryu, J.H.; Abatzoglou, J.; Tracy, J. Climate Extreme and Its Linkage to Regional Drought over Idaho, USA. Nat. Hazards 2013, 65, 653–681. [Google Scholar] [CrossRef]
  8. Sharma, T.C.; Panu, U.S. Procédures d’analyse de Sécheresses Hydrologiques Hebdomadaires: Le Cas de Rivières Canadiennes. Hydrol. Sci. J. 2010, 55, 79–92. [Google Scholar] [CrossRef]
  9. Bae, H.; Ji, H.; Lim, Y.J.; Ryu, Y.; Kim, M.H.; Kim, B.J. Characteristics of Drought Propagation in South Korea: Relationship between Meteorological, Agricultural, and Hydrological Droughts. Nat. Hazards 2019, 99, 1–16. [Google Scholar] [CrossRef] [Green Version]
  10. Zhao, C.; Brissette, F.; Chen, J.; Martel, J.-L. Frequency Change of Future Extreme Summer Meteorological and Hydrological Droughts over North America. J. Hydrol. 2020, 584, 124316. [Google Scholar] [CrossRef]
  11. Waseem, M.; Jaffry, A.H.; Azam, M.; Ahmad, I.; Abbas, A.; Lee, J.E. Spatiotemporal Analysis of Drought and Agriculture Standardized Residual Yield Series Nexuses across Punjab, Pakistan. Water 2022, 14, 496. [Google Scholar] [CrossRef]
  12. Waseem, M.; Ahmad, I.; Mujtaba, A.; Tayyab, M.; Si, C.; Lü, H.; Dong, X. Spatiotemporal Dynamics of Precipitation in Southwest Arid-Agriculture Zones of Pakistan. Sustainability 2020, 12, 2305. [Google Scholar] [CrossRef] [Green Version]
  13. Muhammad, W.; Muhammad, S.; Khan, N.M.; Si, C. Hydrological Drought Indexing Approach in Response to Climate and Anthropogenic Activities. Theor. Appl. Climatol. 2020, 141, 1401–1413. [Google Scholar] [CrossRef]
  14. Waseem, M.; Khurshid, T.; Abbas, A.; Ahmad, I.; Javed, Z. Impact of Meteorological Drought on Agriculture Production at Different Scales in Punjab, Pakistan. J. Water Clim. Chang. 2022, 13, 113–124. [Google Scholar] [CrossRef]
  15. Waseem, M.; Ajmal, M.; Ahmad, I.; Khan, N.; Azam, M.; Sarwar, M. Projected Drought Pattern under Climate Change Scenario Using Multivariate Analysis. Arab. J. Geosci. 2021, 14, 544. [Google Scholar] [CrossRef]
  16. Sarwar, A.N.; Waseem, M.; Azam, M.; Abbas, A.; Ahmad, I.; Lee, J.E.; Haq, F.U. Shifting of Meteorological to Hydrological Drought Risk at Regional Scale. Appl. Sci. 2022, 12, 5560. [Google Scholar] [CrossRef]
  17. Peña-Gallardo, M.; Vicente-Serrano, S.M.; Hannaford, J.; Lorenzo-Lacruz, J.; Svoboda, M.; Domínguez-Castro, F.; Maneta, M.; Tomas-Burguera, M.; Kenawy, A. El Complex Influences of Meteorological Drought Time-Scales on Hydrological Droughts in Natural Basins of the Contiguous Unites States. J. Hydrol. 2019, 568, 611–625. [Google Scholar] [CrossRef] [Green Version]
  18. Kubiak-Wójcicka, K.; Bąk, B. Monitoring of Meteorological and Hydrological Droughts in the Vistula Basin (Poland). Environ. Monit. Assess. 2018, 190, 87–100. [Google Scholar] [CrossRef] [PubMed] [Green Version]
  19. Skakun, S.; Kussul, N.; Shelestov, A.; Kussul, O. The Use of Satellite Data for Agriculture Drought Risk Quantification in Ukraine. Geomat. Nat. Hazards Risk 2016, 7, 901–917. [Google Scholar] [CrossRef]
  20. Chen, Z.; Yang, G. Analysis of Drought Hazards in North China: Distribution and Interpretation. Nat. Hazards 2013, 65, 279–294. [Google Scholar] [CrossRef]
  21. Ullah, I.; Ma, X.; Yin, J.; Omer, A.; Habtemicheal, B.A.; Saleem, F.; Iyakaremye, V.; Syed, S.; Arshad, M.; Liu, M. Spatiotemporal Characteristics of Meteorological Drought Variability and Trends (1981–2020) over South Asia and the Associated Large-Scale Circulation Patterns. Clim. Dyn. 2022, 60, 2261–2284. [Google Scholar] [CrossRef]
  22. Ullah, I.; Ma, X.; Asfaw, T.G.; Yin, J.; Iyakaremye, V.; Saleem, F.; Xing, Y.; Azam, K.; Syed, S. Projected Changes in Increased Drought Risks Over South Asia Under a Warmer Climate. Earth’s Future 2022, 10, e2022EF002830. [Google Scholar] [CrossRef]
  23. Bard, A.; Renard, B.; Lang, M.; Giuntoli, I.; Korck, J.; Koboltschnig, G.; Janža, M.; d’Amico, M.; Volken, D. Trends in the Hydrologic Regime of Alpine Rivers. J. Hydrol. 2015, 529, 1823–1837. [Google Scholar] [CrossRef]
  24. Wang, X.; Hou, X.; Wang, Y. Spatiotemporal Variations and Regional Differences of Extreme Precipitation Events in the Coastal Area of China from 1961 to 2014. Atmos. Res. 2017, 197, 94–104. [Google Scholar] [CrossRef]
  25. Patakamuri, S.K.; Muthiah, K.; Sridhar, V. Long-Term Homogeneity, Trend, and Change-Point Analysis of Rainfall in the Arid District of Ananthapuramu, Andhra Pradesh State, India. Water 2020, 12, 211. [Google Scholar] [CrossRef] [Green Version]
  26. Abeysingha, N.S.; Singh, M.; Sehgal, V.K.; Khanna, M.; Pathak, H. Analysis of Trends in Streamflow and Its Linkages with Rainfall and Anthropogenic Factors in Gomti River Basin of North India. Theor. Appl. Climatol. 2016, 123, 785–799. [Google Scholar] [CrossRef]
  27. Abghari, H.; Tabari, H.; Talaee, P.H. River Flow Trends in the West of Iran during the Past 40 years: Impact of Precipitation Variability. Glob. Planet. Chang. 2013, 101, 52–60. [Google Scholar] [CrossRef]
  28. Şen, Z. Innovative Trend Analysis Methodology. J. Hydrol. Eng. 2012, 17, 1042–1046. [Google Scholar] [CrossRef]
  29. Şen, Z. Innovative Trend Significance Test and Applications. Theor. Appl. Climatol. 2017, 127, 939–947. [Google Scholar] [CrossRef]
  30. Markus, M.; Demissie, M.; Short, M.B.; Verma, S.; Cooke, R.A. Sensitivity Analysis of Annual Nitrate Loads and the Corresponding Trends in the Lower Illinois River. J. Hydrol. Eng. 2014, 19, 533–543. [Google Scholar] [CrossRef]
  31. Onyutha, C. Identification of Sub-Trends from Hydro-Meteorological Series. Stoch. Environ. Res. Risk Assess. 2016, 30, 189–205. [Google Scholar] [CrossRef]
  32. Tefaruk, H.; Hatice, C. Trend, Independence, Stationarity, and Homogeneity Tests on Maximum Rainfall Series of Standard Durations Recorded in Turkey. J. Hydrol. Eng. 2014, 19, 5014009. [Google Scholar] [CrossRef]
  33. Elouissi, A.; Şen, Z.; Habi, M. Algerian Rainfall Innovative Trend Analysis and Its Implications to Macta Watershed. Arab. J. Geosci. 2016, 9, 303. [Google Scholar] [CrossRef]
  34. Ay, M.; Kisi, O. Investigation of Trend Analysis of Monthly Total Precipitation by an Innovative Method. Theor. Appl. Climatol. 2015, 120, 617–629. [Google Scholar] [CrossRef]
  35. Wu, H.; Qian, H. Innovative Trend Analysis of Annual and Seasonal Rainfall and Extreme Values in Shaanxi, China, since the 1950s. Int. J. Climatol. 2017, 37, 2582–2592. [Google Scholar] [CrossRef]
  36. Tosunoglu, F.; Kisi, O. Trend Analysis of Maximum Hydrologic Drought Variables Using Mann–Kendall and Şen’s Innovative Trend Method. River Res. Appl. 2017, 33, 597–610. [Google Scholar] [CrossRef]
  37. Dabanlı, İ.; Şen, Z.; Yeleğen, M.Ö.; Şişman, E.; Selek, B.; Güçlü, Y.S. Trend Assessment by the Innovative-Şen Method. Water Resour. Manag. 2016, 30, 5193–5203. [Google Scholar] [CrossRef]
  38. Güçlü, Y.S. Multiple Şen-Innovative Trend Analyses and Partial Mann-Kendall Test. J. Hydrol. 2018, 566, 685–704. [Google Scholar] [CrossRef]
  39. Birpınar, M.E.; Kızılöz, B.; Şişman, E. Classic Trend Analysis Methods’ Paradoxical Results and Innovative Trend Analysis Methodology with Percentile Ranges. Theor. Appl. Climatol. 2023, 1–18. [Google Scholar] [CrossRef]
  40. Şişman, E.; Kizilöz, B. The Application of Piecewise ITA Method in Oxford, 1870–2019. Theor. Appl. Climatol. 2021, 145, 1451–1465. [Google Scholar] [CrossRef]
  41. Bolch, T.; Kulkarni, A.; Kääb, A.; Huggel, C.; Paul, F.; Cogley, J.G.; Frey, H.; Kargel, J.S.; Fujita, K.; Scheel, M.; et al. The State and Fate of Himalayan Glaciers. Science 2012, 336, 310–314. [Google Scholar] [CrossRef] [Green Version]
  42. Immerzeel, W.W.; van Beek, L.P.H.; Konz, M.; Shrestha, A.B.; Bierkens, M.F.P. Hydrological Response to Climate Change in a Glacierized Catchment in the Himalayas. Clim. Chang. 2012, 110, 721–736. [Google Scholar] [CrossRef] [PubMed] [Green Version]
  43. De Souza, K.; Kituyi, E.; Harvey, B.; Leone, M.; Murali, K.S.; Ford, J.D. Vulnerability to Climate Change in Three Hot Spots in Africa and Asia: Key Issues for Policy-Relevant Adaptation and Resilience-Building Research. Reg. Environ. Chang. 2015, 15, 747–753. [Google Scholar] [CrossRef] [Green Version]
  44. Hasson, S.; Böhner, J.; Lucarini, V. Prevailing Climatic Trends and Runoff Response from Hindukush-Karakoram-Himalaya, Upper Indus Basin. Earth Syst. Dyn. 2015, 6, 579–653. [Google Scholar] [CrossRef]
  45. Ali, S.; Wang, Q.; Liu, D.; Fu, Q.; Mafuzur Rahaman, M.; Abrar Faiz, M.; Jehanzeb Masud Cheema, M. Estimation of Spatio-Temporal Groundwater Storage Variations in the Lower Transboundary Indus Basin Using GRACE Satellite. J. Hydrol. 2022, 605, 127315. [Google Scholar] [CrossRef]
  46. Arshad, A.; Mirchi, A.; Samimi, M.; Ahmad, B. Combining Downscaled-GRACE Data with SWAT to Improve the Estimation of Groundwater Storage and Depletion Variations in the Irrigated Indus Basin (IIB). Sci. Total Environ. 2022, 838, 156044. [Google Scholar] [CrossRef]
  47. Ali, S.; Khorrami, B.; Jehanzaib, M.; Tariq, A.; Ajmal, M.; Arshad, A.; Shafeeque, M.; Dilawar, A.; Basit, I.; Zhang, L.; et al. Spatial Downscaling of GRACE Data Based on XGBoost Model for Improved Understanding of Hydrological Droughts in the Indus Basin Irrigation System (IBIS). Remote Sens. 2023, 15, 873. [Google Scholar] [CrossRef]
  48. Hashmi, H.N.; Siddiqui, Q.T.M.; Ghumman, A.R.; Kamal, M.A.; Mughal, H.U.R. A Critical Analysis of 2010 Floods in Pakistan. Afr. J. Agric. Res. 2012, 7, 1054–1067. [Google Scholar] [CrossRef] [Green Version]
  49. Lutz, A.F.; ter Maat, H.W.; Biemans, H.; Shrestha, A.B.; Wester, P.; Immerzeel, W.W. Selecting Representative Climate Models for Climate Change Impact Studies: An Advanced Envelope-Based Selection Approach. Int. J. Climatol. 2016, 36, 3988–4005. [Google Scholar] [CrossRef] [Green Version]
  50. Latif, Y.; Yaoming, M.; Yaseen, M. Spatial Analysis of Precipitation Time Series over the Upper Indus Basin. Theor. Appl. Climatol. 2018, 131, 761–775. [Google Scholar] [CrossRef] [Green Version]
  51. Saifullah, M.; Liu, S.; Tahir, A.A.; Zaman, M.; Ahmad, S.; Adnan, M.; Chen, D.; Ashraf, M.; Mehmood, A. Development of Threshold Levels and a Climate-Sensitivity Model of the Hydrological Regime of the High-Altitude Catchment of the Western Himalayas, Pakistan. Water 2019, 11, 1454. [Google Scholar] [CrossRef] [Green Version]
  52. Ul Hasson, S.; Böhner, J.; Lucarini, V. Prevailing Climatic Trends and Runoff Response from Hindukush-Karakoram-Himalaya, Upper Indus Basin. Earth Syst. Dyn. 2017, 8, 337–355. [Google Scholar] [CrossRef] [Green Version]
  53. Zaman, M.; Ahmad, I.; Usman, M.; Saifullah, M.; Anjum, M.N.; Khan, M.I.; Qamar, M.U. Event-Based Time Distribution Patterns, Return Levels, and Their Trends of Extreme Precipitation across Indus Basin. Water 2020, 12, 3373. [Google Scholar] [CrossRef]
  54. Arfan, M.; Lund, J.; Hassan, D.; Saleem, M.; Ahmad, A. Assessment of Spatial and Temporal Flow Variability of the Indus River. Resources 2019, 8, 103. [Google Scholar] [CrossRef] [Green Version]
  55. Lutz, A.F.; Immerzeel, W.W.; Kraaijenbrink, P.D.A.; Shrestha, A.B.; Bierkens, M.F.P. Climate Change Impacts on the Upper Indus Hydrology: Sources, Shifts and Extremes. PLoS ONE 2016, 11, e0165630. [Google Scholar] [CrossRef] [Green Version]
  56. Williams, M.W. The Status of Glaciers in the Hindu Kush–Himalayan Region. Mt. Res. Dev. 2013, 33, 114–115. [Google Scholar] [CrossRef]
  57. Bocchiola, D.; Diolaiuti, G. Recent (1980–2009) Evidence of Climate Change in the Upper Karakoram, Pakistan. Theor. Appl. Climatol. 2013, 113, 611–641. [Google Scholar] [CrossRef]
  58. Minora, U.; Bocchiola, D.; D’Agata, C.; Maragno, D.; Mayer, C.; Lambrecht, A.; Mosconi, B.; Vuillermoz, E.; Senese, A.; Compostella, C.; et al. 2001–2010 glacier changes in the Central Karakoram National Park: A contribution to evaluate the magnitude and rate of the “Karakoram anomaly”. Cryosph. Discuss. 2013, 7, 2891–2941. [Google Scholar] [CrossRef]
  59. Qureshi, A.S. Water Management in the Indus Basin in Pakistan: Challenges and Opportunities. Mt. Res. Dev. 2011, 31, 252–260. [Google Scholar] [CrossRef]
  60. Abbas, F.; Ahmad, A.; Khan, S.; Ali, S.; Saleem, F.; Hammad, H.; Farhad, W. Changes in Precipitation Extremes over Arid to Semiarid and Subhumid Punjab, Pakistan. Theor. Appl. Climatol. 2013, 116, 219. [Google Scholar] [CrossRef]
  61. Mann, H.B. Nonparametric Tests Against Trend. Econometrica 1945, 13, 245–259. [Google Scholar] [CrossRef]
  62. Kendall, M.G. Rank Correlation Methods; Griffin: London, UK, 1975; ISBN-10 0852641990, ISBN-13 9780852641996. [Google Scholar]
  63. Tabari, H.; Marofi, S.; Aeini, A.; Talaee, P.H.; Mohammadi, K. Trend Analysis of Reference Evapotranspiration in the Western Half of Iran. Agric. For. Meteorol. 2011, 151, 128–136. [Google Scholar] [CrossRef]
  64. Tabari, H.; Talaee, P.H.; Ezani, A.; Some’e, B.S. Shift Changes and Monotonic Trends in Autocorrelated Temperature Series over Iran. Theor. Appl. Climatol. 2012, 109, 95–108. [Google Scholar] [CrossRef]
  65. Caloiero, T.; Coscarelli, R.; Ferrari, E.; Mancini, M. Trend Detection of Annual and Seasonal Rainfall in Calabria (Southern Italy). Int. J. Climatol. 2011, 31, 44–56. [Google Scholar] [CrossRef]
  66. del Río, S.; Penas, Á.; Fraile, R. Analysis of Recent Climatic Variations in Castile and Leon (Spain). Atmos. Res. 2005, 73, 69–85. [Google Scholar] [CrossRef]
  67. Bhutiyani, M.R.; Kale, V.S.; Pawar, N.J. Long-Term Trends in Maximum, Minimum and Mean Annual Air Temperatures across the Northwestern Himalaya during the Twentieth Century. Clim. Chang. 2007, 85, 159–177. [Google Scholar] [CrossRef]
  68. Hamed, K.H. Trend Detection in Hydrologic Data: The Mann–Kendall Trend Test under the Scaling Hypothesis. J. Hydrol. 2008, 349, 350–363. [Google Scholar] [CrossRef]
  69. Mavromatis, T.; Stathis, D. Response of the Water Balance in Greece to Temperature and Precipitation Trends. Theor. Appl. Climatol. 2011, 104, 13–24. [Google Scholar] [CrossRef]
  70. Yue, S.; Wang, C. The Mann-Kendall Test Modified by Effective Sample Size to Detect Trend in Serially Correlated Hydrological Series. Water Resour. Manag. 2004, 18, 201–218. [Google Scholar] [CrossRef]
  71. Helsel, D.R.; Hirsch, R.M. Statistical Methods in Water Resources; Elsevier: Amsterdam, The Netherlands, 1992; ISBN 9780080875088. [Google Scholar]
  72. Ashraf, M.S.; Ahmad, I.; Khan, N.M.; Zhang, F.; Bilal, A.; Guo, J. Streamflow Variations in Monthly, Seasonal, Annual and Extreme Values Using Mann-Kendall, Spearmen’s Rho and Innovative Trend Analysis. Water Resour. Manag. 2021, 35, 243–261. [Google Scholar] [CrossRef]
  73. Yaseen, M.; Latif, Y.; Waseem, M.; Leta, M.K.; Abbas, S.; Bhatti, H.A. Contemporary Trends in High and Low River Flows in Upper Indus Basin, Pakistan. Water 2022, 14, 337. [Google Scholar] [CrossRef]
  74. Archer, D.R.D.; Fowler, H.J.H. Spatial and Temporal Variations in Precipitation in the Upper Indus Basin, Global Teleconnections and Hydrological Implications. Hydrol. Earth Syst. Sci. 2004, 8, 47–61. [Google Scholar] [CrossRef] [Green Version]
  75. Ahsan, M.; Sattarshakir, A.; Zafar, S.; Nabi, G.; Ahsan, E.M. Assessment of Climate Change and Variability in Temperature, Precipitation and Flows in Upper Indus Basin. Int. J. Sci. Eng. Res. 2016, 7, 1610–1620. [Google Scholar]
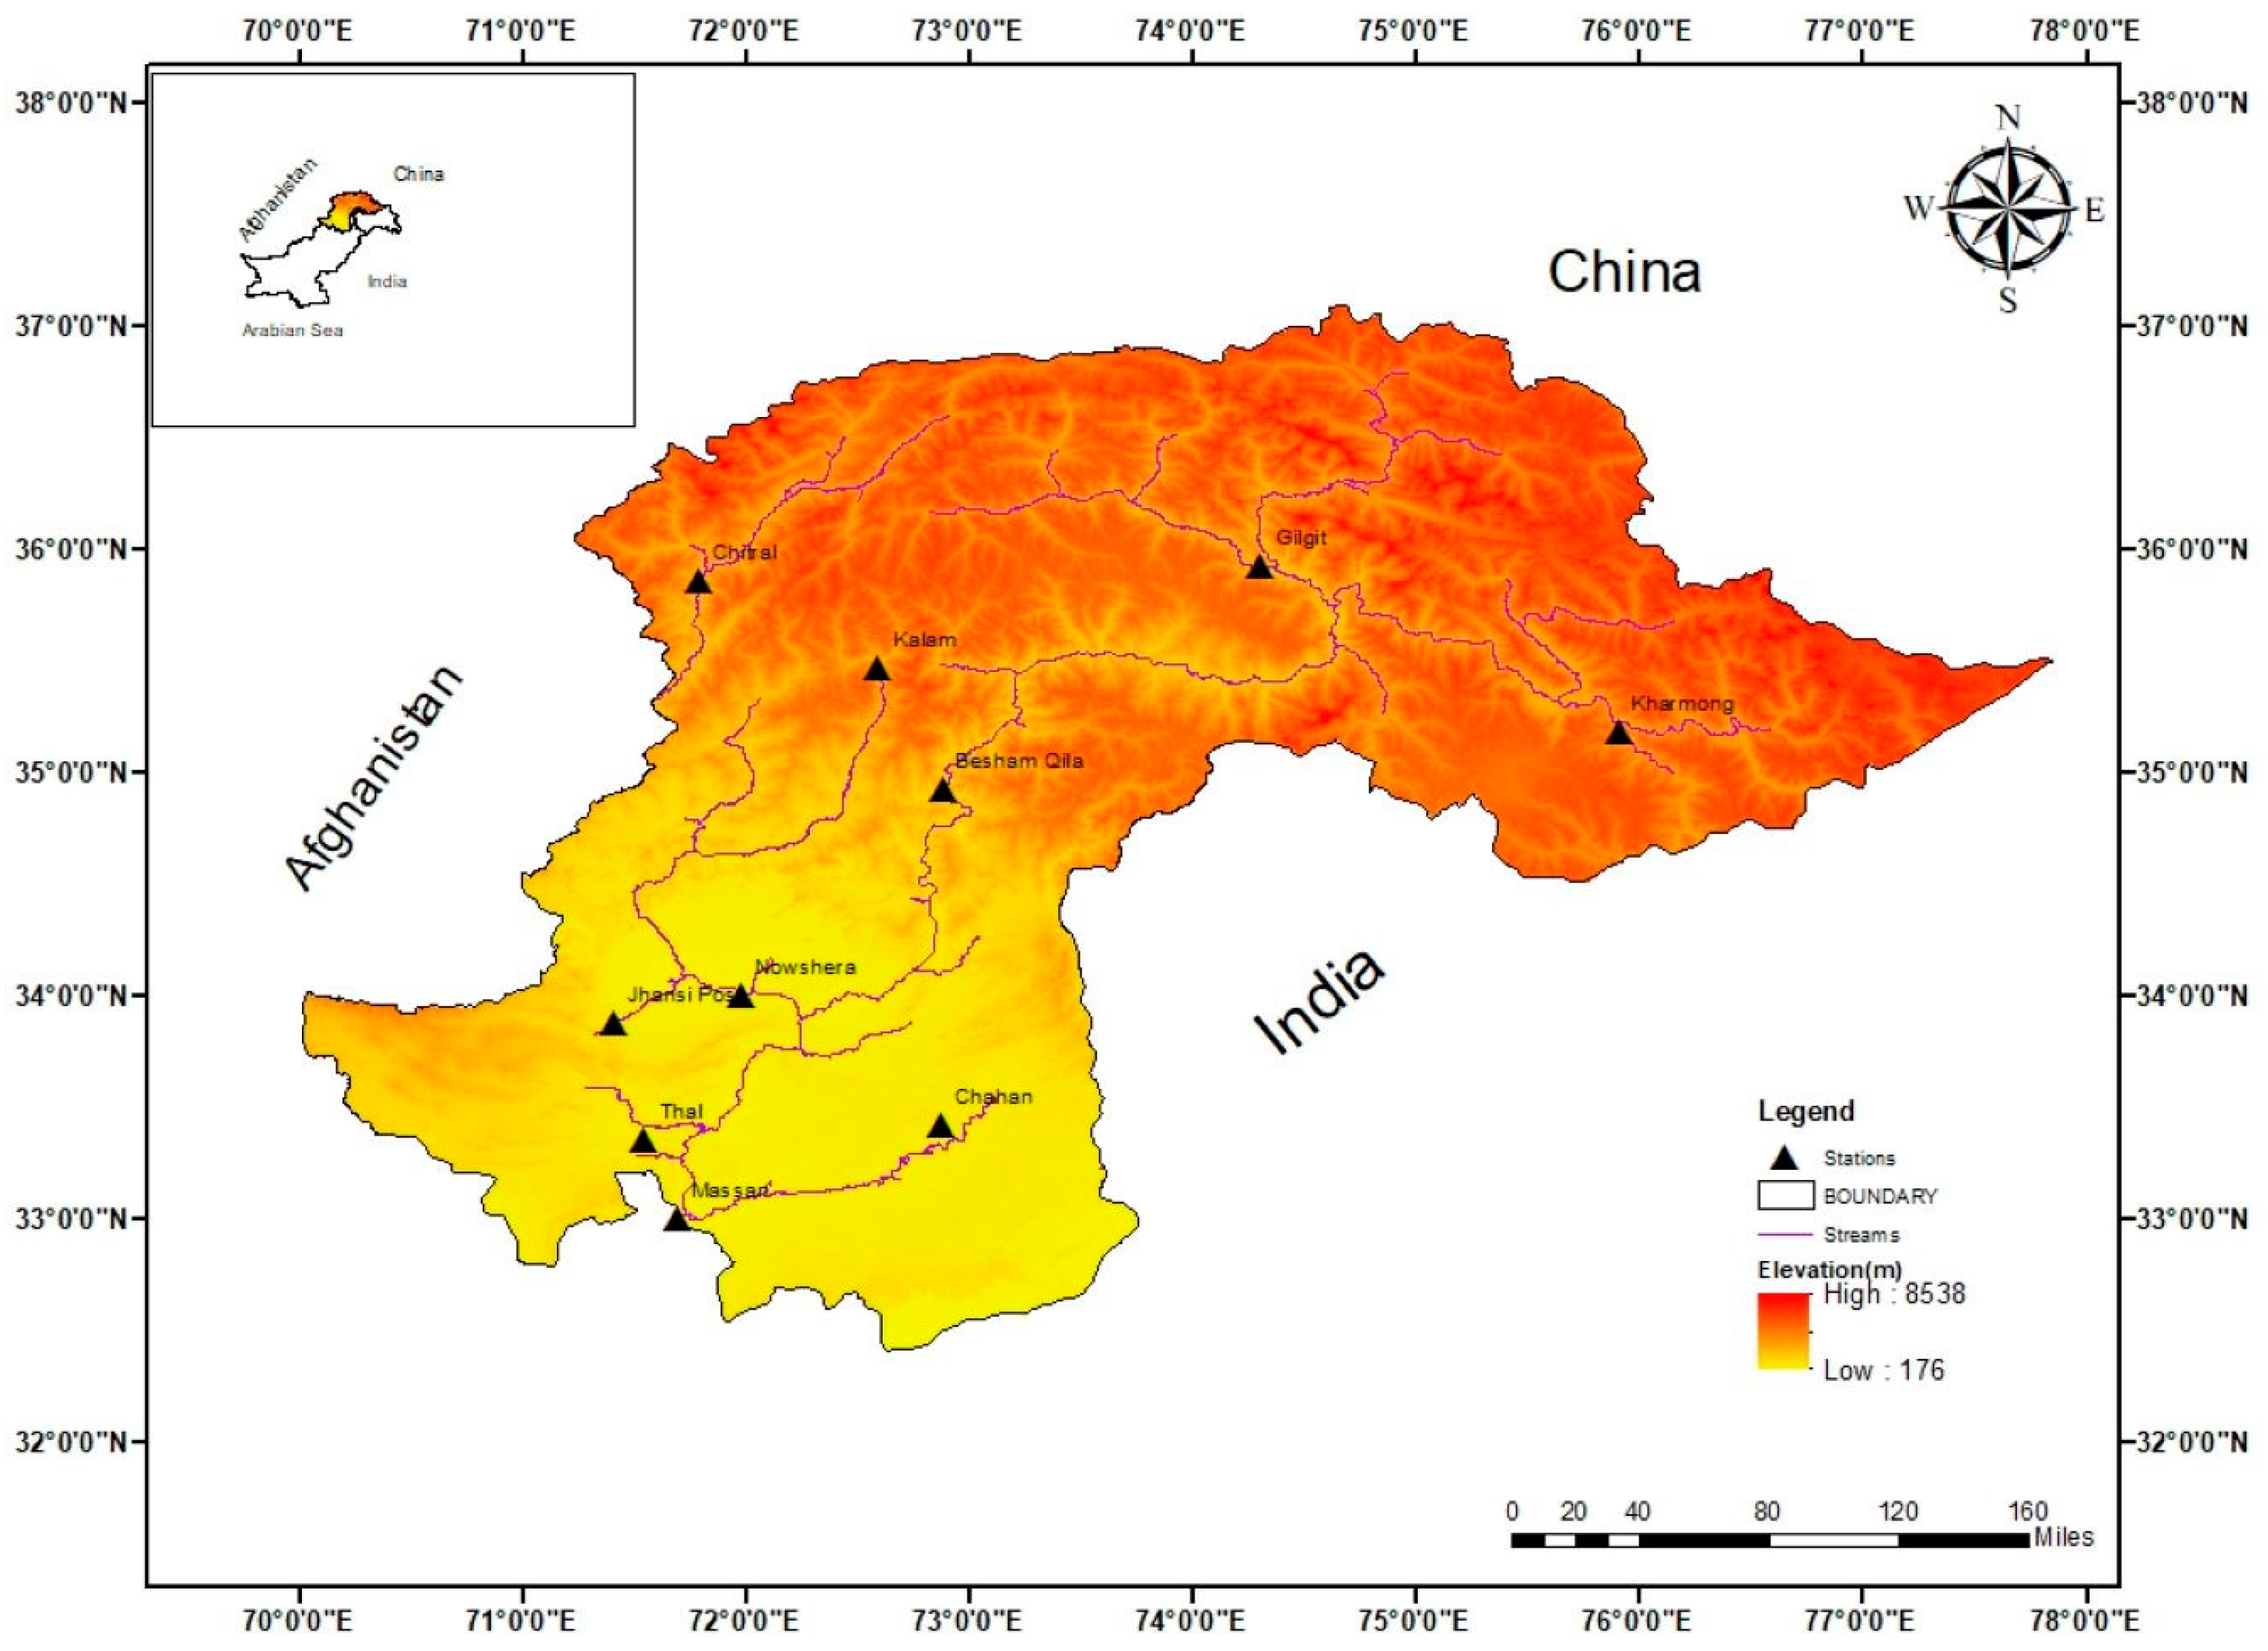
Figure 1. Location map of the study area.
Sustainability 15 09065 g001
Figure 2. The ITA methodology’s representation of areas with an upward, downward, or no trend.
Sustainability 15 09065 g002
Figure 3. The improved innovative trend analysis (IITA) method is depicted in this image. The data line is represented by the dashed line, blue dots represents data points and the no-trend (1:1) line is represented by the solid line. The mean central points of the medium, high, and low categories are represented by the orange, red, and yellow points, respectively.
Sustainability 15 09065 g003
Figure 4. Şen’s ITA method results for the Kharmong station are represented graphically over the UIRB on a monthly scale.
Sustainability 15 09065 g004
Figure 5. Şen’s ITA method results for the Massan station are represented graphically over the UIRB on a monthly scale.
Sustainability 15 09065 g005
Figure 6. Şen’s IITA method results for the Kharmong station are represented graphically over the UIRB on a monthly scale.
Sustainability 15 09065 g006
Figure 7. Şen’s IITA method results for the Massan station are represented graphically over the UIRB on a monthly scale.
Sustainability 15 09065 g007
Figure 8. Trend results for monthly timeseries comparing the ITA, MK, and IITA methods.
Sustainability 15 09065 g008
Table 1. Characterization of hydrological drought based on the SDI value.
SDI Value≤2.001.50–1.991.0–1.490.00–−0.99−1.00–−1.49−1.50–−1.99≤−2.00
CategoryExtremely WetSeverely WetModerate WetMild DroughtModerate DroughtSevere DroughtExtreme Drought
Table 2. The statistical features of the chosen stations are summarized, together with the daily streamflow average.
Sr. No.StationLatitude (Degree)Longitude (Degree)Elevation
(m)
Mean
(m3/s)
SDCsCkCv
1Kharmong35.275.92474461.1482.91.4871.5791.047
2Gilgit35.974.32126277.2287.11.4891.3081.036
3Kalam35.572.6206787.096.32.12917.4241.107
4Chitral35.971.81566276.8279.51.4861.2851.010
5Besham Qila34.972.97532419.82672.41.4661.3581.104
6Jhansi Post33.971.45315.810.011.559312.3991.714
7Chahan33.472.94531.58.925.4061046.4725.838
8Thal33.471.542724.725.67.284113.4451.036
9Nowshera34.072.0294842.9766.41.5873.5920.909
10Massan33.071.72183741.53056.21.7894.2860.817
Table 3. Daily streamflow homogeneity test results.
StationLength of Data
Years
Pettitt’s Test
Xk
Cum. Deviation Test
Q n
BR Test
R n
SNHT
To
Results
Kharmong351201.121.584.97Useful
Gilgit523001.241.497.86Useful
Besham Qila471100.590.741.58Useful
Kalam522110.861.093.32Useful
Chitral522921.231.237.07Useful
Jhansi Post523081.341.3415.86 **Useful
Nowshera521860.921.267.08Useful
Thal47304 **1.391.727.68Useful
Chahan522201.241.399.15Useful
Massan441820.971.373.95Useful
** significant at the 5% significance level.
Table 4. Results for hydrological drought measures at a monthly scale using the ITA, MK, and IITA methods.
MonthTestKharmongGilgitBesham QilaKalamChitralJhansi PostNowsheraThalChahanMassan
JanuaryB0.000.00−0.090.000.300.320.500.00−0.90−0.90
Z−2.54−3.771.140.00−1.010.940.002.430.550.55
S−0.08−0.140.040.010.010.060.000.15−0.02−0.02
FebruaryB−0.18−0.420.020.00−0.420.41−0.090.580.270.27
Z−2.560.422.63−1.980.42−0.10−1.071.460.550.55
S−0.070.000.08−0.050.000.05−0.020.070.010.01
MarchB0.060.002.430.150.000.000.00−2.200.000.00
Z−3.281.142.02−1.461.14−0.42−0.52−0.260.550.55
S−0.060.020.03−0.070.020.01−0.01−0.020.040.04
AprilB−0.69−0.693.325.60−0.020.07−0.05−0.75−0.095.60
Z−1.98−1.982.74−0.94−2.73−2.401.59−1.010.78−0.94
S−0.06−0.060.050.01−0.12−0.160.08−0.030.070.01
MayB−1.90−0.023.26−5.81−0.020.020.50−0.06−0.76−0.76
Z−1.04−2.473.15−1.95−2.47−3.930.000.880.710.71
S−0.03−0.090.06−0.08−0.09−0.180.000.040.010.01
JuneB5.56−0.021.52−0.49−0.020.010.360.87−0.10−0.10
Z−0.29−2.561.46−1.72−2.56−3.99−0.260.260.160.16
S0.01−0.100.07−0.09−0.10−0.150.020.030.060.06
JulyB0.47−0.93−0.95−4.40−0.93−4.40−0.35−1.440.030.03
Z0.45−2.170.29−0.03−2.17−0.03−0.13−0.780.550.16
S0.05−0.050.00−0.03−0.05−0.030.01−0.020.060.06
AugustB2.05−1.220.38−1.22−1.220.05−0.34−1.830.100.10
Z−0.75−2.01−0.26−2.01−2.01−3.15−0.78−1.46−0.19−0.19
S0.02−0.07−0.03−0.07−0.07−0.150.02−0.04−0.04−0.04
SeptemberB1.76−0.271.761.10−0.270.090.28−0.75−0.06−0.06
Z0.13−1.270.13−1.27−1.27−2.300.29−1.520.320.32
S−0.03−0.06−0.03−0.02−0.06−0.110.06−0.050.030.03
OctoberB0.33−0.191.85−0.68−0.190.090.04−1.430.110.11
Z−0.78−0.91−1.33−0.42−0.91−2.960.78−0.91−0.29−0.29
S0.00−0.05−0.04−0.01−0.05−0.120.040.000.040.04
NovemberB−0.02−1.101.16−0.50−1.10−0.500.04−0.960.080.08
Z−2.53−0.681.10−0.58−0.68−0.58−0.030.75−0.03−0.03
S−0.11−0.020.00−0.01−0.02−0.010.050.050.070.07
DecemberB−0.982.73−2.95−1.562.73−0.060.50−1.070.08−0.06
Z−2.53−0.681.43−0.23−0.68−2.240.00−0.03−0.030.36
S−0.090.030.01−0.060.03−0.070.000.030.070.03
Disclaimer/Publisher’s Note: The statements, opinions and data contained in all publications are solely those of the individual author(s) and contributor(s) and not of MDPI and/or the editor(s). MDPI and/or the editor(s) disclaim responsibility for any injury to people or property resulting from any ideas, methods, instructions or products referred to in the content.