Article

Assessment and Factor Diagnosis of Water Resource Vulnerability in Arid Inland River Basin: A Case Study of Shule River Basin, China

1
College of Water Conservancy and Hydropower Engineering, Gansu Agricultural University, Lanzhou 730070, China
2
CAS-Key Laboratory of Agricultural Water Resources, Hebei-Key Laboratory of Water Saving Agriculture, Center for Agricultural Resources Research, Institute of Genetics and Developmental Biology, Chinese Academy of Sciences, Shijiazhuang 050022, China
*
Author to whom correspondence should be addressed.
Sustainability 2023, 15(11), 9052; https://doi.org/10.3390/su15119052
Submission received: 28 April 2023 / Revised: 30 May 2023 / Accepted: 31 May 2023 / Published: 3 June 2023

Abstract

:
Water resources in arid and semi-arid inland regions are highly vulnerable, facing threats from global climate change and human activities. Ensuring water resource sustainability requires scientifically evaluating the vulnerability of water resources and its driving factors. Taking the Shule River Basin, an inland river in northwest China, as an example, this study established an assessment system considering 16 influencing factors based on three aspects, including natural vulnerability, anthropogenic vulnerability, and carrying capacity vulnerability. The mature-element fuzzy model based on comprehensive weight and the Delphi method were used to evaluate the water resource vulnerability of the basin from 2005 to 2021. The results were as follows: (1) The water resource vulnerability in the Shule River Basin was between severe and moderate from 2005 to 2021, with a trend towards severe vulnerability. (2) The barrier analysis at the index level shows that factors of natural vulnerability had a low impact on water resource vulnerability in the basin from 2005 to 2019 but exerted a greater impact in 2020–2021, an impact that was far higher than that caused by factors of man-made vulnerability and water resource vulnerability. The impact of factors of anthropogenic vulnerability on water resource vulnerability was relatively low in the entire study period, except in 2016, 2017, 2020, and 2021. In 2005–2010, the factors of bearing capacity vulnerability had a great impact on water resource vulnerability, but in 2011–2021, the impact was alleviated and was gradually reduced. (3) Among the 16 factors affecting water resource vulnerability, the obstacle degree was higher than 6.5% for the following factors: the ratio of irrigation water use on farmland, the annual precipitation, total water resources, the annual quantity of wastewater effluent, the urbanization rate, the surface water control rate, and the degree of groundwater resource amount, exploration, and utilization obstacle values.

1. Introduction

Water is a basic natural resource and a strategic economic resource, and it plays a key role in maintaining global ecosystems and supporting socioeconomic sustainable development [1]. In recent years, global climate change and strong human activities surging water use have exerted a major impact on the quantity, quality, and distribution of water resources, thus inducing many water problems such as water shortages, water pollution, and water ecological degradation. Discussing the increase in water use, Cacal and Taboada state, “it’s more important than ever to find solutions to settle disputes and trade-offs” [2].The vulnerability of water resources is an important metric for measuring water security. Hence, an accurate assessment of water resource vulnerability is essential to ensure the development of a human–nature coupled system and to achieve efficient uses of water resources. In particular, this concept and its guidance is most important in inland river basins of arid and semi-arid regions where water security problems are more conspicuous in China [3,4].
In the early 1960s, two French researchers, Albinet and Marget, evaluated water resource vulnerability from the perspective of groundwater [5]. Subsequently, some studies on water resource vulnerability were expanded to multiple regional scales, and the research focus gradually shifted to the vulnerability of regional water systems. In the process of deepening and expanding relevant research, there had been some differences in the understanding, interpretation, and evaluation methods of the concept of water resource vulnerability. For instance, Vörösmarty et al. (2000) pointed out that water resource vulnerability is caused by the structure, quantity, and quality of water resources under the influences of climate change, such as frequent flood and drought events, and human activities, which pose challenges in water management and supply and demand [6]. Anandhi et al. (2017) considered that vulnerability is a characteristic of water resource systems, which indicates that water systems are difficult to restore to the original state after being threatened by human activities and natural disasters [7]. Xia et al. (2018) held the point that water resource vulnerability is defined as the degree of the water systems damaged by climate change, which is an indication of the sensitivity and stress resistance of water resources impacted by factors such as climate change [8]. Perveen and James (2011) offered their own definition for the the concept of water resource vulnerability, which was defined as the regional vulnerability limited by water availability [9]. The evaluation methods of water resource vulnerability mainly consist of qualitative and quantitative evaluation. Based on changes in objective data by climate type, socioeconomic factors, and ecological environments, qualitative evaluations have focused on subjectively analyzing main factors affecting water resource vulnerability and providing suggestions for solutions [9,10,11]. Quantitative evaluations include three categories: functions, indicators, and model-based approaches. The function category approaches water resource vulnerability via the water vulnerability degree function, which is established by the experiential knowledge of the relationship between the vulnerability, sensitivity, and pressure resistance of water [12,13,14]. The indicator approach establishes a water resource vulnerability evaluation system based on indicators and comprehensive indexes, such as the fuzzy set-pair method and the entropy weight method [15,16,17]. Lastly, the model-based approach utilizes input vectors in a specific mathematical assessment model of water resource vulnerability and uses output vectors from machine learning to evaluate water resource vulnerability [18,19,20].
Arid areas are the most sensitive and vulnerable areas in the world to climate change, accounting for 41% of global land area where climate conditions are characterized by low precipitation and high evapotranspiration capacity [21]. One-third of China is located in arid environments, mainly in Xinjiang, Gansu, Ningxia, Qinghai, and Inner Mongolia. However, average surface water resources and groundwater resources in these areas account for only 3.3% and 5.5% of the country’s total resources, and the runoff within inland river basins relies heavily on precipitation and snowmelt recharge [22,23]. These factors seriously threaten water resource systems. In the past century, global climate change has led to changes in ice, snow, and other hydrological elements within the hydrological cycle, resulting in the retreat of glaciers, increases in runoff, and extreme hydrological variation. Simultaneously, human activities have further exacerbated the uncertainty and vulnerability of water resource systems in the inland river basins of arid zones [24,25,26]. In inland river basins, predictably, water security, ecological security, and social development will face serious challenges.
Studies on water resources in the inland basins of arid zones have extensively been conducted and have produced plenty of research results, in which the conflict between water resource supply and demand [27], the evaluation of water resource bearing capacity [28], the allocation of water resources [29], variations in water price [30], and analyses of water resource utilization [31] have attracted much attention. However, previously established evaluation systems still require some quantitative results for water resource vulnerability assessments. Therefore, taking the practical characteristics and statistical information of inland river basins into consideration, this study established a quantifiable evaluation system of water resource vulnerability. Based on the matter-element model and the Delphi method, in combination with the cloud model and the obstacle degree model for factorial diagnosis, the water resource vulnerability of the Shule River Basin (SLRB) from 2005 to 2021 was evaluated. The results are intended to provide a decision-making basis for the benign transformation of water resource vulnerability in the SLRB, the efficient exploitation and management of water resources, and the sustainable and healthy development of the basin in order to achieve the sustainable and effective use of water resources for social development. Moreover, this study can provide methods and ideas for water resource vulnerability evaluation studies in similar basins.

2. Materials and Methods

2.1. Data Sources

Detailed data of each factor under the natural vulnerability, anthropogenic vulnerability, and bearing capacity vulnerability were obtained from “Gansu Province Water Resources Bulletin”, “Gansu Province Statistical Yearbook”, “Gansu Province Water Development Statistical Bulletin”, and the consultation of relevant scholars and experts who study the SLRB. Data of Figure 1 were obtained from National Cryosphere Desert Data Center (http://www.ncdc.ac.cn accessed on 30 May 2023) [32].

2.2. Methods

2.2.1. Calculation Method of Index Weight

(1) Analytic Hierarchy Process (AHP) method is a kind of systematic, flexible, concise, and subjective statistical tool. In the same hierarchy, each index is pairwise compared and assigned a value according to the degree of importance. Subsequently, a judgment matrix is established based on the assigned values, and then the max-characteristic value of the judgement matrix and the corresponding characteristic vector are calculated. After passing the consistency test, the subjective weights of each factor are calculated.
The weights calculated by the AHP method are denoted as wa.
There are many studies on weight calculation using the AHP method, which will not be repeated in this paper (for details, see Wijitkosum and Saowanee, 2015) [33].
(2) The entropy method can profoundly reflect the utility value of the entropy of each factor’s information and can effectively solve the problem of overlapping information between multiple index variables. The utility value of each impact factor information can be used to calculate the objective weight wb of each impact factor [34]. The calculation steps are as follows:
(a) Build the data matrix: A = (xij)mn, where xij is the value of the jth indicator of the ith sample.
(b) Conduct the normalization processing of indicators:
Positive   indicator                       x i j = ( x i , max x i j ) / ( x i , max x i , min )
Negative   indicator                       x i j = ( x i j x i , min ) / ( x i , max x i , min )
where xij is the normalized index value.
In order to avoid the invalidity caused by part of the data being equal to zero after processing, the result is finally translated by 0.001 overall.
(c) Calculate the information entropy Ej of the jth index:
E j = 1 ln n j = 1 n x i j ln x i j
(d) Calculate the weight wb of the jth index:
w b = 1 E j n j = 1 n E j
(3) The comprehensive weighting method based on game theory is an empowerment method that seeks consistency or compromise between a variety of weight sets and the most satisfactory weights so that the bias between the two is minimized [35] and the advantages and characteristics of each type of weight can be retained to the greatest extent. This not only retains the mathematical significance of objective data but also reflects the subjective will of the evaluator and realizes the organic unity of subjective and objective weights. The calculation steps are as follows:
(a) Now, suppose that any linear combination of L weight vectors is
W = K = 1 L α K W K T , K = 1 L
where W is based on a weight in the set of L weights; αK is the empowerment coefficient; W K T is a vector of L weights.
(b) Solve for the empowerment coefficient:
min K = 1 L α K W K T W i , i = 1 L , K = 1 L
where Wi is the L weights obtained by the L weight calculation method.
(c) Equation (3) is used to normalize αK to obtain the comprehensive weighting coefficient αS. Substitute αS into Equation (4) to obtain the comprehensive empowerment result. Comprehensive weight is denoted as WS.
α S = α Κ Κ = 1 L α Κ , Κ = 1 L
W S = K = 1 L α S W K T , K = 1 L

2.2.2. Matter-Element Model

The fuzzy matter-element model can study the transformation law and solution of incompatibility problems. The main idea is to describe anything with the three elements of “things, characteristics, and quantity value”, and the basic element of the ordered triplet composed of these elements is called the matter element, which is suitable for multi-index evaluation problems. The specific calculation steps are as follows:
(1) Composite fuzzy matter-element matrix
If there are n different periods in the study area and m evaluation indicators in each period, the composite fuzzy matter-element model Zmn is constructed as follows:
Z m n = ( T 1 T 2 T n C 1 X 11 X 12 X 1 n C 2 X 21 X 22 X 2 n C m X m 1 X m 2 X m n )
where Tj (j = 1, 2, …, n) is the jth evaluation period, Ci (i = 1, 2, …, m) is the evaluation feature, and Xij is the fuzzy quantity value of the ith evaluation feature of the period.
(2) Standard fuzzy matter-element matrix
The extremum method is used to standardize the impact factors of different attributes to construct a standardized fuzzy matter element Z m n . X i j is the standardized impact factor; its calculation process is shown as Formulas (1) and (2).
(3) Difference-squared composite fuzzy matter element
With Δij = (Zon Z m n )2 (i = 1, …, m; j = 1,…, n), we establish the difference-squared composite fuzzy matter element ZΔ composed of Δij. Where Zon is the maximum or minimum value in the standard fuzzy matter-element matrix.
(4) Euclid approach degree
The Euclid approach degree Nj is used as the water resource vulnerability assessment result, and the calculation formula is
N j = 1 i = 1 m W S Δ i j
where Ws is comprehensive weight.

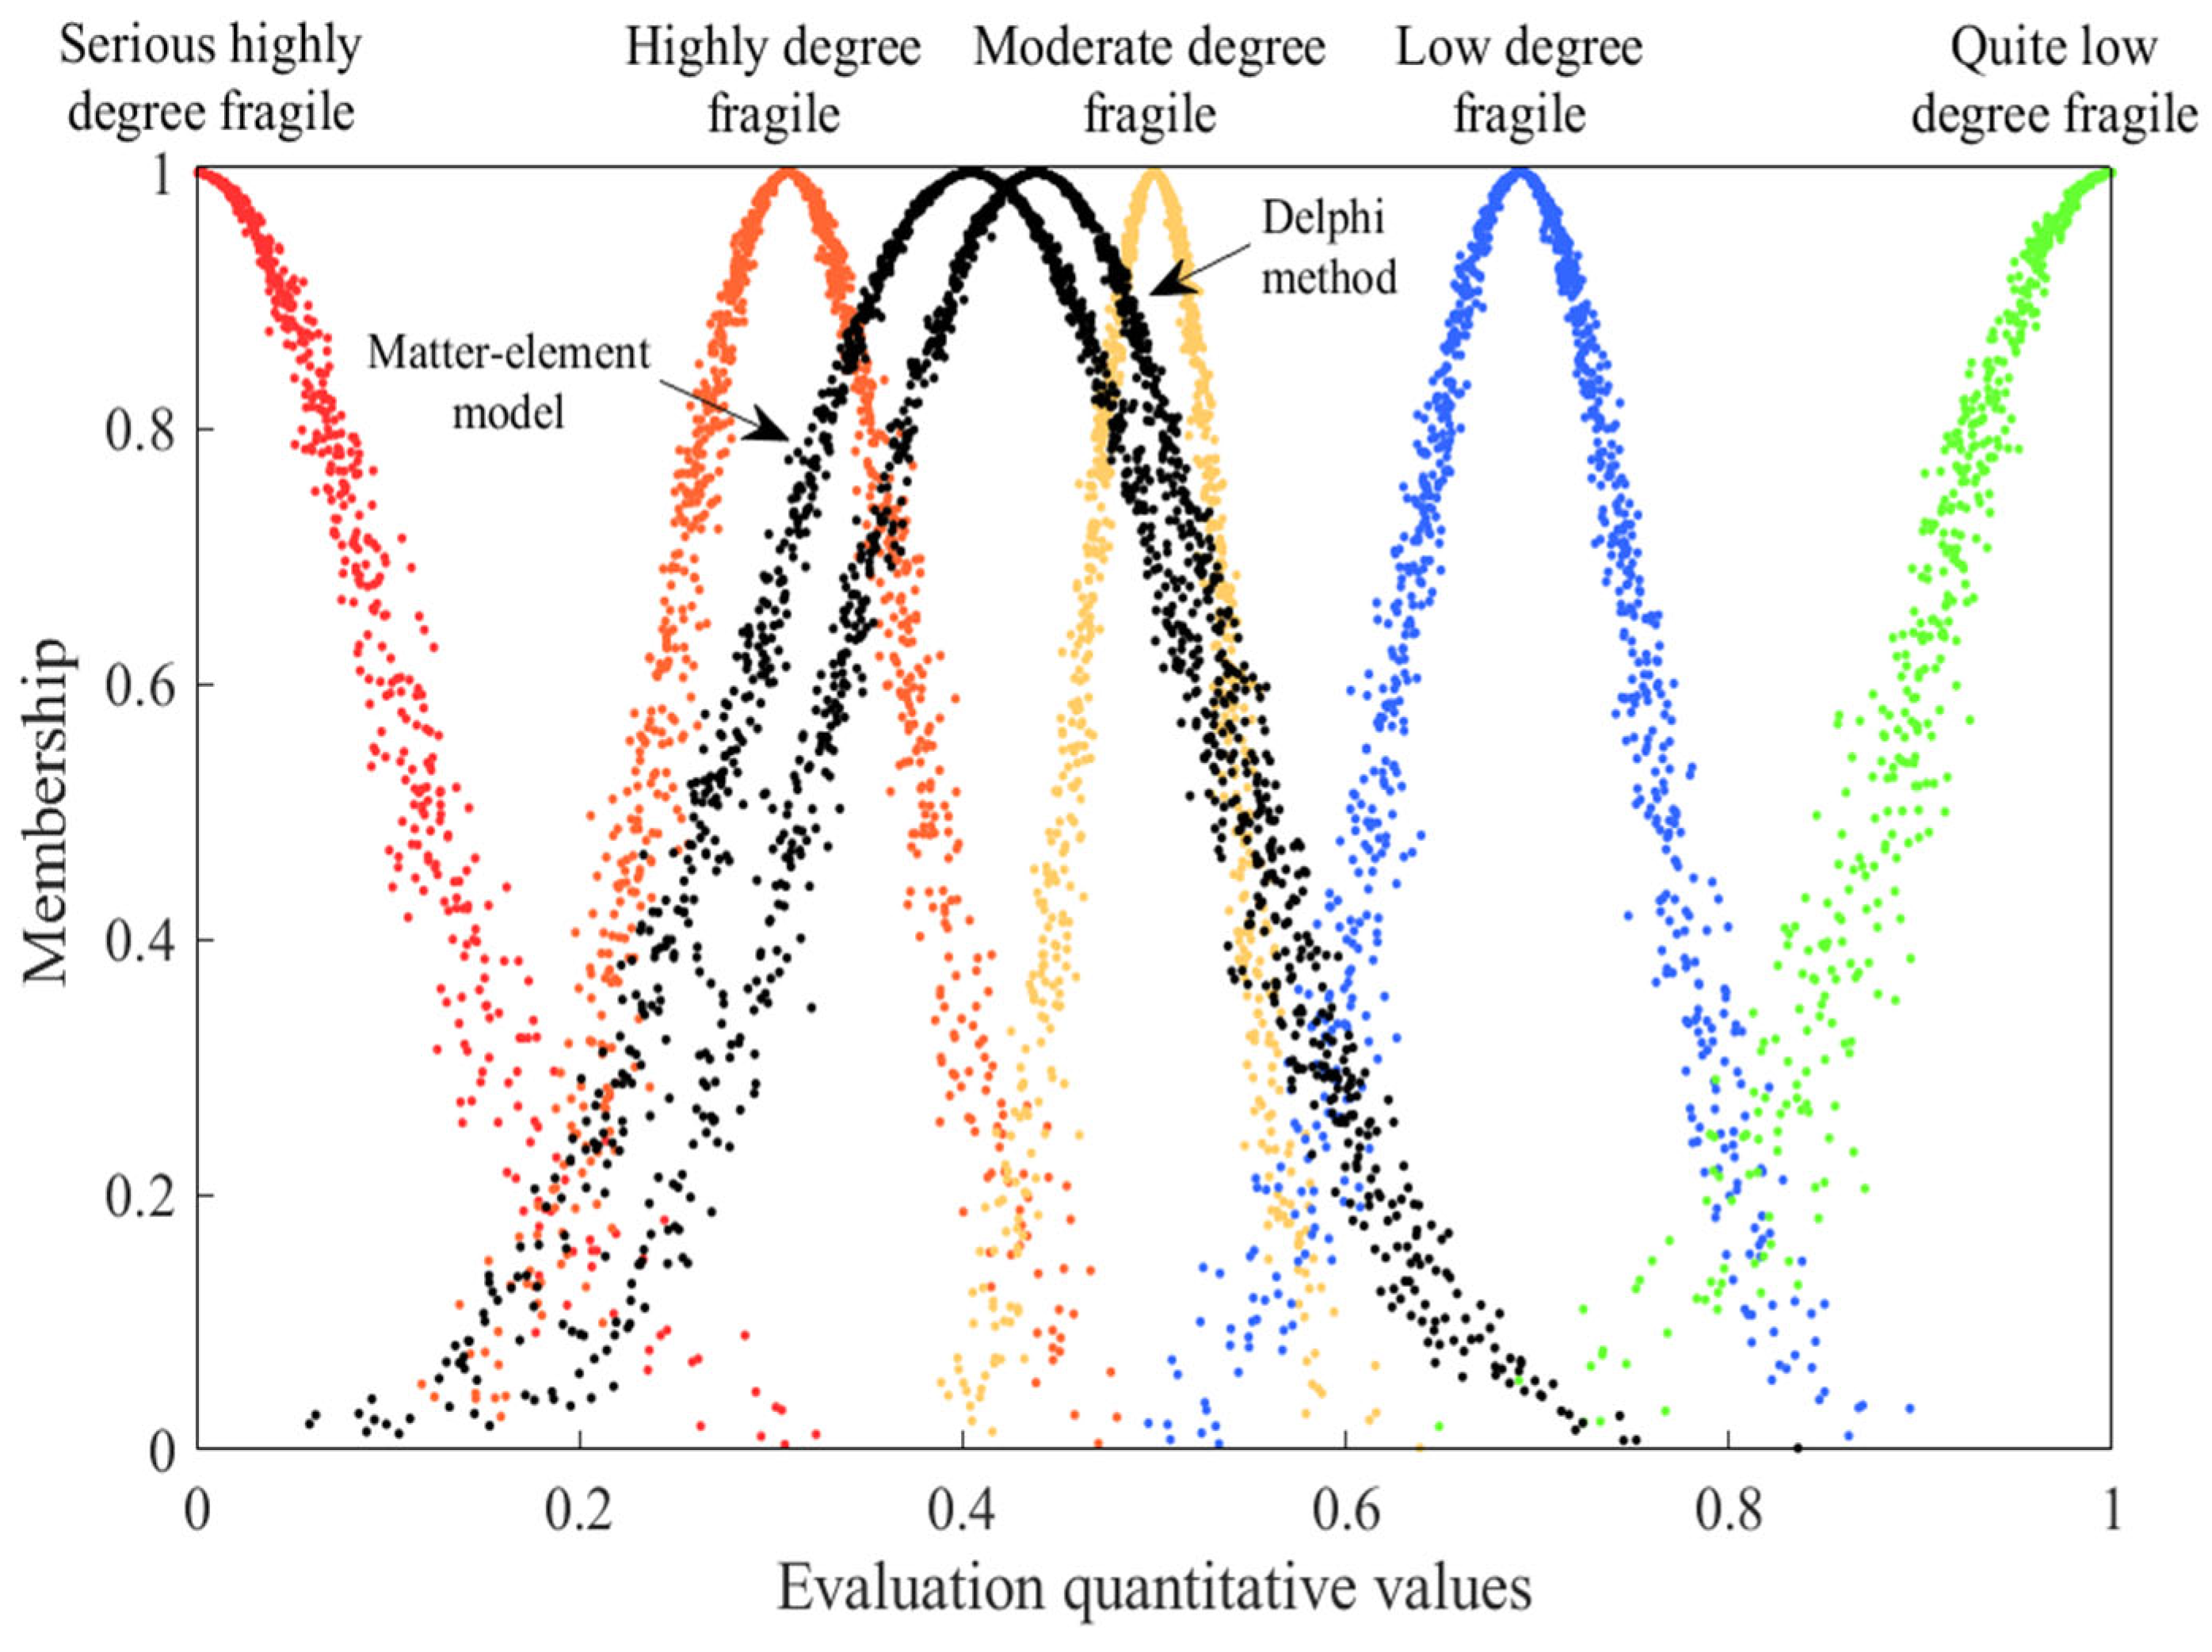
2.2.3. Delphi Method Evaluation

The Delphi method is a feedback anonymous correspondence method [36]. First, experts will provide opinions on the issues to be evaluated, and these opinions are collected, organized, summarized, and counted into the results. Then, the results are fed back anonymously to each expert, and they are asked for their opinions. Finally, the above process is repeated until a relatively stable opinion is obtained as the final evaluation result. The use of anonymous methods can effectively eliminate the mutual interference between experts by repeated consultation and anonymous communication, which can fully exert the wisdom of experts, and obtain an evaluation result that can reflect the will of the group (Figure 2). The 50 experts were consulted for ensuring the authoritativeness and the reliability of the evaluation system, and the coordination degree of their opinions was measured by the coefficient of variation method. The coefficient of variation is calculated as follows:
C v = S D M e a n
where SD is the sample standard deviation and Mean is the sample mean.

2.2.4. Cloud Model

The cloud model integrates the ambiguity of qualitative concepts and the randomness of membership functions to achieve a more objective evaluation [37]. It uses expectation Ex, entropy En, and hyper entropy He to deal with the uncertainty problem between qualitative concepts and quantitative descriptions. Among them, Ex is the cloud characteristic value with the highest probability of occurrence; En is the data threshold boundary, which is the margin of uncertainty, reflecting the fuzzy cloud model evaluation. He is an experiential constant, and higher values represent greater randomness in the system.
The quantization of a qualitative concept can be generated by a forward cloud generator, and the calculation steps are as follows:
(1) The random number Eni = NORM (En, He2) follows a probability distribution where En is the mean and He2 is the square difference.
(2) The random number xi = NORM (Ex, Eni2) follows a probability distribution where Ex is the mean and En2 is the variance.
(3) Calculate the ui:
u i = e ( x i E x 2 ) 2 2 E n i 2
(4) An element xi with certainty degree ui becomes a cloud drop in U.
(5) Repeat steps (1) to (4) until N drops of cloud are generated.
The principle of cloud forward generator is shown in Figure 2.
By calculating the digital features (Ex, En, and He) of the matter-element model evaluation value and the Delphi method evaluation value and inputting them into the forward cloud generator, a certain number of cloud droplets are generated and, finally, a visual cloud of the appraisal value is formed. The cloud reflects the distribution of water vulnerability assessment values in different grades. It can transform the absoluteness of the evaluation values of various methods into probabilistic problems, which is more scientific and reasonably in line with reality, taking into account the ambiguity of the concept of water vulnerability and the absoluteness of the evaluation value. In this paper, a set of numeric digital features includes 1000 cloud droplets.

2.2.5. Obstacle Degree Model

The obstacle degree model is used for identifying the obstacle factors of water security. This model can effectively identify the main factors affecting water resource vulnerability. The calculation steps are as follows:
(1) Fi is the contribution of the index i:
F i = W I W S
WI is the weight of the index layer to which the impact factor belongs. WS is the comprehensive weight of the influencing factors.
(2) Deviation degree Ii:
I i = I X i j
I is the optimal deviation index.
(3) The obstacle degree Pi for each evaluation indicator:
P i = F i I i i = 1 m F i I i

3. Case Study

3.1. Overview of the Study Area

The SLRB is located in Gansu, China and has an area of 130,115 km2. It is bordered by the Mazong Mountains to the north, the Qilian Mountains to the south, the Badan Jilin Desert to the east, and the Kumutage Desert to the west. The basin has a total number of 477.6 thousand people and a gross domestic product of CNY 45.229 billion. The SLRB has many tributaries; among them is the Dang River, the Yulin River, and the Shiyou River. The headwater of the Shule River is located in the Qilian Mountains, and the moisture sources mainly come from glacial meltwater and precipitation (Figure 3). As a typical inland river basin of the arid zones, the SLRB is one of the most sensitive areas to global climate change and human activities. The average annual precipitation in the basin only ranges from 47 mm to 63 mm, while the annual evaporation requirement is as high as 3000 mm. On this basis, surface water resources are severely deficient in the basin, and ecological and human water demands heavily depend on groundwater. In recent years, the expansion of human activities has caused a series of groundwater overdraft and water pollution problems, and the construction of water transfer and storage projects has changed water supply conditions. These causes play an important role in regional water resource vulnerability by affecting the hydrological cycle. Taking the SLRB as an example, this study proposes the concept of water resource vulnerability for inland river basins in arid zones.

3.2. Evaluation System of Water Resource Vulnerability in Inland River Basins of Arid Zones

Based on the field investigation and consultations with experts, as well as the water resource vulnerability evaluations conducted in previous literature, we established an evaluation system with 30 factors affecting water resource vulnerability in inland river basins. Taking into consideration climatic characteristics, physical geography, and human social development, the natural fragility, anthropogenic fragility, and bearing capacity fragility were identified as the indicator layers of the evaluation system. We initially tested the indicators in the SLRB by correlation analysis and expert consultation, and 14 indicators that reflected a high rate of content repetition were deleted. Then, the indicator system was tested again. The results showed that the evaluation results of 30 indicators were similar to those of the 16 impact factors (Table 1). The above indicated that the structure of the filtered evaluation system was more streamlined than before, and the selected indicators are representative and easily traceable.
The established evaluation system of water resource vulnerability for inland river basins in arid zones is shown in Table 2. Among them, the natural vulnerability is determined by the water resource availability, which is influenced by regional climate, geographical location, and geological conditions. Natural vulnerability includes annual precipitation, total water resources, the water yield modulus, and the amount of groundwater resources. Anthropogenic vulnerability is caused by unnatural forces (mainly human activities) that change the natural distribution and circulation of water resources, including factors such as the water supply modulus; the degree of surface water resource amount, exploration, and utilization; the degree of groundwater resource amount, exploration, and utilization; the surface water control rate; the available water per capita; and the ecological and environmental water use ratio. Bearing capacity vulnerability is defined as the vulnerability of a water resource system caused by its support of water needs within agriculture, industry, and urbanization in the processes of economic and social development. Its factors include the tillable land effective irrigation ratio; the domestic water ratio; the ratio of irrigation water on farmland; the annual quantity of wastewater effluent; the water use amount per capita GDP; and the urbanization rate. More positive indicator values have a more positive effect on water resource vulnerability, and negative indicator values have a more negative effect on water resource vulnerability.

4. Results and Discussion

4.1. Results

4.1.1. Evaluation of the Value of the Grading Standard

The evaluation grade represented the vulnerability degree of the water resources. According to the classification of other vulnerability problems, the SLRB is classified according to the golden cut method. See Table 3 for comments on the digital characteristics and fragile states of the cloud model corresponding to the water resource vulnerability evaluation level and Figure 4 for the cloud diagram of the standard level.

4.1.2. Results of Weight Calculation

The subjective weights wa and objective weights wb of the influencing factors were identified by the AHP method and entropy method, respectively. Meanwhile, the empowerment factors αs derived from game theory were 0.517 and 0.483, respectively. In Table 4, the ranking of the subjective and objective weights of each index factor is not consistent. Among all the influencing factors, the subjective weight of C2 (total water resources) is the largest, while the subjective weights of C6 (the degree of surface water resource amount, exploration, and utilization) and C15 (water consumption per capita GDP) are the smallest when using AHP. When the entropy weight method is used to determine the objective weight, the objective weight of C15 (water use amount per capita GDP) is the largest, and the objective weight of C1 (annual precipitation) is the smallest. For the organic integration of subjective and objective weights, the comprehensive weight based on game theory shows that the comprehensive weight of C2 (total water resources) is 0.115, accounting for the largest proportion, and the comprehensive weight of C6 (the degree of surface water resource amount, exploration, and utilization) is the smallest, at only 0.028.

4.1.3. Assessment of Water Resource Vulnerability

The status of water resource vulnerability is generally at the rank of moderate fragility and high fragility during 2005–2021 in the SLRB (Table 5). Combining the fuzzy processing of the cloud model with Figure 4, the evaluation results of the matter-element model also show that the water resource vulnerability status of the SLRB is between moderate vulnerability and severe vulnerability. The results of the Delphi method show that the coefficient of variation is lower than 15% and at the range of 10.4–14.6%, indicating that the consultation results are reliable. Meanwhile, the evaluation results of the Delphi method were highly consistent with those of the matter-element model, while the two clouds overlap under the evaluation results (Figure 5). The above results proved that the status of water resource vulnerability in the SLRB was between moderate fragility and high fragility during 2005–2021, tending to high fragility.

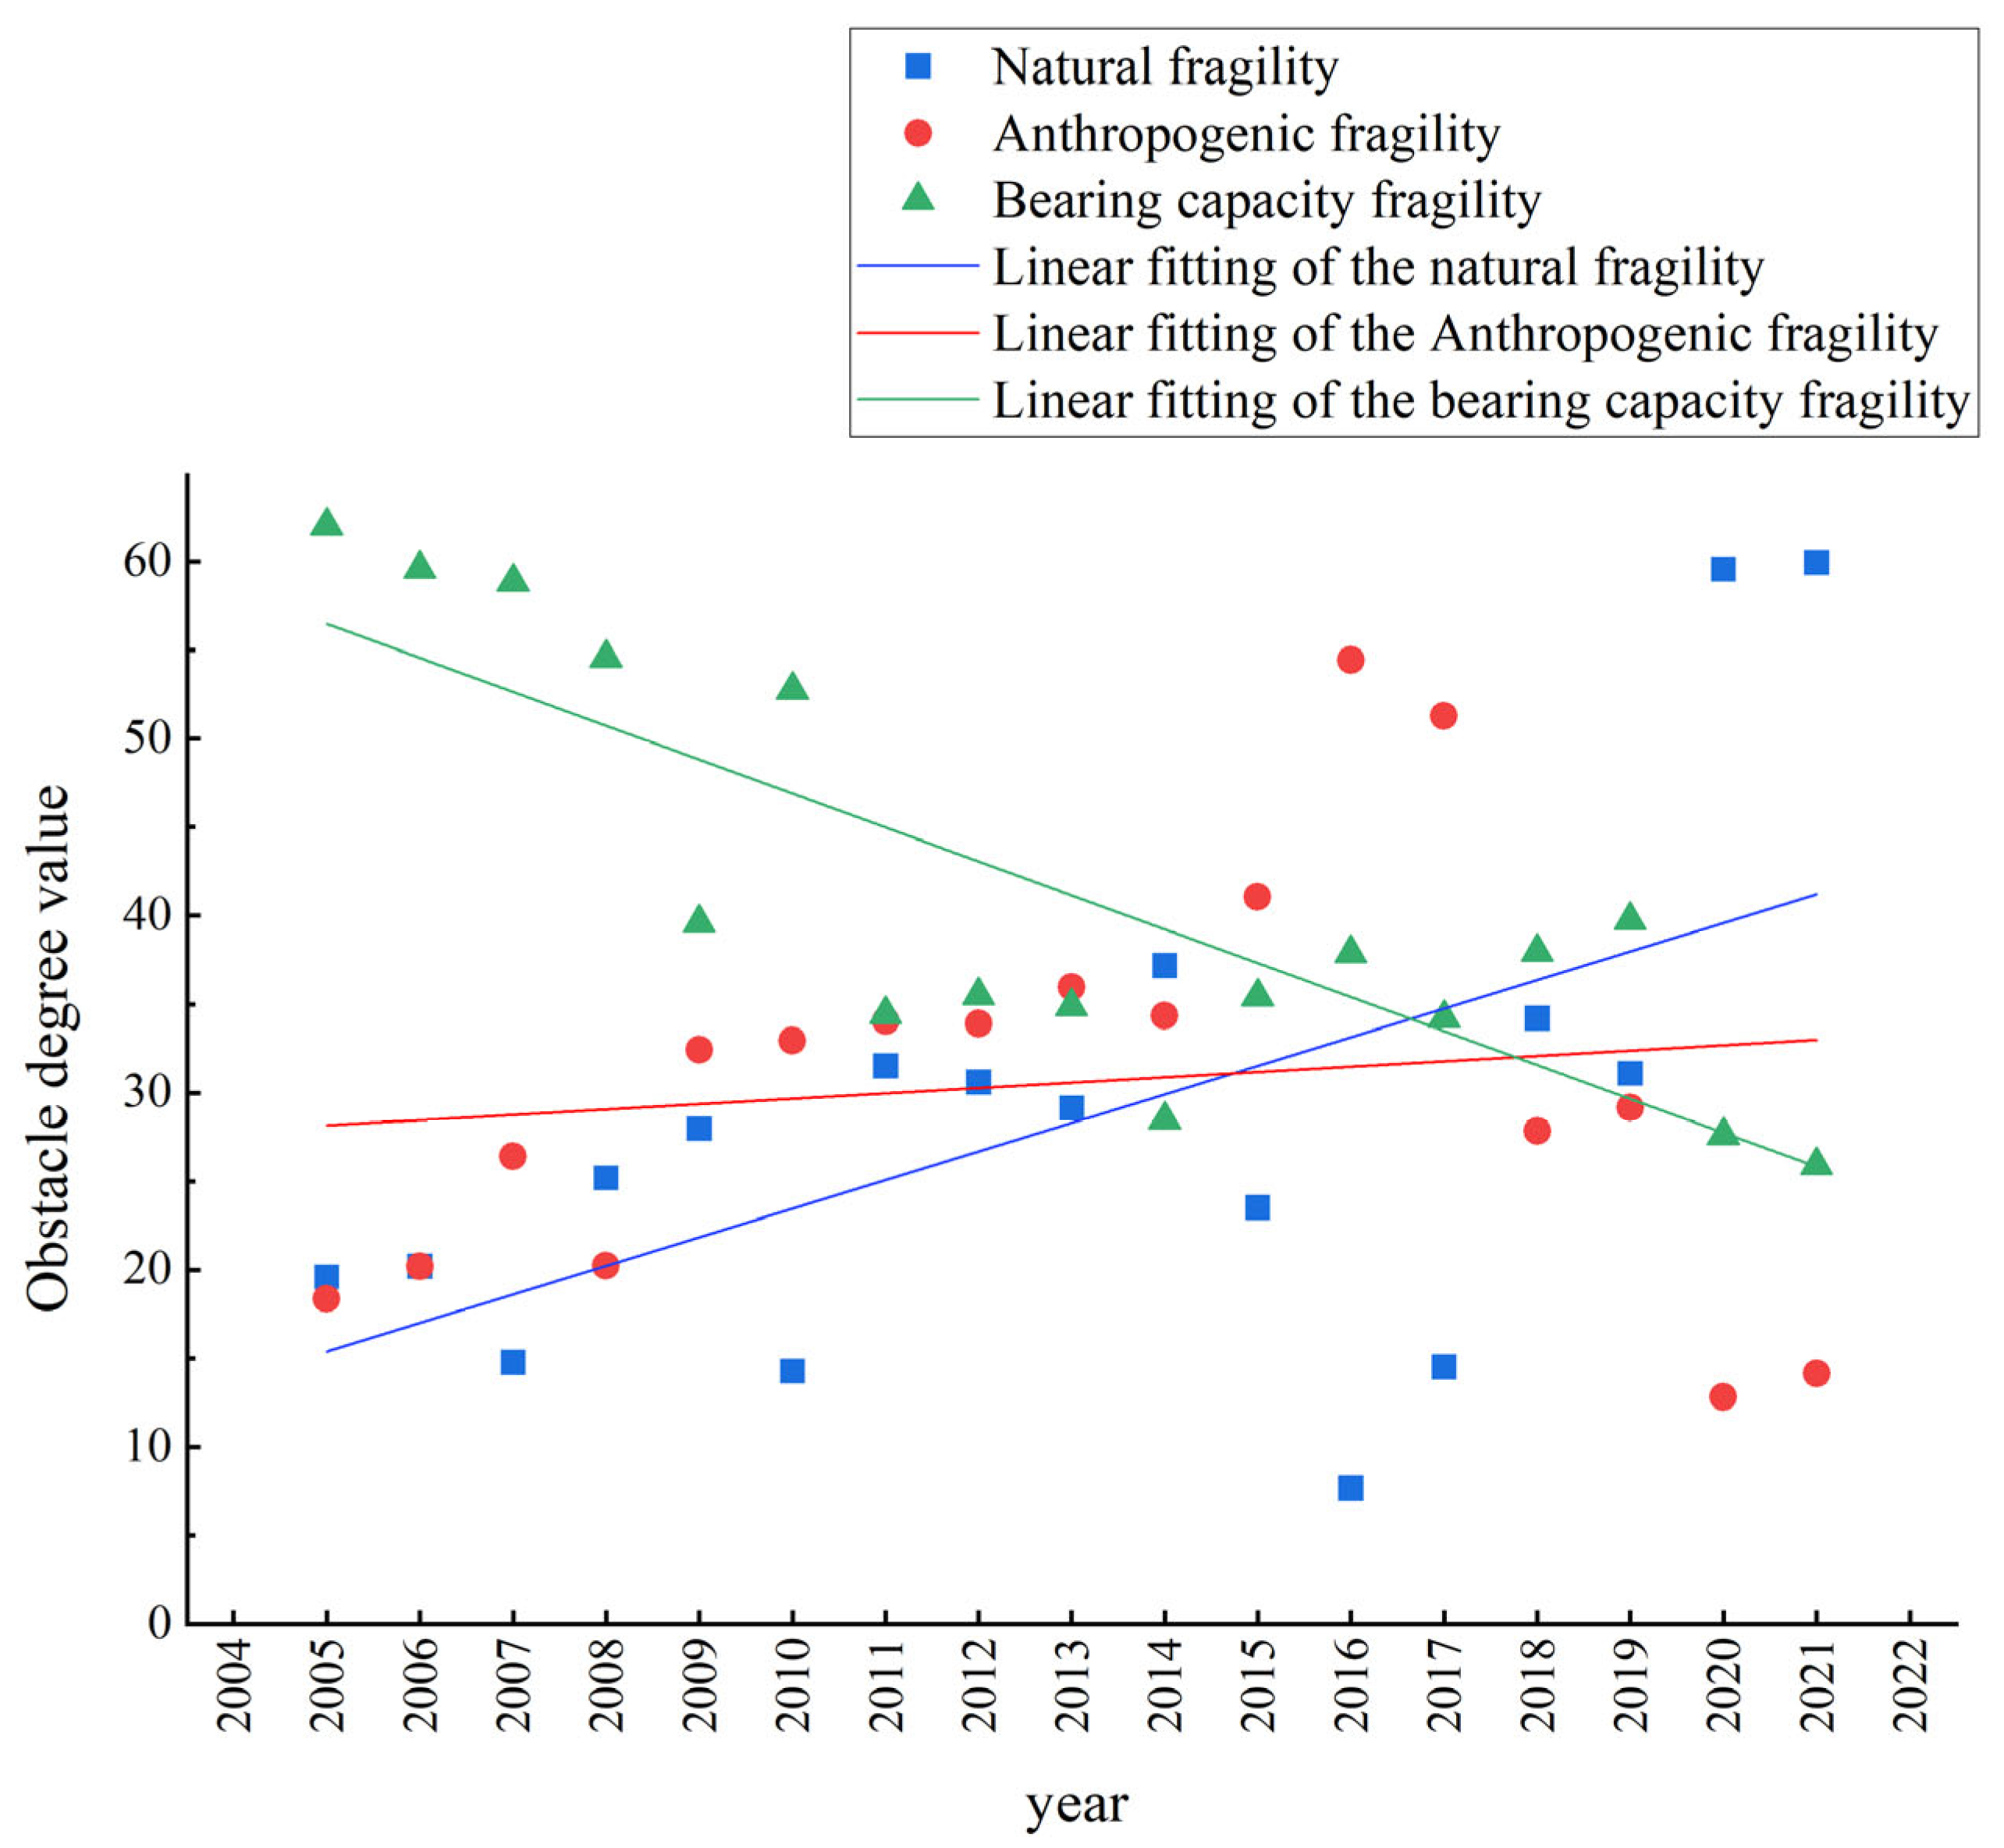
4.1.4. Diagnostic Analysis of Factors Impact Water Resource Vulnerability

The obstacle degree of each impacting factor in the indicator layer of the evaluation system for water resource vulnerability was derived from the index of the comprehensive-weight-system-based obstacle degree model (Table 6 and Table 7). Moreover, the interannual variations in obstacle degree in terms of each indicator are shown in Figure 6 and Figure 7, and the interannual variations in key factors are shown Figure 8.
The change in the barrier degree value of the indicator layer showed that the degree barriers of natural vulnerability changed significantly during 2005–2021, that they can be mainly divided into two phases, and that they generally show an increasing trend (Table 6; Figure 6 and Figure 7). From 2005 to 2019, the impact of natural fragility on water vulnerability was at a low level and had a barrier degree value of only 7.7% in 2016. However, it was much more significant than the anthropogenic fragility and bearing capacity fragility during 2020–2021. This was mainly caused by the fact that the total water resources, per capita water resources, and surface water resources were more abundant in 2016 than in the other years during the study period, which made the constraint of natural fragility on the SLRB’s water vulnerability significantly decrease and resulted in the barrier value of 7.7%. The sudden changes in the degree barriers of natural fragility after 2019 were mainly caused by the deterioration of water endowment conditions. The annual precipitation was less in 2020–2021 than in previous years and only 63% of the multi-year average precipitation. Meanwhile, the amount of groundwater in 2020–2021 occupied 67% of the multi-year average value and showed a continuous downward trend. This is accompanied by the shrinking scale of the water production modulus, accounting for 47% of the multi-year average water production modulus. Meanwhile, a series of human control measures conducted for human activities had given initial results, which is represented by the degree of barriers decreased when the state of anthropogenic fragility and bearing capacity fragility improved, and the capacity to constrain the benign development of water resources vulnerability has decreased. The above reasons eventually led to the barrier degree of natural fragility in 2020–2021 to far exceed that in the 2005–2019 period.
The impact of anthropogenic fragility on water resource vulnerability remained at a low state for 13 out of 17 years; although this changed for 4 years (2016, 2017, 2020, and 2021) it generally maintained a relatively stable and slow increase (Figure 7). The impact in 2016–2017 was much higher than the multi-year average, mainly due to the decline in the water supply modulus; the degree of surface water resource amount, exploration, and utilization; the degree of groundwater resource amount, exploration, and utilization; the surface water control rate; and the available water per capita, which decreased by 18%, 21%, 30%, 31%, and 17%, respectively, compared with the multi-year average values. As the anthropogenic fragility in 2020–2021 is much lower than that in the multi-year average, a possible reason was the development and utilization of surface water, as well as the increase in investment in ecological water use, which led to the reductions in the barrier degree and constraint effect of anthropogenic fragility. This was specifically embodied in the increase in the utilization rate, the control rate, and the ecological water use ratio in terms of surface water, and the growth rate for these reached 108%, 71%, and 285%, respectively.
Bearing capacity fragility kept a high obstacle degree in 2005–2010, which was mainly caused by a 27% increase in annual wastewater discharge compared with the multi-year average level and a 75% increase in the water use amount per capita GDP higher compared with the multi-year average value. During 2005–2010, the domestic water ratio was 54% higher than the multi-year average level, and the population was 3.2% lower than the multi-year average value, indicating that the water conservation awareness of residents was deficient, the construction of municipal water pipe network infrastructure was imperfect, and the water resource management should have been further enhanced. The combination of these issues resulted in a significant impact of bearing capacity fragility on water resource vulnerability. Since 2011, the SLRB has fully implemented the “Dunhuang Comprehensive Plan for Rational Use of Water Resources and Ecological Protection (2011–2020)”. By taking measures such as establishing water rights system; strengthening water resource management, conservation, and renovation; promoting the construction of related governance projects, water allocation, efficient water conservation, and moderate water transfer; and other comprehensive measures, the obstacle degree of bearing capacity fragility decreased and maintained a stably low state from 2011 to 2021. In general, the vulnerability of carrying capacity shows a large downward trend (Figure 7).
From 2005 to 2021, 7 of 16 factors had a high obstacle degree value of >6.5%, which had a significant impact on water resource vulnerability. The contributions of these impacting factors on water vulnerability are as follows, ranked by obstacle degree value: the ratio of irrigation water use on farmland, annual precipitation, total water resources, annual quantity of wastewater effluent, urbanization rate, surface water control rate, and the degree of groundwater resource amount, exploration, and utilization (Figure 8). The Gansu Provincial Government implemented strict water resource management system assessment methods and the “Gansu Province SLRB Water Rights Pilot Program” in 2013 and 2014, respectively. On this basis, the obstacle degree of the irrigation water proportion on farmland reached its peak value in 2013, decreased slowly after 2013, and, lastly, decreased significantly after 2020 (Figure 8). The impact of agricultural irrigation water on basin water resource vulnerability decreased year by year and had a weak trend from 2020 onward. This is because the construction of precision irrigation, the application of high-efficiency water-saving irrigation, and the development of modern agriculture had led to a significant increase in water use efficiency. Meanwhile, the urbanization rate became one of the key factors affecting water resource vulnerability in the basin from 2009 to 2021, and the effect of surface water control rates on water resource vulnerability decreased after 2018 with the construction of water conservancy projects and the artificial macro-regulation. The effect of annual precipitation, total water resources, the annual quantity of wastewater effluent, and the degree of groundwater resource amount, exploration, and utilization on water resource vulnerability presented an unstable fluctuation throughout the study period, among which the annual precipitation and total water resources are influenced indirectly by climate change, while the annual quantity of wastewater effluent and the degree of groundwater resource amount, exploration, and utilization are directly related to groundwater overuse and water pollution.

4.2. Discussion

Water resource vulnerability is severe in dry inland river basins in northwest China under the integrated influences of human activities and climate change. Rational evaluation systems of water resource vulnerability in arid areas and research on water resource vulnerability and the identification of potential risk elements can help managers to establish risk prevention and adaptation mechanisms based on future planning, forecasting and warning capabilities, and risk management.
(1)
As the impact of human activities and climate change on water resources intensifies in inland river basins in the arid area of northwest China, a single evaluation index is insufficient to reflect the complexity and vulnerability of water resources in river basins. If the evaluation indexes are too complex to be selected while establishing a multi-index evaluation system, it will lead to redundant and repetitive information. Few indexes will have a single response, and others will have incomplete information and indicators that are too specific. If selected indicators are specific, it is difficult to obtain and track the monitoring data to a certain extent, to have universality and representativeness, and to promote the practical application of the research results. In this study, via correlation analysis among indicators and expert consultation, the 16 impacting factors selected based on natural vulnerability, anthropogenic vulnerability, and carrying capacity vulnerability are representative, and the monitoring data are easily accessible and traceable, and, thereby, they have adaptability and practicality in the arid inland region of northwest China.
(2)
In terms of valuation ideas and methods of water resource vulnerability, most similar studies used objective or subjective single attribute evaluation methods, the results of which are rather one-sided and also difficult to cover the subjective and objective causes of water resource vulnerability. In the combined subjective and objective evaluation studies, the simple mean score method is often used as the combined method, which, to a certain extent, ignores the actual contribution of subjective and objective causes of water resource vulnerability. The actual contribution of the subjective and objective causes of water resource vulnerability in dryland basins has been ignored to some extent. This study used game theory for reconciliation and assignment, and the evaluation results use a fuzzy cloud model, avoiding the drawback of the unique certainty of evaluation results in similar quantitative studies and reflecting the uncertainty and ambiguity fuzziness of water resource vulnerability; thus, they can reflect the actual situation of water resource vulnerability more accurately.
(3)
Taking the evaluation results of the SLRB as an example, the results of this study are consistent with similar results and also correspond to the realities in the SLRB. The results of the barrier degree diagnosis showed that the most significant factor affecting the vulnerability of water resources is the vulnerability of carrying capacity in the SLRB, and the key influencing factors included the following: the irrigation water ratio of agricultural land, annual precipitation, total water resources, the annual discharge of wastewater, urbanization rate, surface water control rate, and the degree of groundwater development and utilization. This also shows that the water resources of arid inland river basin in China, especially of the SLRB, cannot maintain the sustainable development of oasis agriculture and ecological environment. At the same time, the intensification of human activities, displayed by the irrigation water use ratio, the annual discharge of wastewater, the urbanization rate, the surface water control rate, and the degree of groundwater exploitation and utilization, are the main factors affecting the vulnerability of water resources. Therefore, in order to reduce the vulnerability of water resources in arid inland river basins in northwestern China, it is better to adjust agricultural structure and effectively manage water resources in conjunction with the construction of surface water projects, further rationalizing the quantity and structure of water use in the river basins.

5. Conclusions

Taking the Shule River Basin as an example and based on expert consultation and result analysis, 16 influencing factors were selected to establish a water resources vulnerability assessment system for a northwestern arid inland river basin. The main conclusions were summarized as follows: (1) The water resources vulnerability of the Shule River Basin from 2005 to 2021 is highly likely to be severely vulnerable. (2) Among the three indicators of natural vulnerability, human vulnerability, and carrying capacity vulnerability, human vulnerability is the main cause of the vulnerability of water resources in the basin under relatively stable natural conditions. (3) Among the 16 influencing factors, the obstacle degree of the farmland irrigation water ratio, annual precipitation, total water resources, the annual discharge of wastewater, the urbanization rate, the surface water control rate, and the degree of the development and utilization of groundwater all exceeded 6.5%. These are the most important factors affecting the vulnerability of water resources in arid regions. Therefore, in arid inland river basins represented by irrigation agriculture in northwest China, water resource allocation and management should pay more attention to the impact of human activities on the sustainable utilization of water resources. At the same time, the water resource quantity in the basin is the main factor among the natural factors that affect the vulnerability of water resources in the basin. However, under the background of global climate warming, the quantitative response relationship between the water resources quantity and vulnerability in the arid inland river basin still needs to be further studied.

Author Contributions

Conceptualization, L.W.; data curation, L.W. and C.Q.; investigation, C.Q.; methodology, L.W. and C.Q.; writing—original draft preparation, L.W. and C.Q.; writing—review and editing, L.W., Y.S. and D.S. All authors have read and agreed to the published version of the manuscript.

Funding

This research is supported by the Gansu Province Youth Science and Technology Foundation (21JR7RA854 and 21JR7RA855), the Gansu Province Higher Education Youth Doctoral Fund Project (2022QB-070), and the Discipline Team Construction Project of GAU (GAU-XKTD-2022-08).

Institutional Review Board Statement

Not applicable.

Informed Consent Statement

Not applicable.

Data Availability Statement

The data presented in this study are available on request from the corresponding author.

Acknowledgments

The authors wish to thank Yanjun Shen, researcher, for the help in the writing process.

Conflicts of Interest

The authors declare no conflict of interest.

References

  1. Yang, Q.; Zhang, F.; Jiang, Z.; Yuan, D.; Jiang, Y. Assessment of Water Resource Carrying Capacity in Karst Area of Southwest China. Environ. Earth Sci. 2016, 75, 37. [Google Scholar] [CrossRef]
  2. Cacal, J.C.; Taboada, E.B. Assessment and Evaluation of IWRM Implementation in Palawan, Philippines. Civ. Eng. J. 2022, 8, 290–307. [Google Scholar] [CrossRef]
  3. Chen, Y.; Feng, Y.; Zhang, F.; Yang, F.; Wang, L. Assessing and Predicting the Water Resources Vulnerability under Various Climate-Change Scenarios: A Case Study of Huang-Huai-Hai River Basin, China. Entropy 2020, 22, 333. [Google Scholar] [CrossRef] [PubMed] [Green Version]
  4. Everard, M.; Sharma, O.P.; Vishwakarma, V.K.; Khandal, D.; Sahu, Y.K.; Bhatnagar, R.; Singh, J.K.; Kumar, R.; Nawab, A.; Kumar, A.; et al. Assessing the Feasibility of Integrating Ecosystem-Based with Engineered Water Resource Governance and Management for Water Security in Semi-Arid Landscapes: A Case Study in the Banas Catchment, Rajasthan, India. Sci. Total Environ. 2018, 612, 1249–1265. [Google Scholar] [CrossRef] [PubMed]
  5. Doerfliger, N.; Jeannin, P.Y.; Zwahlen, F. Water Vulnerability Assessment in Karst Environments: A New Method of Defining Protection Areas Using a Multi-Attribute Approach and GIS Tools (EPIK Method). Environ. Geol. 1999, 39, 165–176. [Google Scholar] [CrossRef] [Green Version]
  6. Vörösmarty, C.J.; Green, P.; Salisbury, J.; Lammers, R.B. Global Water Resources: Vulnerability from Climate Change and Population Growth. Science 2000, 289, 284–288. [Google Scholar] [CrossRef] [Green Version]
  7. Anandhi, A.; Kannan, N. Vulnerability Assessment of Water Resources–Translating a Theoretical Concept to an Operational Framework Using Systems Thinking Approach in a Changing Climate: Case Study in Ogallala Aquifer. J. Hydrol. 2018, 557, 460–474. [Google Scholar] [CrossRef]
  8. Xia, J.; Ning, L.; Wang, Q.; Chen, J.; Wan, L.; Hong, S. Vulnerability of and Risk to Water Resources in Arid and Semi-Arid Regions of West China under a Scenario of Climate Change. Clim. Chang. 2017, 144, 549–563. [Google Scholar] [CrossRef]
  9. Perveen, S.; James, L.A. Scale Invariance of Water Stress and Scarcity Indicators: Facilitating Cross-Scale Comparisons of Water Resources Vulnerability. Appl. Geogr. 2011, 31, 321–328. [Google Scholar] [CrossRef]
  10. Hamouda, M.A.; Nour El-Din, M.M.; Moursy, F.I. Vulnerability Assessment of Water Resources Systems in the Eastern Nile Basin. Water Resour. Manag. 2009, 23, 2697–2725. [Google Scholar] [CrossRef]
  11. Xu, W.; Zhang, X.; Cui, Y.; Tian, T.; Lin, L.; Liu, Y. Study on Comprehensive Evaluation of Urban Water Resource Vulnerability. Sustainability 2022, 14, 4149. [Google Scholar] [CrossRef]
  12. Alessa, L.; Kliskey, A.; Lammers, R.; Arp, C.; White, D.; Hinzman, L.; Busey, R. The Arctic Water Resource Vulnerability Index: An Integrated Assessment Tool for Community Resilience and Vulnerability with Respect to Freshwater. Environ. Manag. 2008, 42, 523–541. [Google Scholar] [CrossRef] [PubMed]
  13. Xia, J.; Chen, J.; Weng, J.; Yu, L.; Qi, J.; Liao, Q. Vulnerability of Water Resources and Its Spatial Heterogeneity in Haihe River Basin, China. Chin. Geogr. Sci. 2014, 24, 525–539. [Google Scholar] [CrossRef] [Green Version]
  14. Pan, Z.; Jin, J.; Li, C.; Ning, S.; Zhou, R. A Connection Entropy Approach to Water Resources Vulnerability Analysis in a Changing Environment. Entropy 2017, 19, 591. [Google Scholar] [CrossRef] [Green Version]
  15. Shabbir, R.; Ahmad, S.S. Water Resource Vulnerability Assessment in Rawalpindi and Islamabad, Pakistan Using Analytic Hierarchy Process (AHP). J. King Saud Univ.-Sci. 2016, 28, 293–299. [Google Scholar] [CrossRef] [Green Version]
  16. Cai, J.; Varis, O.; Yin, H. China’s Water Resources Vulnerability: A Spatio-Temporal Analysis during 2003–2013. J. Clean. Prod. 2017, 142, 2901–2910. [Google Scholar] [CrossRef]
  17. Kanakoudis, V.; Tsitsifli, S.; Papadopoulou, A.; Curk, B.C.; Karleusa, B. Estimating the Water Resources Vulnerability Index in the Adriatic Sea Region. Procedia Eng. 2016, 162, 476–485. [Google Scholar] [CrossRef] [Green Version]
  18. Wu, G.; Li, L.; Ahmad, S.; Chen, X.; Pan, X. A Dynamic Model for Vulnerability Assessment of Regional Water Resources in Arid Areas: A Case Study of Bayingolin, China. Water Resour. Manag. 2013, 27, 3085–3101. [Google Scholar] [CrossRef]
  19. Islam, A.R.M.T.; Pal, S.C.; Chakrabortty, R.; Idris, A.M.; Salam, R.; Islam, M.S.; Zahid, A.; Shahid, S.; Ismail, Z.B. A Coupled Novel Framework for Assessing Vulnerability of Water Resources Using Hydrochemical Analysis and Data-Driven Models. J. Clean. Prod. 2022, 336, 130407. [Google Scholar] [CrossRef]
  20. Abdullah, T.O.; Ali, S.S.; Al-Ansari, N.A.; Knutsson, S. Assessment of Groundwater Vulnerability to Pollution Using Two Different Vulnerability Models in Halabja-Saidsadiq Basin, Iraq. Groundw. Sustain. Dev. 2020, 10, 100276. [Google Scholar] [CrossRef]
  21. Liu, H.-L.; Willems, P.; Bao, A.-M.; Wang, L.; Chen, X. Effect of Climate Change on the Vulnerability of a Socio-Ecological System in an Arid Area. Glob. Planet. Chang. 2016, 137, 1–9. [Google Scholar] [CrossRef]
  22. Feng, Z.-D.; An, C.B.; Wang, H.B. Holocene Climatic and Environmental Changes in the Arid and Semi-Arid Areas of China: A Review. Holocene 2006, 16, 119–130. [Google Scholar] [CrossRef]
  23. Wang, G.; Cheng, G. The Characteristics of Water Resources and the Changes of the Hydrological Process and Environment in the Arid Zone of Northwest China. Environ. Geol. 2000, 39, 783–790. [Google Scholar] [CrossRef]
  24. Kang, E.; Cheng, G.; Lan, Y.; Jin, H. A Model for Simulating the Response of Runoff from the Mountainous Watersheds of Inland River Basins in the Arid Area of Northwest China to Climatic Changes. Sci. China Ser. D Earth Sci. 1999, 42, 52–63. [Google Scholar] [CrossRef]
  25. Zhang, Q.; Xu, H.; Li, Y.; Fan, Z.; Zhang, P.; Yu, P.; Ling, H. Oasis Evolution and Water Resource Utilization of a Typical Area in the Inland River Basin of an Arid Area: A Case Study of the Manas River Valley. Environ. Earth Sci. 2012, 66, 683–692. [Google Scholar] [CrossRef]
  26. Qi, S.-Z.; Luo, F. Water Environmental Degradation of the Heihe River Basin in Arid Northwestern China. Environ. Monit. Assess 2005, 108, 205–215. [Google Scholar] [CrossRef] [PubMed]
  27. Fisher, F.M.; Arlosoroff, S.; Eckstein, Z.; Haddadin, M.; Hamati, S.G.; Huber-Lee, A.; Jarrar, A.; Jayyousi, A.; Shamir, U.; Wesseling, H. Optimal Water Management and Conflict Resolution: The Middle East Water Project. Water Resour. Res. 2002, 38, 25-1–25-17. [Google Scholar] [CrossRef]
  28. Meng, L.; Chen, Y.; Li, W.; Zhao, R. Fuzzy Comprehensive Evaluation Model for Water Resources Carrying Capacity in Tarim River Basin, Xinjiang, China. Chin. Geogr. Sci. 2009, 19, 89–95. [Google Scholar] [CrossRef]
  29. Habibi Davijani, M.; Banihabib, M.E.; Nadjafzadeh Anvar, A.; Hashemi, S.R. Multi-Objective Optimization Model for the Allocation of Water Resources in Arid Regions Based on the Maximization of Socioeconomic Efficiency. Water Resour. Manag. 2016, 30, 927–946. [Google Scholar] [CrossRef]
  30. Parween, F.; Kumari, P.; Singh, A. Irrigation Water Pricing Policies and Water Resources Management. Water Policy 2020, 23, 130–141. [Google Scholar] [CrossRef]
  31. Song, M.; Wang, R.; Zeng, X. Water Resources Utilization Efficiency and Influence Factors under Environmental Restrictions. J. Clean. Prod. 2018, 184, 611–621. [Google Scholar] [CrossRef]
  32. Wu, L. River Network Dataset of the Shulehe River Basin. 2021. Available online: http://www.ncdc.ac.cn/portal/metadata/4812007d-7c7c-4f64-a787-3f60d667f8ef (accessed on 30 May 2023).
  33. Thungngern, J.; Wijitkosum, S.; Sriburi, T.; Sukhsri, C. A Review of the Analytical Hierarchy Process (AHP): An Approach to Water Resource Management in Thailand. Appl. Environ. Res. 2015, 37, 13–32. [Google Scholar] [CrossRef]
  34. Jenifer, M.A.; Jha, M.K. Comparison of Analytic Hierarchy Process, Catastrophe and Entropy Techniques for Evaluating Groundwater Prospect of Hard-Rock Aquifer Systems. J. Hydrol. 2017, 548, 605–624. [Google Scholar] [CrossRef]
  35. Zhu, D.; Wang, R.; Duan, J.; Cheng, W. Comprehensive Weight Method Based on Game Theory for Identify Critical Transmission Lines in Power System. Int. J. Electr. Power Energy Syst. 2021, 124, 106362. [Google Scholar] [CrossRef]
  36. Jolson, M.A.; Rossow, G.L. The Delphi Process in Marketing Decision Making. J. Mark. Res. 1971, 8, 443–448. [Google Scholar] [CrossRef]
  37. Cui, C.; Wang, B.; Zhao, Y.; Zhang, Y.-J.; Xue, L. Risk Management for Mine Closure: A Cloud Model and Hybrid Semi-Quantitative Decision Method. Int. J. Miner. Metall. Mater. 2020, 27, 1021–1035. [Google Scholar] [CrossRef]
Figure 1. Flow chart of the evaluation of the Delphi method.
Sustainability 15 09052 g001
Figure 2. Cloud forward generator.
Sustainability 15 09052 g002
Figure 3. The distribution of water systems, districts, and deserts in the Shule River Basin.
Sustainability 15 09052 g003
Figure 4. Standard evaluation cloud diagram.
Sustainability 15 09052 g004
Figure 5. Dual-evaluation cloud diagram.
Sustainability 15 09052 g005
Figure 6. Changes in indicator obstacle degree.
Sustainability 15 09052 g006
Figure 7. Interannual variation trend of obstacle degree in terms of each indicator.
Sustainability 15 09052 g007
Figure 8. Key Factor Obstacle Change Kite Chart.
Sustainability 15 09052 g008
Table 1. Comparison of the evaluation results of water vulnerability assessment index system in SLRB.
30 Impact Factors16 Impact FactorsThe Difference in Matter-Element Model Evaluation ResultsThe Difference in Delphi Method Evaluation Results
Annual precipitation C1Annual precipitation C10.0550.019
Total water resources C2Total water resources C2
Average water resource amount per capita C3Water yield modulus C3
Surface water resource amount C4Groundwater resource amount C4
Groundwater resource amount C5Water supply modulus C5
Water resource amount per Mu C6Degree of surface water resource amount, exploration, and utilization C6
Water supply modulus C7Degree of groundwater resource amount, exploration, and utilization C7
Available water per capita C8Surface water control rate C8
Degree of surface water resource amount, exploration, and utilization C9Available water per capita C9
Degree of groundwater resource amount, exploration, and utilization C10Ecological and environmental water use ratio C10
Water consumption rate C11Tillable land effective irrigation ratio C11
Surface water control rate C12Domestic water ratio C12
Population growth rate C13Ratio of irrigation water use on farmland C13
Population density C14Annual quantity of wastewater effluent C14
Urbanization rate C15Water use amount per unit GDP C15
Day water consumption per capita C16Urbanization rate C16
Domestic water ratio C17
Tillable land ratio C18
Tillable land effective irrigation ratio C19
Water saving irrigation ratio C20
Grain production per capita C21
Farmland irrigation water use amount per Mu C22
Ratio of irrigation water use on farmland C23
Per capita GDP C24
Water use amount per unit GDP C25
Water use amount per CNY ten thousand of industrial added value C26
Industrial water ratio C27
Annual quantity of wastewater effluent C28
Water yield modulus C29
Ecological and environmental water use ratio C30
Table 2. Evaluation index system of water resource vulnerability in inland river basins in arid areas.
Indicator LayerImpact FactorsPropertyReplacement FormulaMeaning
Natural fragility B1Annual precipitation C1-Statistical dataReflects the basic precipitation status of the river basin and has a direct impact on the runoff of surface rivers.
Total water resources C2-Statistical dataReflects the amount endowment status of water resources in the basin.
Water yield modulus C3-Total water resources/drainage areaReflects the water yield by the basin itself.
Groundwater resource amount C4-Statistical dataReflects the richness of groundwater resources in the basin.
Anthropogenic fragility B2Water supply modulus C5-Total water supply/drainage areaReflects the ability of infrastructure such as water supply projects in the basin to support the social and economic development of the basin.
Degree of surface water resource amount, exploration, and utilization C6-Surface water supply amount/surface water resource amountReflects the extent to which surface water is exploited within the basin and the potential for exploitation.
Degree of groundwater resource amount, exploration, and utilization C7-Groundwater supply amount/groundwater resources amountReflects the potential for the development of groundwater resources in the basin.
Surface water control rate C8-Annual water storage quantity of surface water storage project/surface water resources in the river basinReflects the capacity of surface water storage in the river basin.
Available water per capita C9-Actual water supply/total population of the basinReflects the water supply capacity of the water supply system and the ability of water resources to support regional development.
Ecological and environmental water use ratio C10-Ecological and environmental water use amount/total water use amount in the river basinReflects the water input for the restoration, construction, and maintenance of the ecological environment in the river basin.
Bearing capacity fragility B3Tillable land effective irrigation ratio C11-Effective irrigation area/total tillable land area of the river basinReflects the level of effective irrigation and the degree of food security in the river basin.
Domestic water ratio C12+Domestic water consumption/total water use amount in the river basinReflects the scale of water used by residents in the basin.
Ratio of irrigation water use on farmland C13+Irrigation water use amount on farmland/total water use amount in the river basinReflects the water use efficiency of agricultural irrigation within the watershed.
Annual quantity of wastewater effluent C14+Statistical dataReflects the degree of influence of sewage discharge in the river basin on the water quality of various water bodies in the river basin.
Water use amount per capita GDP C15+Total water use amount in the river basin/total GDP of the basinReflects the comprehensive water use efficiency, water saving degree, and industrial structure of the river basin.
Urbanization rate C16+Permanent urban population/total population of the basinReflects the level of socioeconomic development of the basin and the potential requirements for water quality and quantity.
Table 3. Value rating criteria for water vulnerability assessment.
Digital FeaturesGrade of Water Resource Vulnerability Evaluation Fragile State
Ex 1En 2He 3
10.1030.013IQuite low fragility
0.6910.0640.008IILow fragility
0.50.0390.005IIIModerate fragility
0.3090.0640.008IVHigh fragility
00.1030.013VSeriously high fragility
1 Expected value; 2 entropy; 3 hyper entropy.
Table 4. Consolidated weight calculation.
FactorsWeight: waOrderWeight: wb OrderWeight: WsOrder
C10.11120.024160.066 6
C20.15810.07650.115 1
C30.06540.06460.065 8
C40.06540.08340.074 5
C50.03370.05180.042 13
C60.02680.031130.028 16
C70.08330.04990.065 7
C80.06540.047100.056 9
C90.04160.05770.049 11
C100.05250.032120.042 14
C110.04160.029150.035 15
C120.03370.15020.093 2
C130.08330.030140.056 10
C140.06540.08530.075 5
C150.02680.15310.091 3
C160.05250.040110.046 12
Table 5. Water vulnerability status of the SLRB, 2005–2021.
TimeMatter-Element Model Evaluation ResultsFragility LevelFragility StateDelphi Method Evaluation ResultsVariation CoefficientFragility LevelFragility State
20050.485IIIModerate fragility0.44011.2%IIIModerate fragility
20060.474IIIModerate fragility0.38011.9%IVHigh fragility
20070.419IIIModerate fragility0.36013.7%IVHigh fragility
20080.553IIIModerate fragility0.36013.7%IVHigh fragility
20090.452IIIModerate fragility0.56014.4%IIIModerate fragility
20100.309IVHigh fragility0.53010.9%IIIModerate fragility
20110.363IVHigh fragility0.38013.0%IVHigh fragility
20120.373IVHigh fragility0.42012.7%IIModerate fragility
20130.366IVHigh fragility0.37012.5%IVHigh fragility
20140.439IIIModerate fragility0.51011.4%IIIModerate fragility
20150.425IIIModerate fragility0.56012.0%IIIModerate fragility
20160.301IVHigh fragility0.50014.6%IIIModerate fragility
20170.322IVHigh fragility0.37012.5%IVHigh fragility
20180.425IIIModerate fragility0.62013.0%IILow fragility
20190.447IIIModerate fragility0.29010.4%IVHigh fragility
20200.357IVHigh fragility0.39011.9%IVHigh fragility
20210.363IVHigh fragility0.40013.4%IVHigh fragility
Table 6. Obstacles to indicators of the SLRB water vulnerability assessment system, 2005–2021.
TimeIndicators
Natural Fragility B1 (%)Anthropogenic Fragility B2 (%)Bearing Capacity Fragility B3 (%)
200519.618.462
200620.220.259.6
200714.826.458.8
200825.220.254.6
200928.032.439.6
201014.33352.8
201131.534.134.4
201230.633.935.5
201329.13634.9
201437.234.328.5
201523.541.135.4
20167.754.437.9
201714.551.334.2
201834.227.838
201931.129.239.7
202059.612.827.6
202159.914.125.9
Table 7. Obstacle values of water vulnerability factors in SLRB.
FactorsC1C2C3C4C5C6C7C8C9C10C11C12C13C14C15C16
Obstacle9.08.75.15.53.83.56.76.84.15.75.76.49.57.25.56.8
Disclaimer/Publisher’s Note: The statements, opinions and data contained in all publications are solely those of the individual author(s) and contributor(s) and not of MDPI and/or the editor(s). MDPI and/or the editor(s) disclaim responsibility for any injury to people or property resulting from any ideas, methods, instructions or products referred to in the content.

