Catching Up of Latecomer Economies in ICT for Sustainable Development: An Analysis Based on Technology Life Cycle Using Patent Data
Abstract
1. Introduction
2. Catching Up and ICT Development Background
2.1. Conceptualizing Catching Up
2.2. Catching Up in ICT
3. Methodology and Data
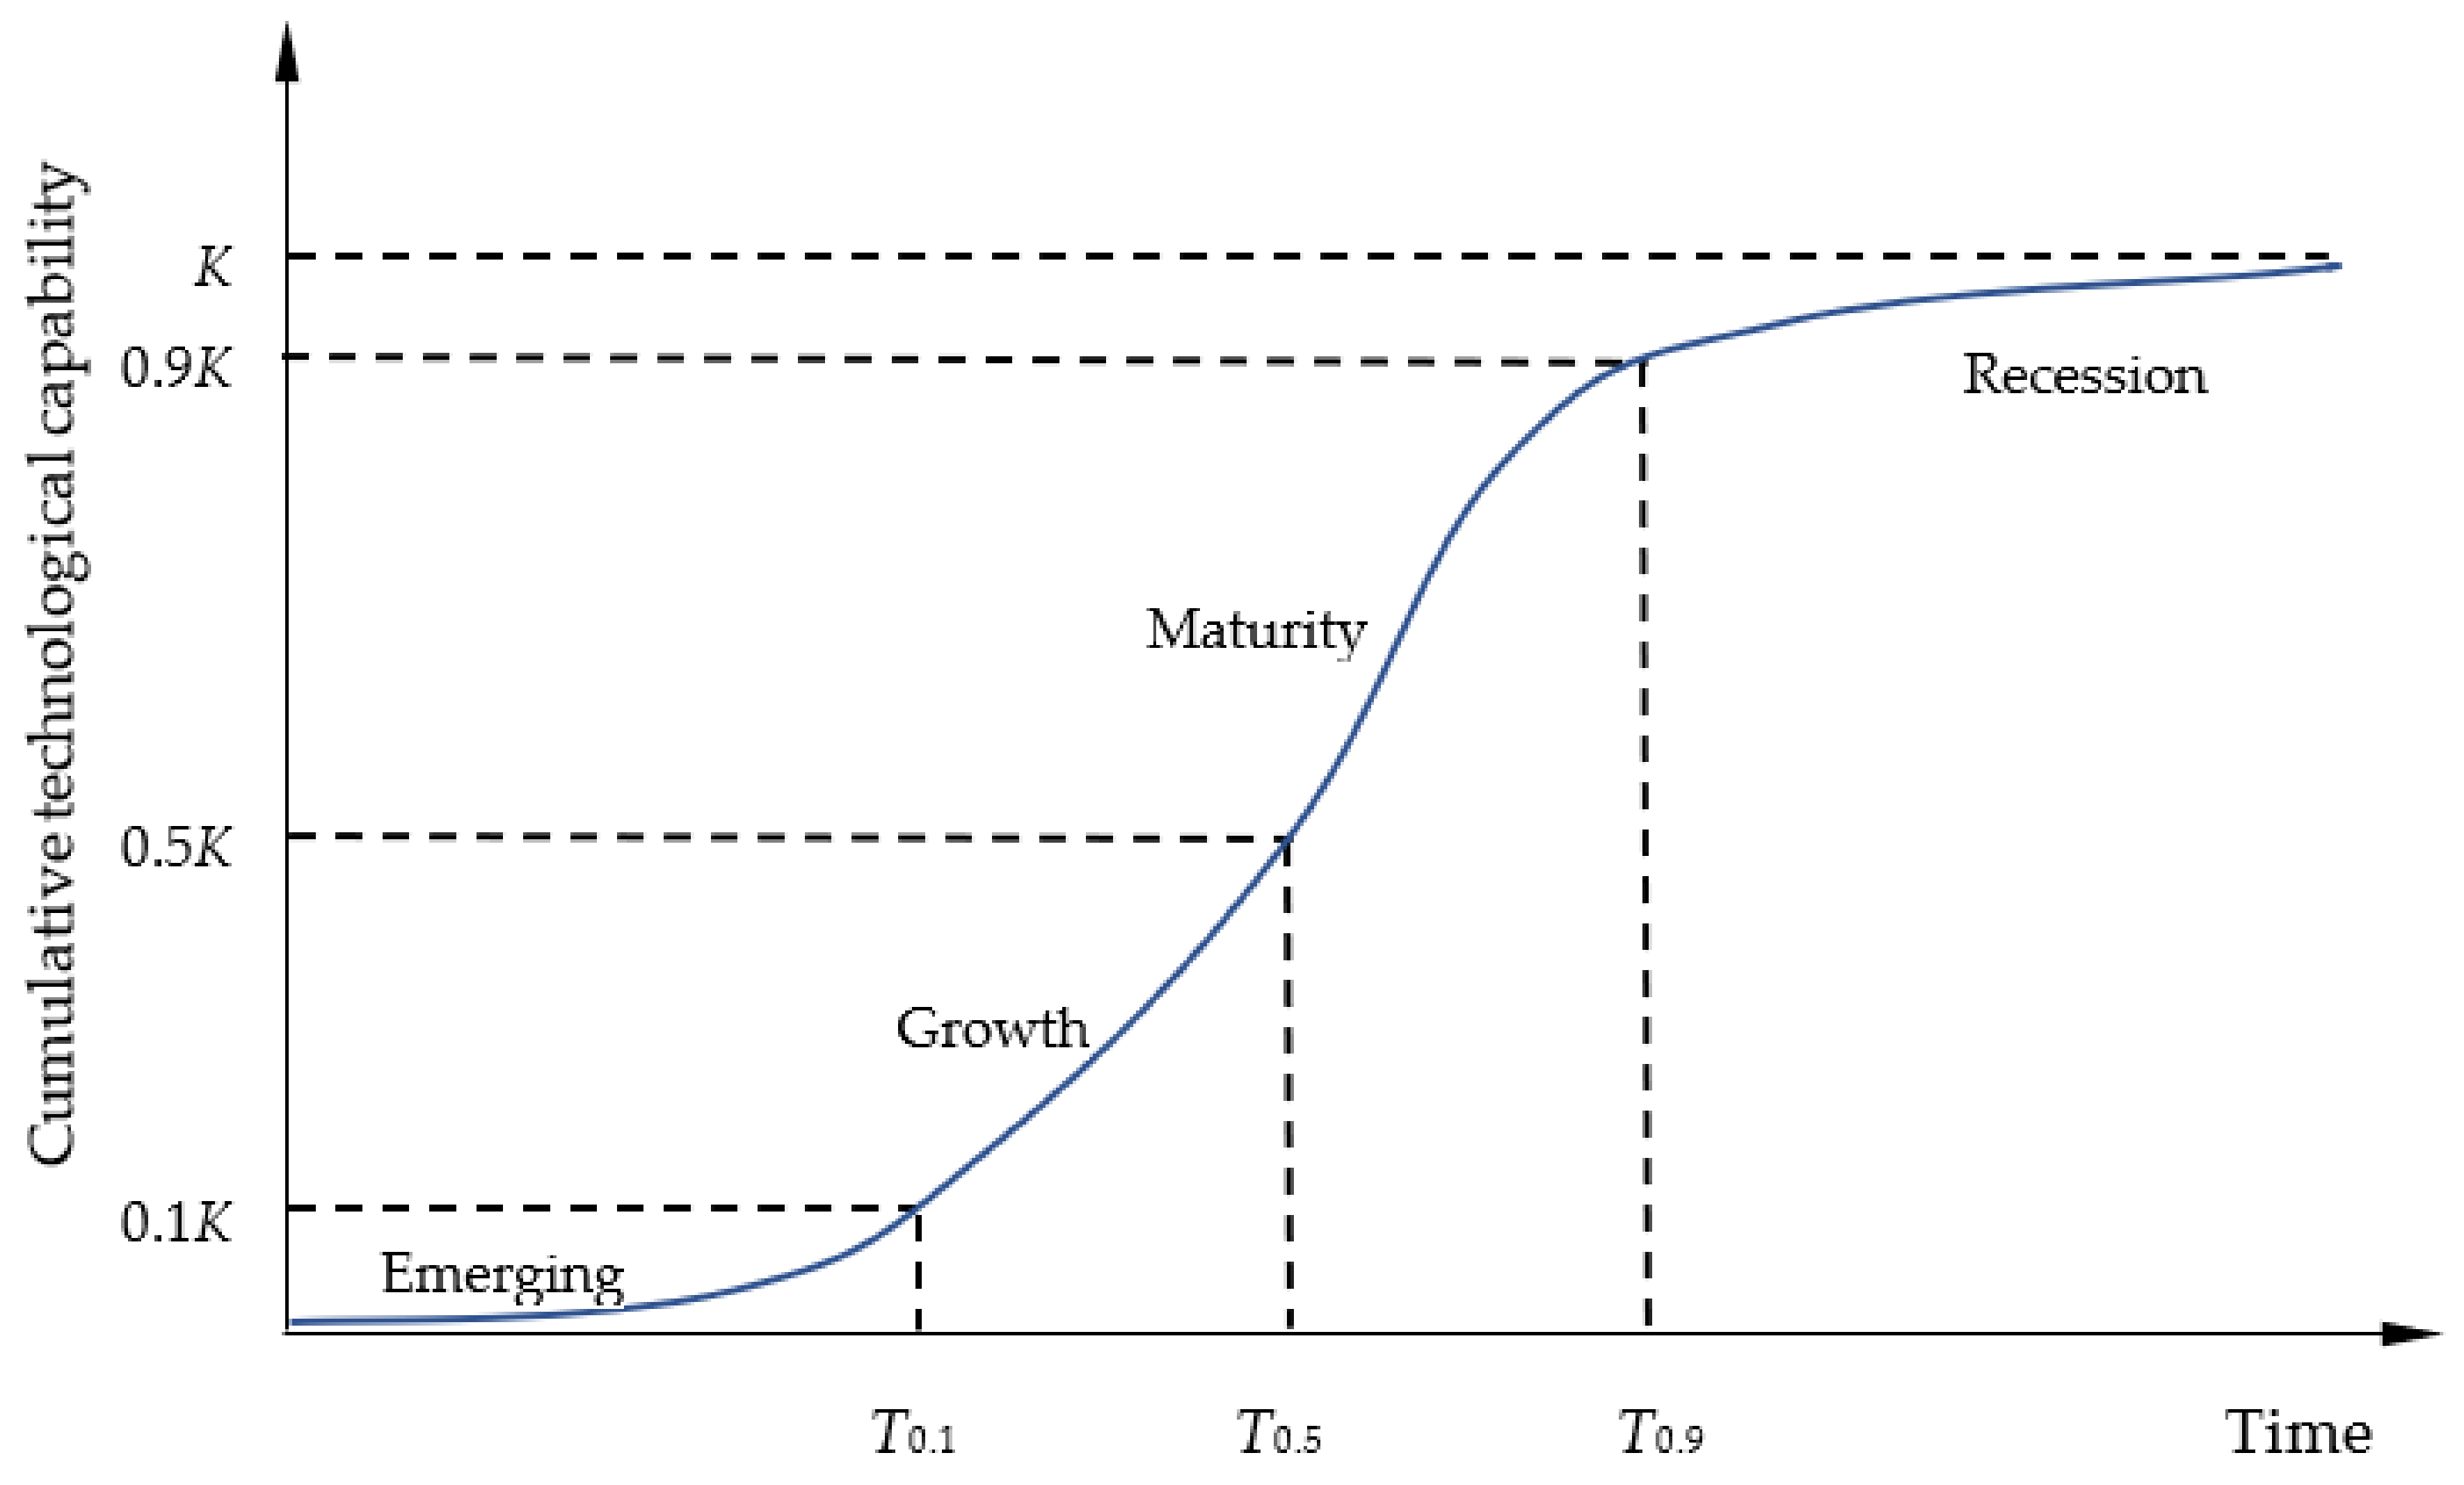
3.1. Technology Life Cycle and S-Curve
3.2. Logistic and Bi-Logistic Model
3.3. Data
4. Results Analysis Based on Technology Life Cycle
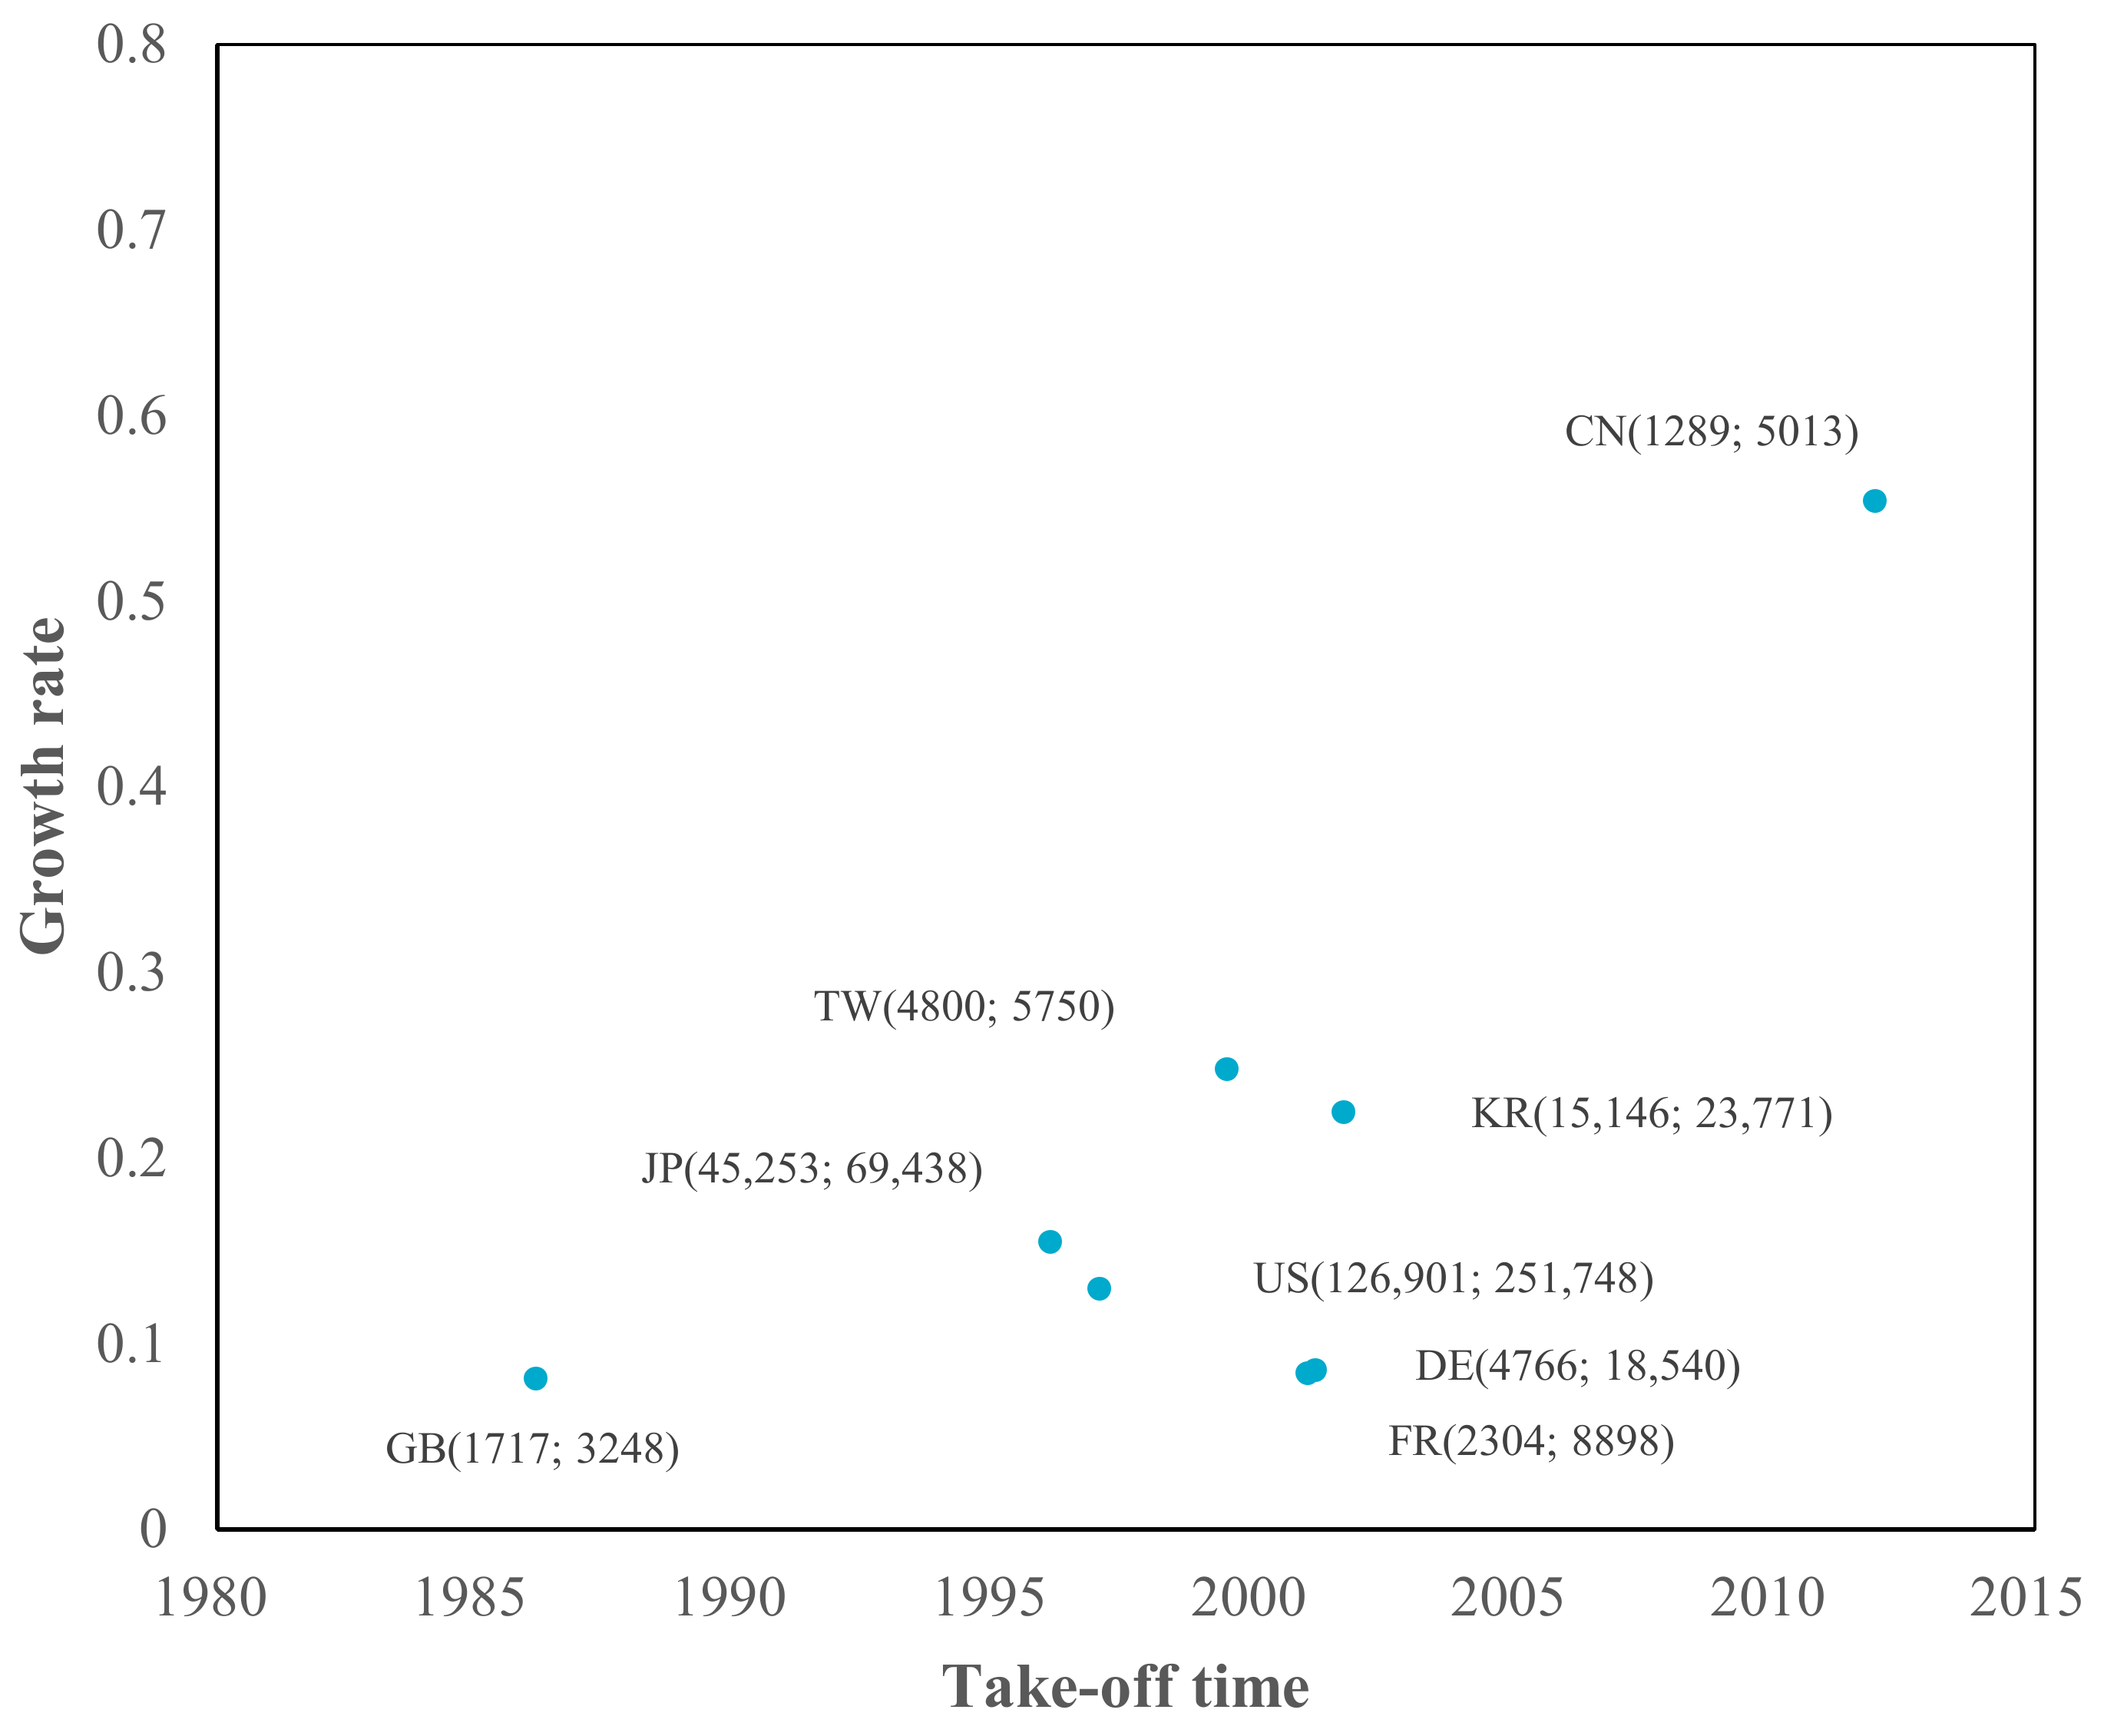
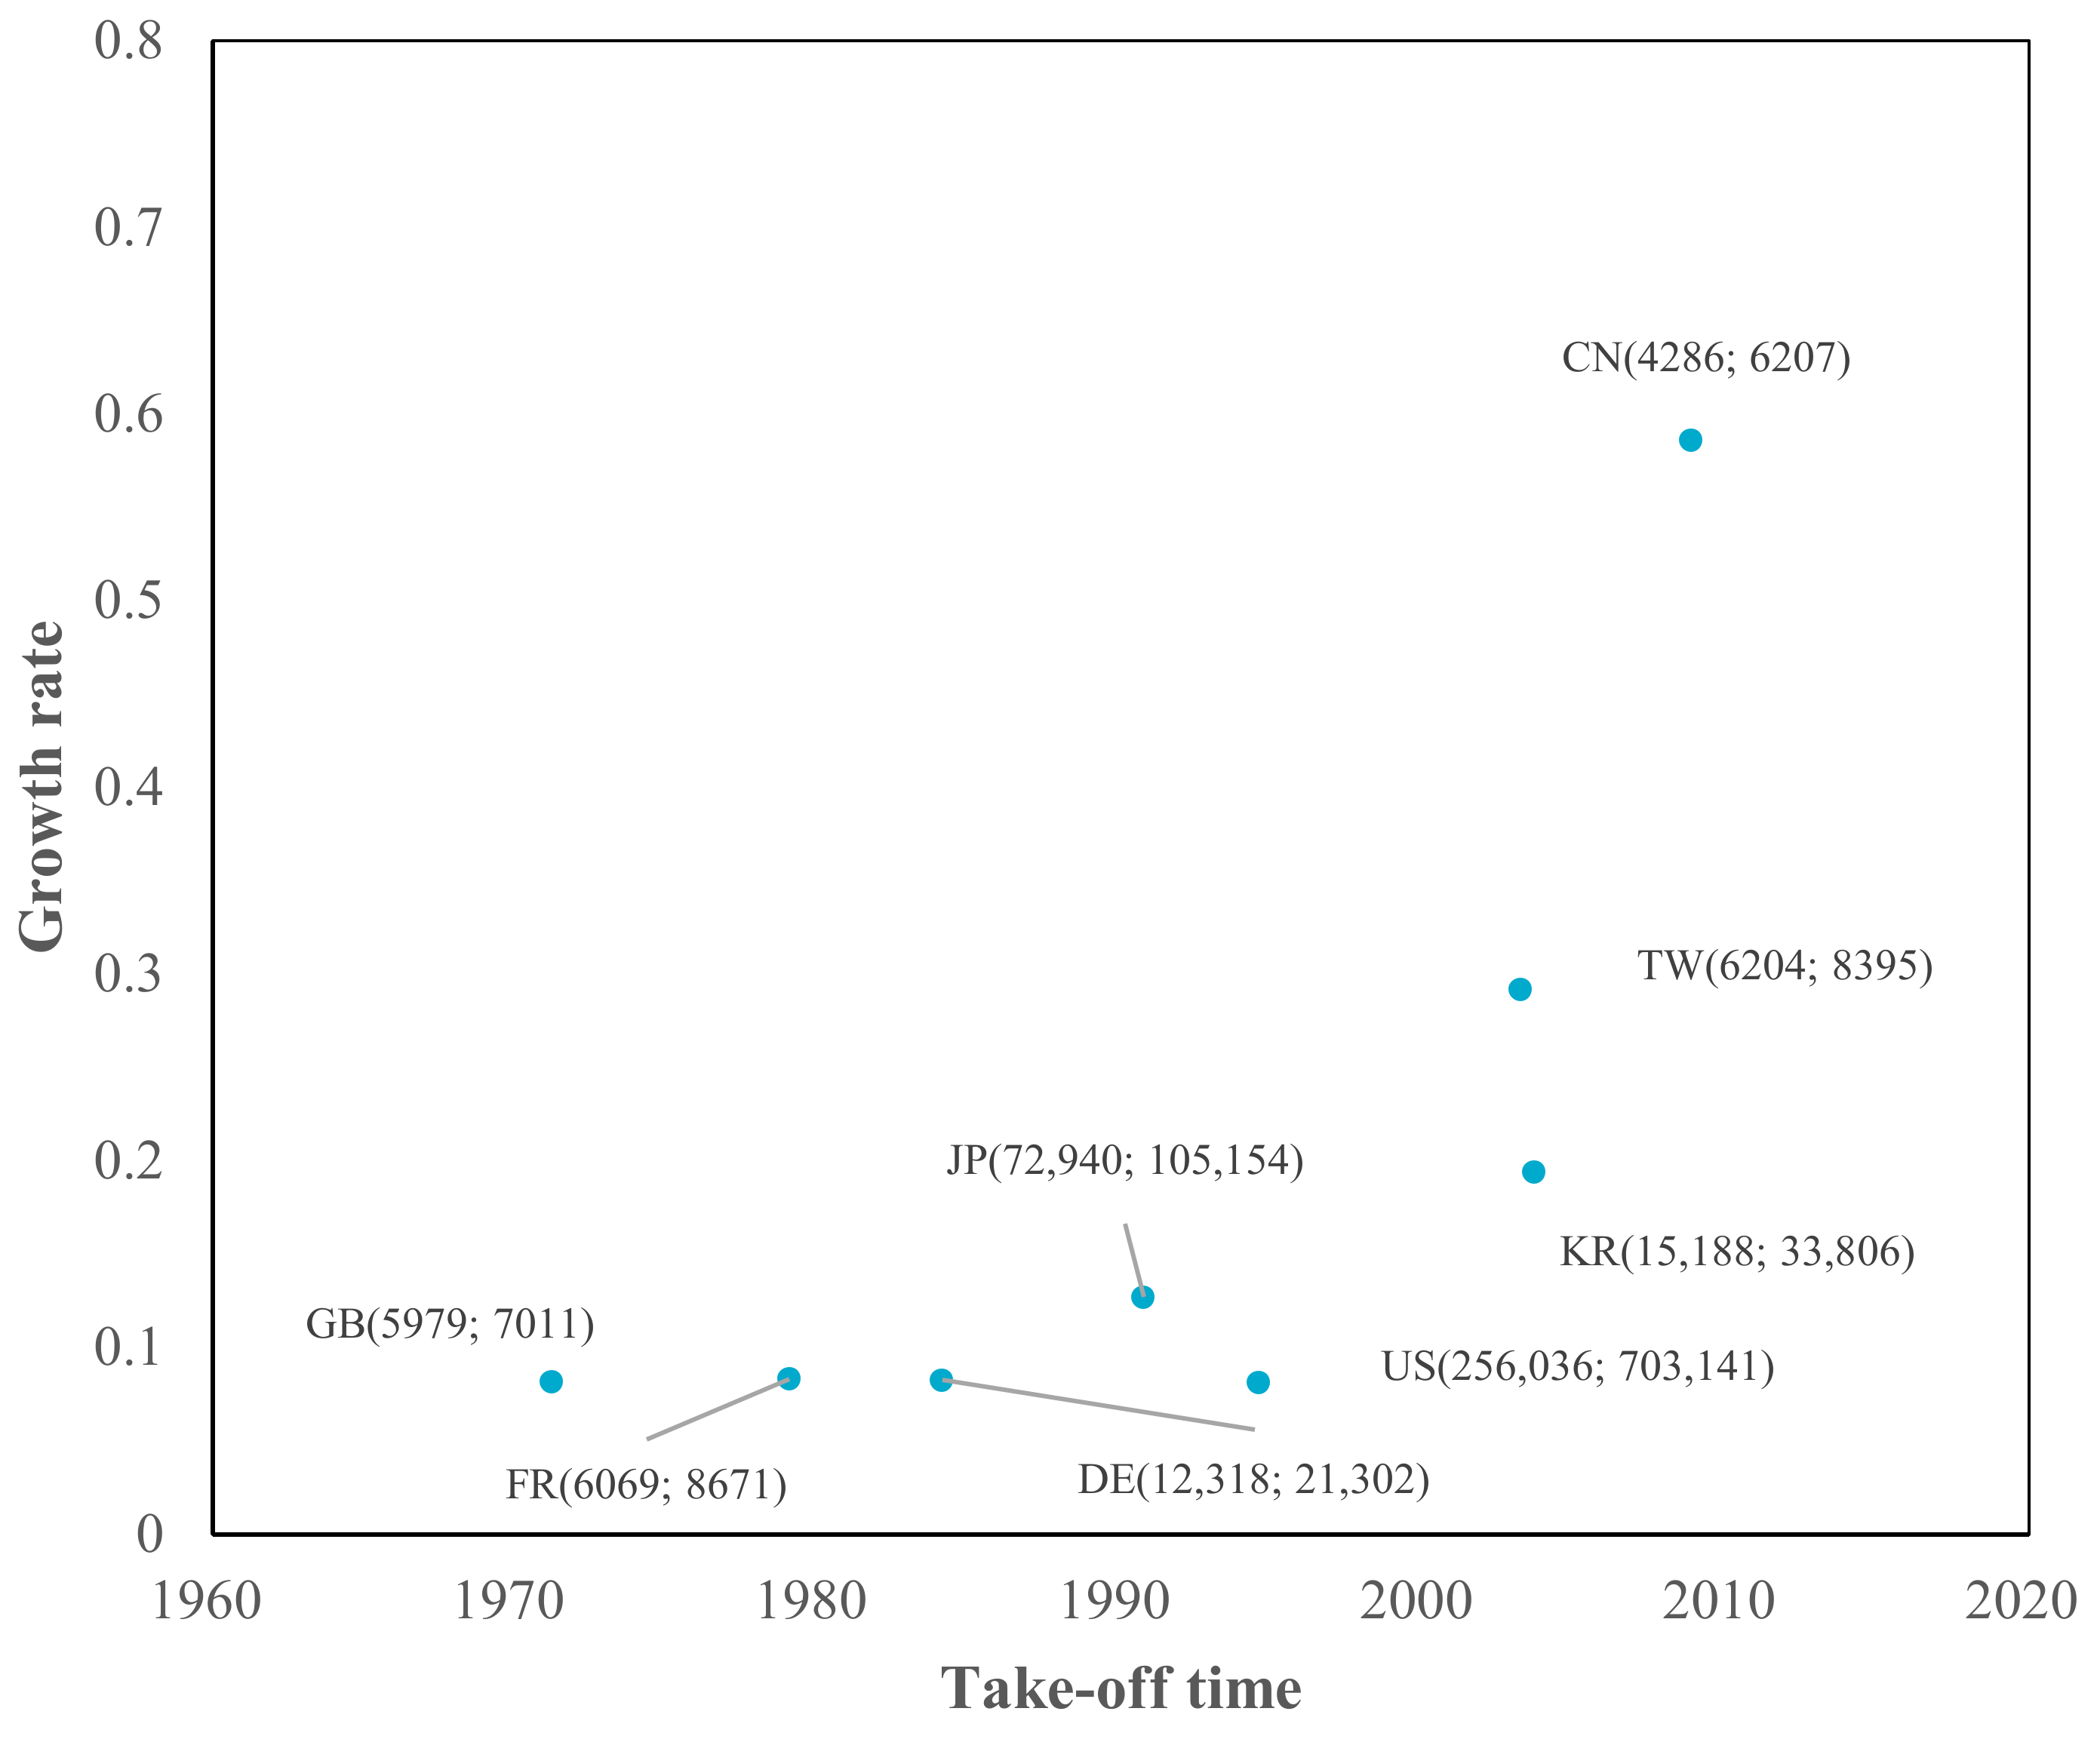
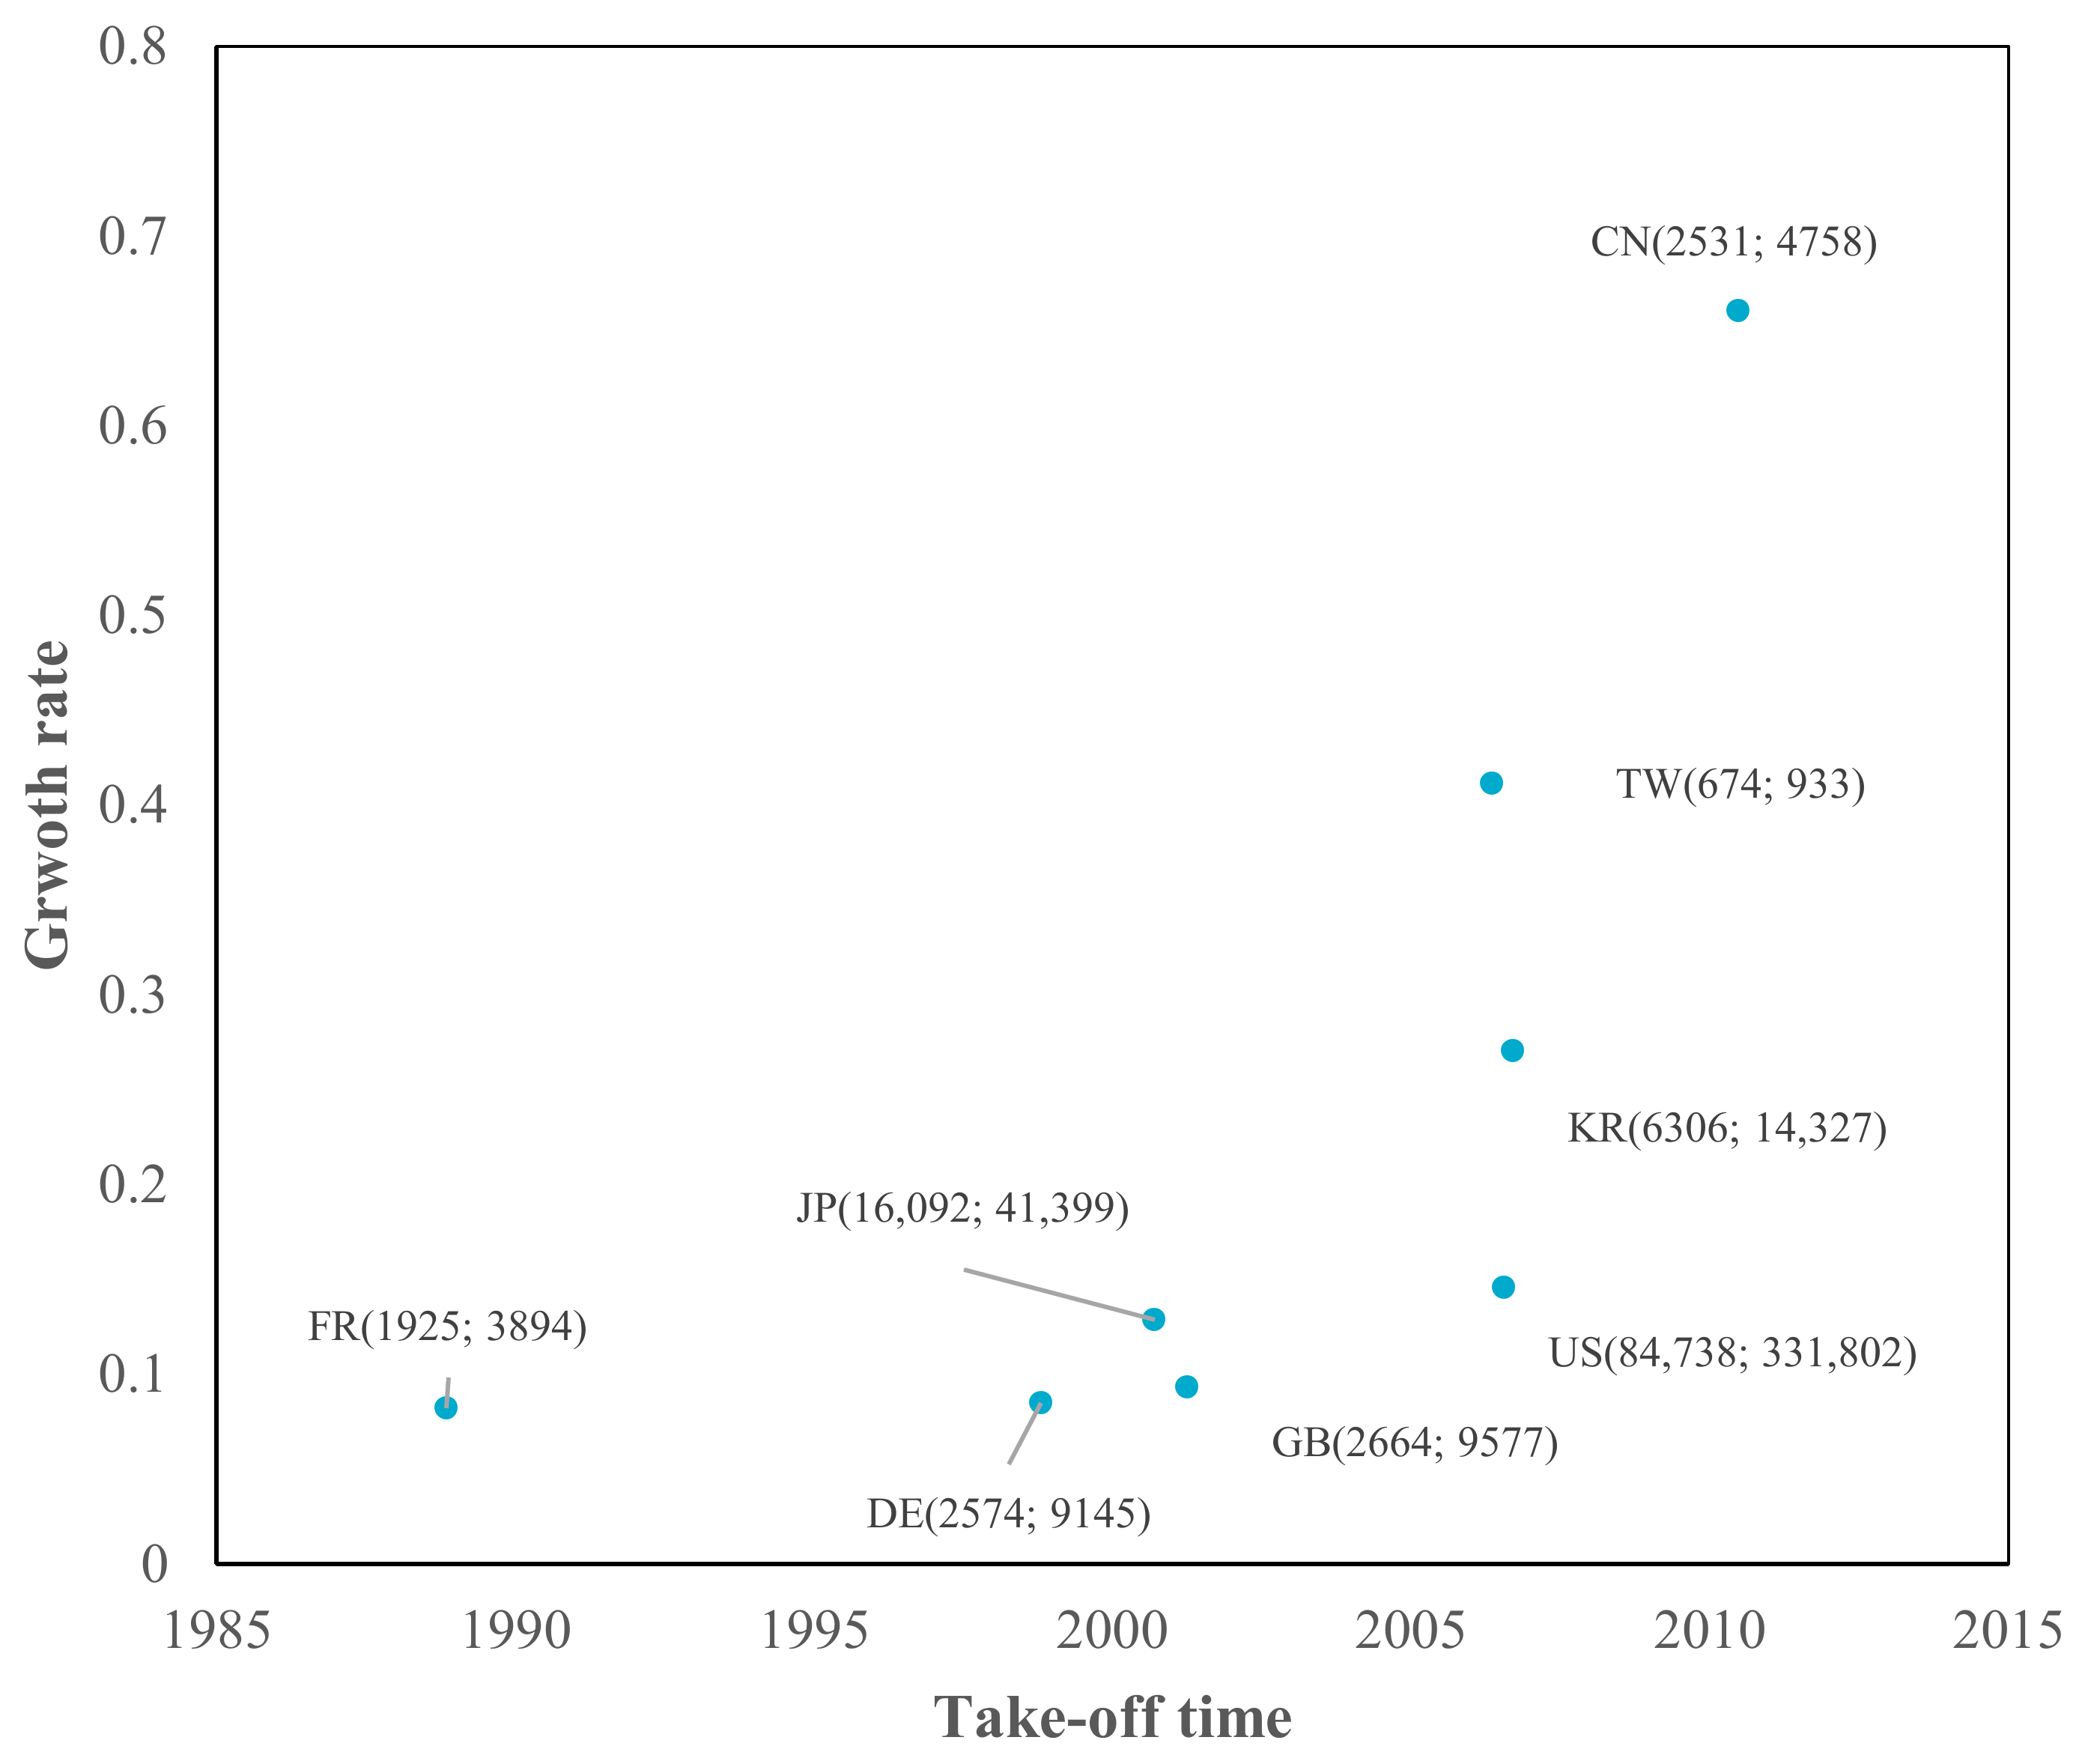
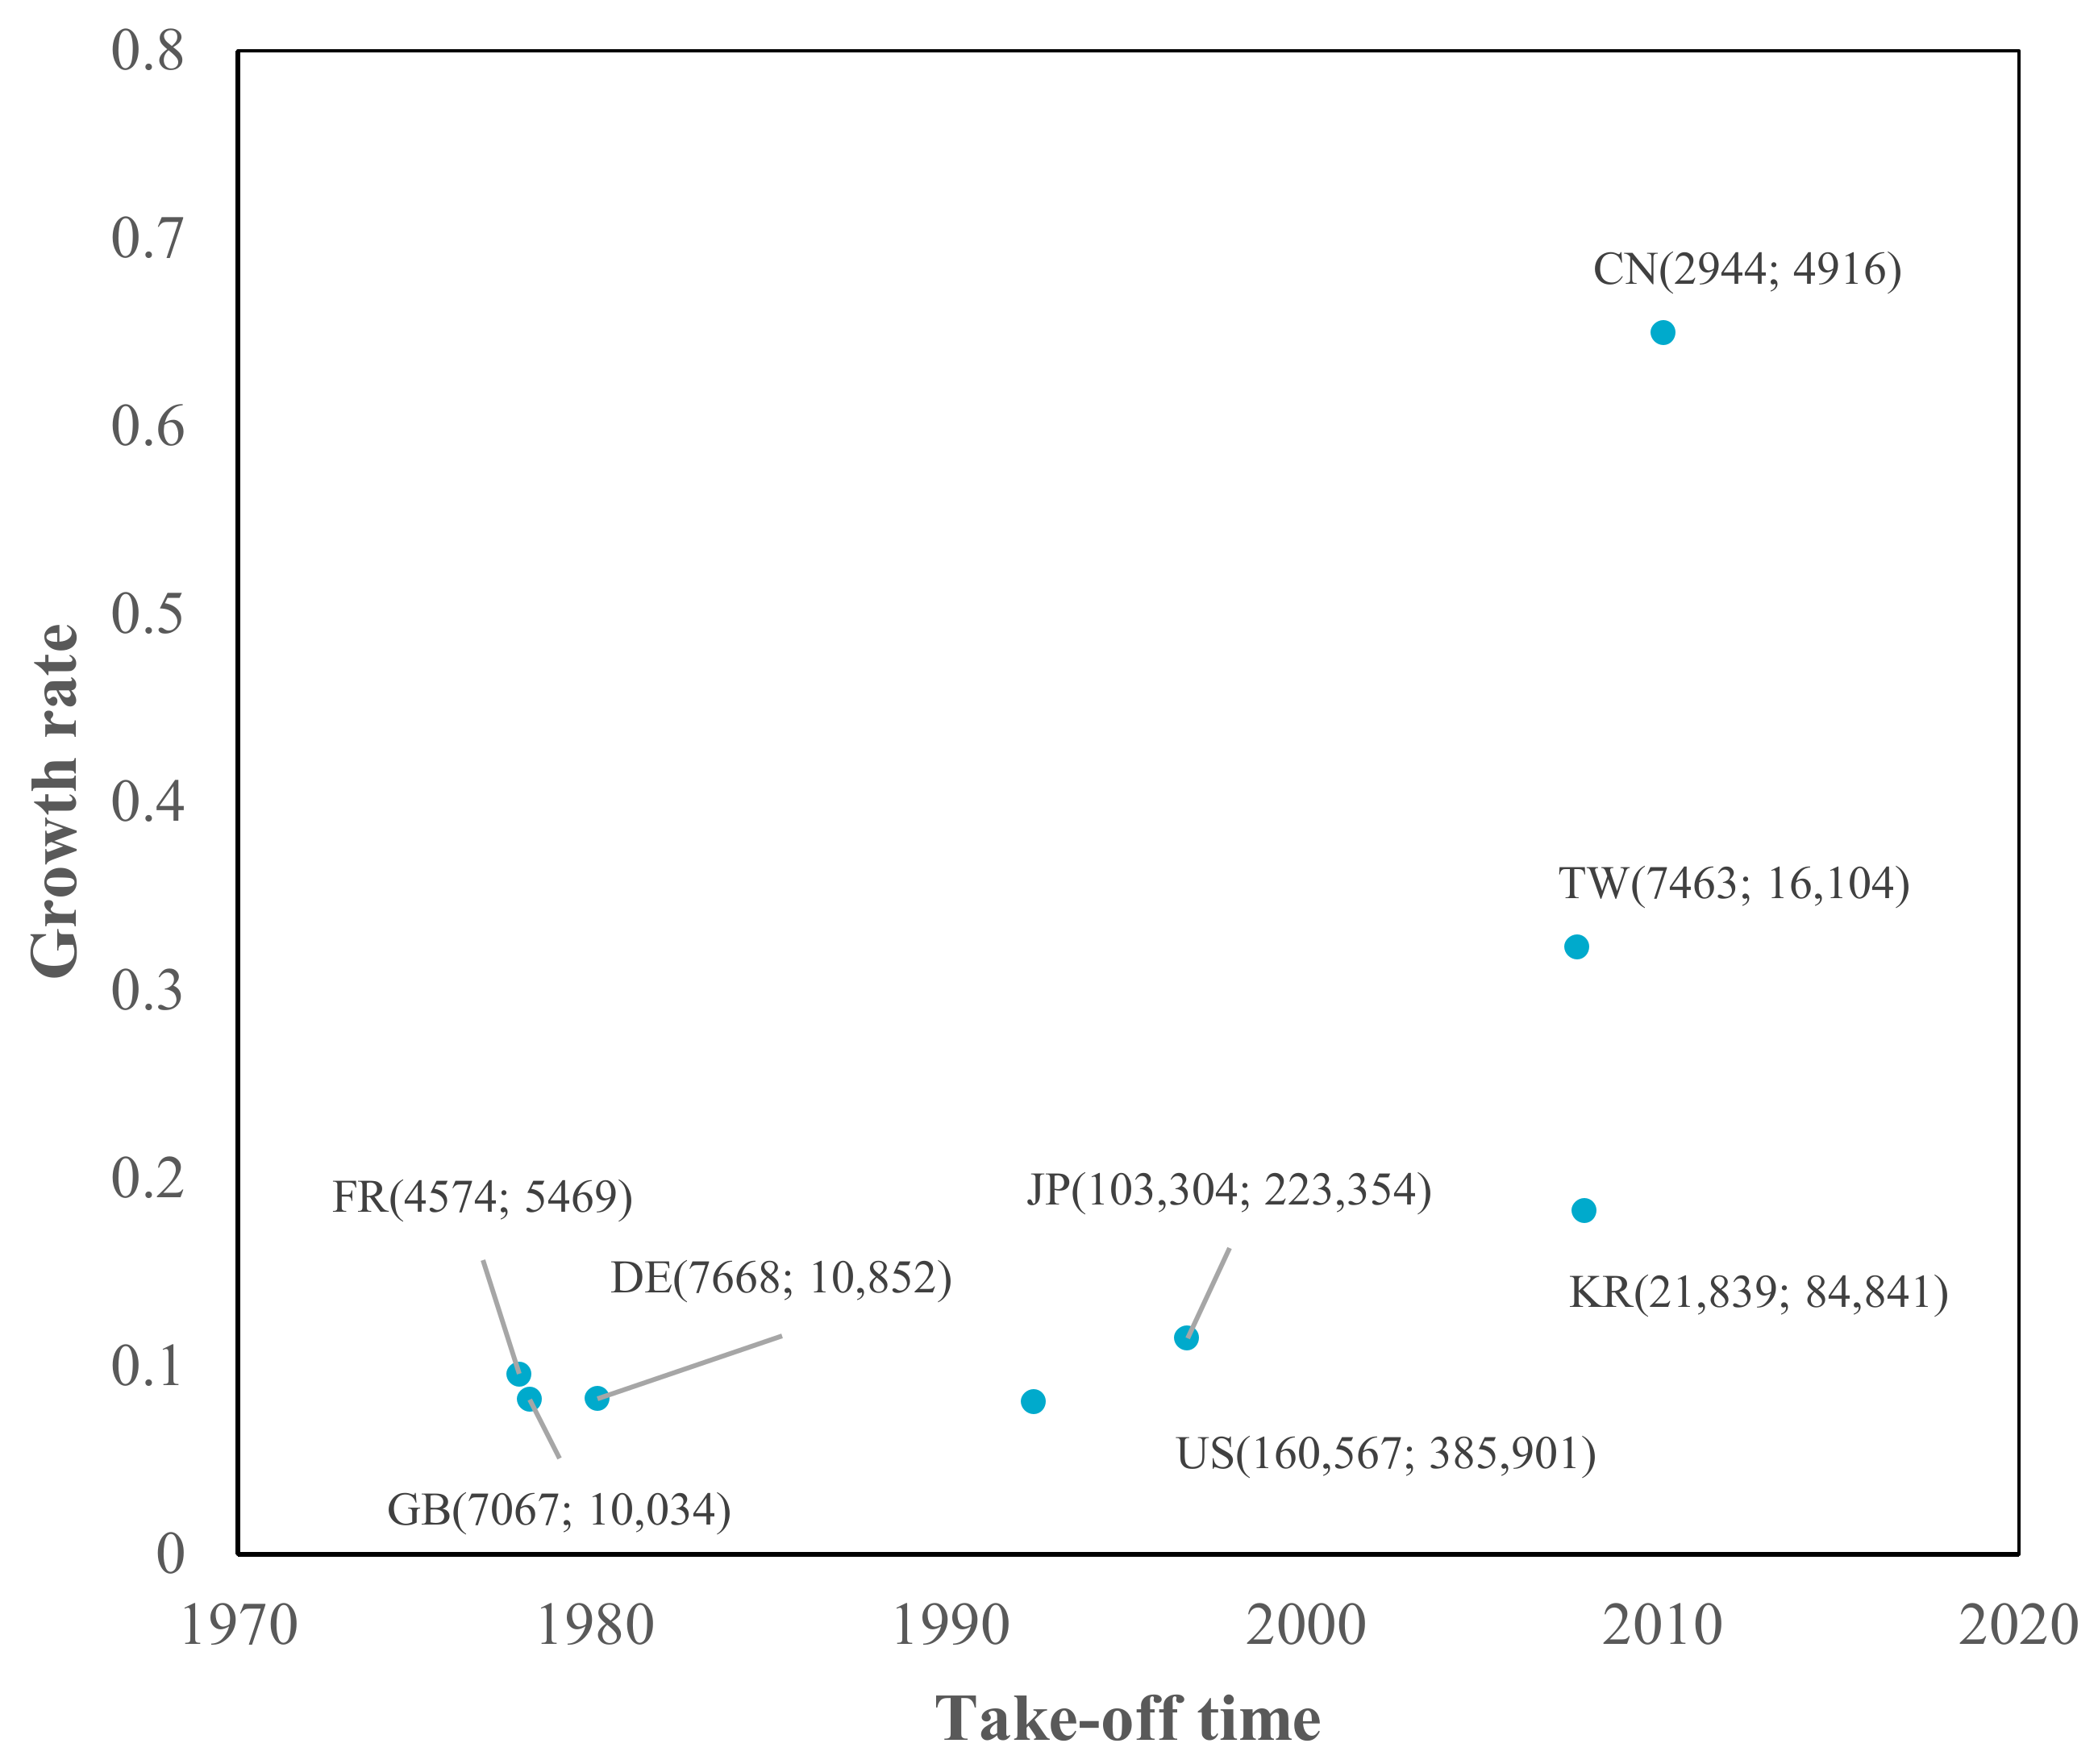
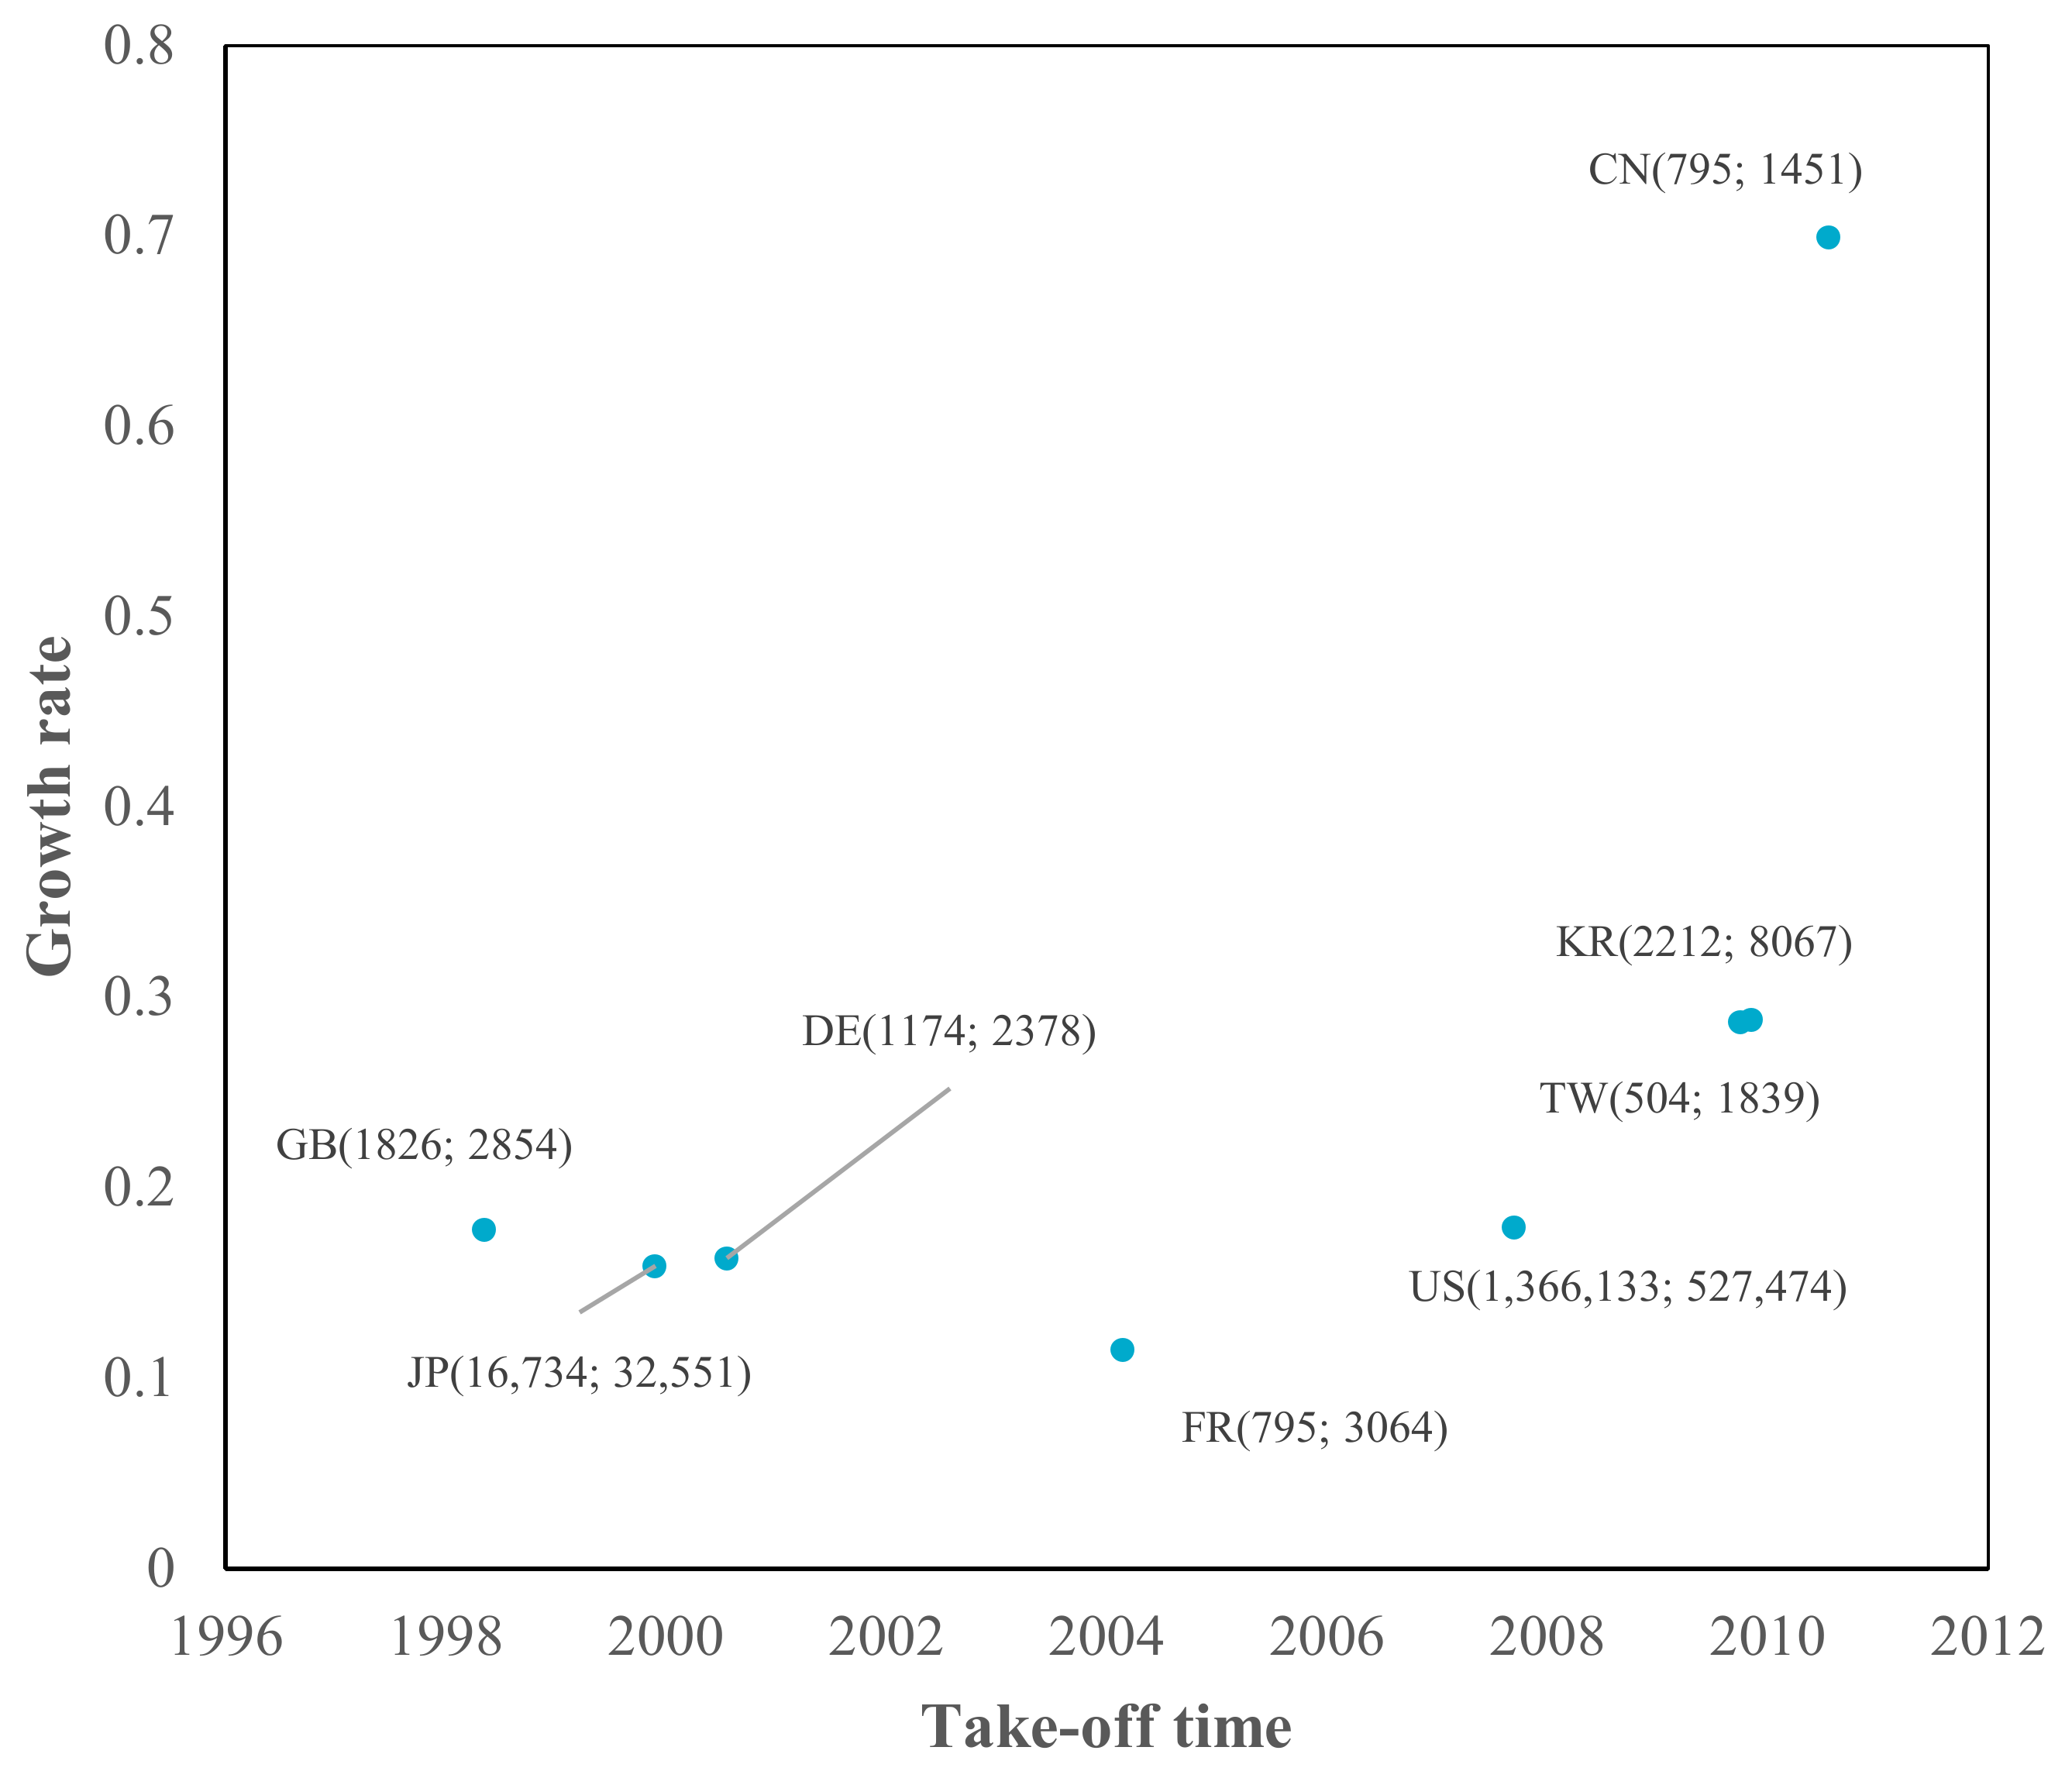
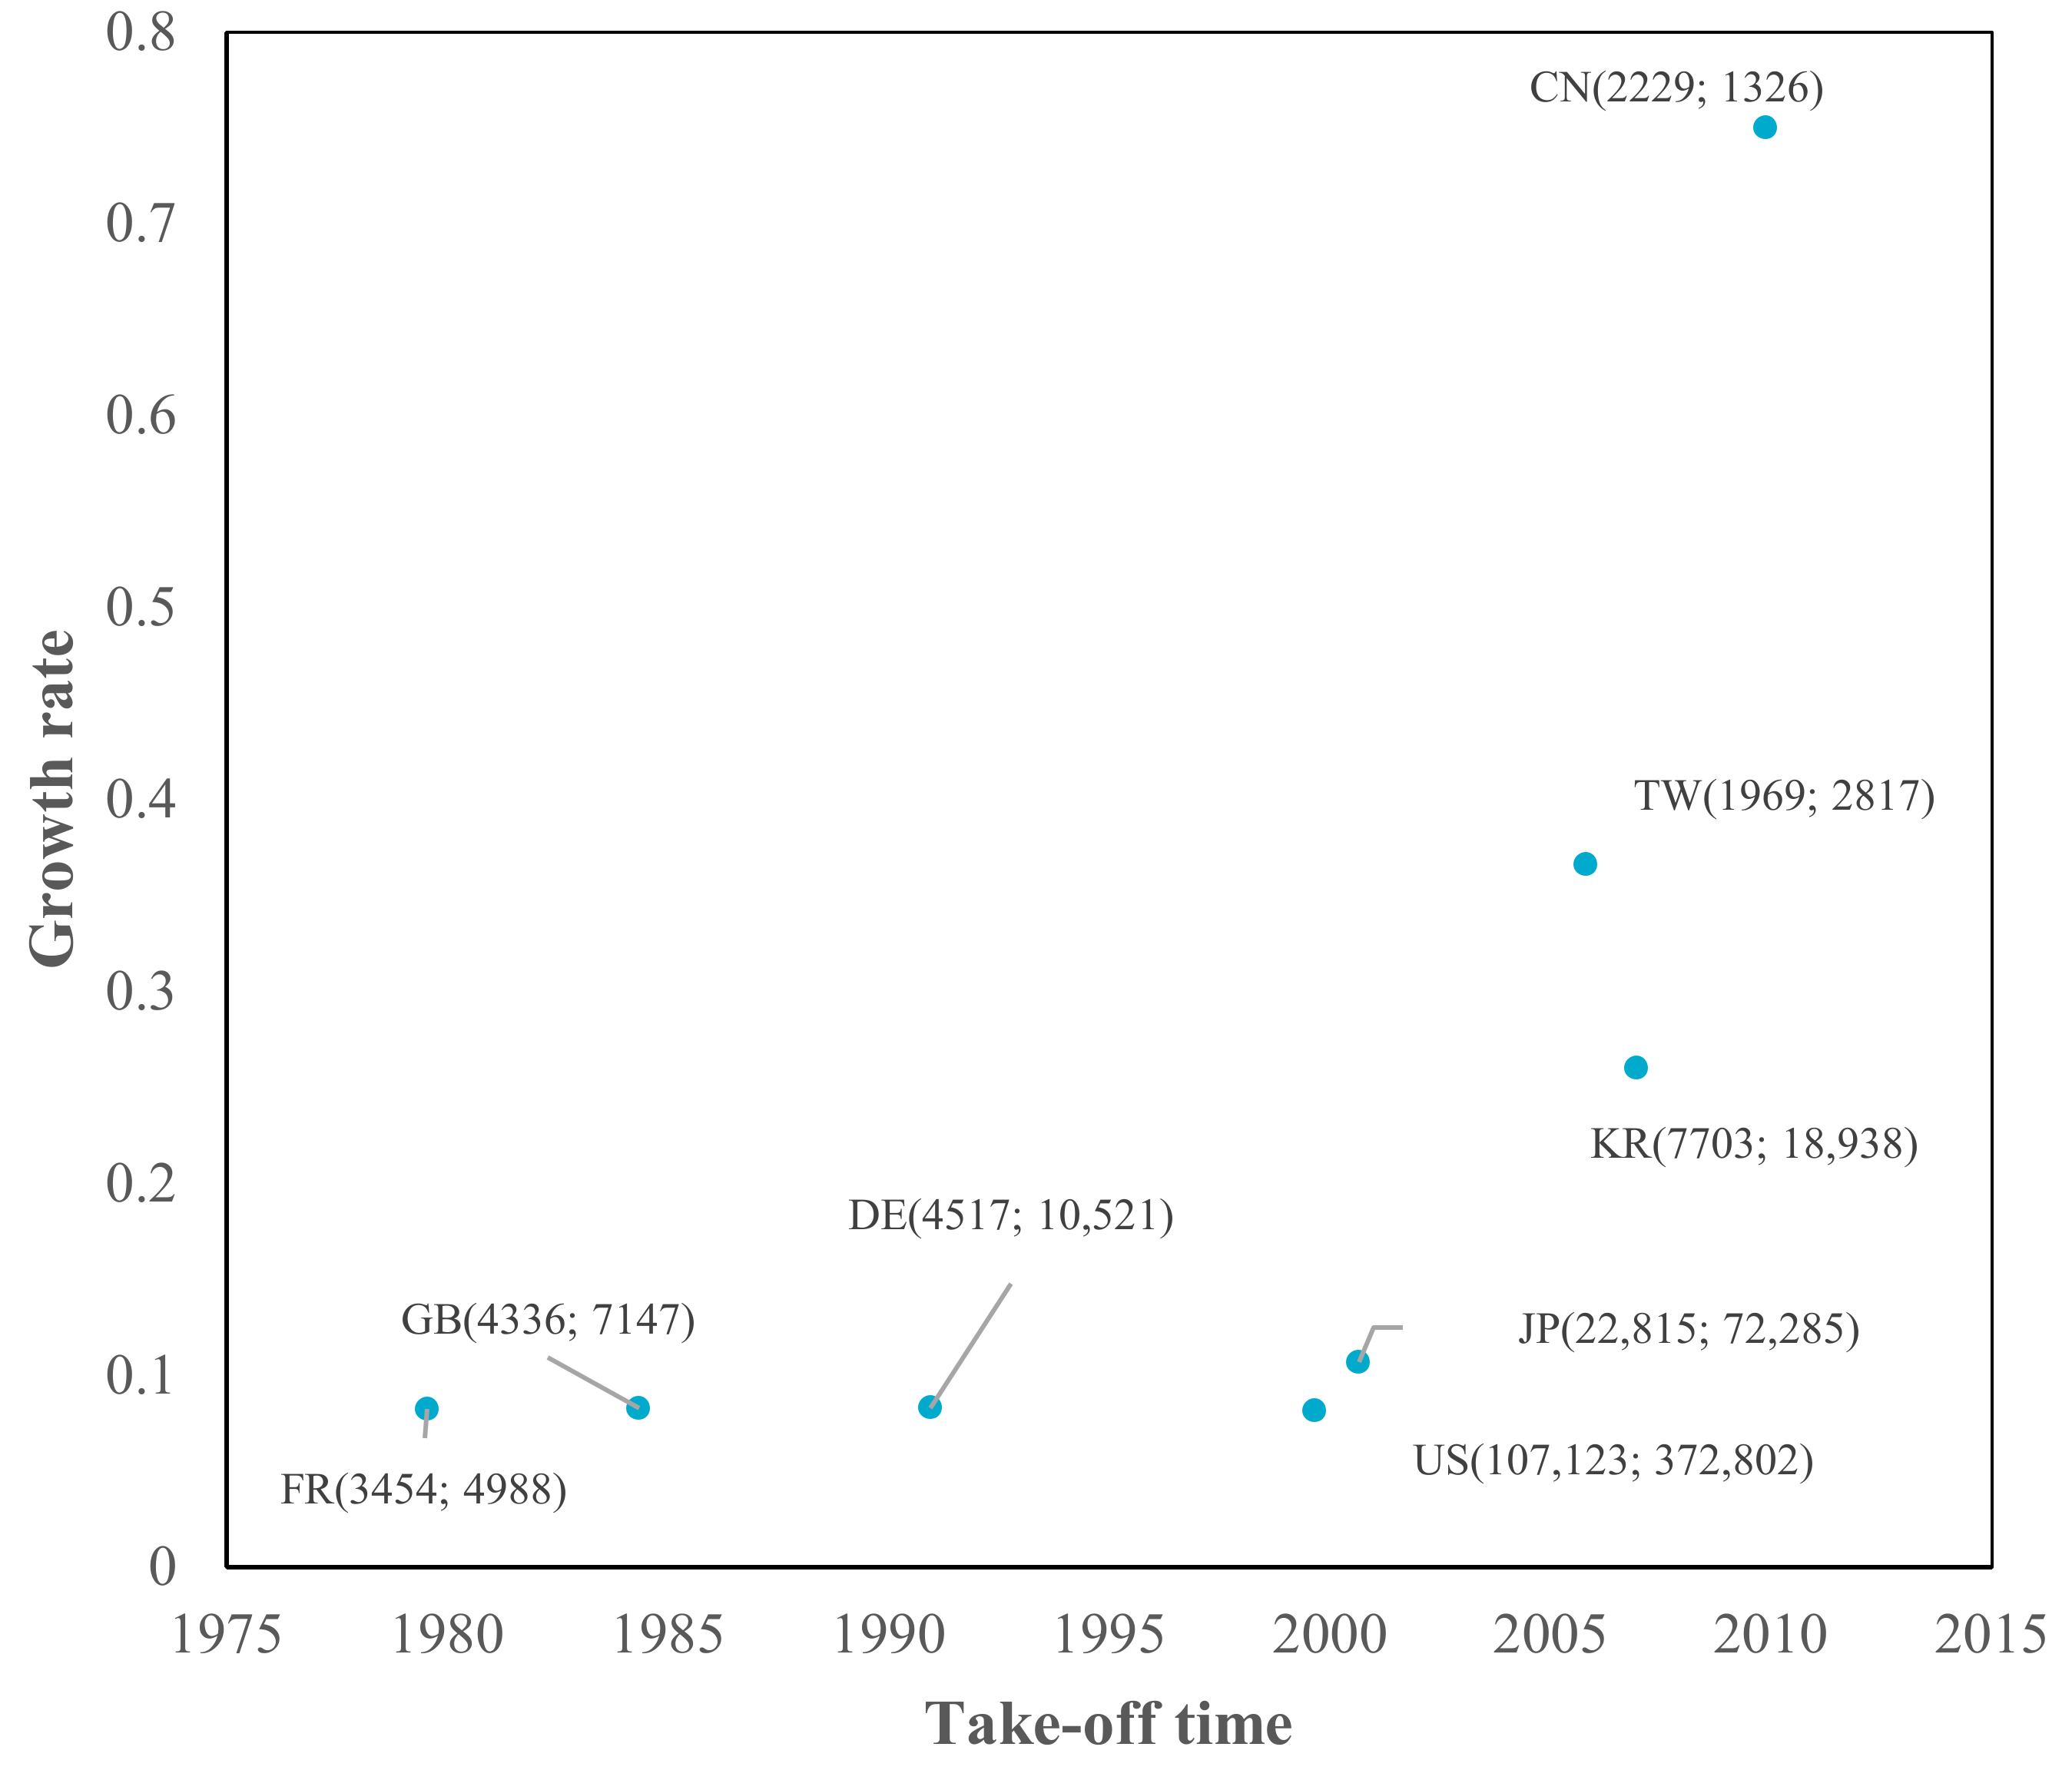
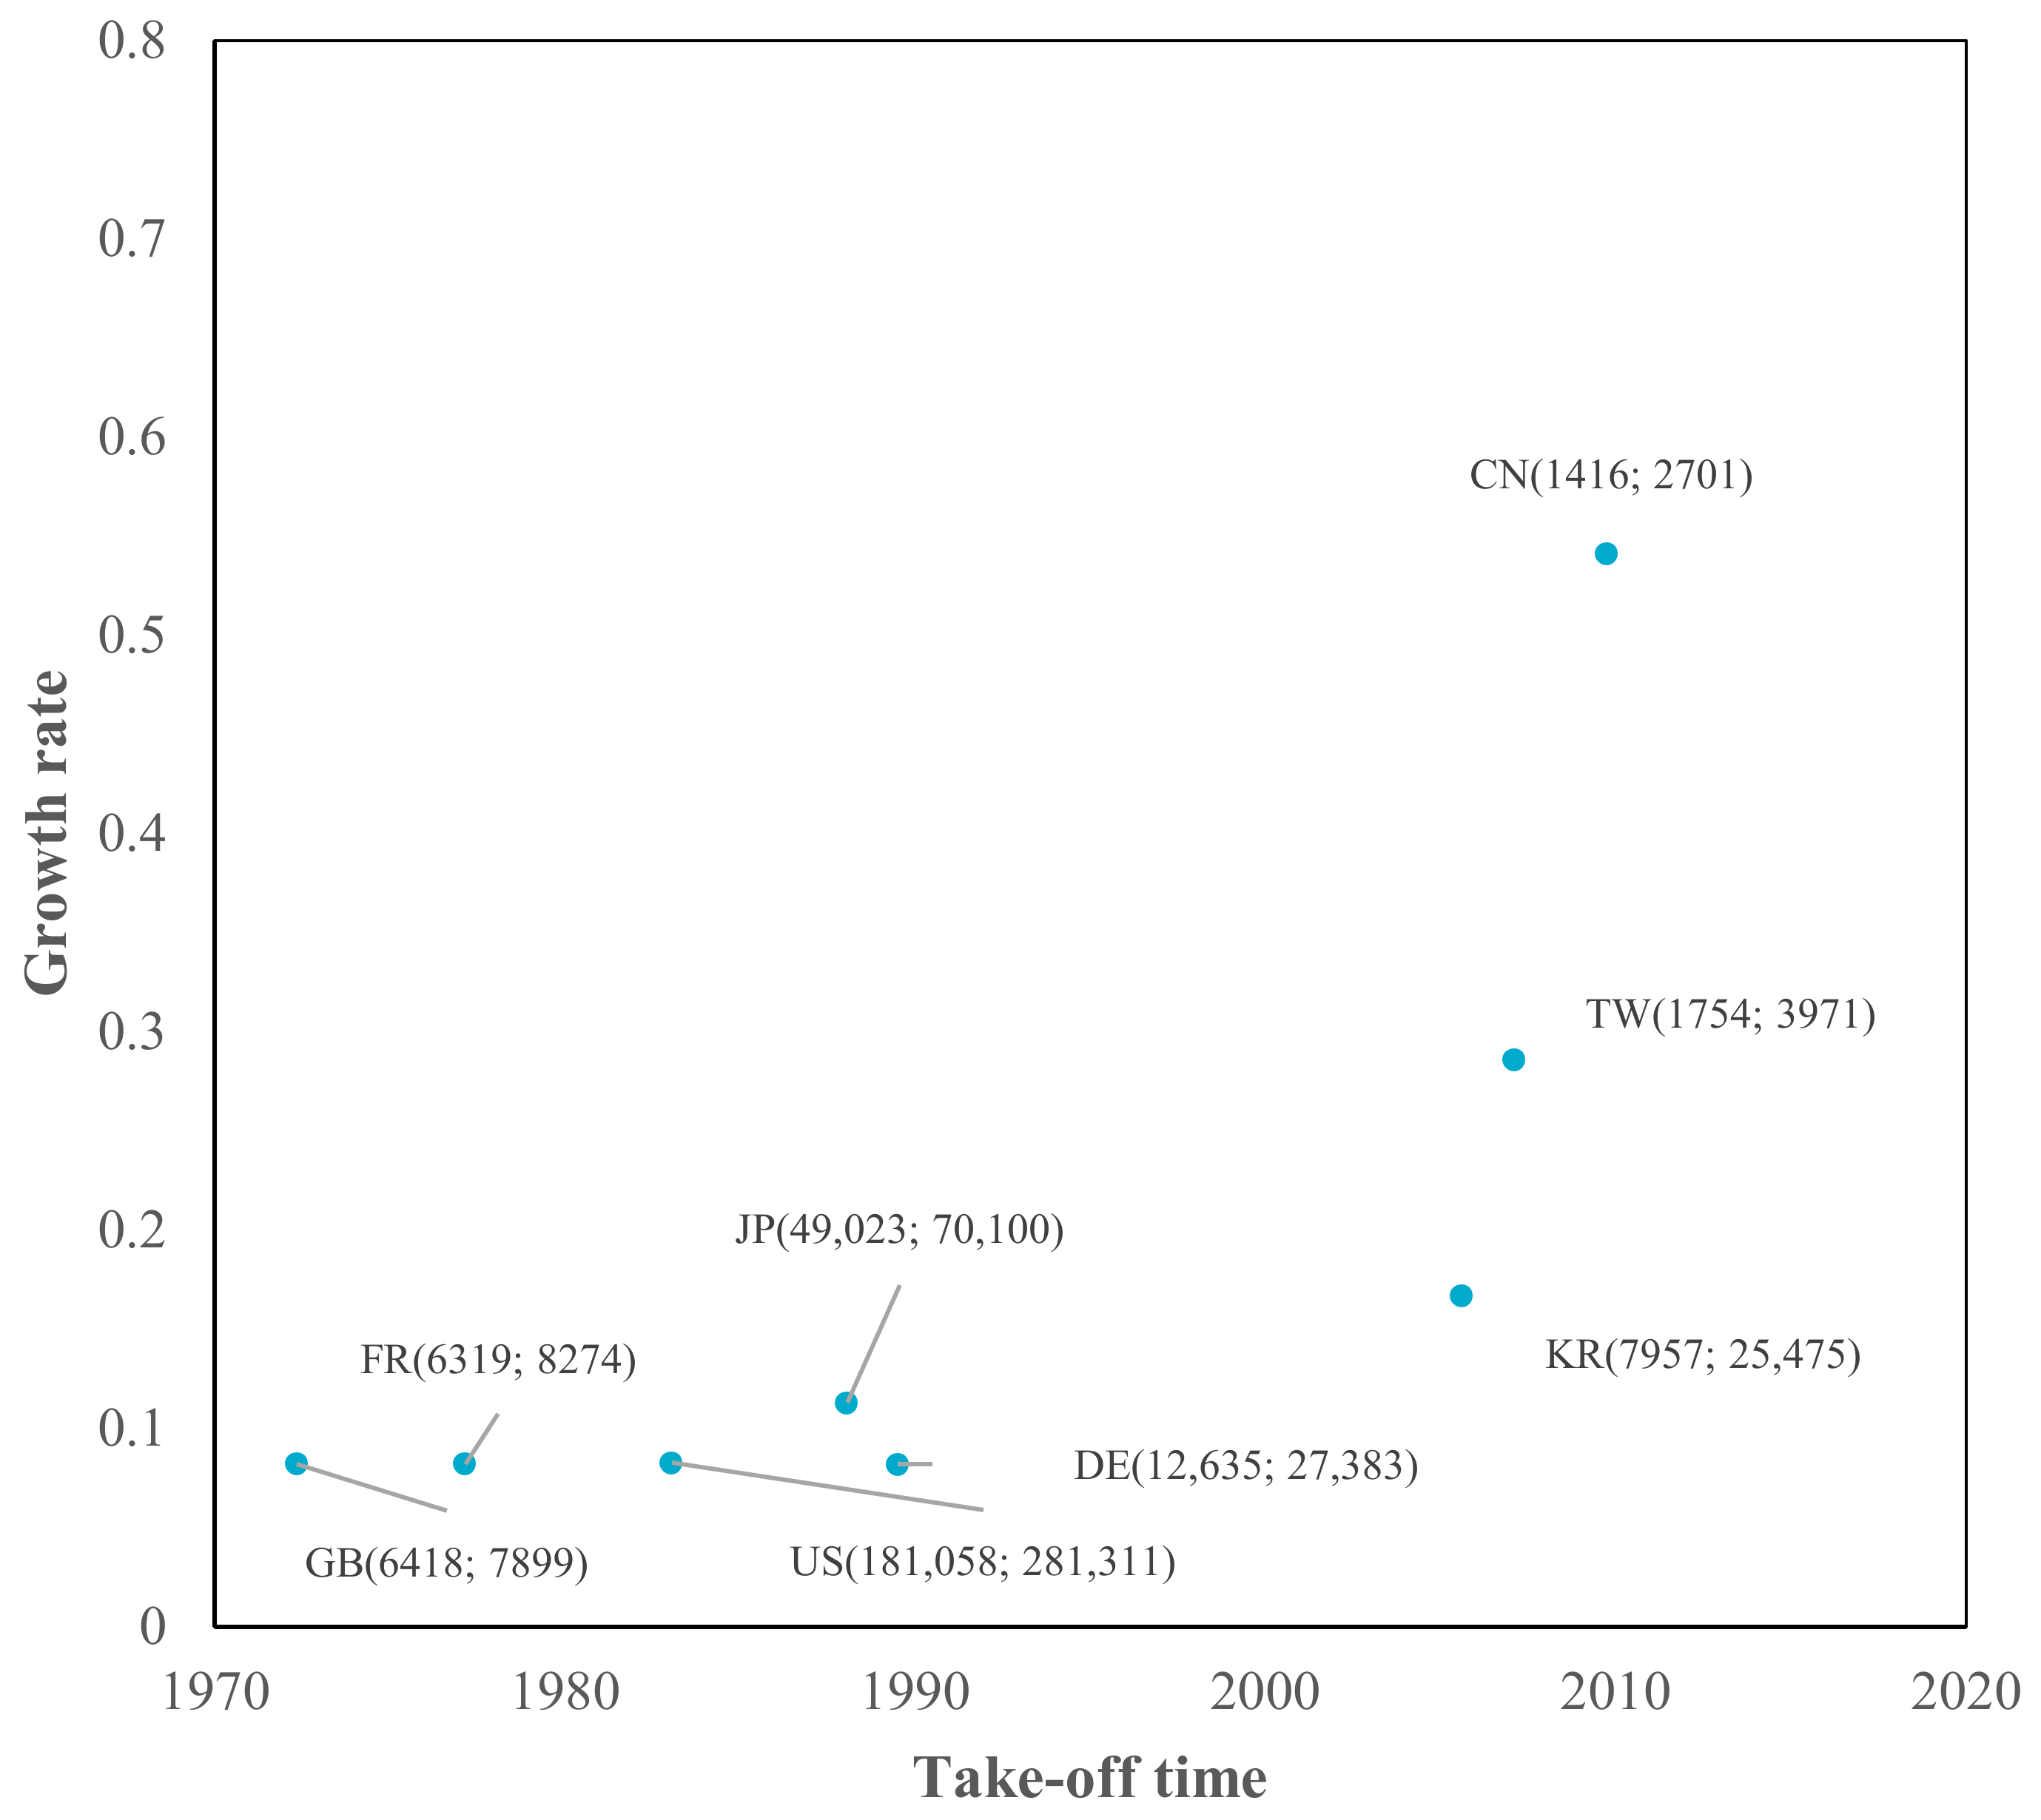
4.1. Overall Catching Up Comparison Based on a Simple Logistic Model
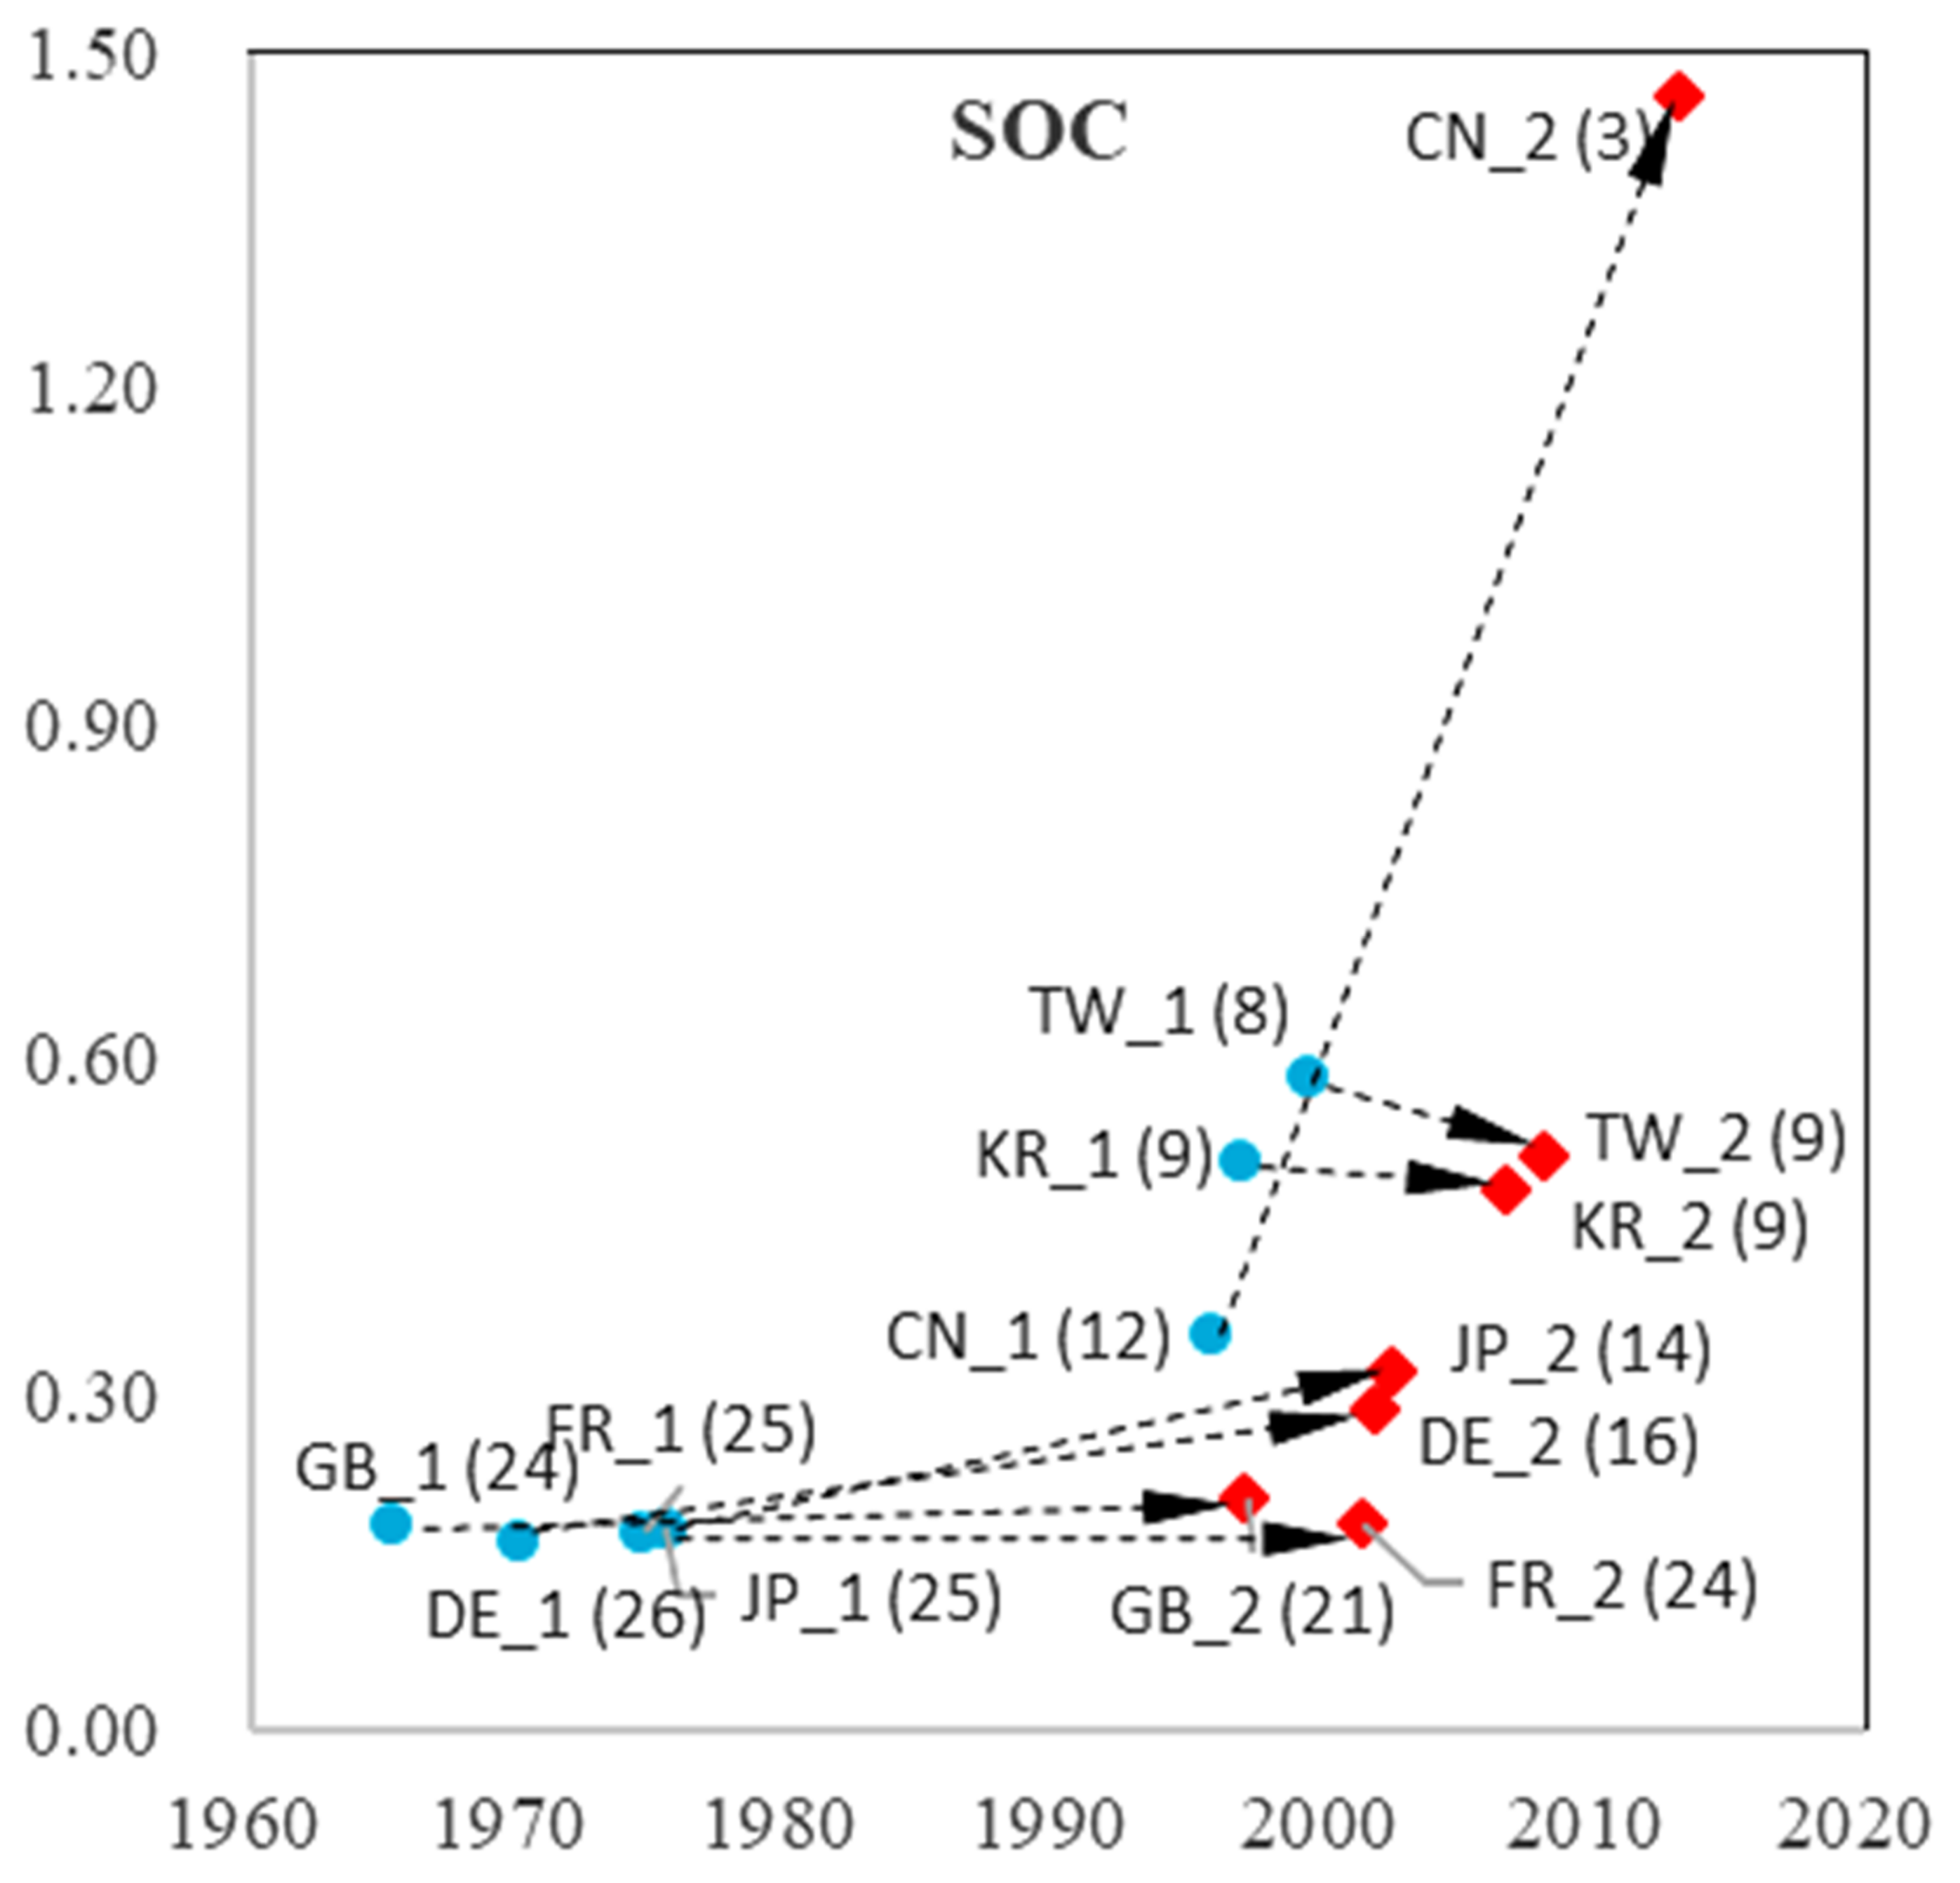
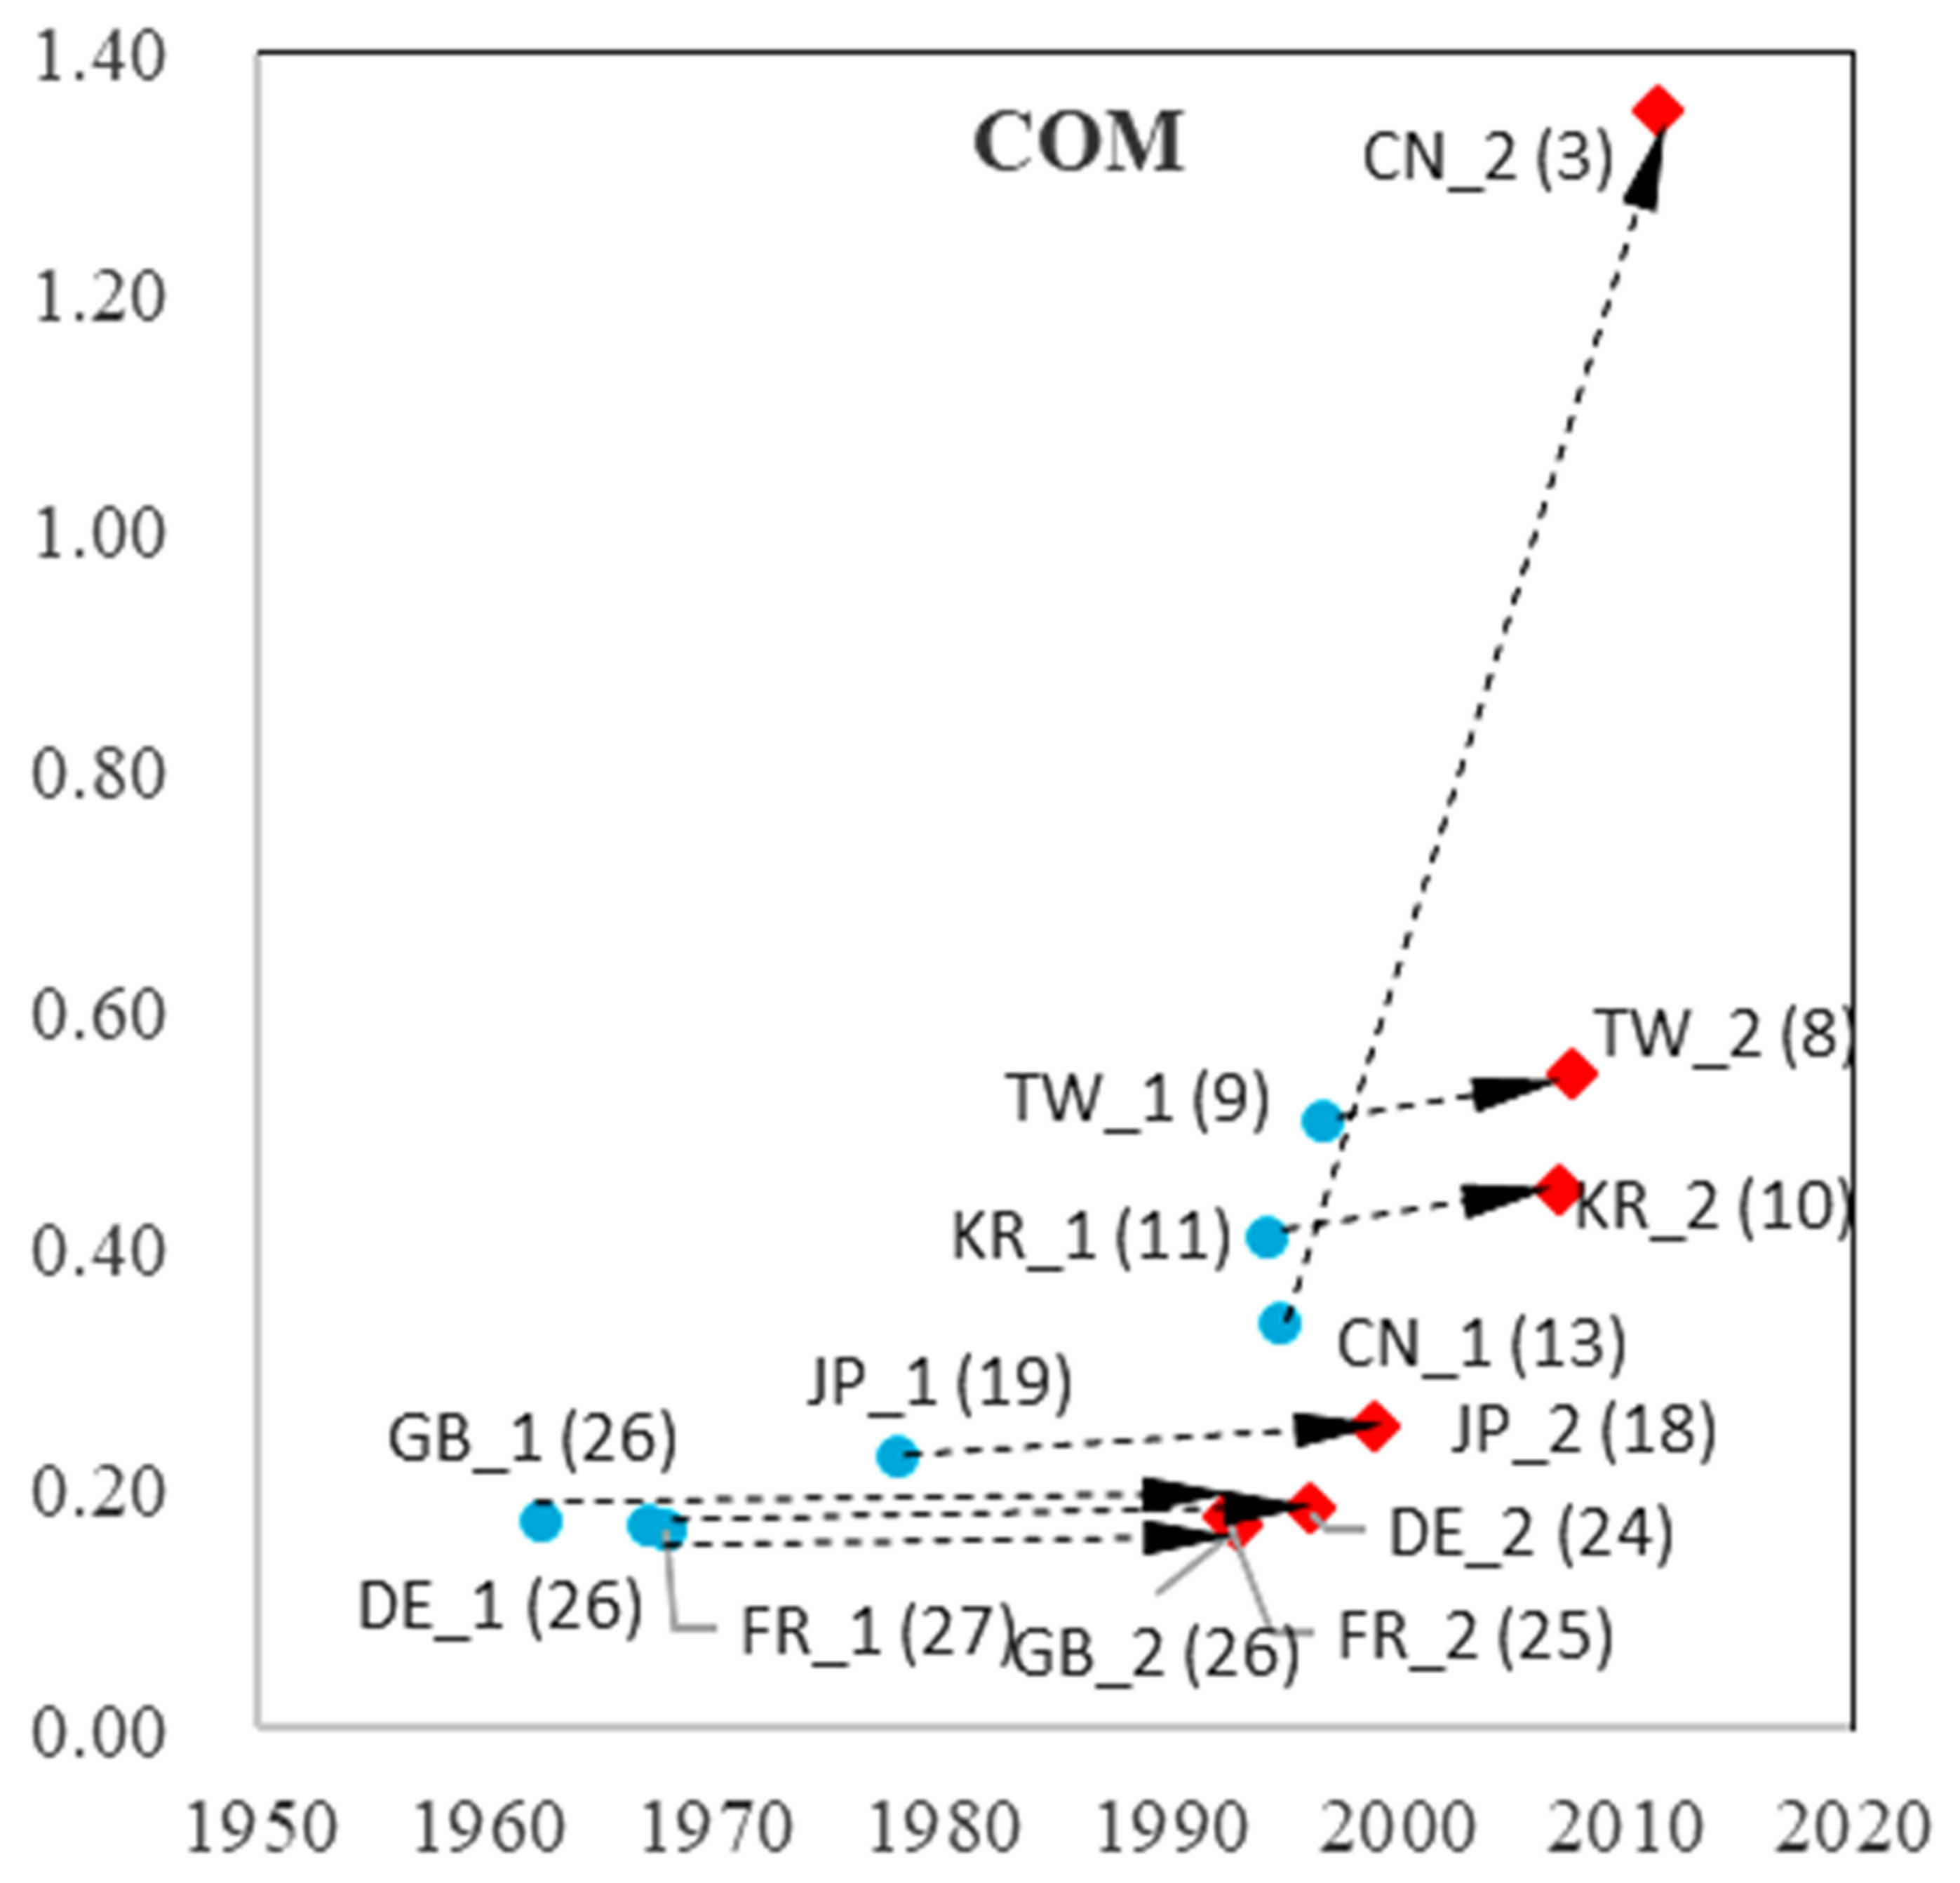
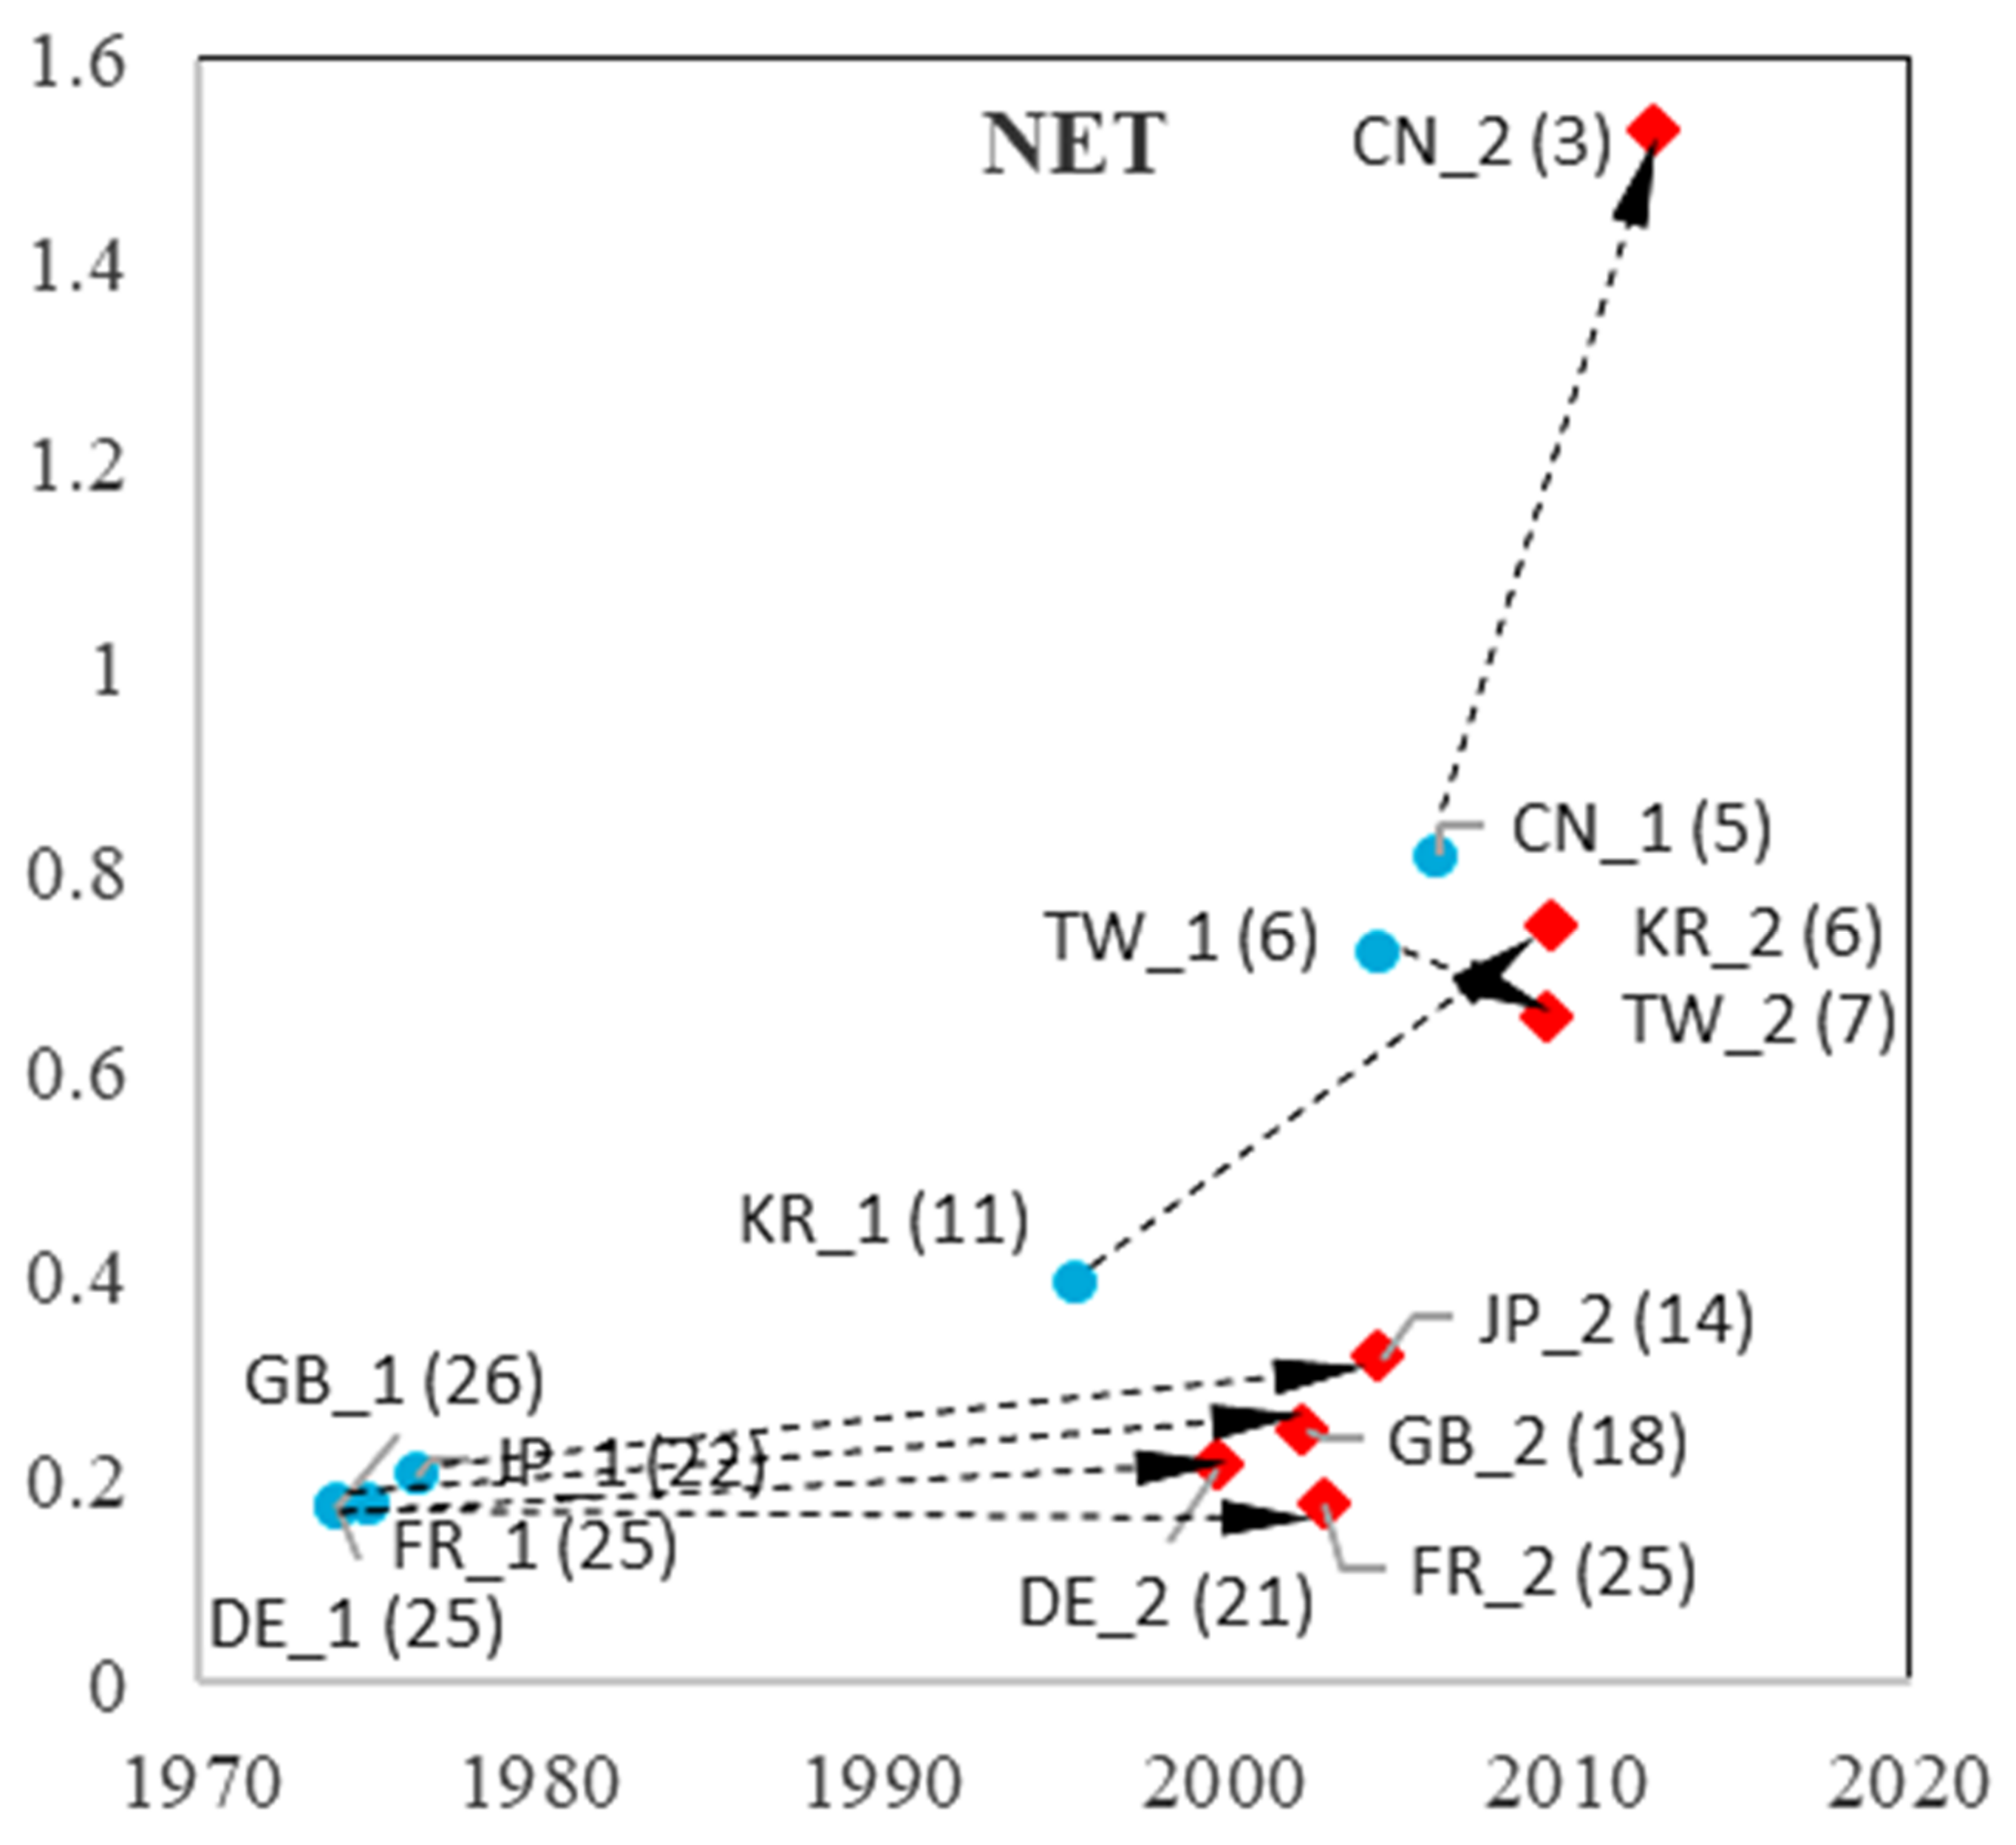
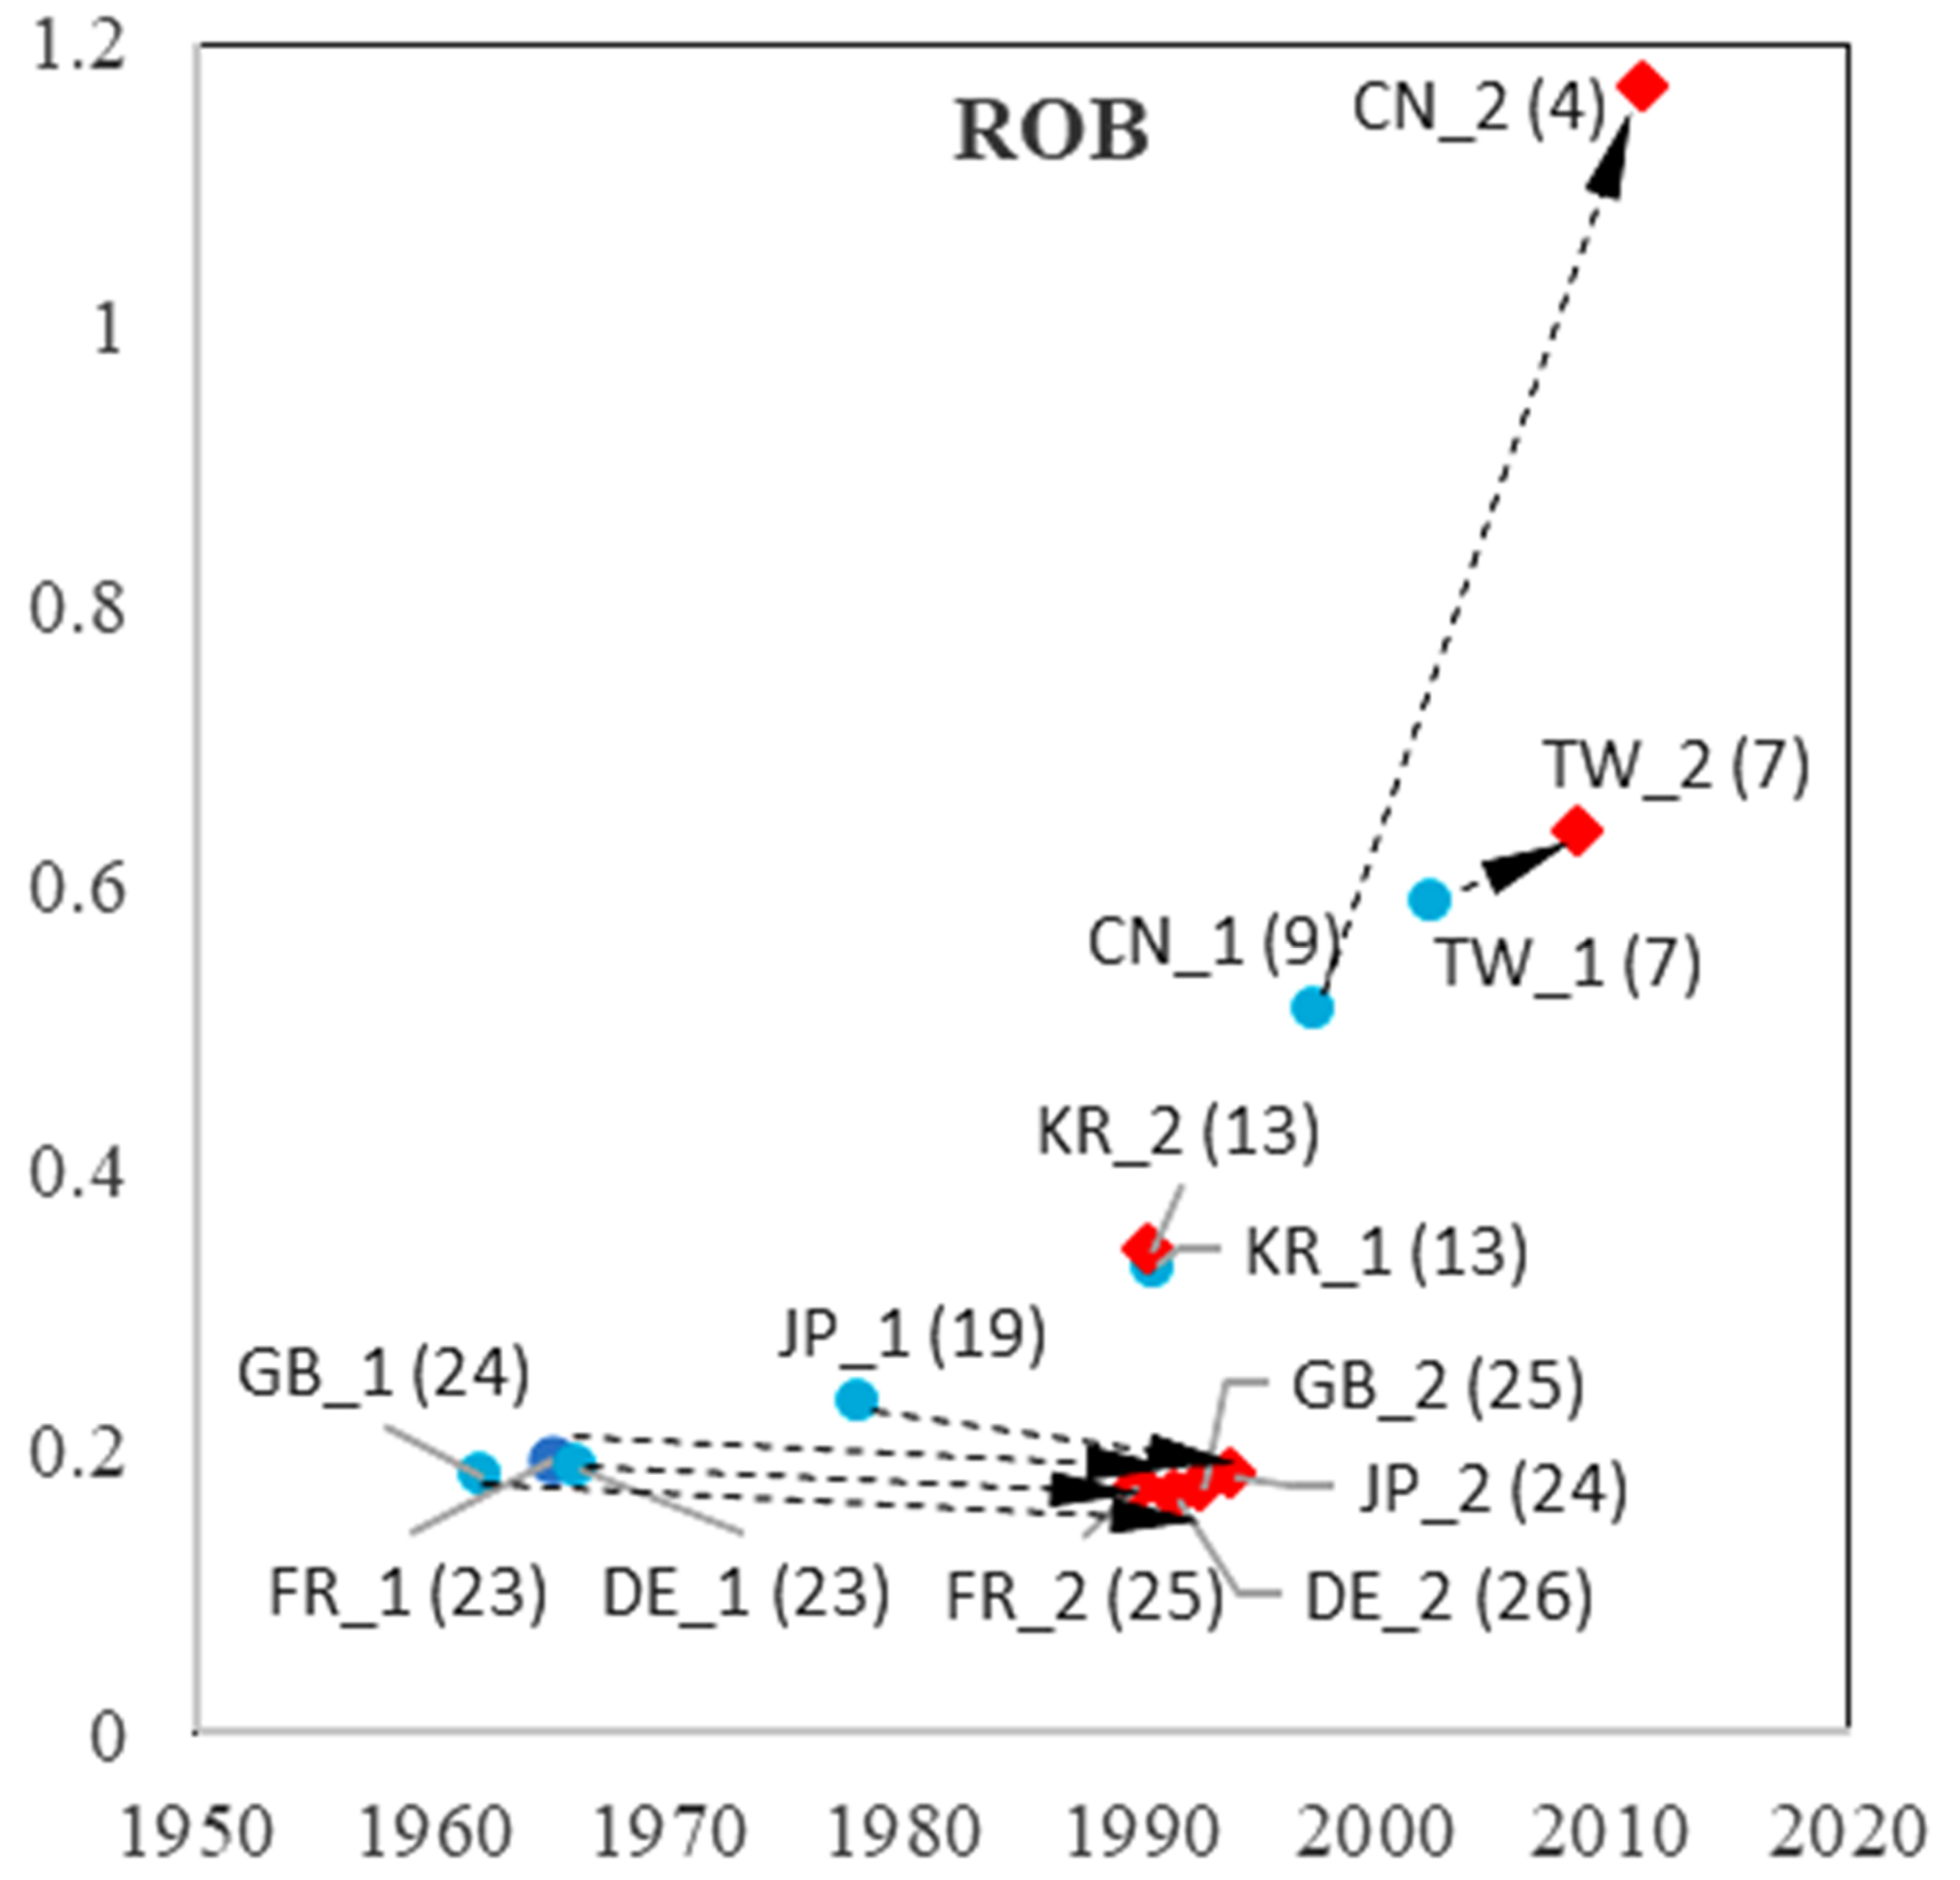
4.2. Analysis of Two Catching-Up Processes Based on a bi-Logistic Model
5. Technological Convergence Analysis
6. Conclusions, Policy Implications, and Limitations
Author Contributions
Funding
Institutional Review Board Statement
Informed Consent Statement
Data Availability Statement
Conflicts of Interest
Appendix A
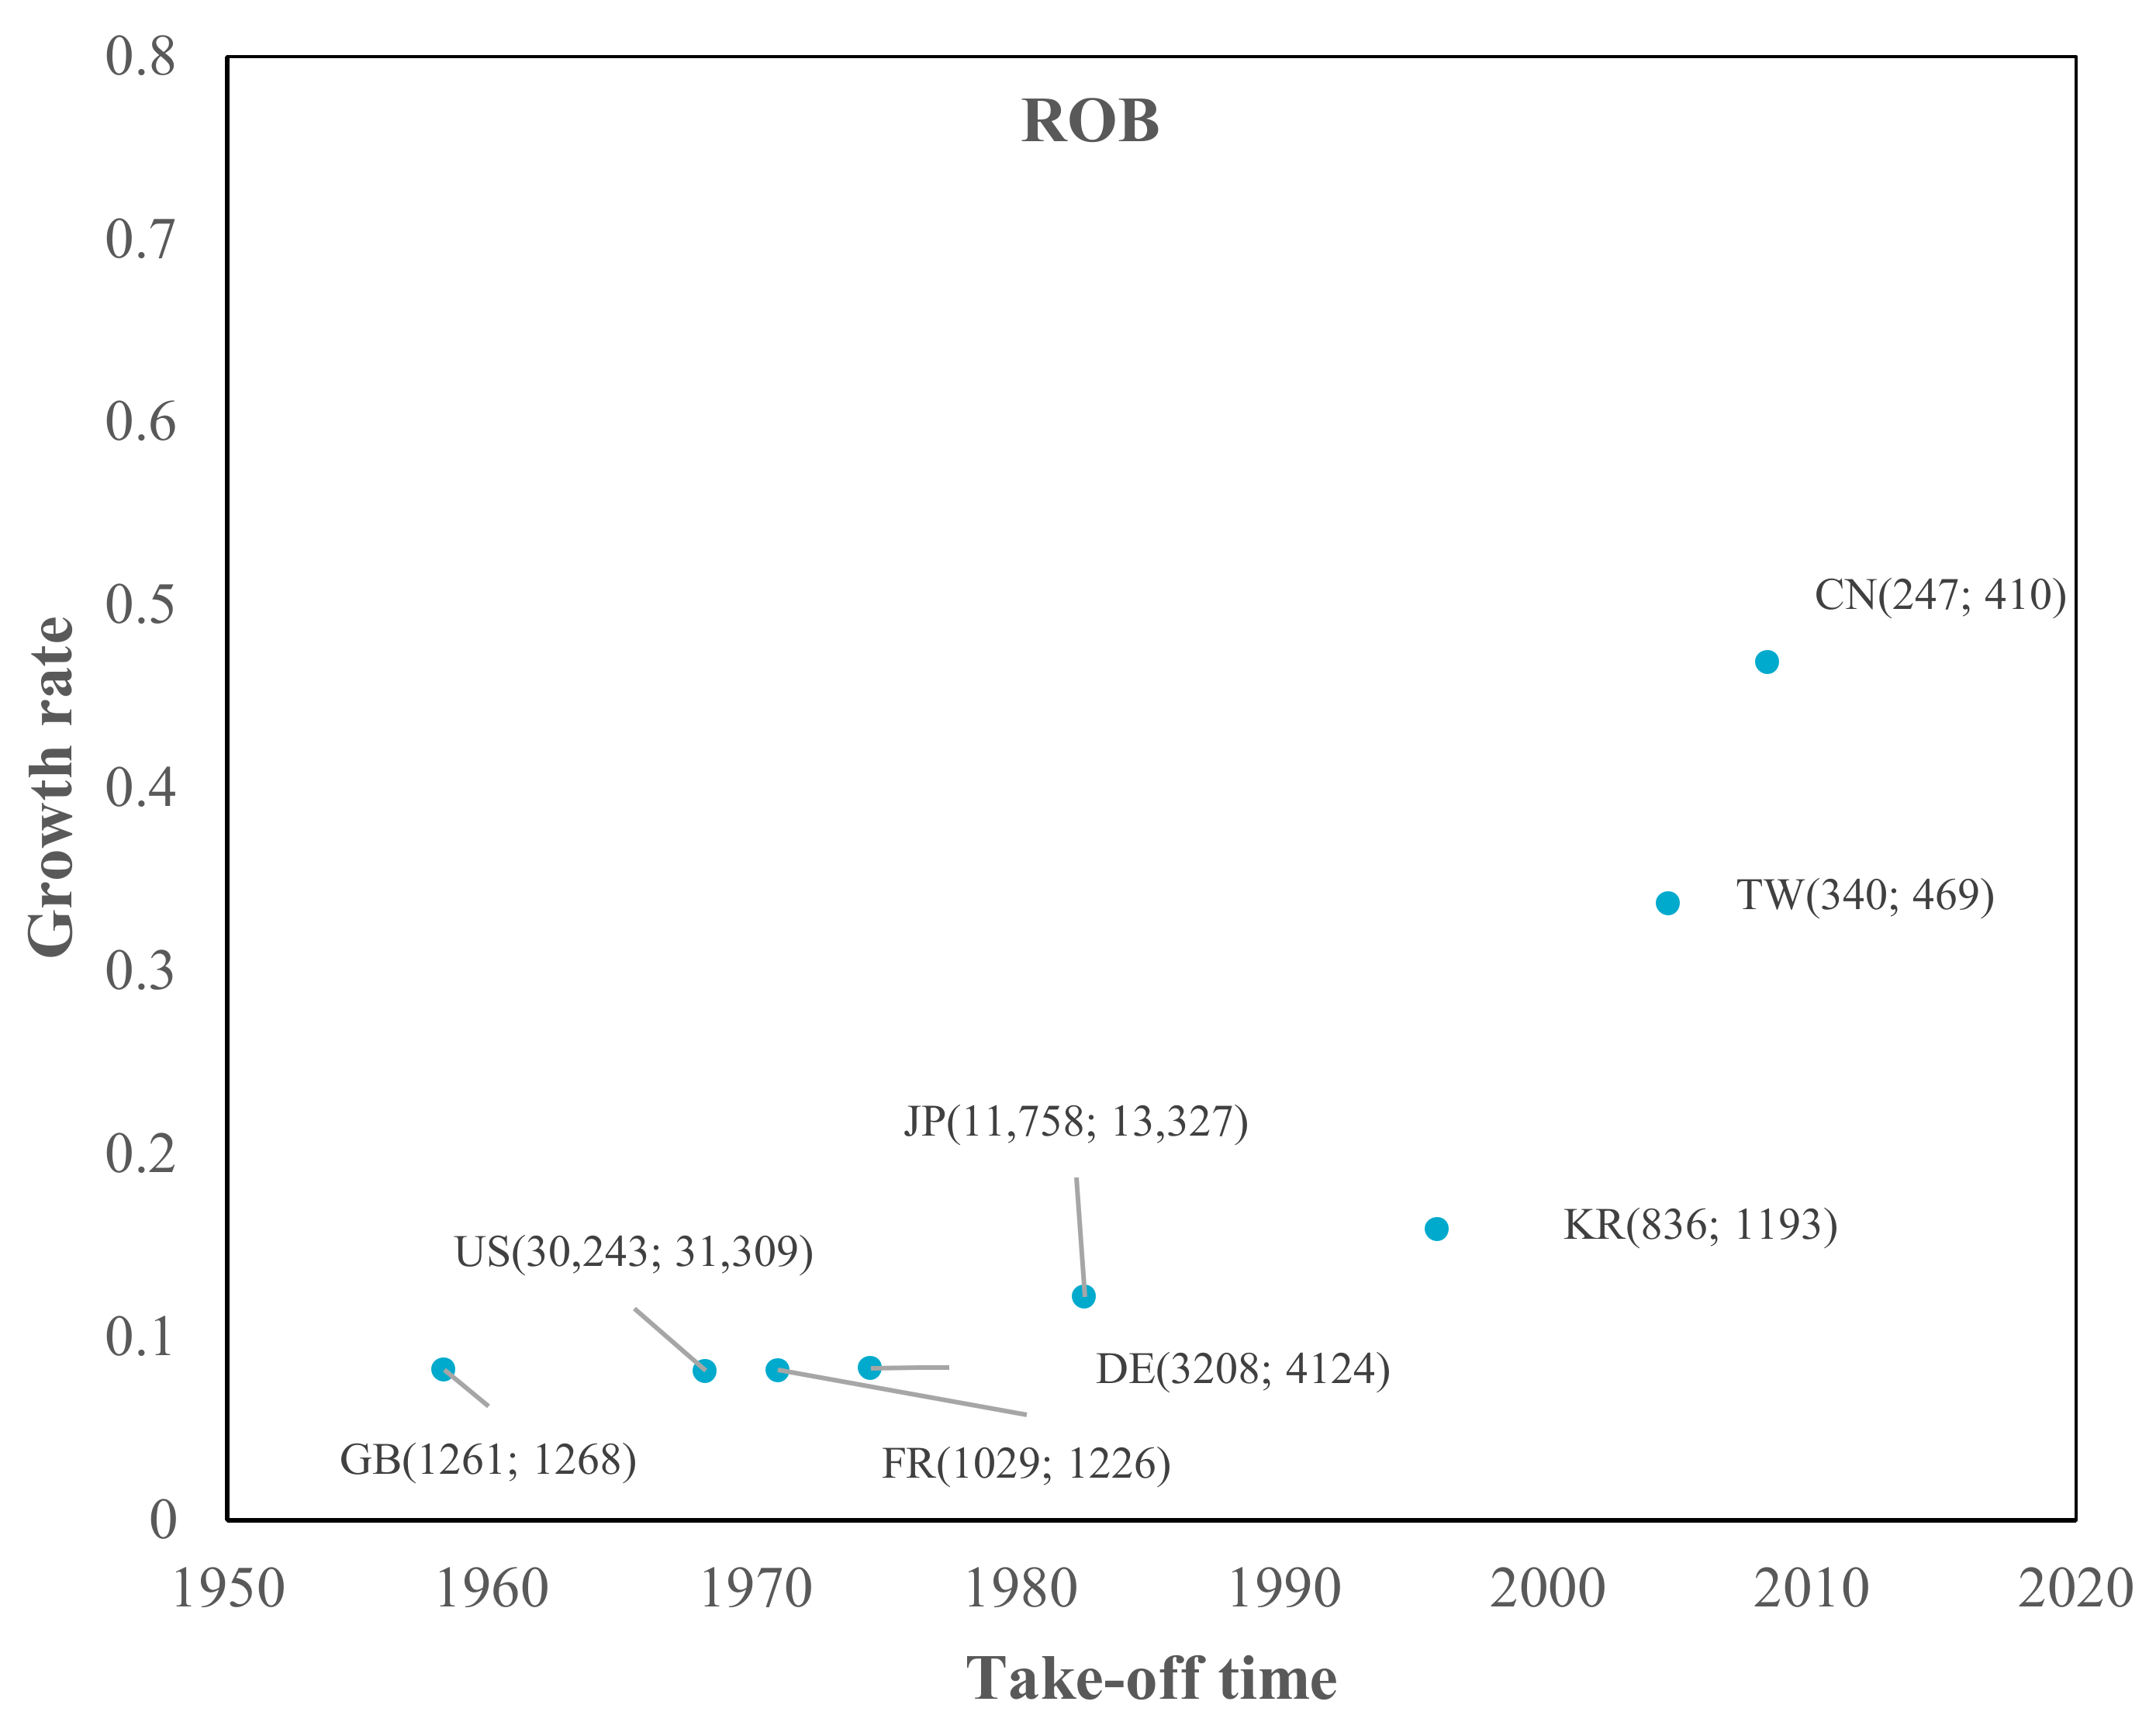
| Take-Off Time | SOC | COM | NET | ESW | DTV | SOL | RFID | MOB | ROB | Standard Deviation | |
|---|---|---|---|---|---|---|---|---|---|---|---|
| United States | T0.1 | 1997 | 1995 | 2007 | 1987 | 1992 | 2008 | 2000 | 1983 | 1968 | 11.79 |
| rank | 3 | 5 | 6 | 5 | 4 | 5 | 4 | 3 | 2 | ||
| Great Britain | T0.1 | 1986 | 1971 | 2001 | 1975 | 1978 | 1998 | 1984 | 1972 | 1958 | 12.80 |
| rank | 1 | 1 | 3 | 2 | 1 | 1 | 2 | 1 | 1 | ||
| France | T0.1 | 2001 | 1979 | 1989 | 1971 | 1978 | 2004 | 1980 | 1977 | 1971 | 11.42 |
| rank | 5 | 2 | 1 | 1 | 1 | 4 | 1 | 2 | 3 | ||
| Germany | T0.1 | 2001 | 1984 | 1999 | 1979 | 1980 | 2001 | 1991 | 1990 | 1974 | 9.57 |
| rank | 5 | 3 | 2 | 3 | 3 | 3 | 3 | 5 | 4 | ||
| Japan | T0.1 | 1996 | 1991 | 2001 | 1986 | 1997 | 2000 | 2001 | 1988 | 1982 | 6.65 |
| rank | 2 | 4 | 3 | 4 | 5 | 2 | 5 | 4 | 5 | ||
| Korea | T0.1 | 2002 | 2004 | 2007 | 1999 | 2008 | 2010 | 2007 | 2006 | 1996 | 4.29 |
| rank | 7 | 7 | 6 | 6 | 6 | 6 | 7 | 6 | 6 | ||
| Taiwan | T0.1 | 1999 | 2003 | 2006 | 2002 | 2008 | 2010 | 2006 | 2007 | 2005 | 3.14 |
| rank | 4 | 6 | 5 | 7 | 6 | 6 | 6 | 7 | 7 | ||
| China (Mainland) | T0.1 | 2012 | 2009 | 2010 | 2011 | 2010 | 2011 | 2010 | 2010 | 2008 | 1.10 |
| rank | 8 | 8 | 8 | 8 | 8 | 8 | 8 | 8 | 8 | ||
| Growth Rate (Growth Time) | SOC | COM | NET | ESW | DTV | SOL | RFID | MOB | ROB | Avg. | |
|---|---|---|---|---|---|---|---|---|---|---|---|
| United States | b | 0.13 | 0.08 | 0.15 | 0.08 | 0.08 | 0.18 | 0.08 | 0.08 | 0.08 | 0.11 |
| (34) | (54) | (30) | (54) | (54) | (25) | (54) | (54) | (53) | (46) | ||
| Great Britain | b | 0.08 | 0.08 | 0.09 | 0.08 | 0.08 | 0.18 | 0.08 | 0.08 | 0.08 | 0.09 |
| (54) | (54) | (47) | (53) | (53) | (25) | (53) | (53) | (54) | (50) | ||
| France | b | 0.08 | 0.08 | 0.08 | 0.08 | 0.10 | 0.12 | 0.08 | 0.08 | 0.08 | 0.09 |
| (52) | (53) | (53) | (53) | (46) | (38) | (53) | (54) | (54) | (51) | ||
| Germany | b | 0.09 | 0.08 | 0.09 | 0.08 | 0.08 | 0.16 | 0.08 | 0.08 | 0.08 | 0.09 |
| (51) | (53) | (52) | (54) | (53) | (27) | (53) | (53) | (54) | (50) | ||
| Japan | b | 0.16 | 0.13 | 0.13 | 0.14 | 0.12 | 0.16 | 0.11 | 0.12 | 0.11 | 0.13 |
| (28) | (35) | (34) | (32) | (38) | (28) | (41) | (36) | (39) | (35) | ||
| Korea | b | 0.23 | 0.19 | 0.27 | 0.20 | 0.18 | 0.29 | 0.26 | 0.16 | 0.17 | 0.22 |
| (20) | (23) | (16) | (22) | (24) | (15) | (17) | (28) | (26) | (21) | ||
| Taiwan | b | 0.25 | 0.29 | 0.41 | 0.33 | 0.32 | 0.29 | 0.37 | 0.34 | 0.29 | 0.32 |
| (18) | (15) | (11) | (13) | (14) | (15) | (12) | (13) | (15) | (14) | ||
| China (Mainland) | b | 0.55 | 0.59 | 0.66 | 0.40 | 0.65 | 0.70 | 0.75 | 0.47 | 0.54 | 0.59 |
| (8) | (8) | (7) | (11) | (7) | (6) | (6) | (9) | (8) | (8) | ||
| Ceiling Value | SOC | COM | NET | ESW | DTV | SOL | RFID | MOB | ROB | |
|---|---|---|---|---|---|---|---|---|---|---|
| United States | K | 251,748 | 703,141 | 331,802 | 66,859 | 385,901 | 527,474 | 372,802 | 281,311 | 31,309 |
| rank | 1 | 1 | 1 | 1 | 1 | 1 | 1 | 1 | 1 | |
| Great Britain | K | 3248 | 7011 | 9577 | 1631 | 10,034 | 2854 | 7147 | 7889 | 1268 |
| rank | 8 | 7 | 4 | 4 | 6 | 5 | 5 | 6 | 4 | |
| France | K | 8898 | 8671 | 3894 | 971 | 5469 | 3064 | 4988 | 8274 | 1226 |
| rank | 5 | 5 | 7 | 6 | 7 | 4 | 6 | 5 | 5 | |
| Germany | K | 18,540 | 21,302 | 9145 | 1842 | 10,852 | 2378 | 10,521 | 27,383 | 4124 |
| rank | 4 | 4 | 5 | 3 | 5 | 6 | 4 | 3 | 3 | |
| Japan | K | 69,438 | 105,154 | 41,399 | 9300 | 223,354 | 32,551 | 72,285 | 70,100 | 13,327 |
| rank | 2 | 2 | 2 | 2 | 2 | 2 | 2 | 2 | 2 | |
| Korea | K | 23,771 | 33,806 | 14,327 | 1621 | 84,841 | 8067 | 18,938 | 25,475 | 1193 |
| rank | 3 | 3 | 3 | 5 | 3 | 3 | 3 | 4 | 6 | |
| Taiwan | K | 5750 | 8395 | 933 | 617 | 16,104 | 1839 | 2817 | 3971 | 469 |
| rank | 6 | 6 | 8 | 8 | 4 | 7 | 8 | 7 | 7 | |
| China (Mainland) | K | 5013 | 6207 | 4758 | 713 | 4916 | 1451 | 3126 | 2701 | 410 |
| rank | 7 | 8 | 6 | 7 | 8 | 8 | 7 | 8 | 8 | |
Appendix B
| Ceiling Value | SOC | COM | NET | ESW | DTV | SOL | RFID | MOB | ROB | |
|---|---|---|---|---|---|---|---|---|---|---|
| United States | FC | 1965 | 1962 | 1974 | 1961 | 1967 | 1977 | 1964 | 1966 | 1962 |
| SC | 1997 | 1993 | 2002 | 1995 | 1993 | 2005 | 1997 | 1993 | 1993 | |
| Great Britain | FC | 1975 | 1968 | 1975 | 1965 | 1974 | 1978 | 1965 | 1971 | 1965 |
| SC | 2001 | 1993 | 2003 | 1989 | 1997 | 2004 | 1993 | 2000 | 1990 | |
| France | FC | 1970 | 1967 | 1974 | 1966 | 1970 | 1976 | 1969 | 1969 | 1966 |
| SC | 2002 | 1996 | 2000 | 1996 | 1999 | 2006 | 1998 | 1997 | 1992 | |
| Germany | FC | 1975 | 1978 | 1976 | 1977 | 1975 | 1979 | 1977 | 1978 | 1978 |
| SC | 2003 | 1999 | 2005 | 1995 | 2003 | 2005 | 2003 | 1997 | 1994 | |
| Japan | FC | 1997 | 1994 | 1996 | 1996 | 1994 | 1998 | 1983 | 1994 | 1991 |
| SC | 2007 | 2007 | 2010 | 2006 | 2008 | 2011 | 2010 | 2008 | 1990 | |
| Korea | FC | 1999 | 1997 | 2004 | 2002 | 1992 | 1997 | 2004 | 1993 | 2002 |
| SC | 2008 | 2008 | 2009 | 2009 | 2010 | 2011 | 2010 | 2010 | 2009 | |
| Taiwan | FC | 1996 | 1995 | 2006 | 1997 | 1996 | 1998 | 1996 | 1996 | 1997 |
| SC | 2013 | 2012 | 2013 | 2013 | 2012 | 2013 | 2012 | 2012 | 2011 | |
| China (Mainland) | FC | 1965 | 1962 | 1974 | 1961 | 1967 | 1977 | 1964 | 1966 | 1962 |
| SC | 1997 | 1993 | 2002 | 1995 | 1993 | 2005 | 1997 | 1993 | 1993 | |
| Growth Rate (Growth Time) | SOC | COM | NET | ESW | DTV | SOL | RFID | MOB | ROB | |
|---|---|---|---|---|---|---|---|---|---|---|
| Great Britain | d | 0.18 (24) | 0.17 (26) | 0.17 (26) | 0.18 (25) | 0.17 (26) | 0.19 (23) | 0.17 (26) | 0.17 (26) | 0.18 (24) |
| f | 0.21 (21) | 0.17 (26) | 0.25 (18) | 0.19 (23) | 0.18 (25) | 0.45 (10) | 0.18 (24) | 0.18 (25) | 0.17 (25) | |
| France | d | 0.18 (25) | 0.17 (27) | 0.18 (25) | 0.21 (21) | 0.17 (26) | 0.2 (22) | 0.17 (26) | 0.17 (26) | 0.2 (23) |
| f | 0.18 (24) | 0.18 (25) | 0.18 (25) | 0.17 (25) | 0.18 (24) | 0.35 (13) | 0.17 (26) | 0.20 (22) | 0.18 (25) | |
| Germany | d | 0.17 (26) | 0.17 (26) | 0.18 (25) | 0.17 (25) | 0.17 (26) | 0.18 (24) | 0.18 (25) | 0.17 (26) | 0.19 (23) |
| f | 0.28 (16) | 0.18 (24) | 0.21 (21) | 0.24 (19) | 0.18 (25) | 0.44 (10) | 0.24 (19) | 0.19 (23) | 0.17 (26) | |
| Japan | d | 0.18 (25) | 0.23 (19) | 0.20 (22) | 0.21 (21) | 0.18 (25) | 0.19 (23) | 0.21 (21) | 0.24 (18) | 0.23 (19) |
| f | 0.32 (14) | 0.25 (18) | 0.32 (14) | 0.22 (20) | 0.27 (16) | 0.41 (11) | 0.30 (15) | 0.20 (22) | 0.18 (24) | |
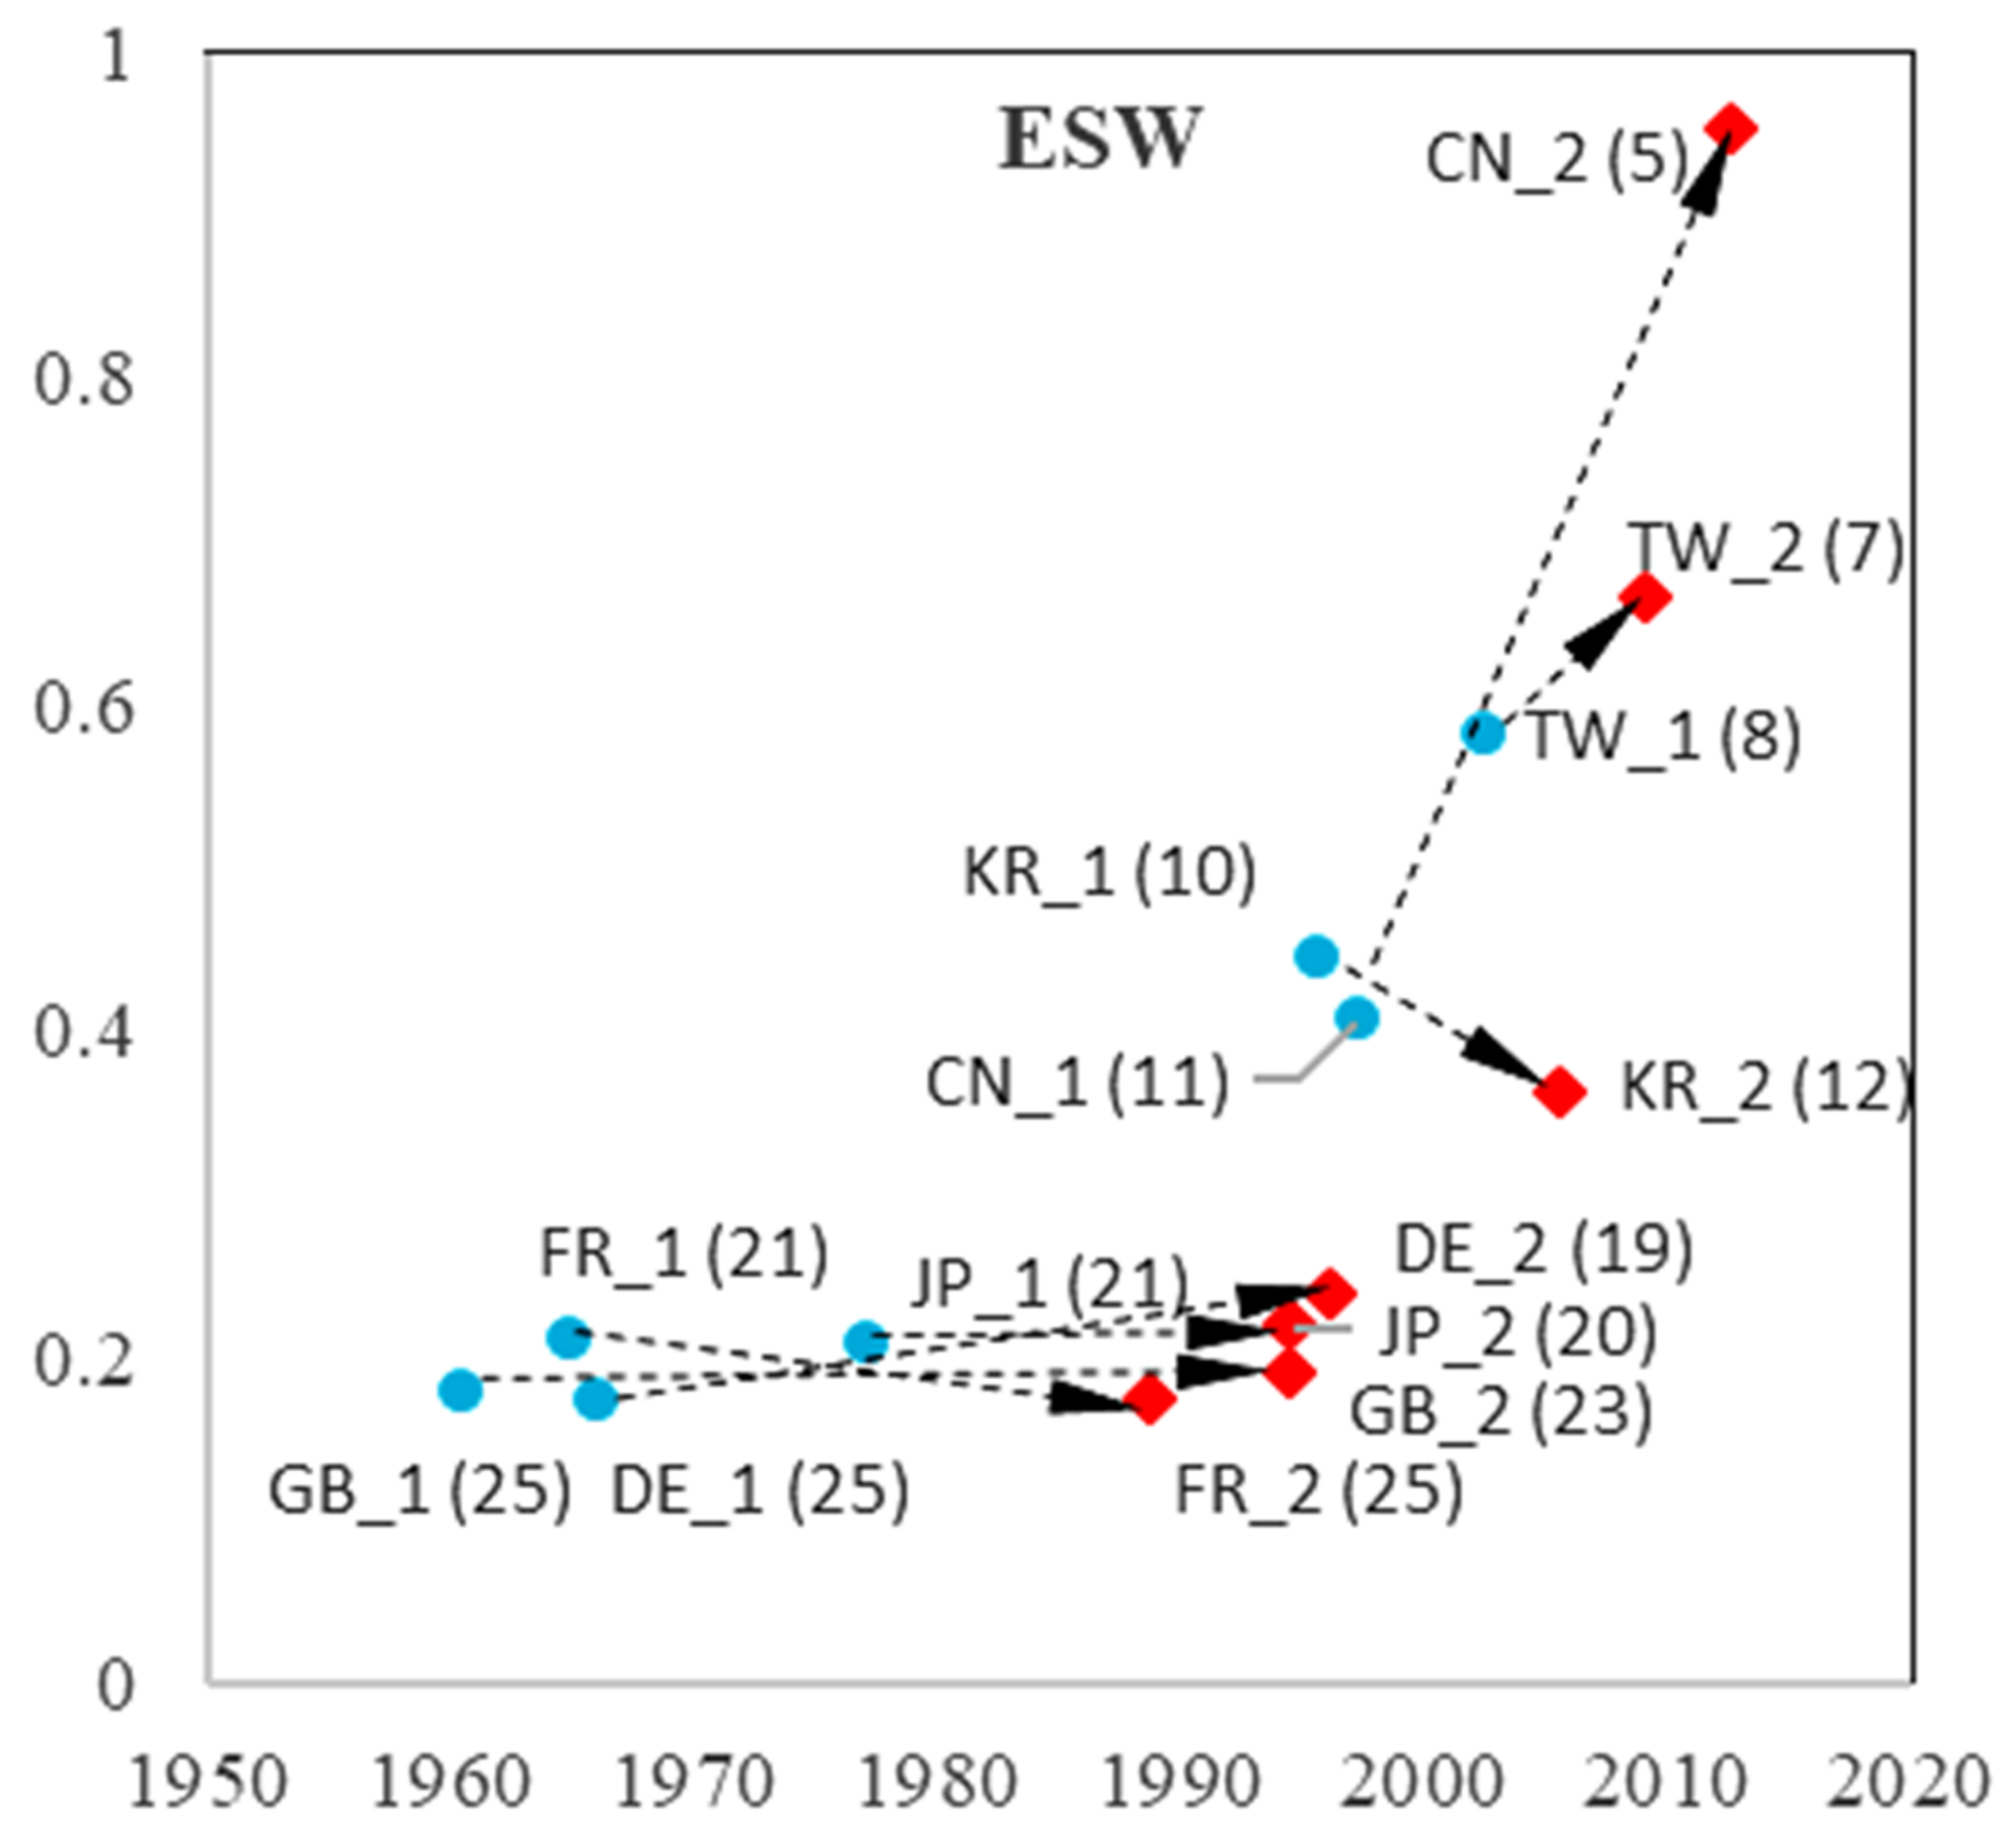
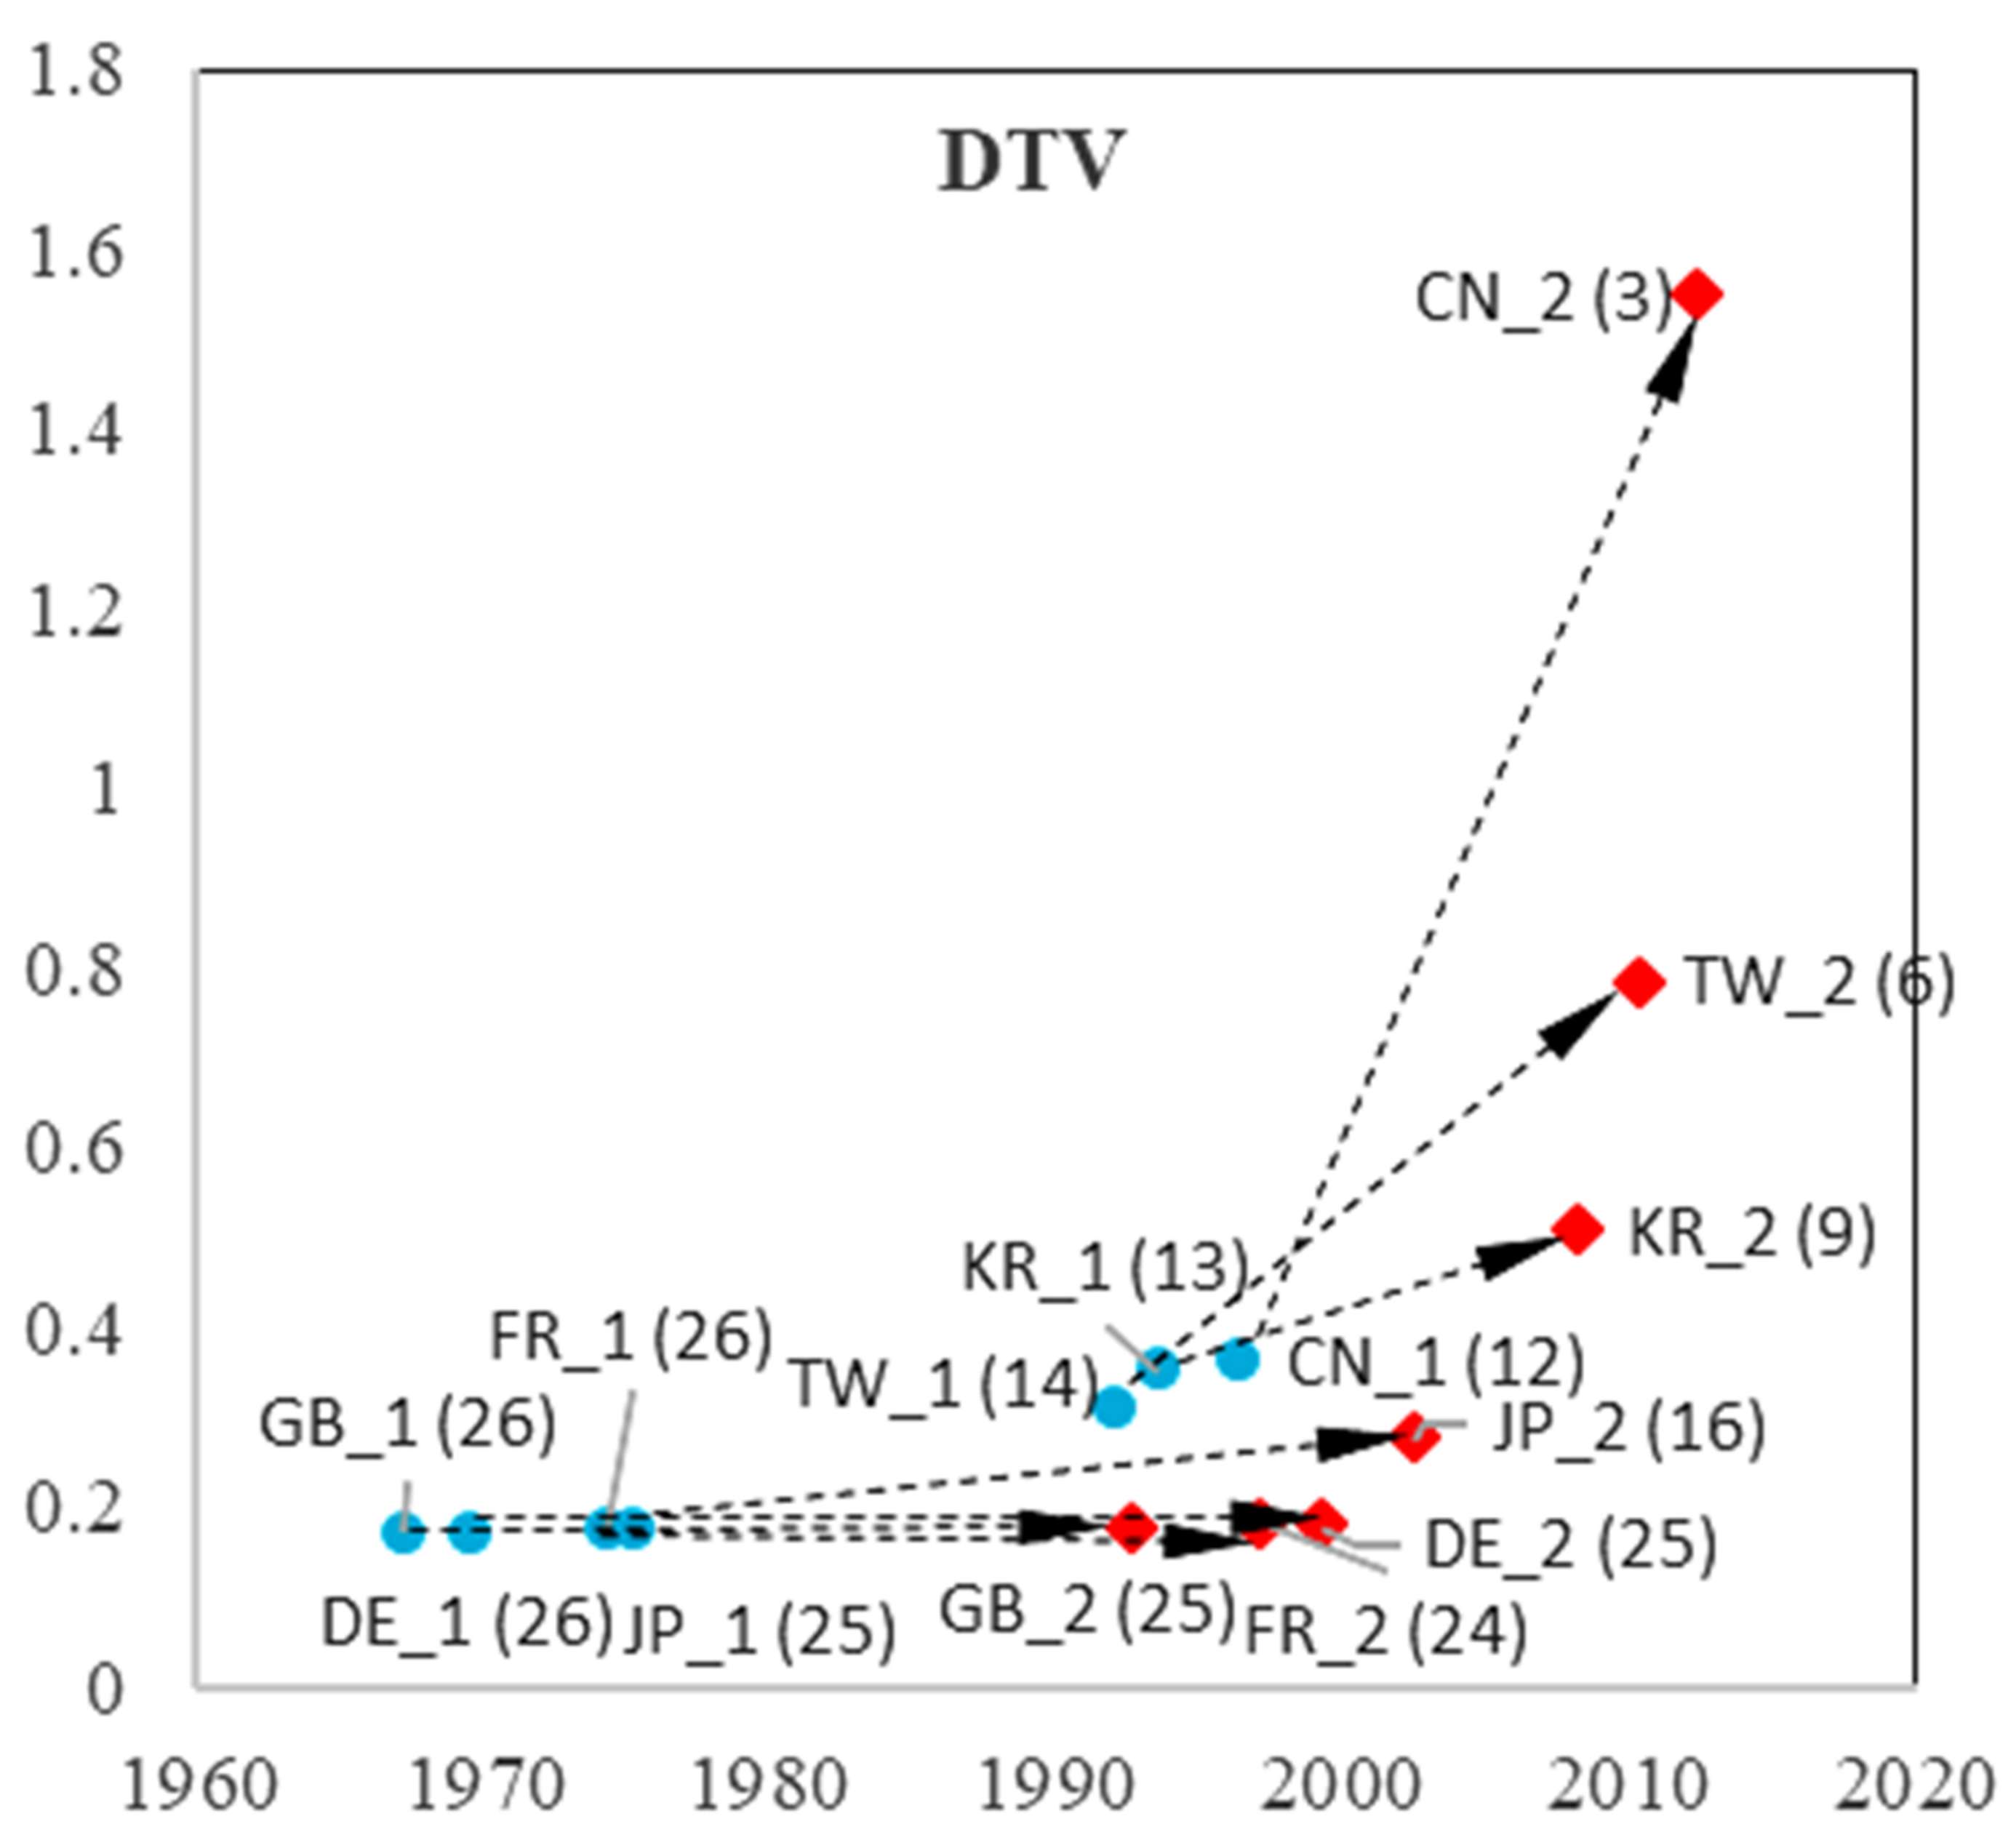
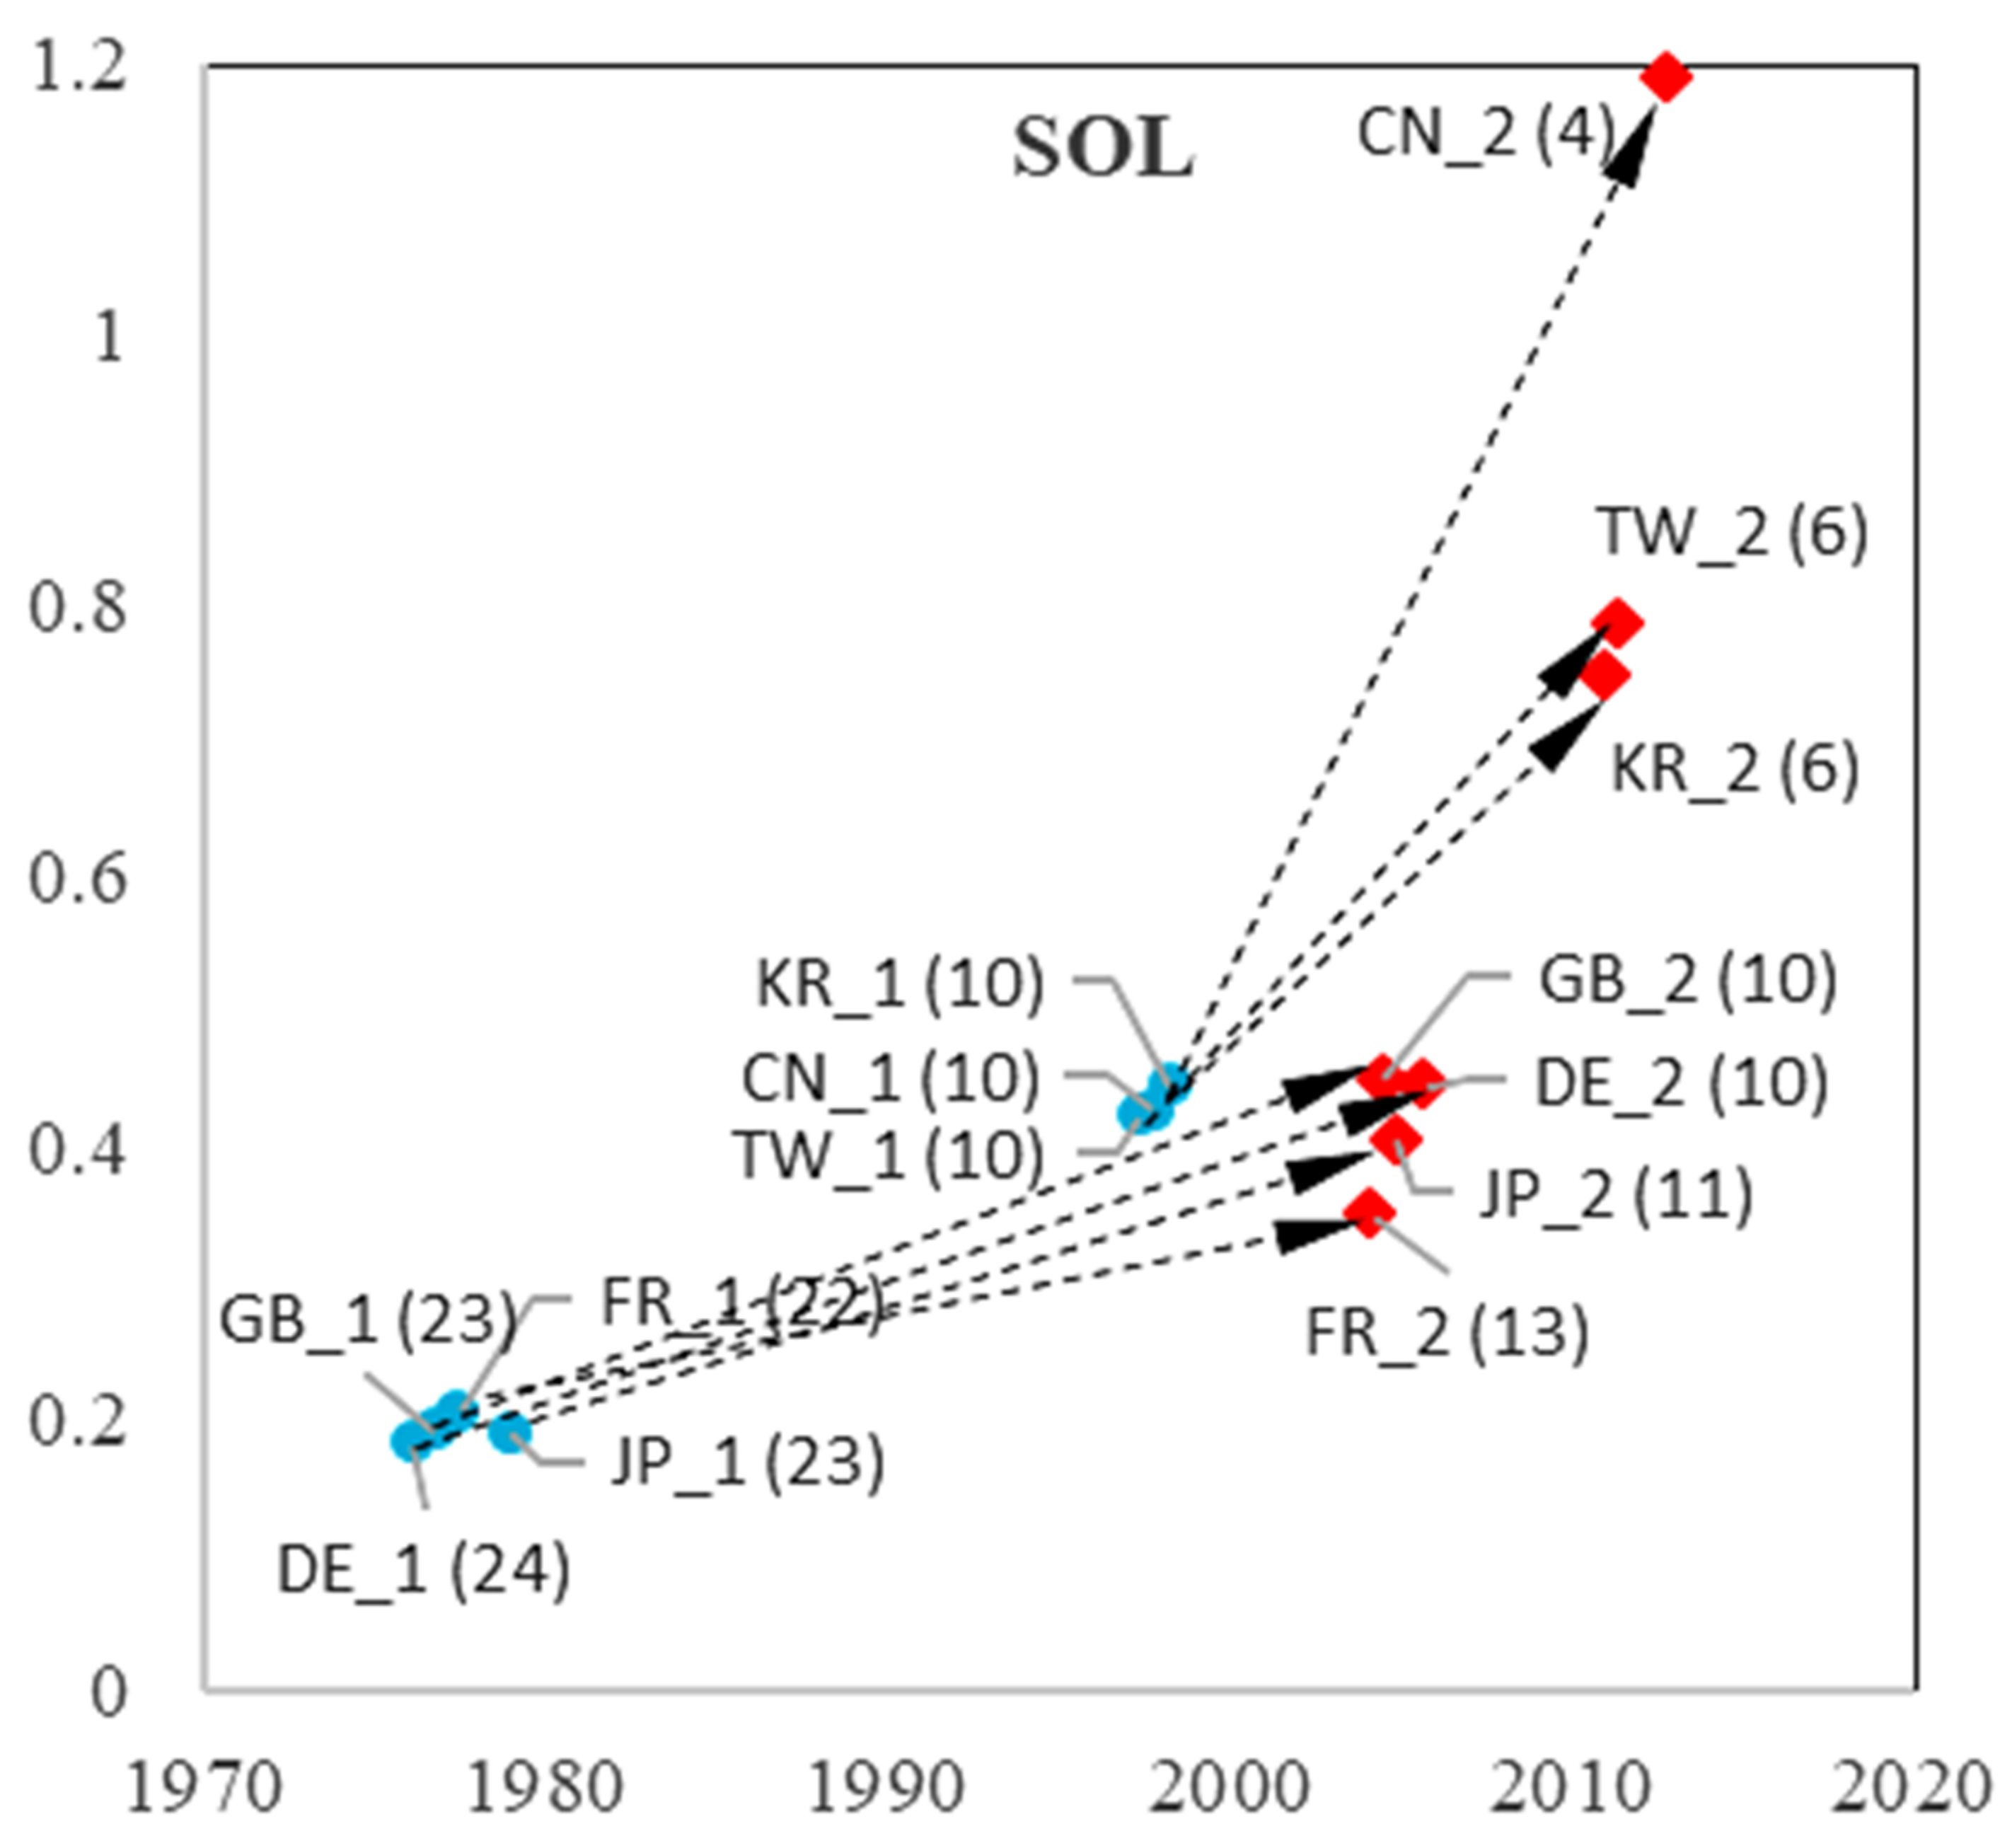
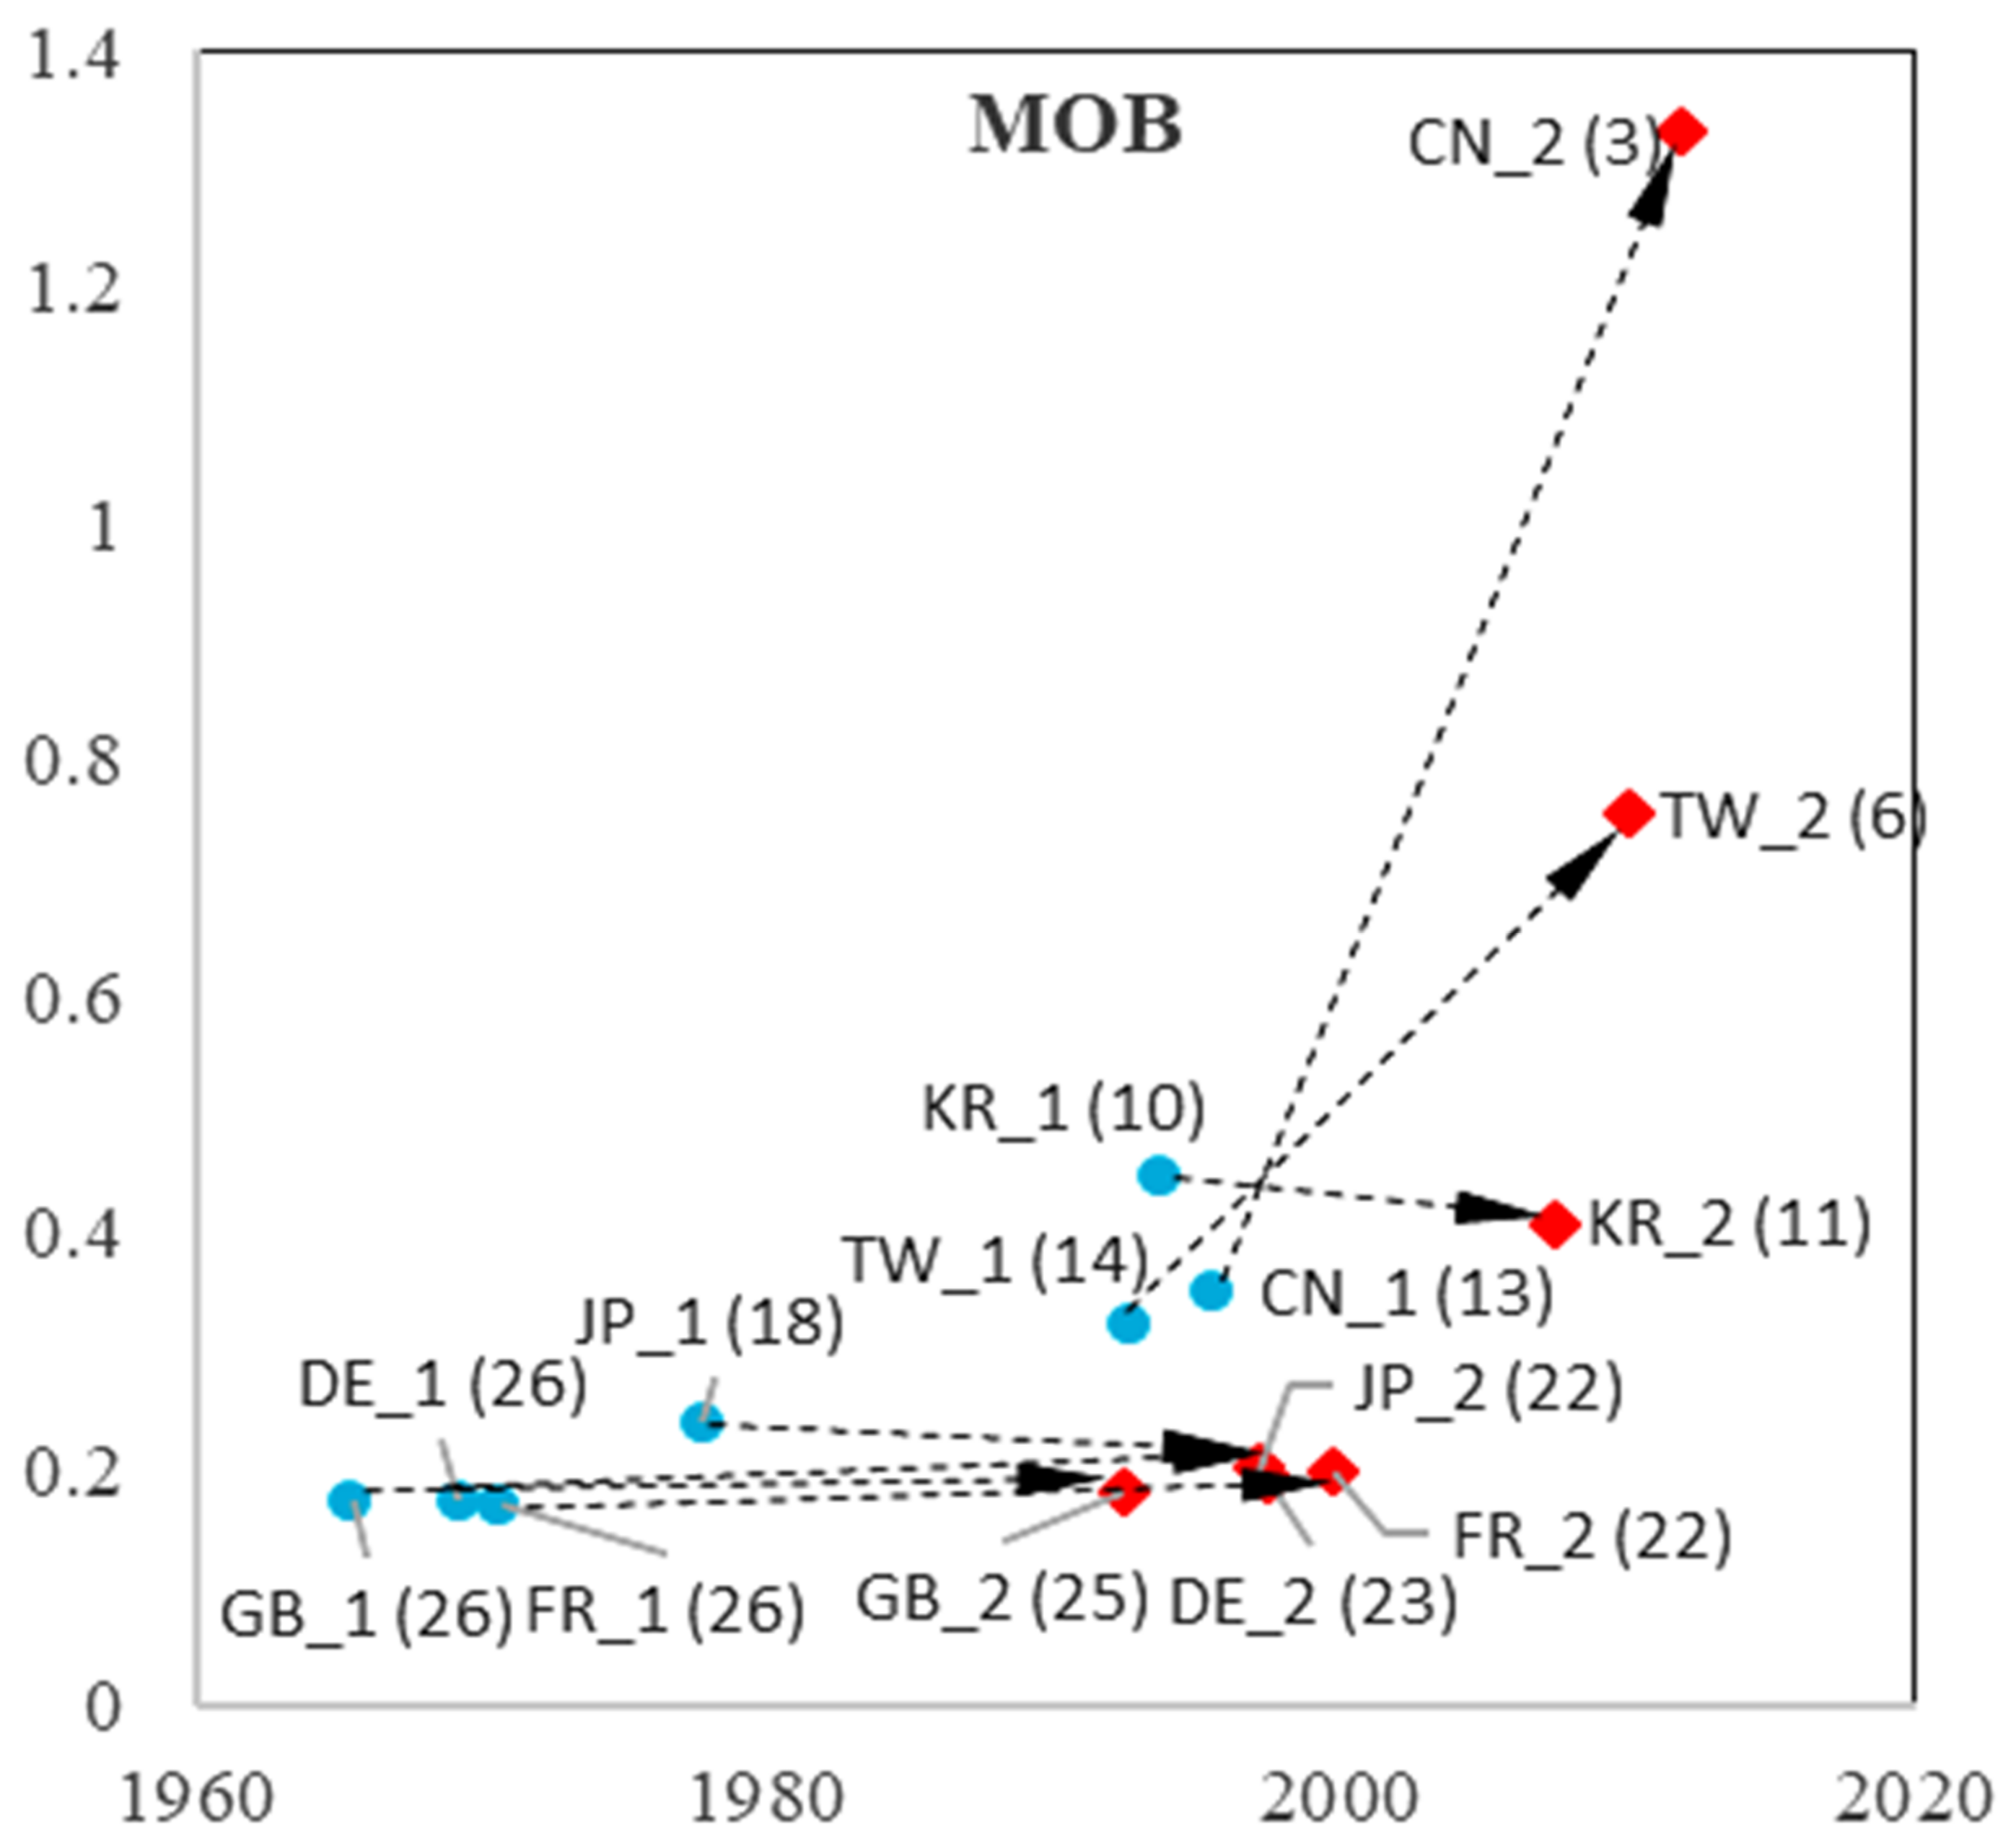
| Korea | d | 0.51 (9) | 0.41 (11) | 0.39 (11) | 0.44 (10) | 0.35 (13) | 0.45 (10) | 0.21 (21) | 0.45 (10) | 0.33 (13) |
| f | 0.48 (9) | 0.45 (10) | 0.74 (6) | 0.36 (12) | 0.51 (9) | 0.75 (6) | 0.68 (6) | 0.40 (11) | 0.34 (13) | |
| Taiwan | d | 0.58 (8) | 0.51 (9) | 0.72 (6) | 0.58 (8) | 0.31 (14) | 0.42 (10) | 0.78 (6) | 0.32 (14) | 0.59 (7) |
| f | 0.51 (9) | 0.55 (8) | 0.66 (7) | 0.67 (7) | 0.78 (6) | 0.79 (6) | 0.61 (7) | 0.75 (6) | 0.64 (7) | |
| China (Mainland) | d | 0.35 (12) | 0.34 (13) | 0.81 (5) | 0.41 (11) | 0.36 (12) | 0.43 (10) | 0.38 (12) | 0.35 (13) | 0.51 (9) |
| f | 1.46 (3) | 1.35 (3) | 1.53 (3) | 0.95 (5) | 1.55 (3) | 1.19 (4) | 1.49 (3) | 1.33 (3) | 1.17 (4) | |
| Ceiling Value | SOC | COM | NET | ESW | DTV | SOL | RFID | MOB | ROB | |
|---|---|---|---|---|---|---|---|---|---|---|
| Great Britain | K1 | 437 | 2176 | 681 | 407 | 2271 | 471 | 1119 | 2473 | 744 |
| K2 | 1547 | 4393 | 2600 | 1015 | 5338 | 1426 | 4246 | 4319 | 580 | |
| France | K1 | 588 | 1963 | 716 | 252 | 2226 | 205 | 947 | 2827 | 376 |
| K2 | 2947 | 4388 | 2441 | 560 | 3006 | 668 | 2806 | 4831 | 659 | |
| Germany | K1 | 1248 | 3571 | 673 | 428 | 2864 | 303 | 1193 | 3443 | 1090 |
| K2 | 4067 | 11,297 | 2577 | 871 | 7116 | 1032 | 3733 | 11,656 | 2366 | |
| Japan | K1 | 11,672 | 18,791 | 4082 | 2052 | 26,808 | 4277 | 5863 | 12,507 | 3931 |
| K2 | 37,755 | 59,095 | 15,613 | 6255 | 94,832 | 13,415 | 19,526 | 43,378 | 8852 | |
| Korea | K1 | 4022 | 3899 | 1665 | 345 | 5526 | 574 | 1949 | 2006 | 366 |
| K2 | 12,641 | 14,354 | 5301 | 982 | 20,954 | 2337 | 7363 | 8454 | 801 | |
| Taiwan | K1 | 2191 | 1571 | 187 | 280 | 1894 | 129 | 587 | 445 | 100 |
| K2 | 3297 | 5295 | 589 | 309 | 7072 | 606 | 1817 | 1628 | 262 | |
| China (Mainland) | K1 | 325 | 1085 | 635 | 51.2 | 737 | 209 | 572 | 360 | 63.9 |
| K2 | 1592 | 3376 | 2326 | 305 | 2438 | 1049 | 1928 | 1172 | 235 | |
References
- Laursen, K.; Meliciani, V. The role of ICT knowledge flows for international market share dynamics. Res. Policy 2010, 39, 687–697. [Google Scholar] [CrossRef]
- OECD. OECD Science, Technology and Industry Scoreboard 2017: The Digital Transformation; OECD: Paris, France, 2017. [Google Scholar]
- Sun, Y.; Grimes, S. China and Global Value Chains: Globalization and the Information and Communications Technology Sector; Routledge: London, UK, 2018. [Google Scholar]
- Tseng, C.Y. Technological innovation and knowledge network in Asia: Evidence from comparison of information and communication technologies among six countries. Technol. Forecast. Soc. Chang. 2009, 76, 654–663. [Google Scholar] [CrossRef]
- Solow, R.M. A Contribution to the Theory of Economic Growth. Q. J. Econ. 1956, 1, 65–94. [Google Scholar] [CrossRef]
- Romer, P.M. Increasing returns and long-run growth. J. Political Econ. 1986, 5, 1002–1037. [Google Scholar] [CrossRef]
- Lucas, R. Why doesn’t capital flow from rich to poor countries? Am. Econ. Rev. 1990, 2, 92–96. [Google Scholar]
- Aghion, P.; Howitt, P. A model of growth through creative destruction. Econometrica 1992, 2, 323–351. [Google Scholar] [CrossRef]
- Jones, C.I. R&D-based models of economic growth. J. Political Econ. 1995, 4, 759–784. [Google Scholar] [CrossRef]
- Barro, R.J. Economic growth in a cross section of countries. Q. J. Econ. 1991, 2, 407–443. [Google Scholar] [CrossRef]
- Barro, R.J.; Sala-i-Martin, X.X. Technological Diffusion, Convergence, and Growth. J. Econ. Growth 1997, 2, 1–27. [Google Scholar] [CrossRef]
- Comin, D.A.; Hobijn, B. Cross-country technology adoption: Making the theories face the facts. J. Monet. Econ. 2004, 1, 39–83. [Google Scholar] [CrossRef]
- Aghion, P.; Howitt, P. Joseph Schumpeter lecture: Appropriate growth policy: A unifying framework. J. Eur. Econ. Assoc. 2006, 2–3, 269–314. [Google Scholar] [CrossRef]
- Lee, K.; Lim, C. Technological regimes, catching-up and leapfrogging: Findings from the Korean industries. Res. Policy 2001, 30, 459–483. [Google Scholar] [CrossRef]
- Hu, M.C. Technological innovation capabilities in the thin film transistor-liquid crystal display industries of Japan, Korea, and Taiwan. Res. Policy 2012, 41, 541–555. [Google Scholar] [CrossRef]
- Lee, K.; Malerba, F. Catch-up cycles and changes in industrial leadership: Windows of opportunity and responses of firms and countries in the evolution of sectoral systems. Res. Policy 2017, 46, 338–351. [Google Scholar] [CrossRef]
- Shin, J. Dynamic catch-up strategy, capability expansion and changing windows of opportunity in the memory industry. Res. Policy 2017, 2, 404–416. [Google Scholar] [CrossRef]
- Kang, H.; Song, J. Innovation and recurring shifts in industrial leadership: Three phases of change and persistence in the camera industry. Res. Policy 2017, 2, 376–387. [Google Scholar] [CrossRef]
- Li, D.; Capone, G.; Malerba, F. The long march to catch-up: A history-friendly model of China’s mobile communications industry. Res. Policy 2019, 48, 649–664. [Google Scholar] [CrossRef]
- Szczygielski, K.; Grabowski, W.; Pamukcu, M.T.; Tandogan, V.S. Does government support for private innovation matter? Firm-level evidence from two catching-up countries. Res. Policy 2017, 46, 219–237. [Google Scholar] [CrossRef]
- Cimoli, M.; Pereima, J.B.; Porcile, G. A technology gap interpretation of growth paths in Asia and Latin America. Res. Policy 2019, 48, 125–136. [Google Scholar] [CrossRef]
- Guo, L.; Zhang, M.Y.; Dodgson, M.; Gann, D.; Cai, H. Seizing windows of opportunity by using technology-building and market-seeking strategies in tandem: Huawei’s sustained catch-up in the global market. Asia Pac. J. Manag. 2019, 36, 849–879. [Google Scholar] [CrossRef]
- Cantwell, J. Innovation and international business. Ind. Innov. 2017, 24, 41–60. [Google Scholar] [CrossRef]
- Castellacci, F. Innovation, diffusion and catching up in the fifth long wave. Futures 2006, 38, 841–863. [Google Scholar] [CrossRef]
- Huang, Y.; Li, R.; Zou, F.; Jiang, L.; Porter, A.L.; Zhang, L. Technology life cycle analysis: From the dynamic perspective of patent citation networks. Technol. Forecast. Soc. Chang. 2022, 181, 121760. [Google Scholar] [CrossRef]
- Malhotra, A.; Zhang, H.; Beuse, M.; Schmidt, T. How do new use environments influence a technology’s knowledge trajectory? A patent citation network analysis of lithium-ion battery technology. Res. Policy 2021, 50, 104318. [Google Scholar] [CrossRef]
- Choung, J.Y.; Hwang, H.R.; Choi, J.K. Post catch-up system transition failure: The case of ICT technology development in Korea. Asian J. Technol. Innov. 2016, 24, 78–102. [Google Scholar] [CrossRef]
- Ryu, J.; Byeon, S.C. Technology level evaluation methodology based on the technology growth curve. Technol. Forecast. Soc. Chang. 2011, 78, 1049–1059. [Google Scholar] [CrossRef]
- Wittfoth, S.; Berger, T.; Moehrle, M.G. Revisiting the innovation dynamics theory: How effectiveness-and efficiency-oriented process innovations accompany product innovations. Technovation 2022, 112, 102410. [Google Scholar] [CrossRef]
- Huenteler, J.; Schmidt, T.S.; Ossenbrink, J.; Hoffmann, V.H. Technology life-cycles in the energy sector—Technological characteristics and the role of deployment for innovation. Technol. Forecast. Soc. Chang. 2016, 104, 102–121. [Google Scholar] [CrossRef]
- Malerba, F.; Nelson, R. Learning and catching up in different sectoral systems: Evidence from six industries. Ind. Corp. Chang. 2011, 20, 1645–1675. [Google Scholar] [CrossRef]
- Guennif, S.; Ramani, S.V. Explaining divergence in catching-up in pharma between India and Brazil using the NSI framework. Res. Policy 2012, 41, 430–441. [Google Scholar] [CrossRef]
- Park, K.H.; Lee, K. Linking the technological regime to the technological catch-up: Analyzing Korea and Taiwan using the US patent data. Ind. Corp. Chang. 2006, 15, 715–753. [Google Scholar] [CrossRef]
- Kim, L. Imitation to Innovation: The Dynamics of Korea’s Technological Learning; Harvard Business School Press: Boston, MA, USA, 1997. [Google Scholar]
- Yap, X.; Truffer, B. Shaping selection environments for industrial catch-up and sustainability transitions: A systemic perspective on endogenizing windows of opportunity. Res. Policy 2019, 48, 1030–1047. [Google Scholar] [CrossRef]
- Wong, C.Y.; Goh, K.L. The sustainability of functionality development of science and technology: Papers and patents of emerging economies. J. Inf. 2012, 6, 55–65. [Google Scholar] [CrossRef]
- Daiyue, H.; Chao, L.; Puel, G. Spatial Environmental Balance to Information and Communication Technology products in different regions of China by using LCA. J. Clean. Prod. 2015, 91, 128–135. [Google Scholar] [CrossRef]
- Colecchia, A.; Schreyer, P. The contribution of information and communication technologies to economic growth in nine OECD countries. OECD Econ. Stud. 2002, 2003, 153–171. [Google Scholar] [CrossRef]
- Bassanini, A.; Scarpetta, S. Growth, technological change, and ICT diffusion: Recent evidence from OECD countries. Oxf. Rev. Econ. Policy 2002, 18, 324–344. [Google Scholar] [CrossRef]
- Carayannis, E.G.; Sagi, J. Exploiting opportunities of the new economy: Developing nations in support of the ICT industry. Technovation 2002, 22, 517–524. [Google Scholar] [CrossRef]
- Little, A.D. The Strategic Management of Technology. Arthur D. Little: Cambridge, UK, 1981. [Google Scholar]
- Kalthaus, M. Knowledge recombination along the technology life cycle. J. Evol. Econ. 2020, 30, 643–704. [Google Scholar] [CrossRef]
- Andersen, B. The hunt for S-shaped growth paths in technological innovation: A patent study. J. Evol. Econ. 1999, 9, 487–526. [Google Scholar] [CrossRef]
- Kucharavy, D.; De Guio, R. Logistic substitution model and technological forecasting. Procedia Eng. 2011, 9, 402–416. [Google Scholar] [CrossRef]
- Liu, C.Y.; Wang, J.C. Forecasting the development of the biped robot walking technique in Japan through S-curve model analysis. Scientometrics 2010, 82, 21–36. [Google Scholar] [CrossRef]
- Kwasnicki, W. Logistic growth of the global economy and competitiveness of nations. Technol. Forecast. Soc. Chang. 2013, 80, 50–76. [Google Scholar] [CrossRef]
- Sood, A.; James, G.M.; Tellis, G.J.; Zhu, J. Predicting the path of technological innovation: SAW vs. Moore, Bass, Gompertz, and Kryder. Mark. Sci. 2012, 31, 964–979. [Google Scholar] [CrossRef]
- Lin, D.; Liu, W.; Guo, Y.; Meyer, M. Using technological entropy to identify technology life cycle. J. Inf. 2021, 15, 101137. [Google Scholar] [CrossRef]
- Adamuthe, A.C.; Thampi, G.T. Technology forecasting: A case study of computational technologies. Technol. Forecast. Soc. Chang. 2019, 143, 181–189. [Google Scholar] [CrossRef]
- Byun, J.; Sung, T.E.; Park, H.W. Technological innovation strategy: How do technology life cycles change by technological area. Technol. Anal. Strateg. Manag. 2018, 30, 98–112. [Google Scholar] [CrossRef]
- Soete, L.; Wyatt, S. The use of foreign patenting as an internationally comparable science and technology output indicator. Scientometrics 1983, 5, 31–54. [Google Scholar] [CrossRef]
- Chen, Y.H.; Chen, C.Y.; Lee, S.C. Technology forecasting and patent strategy of hydrogen energy and fuel cell technologies. Int. J. Hydrog. Energy 2011, 36, 6957–6969. [Google Scholar] [CrossRef]
- Ernst, H. The use of patent data for technological forecasting: The diffusion of CNC-technology in the machine tool industry. Small Bus. Econ. 1997, 9, 361–381. [Google Scholar] [CrossRef]
- Rezaeian, M.; Montazeri, H.; Loonen, R.C. Science foresight using life-cycle analysis, text mining and clustering: A case study on natural ventilation. Technol. Forecast. Soc. Chang. 2017, 118, 270–280. [Google Scholar] [CrossRef]
- International Telecommunication Union (ITU). Measuring the Information Society: The ICT Development Index; International Telecommunication Union: Geneva, Switzerland, 2009. [Google Scholar]
- Lee, S.; Kim, M.S.; Park, Y. ICT Co-evolution and Korean ICT strategy—An analysis based on patent data. Telecommun. Policy 2009, 33, 253–271. [Google Scholar] [CrossRef]
- Lee, H.; Lee, S.; Yoon, B. Technology clustering based on evolutionary patterns: The case of information and communications technologies. Technol. Forecast. Soc. Chang. 2011, 78, 953–967. [Google Scholar] [CrossRef]
- Linden, G.; Hart, J.; Lenway, S.A.; Murtha, T.P. Flying geese as moving targets: Are Korea and Taiwan catching up with Japan in advanced displays? Ind. Innov. 1998, 1, 11–34. [Google Scholar] [CrossRef]
- Kiyoshi, K. The “flying geese” model of Asian economic development: Origin, theoretical extensions, and regional policy implications. J. Asian Econ. 2000, 11, 375–401. [Google Scholar] [CrossRef]
- Wong, C.Y.; Goh, K.L. Modeling the behaviour of science and technology: Self-propagating growth in the diffusion process. Scientometrics 2010, 84, 669–686. [Google Scholar] [CrossRef]
- Ahmad, N. Corrupt clubs and the convergence hypothesis. J. Econ. Policy Reform. 2008, 11, 21–28. [Google Scholar] [CrossRef]
- Khan, F.A.; Hudson, J. Initial human capital or the rule of law: What matters for the income convergence of poor countries? Appl. Econ. 2014, 46, 179–189. [Google Scholar] [CrossRef]
- Ben-David, D. Trade liberalization and income convergence: A comment. J. Int. Econ. 2001, 55, 229–234. [Google Scholar] [CrossRef]
- Choi, C. Foreign direct investment and income convergence. Appl. Econ. 2004, 36, 1045–1049. [Google Scholar] [CrossRef]
- Demetriades, P.O.; Hussein, K.A. Does financial development cause economic growth? Time-series evidence from 16 countries. J. Dev. Econ. 1996, 51, 387–411. [Google Scholar] [CrossRef]
- Bartkowska, M.; Riedl, A. Regional convergence clubs in Europe: Identification and conditioning factors. Econ. Model. 2012, 29, 22–31. [Google Scholar] [CrossRef]
- Li, J.; Kozhikode, R.K. Knowledge management and innovation strategy: The challenge for latecomers in emerging economies. Asia Pac. J. Manag. 2008, 25, 429–450. [Google Scholar] [CrossRef]



| Symbol | Indicator | Meaning of Indicator |
|---|---|---|
| K | Ceiling value | Carrying capacity |
| b | Growth rate | Maximum development speed |
| T0.1 | Starting time of the growth stage | Take-off time of the technology |
| T0.5 | Starting time of the maturity stage | |
| T0.9 | Starting time of the recession stage | |
| T0.1–0.9 | The time of the growth stage and maturity stage | Growth time |
| K1 | Ceiling values for the first process | |
| K2 | Ceiling values for the second process | |
| d | Growth rate for the first process | |
| f | Growth rate for the second process |
| ICT Sub-Field | Abbreviation | USPC Classes |
|---|---|---|
| Mobile telecom/telematics | MOB | 340, 375, 379, 701 |
| Broadband/home network | NET | 370 |
| Digital television/broadcasting | DTV | 345, 348, 349, 353, 367, 381, 382, 386 |
| Computing/auxiliaries | COM | 235, 361, 365, 700, 708, 710, 713, 714, 719 |
| Intelligent robot | ROB | 318, 706 |
| Radio frequency identification | RFID | 342, 343, 455 |
| ubiquitous sensor network | ||
| Information technology system on chip/united parts | SOC | 438, 711, 716 |
| Embedded software | ESW | 341, 712 |
| Digital content/software solutions | SOL | 705, 707, 715, 717 |
| Economies | SOC | COM | NET | ESW | DTV | SOL | RFID | MOB | ROB | |
|---|---|---|---|---|---|---|---|---|---|---|
| β | −0.009 ** | −0.024 *** | 0.016 *** | −0.000 | −0.007 * | −0.021 ** | −0.002 | −0.021 *** | −0.009 * | |
| (−2.28) | (−4.09) | (2.77) | (−0.00) | (−1.89) | (−2.29) | (−0.44) | (−3.79) | (−1.73) | ||
| All | Constant | 0.209 *** | 0.271 *** | 0.008 | 0.085 *** | 0.141 *** | 0.344 *** | 0.133 *** | 0.215 *** | 0.098 *** |
| (9.15) | (6.76) | (0.26) | (4.06) | (5.77) | (7.17) | (4.26) | (6.26) | (4.09) | ||
| Observations | 126 | 126 | 126 | 126 | 126 | 126 | 126 | 126 | 126 | |
| R-squared | 0.040 | 0.119 | 0.058 | 0.000 | 0.028 | 0.040 | 0.002 | 0.104 | 0.024 | |
| β | 0.004 | 0.008 | 0.038 *** | 0.006 | 0.009 *** | −0.012 | 0.007 | 0.009 * | 0.013 * | |
| (0.87) | (1.63) | (5.28) | (1.02) | (2.72) | (−1.13) | (1.00) | (1.91) | (1.70) | ||
| US, | Constant | 0.113 *** | 0.006 | −0.166 *** | 0.051 * | 0.006 | 0.269 *** | 0.032 | −0.008 | −0.017 |
| European | (4.53) | (0.17) | (−4.11) | (1.80) | (0.31) | (4.76) | (0.73) | (−0.27) | (−0.50) | |
| economies | Observations | 72 | 72 | 72 | 72 | 72 | 72 | 72 | 72 | 72 |
| R-squared | 0.011 | 0.036 | 0.285 | 0.015 | 0.096 | 0.018 | 0.014 | 0.050 | 0.040 | |
| β | −0.017 *** | −0.031 *** | 0.005 | −0.003 | −0.016 *** | −0.024 ** | −0.008 | −0.028 *** | −0.017 *** | |
| (−3.83) | (−4.56) | (0.92) | (−0.49) | (−3.82) | (−2.22) | (−1.51) | (−4.29) | (−3.16) | ||
| US, | Constant | 0.291 *** | 0.371 *** | 0.126 *** | 0.106 *** | 0.240 *** | 0.393 *** | 0.205 *** | 0.293 *** | 0.155 *** |
| Asian | (9.71) | (7.63) | (3.88) | (3.87) | (7.83) | (6.25) | (5.95) | (6.91) | (5.80) | |
| economies | Observations | 72 | 72 | 72 | 72 | 72 | 72 | 72 | 72 | 72 |
| R-squared | 0.174 | 0.229 | 0.012 | 0.003 | 0.172 | 0.066 | 0.031 | 0.208 | 0.125 |
| SOC | COM | NET | ESW | DTV | SOL | RFID | MOB | ROB | |
|---|---|---|---|---|---|---|---|---|---|
| β | 0.013 * | 0.016 | 0.029 *** | 0.018 | 0.031 *** | −0.083 *** | 0.029 *** | 0.002 | 0.007 |
| (1.73) | (1.62) | (2.93) | (1.52) | (4.33) | (−4.61) | (2.80) | (0.13) | (0.60) | |
| Corruption | −0.090 ** | −0.113 *** | −0.112 *** | −0.107 ** | 0.045 | −0.554 *** | −0.109 *** | 0.012 | −0.071 * |
| (−2.50) | (−2.83) | (−2.64) | (−2.55) | (1.49) | (−7.80) | (−2.64) | (0.24) | (−1.79) | |
| Legal environment | −0.014 | −0.155 *** | −0.095 * | 0.035 | −0.088 ** | 0.074 | 0.035 | −0.203 *** | −0.087 |
| (−0.34) | (−2.81) | (−1.75) | (0.71) | (−2.49) | (0.76) | (0.64) | (−3.28) | (−1.63) | |
| Investment climate | 0.000 | −0.000 | −0.000 | 0.000 | 0.000 | −0.000 * | 0.000 | −0.000 | −0.000 |
| (0.36) | (−1.06) | (−0.33) | (0.62) | (1.54) | (−1.77) | (1.39) | (−0.02) | (−0.43) | |
| Trade | −0.001 | −0.000 | 0.002 ** | 0.000 | 0.002 *** | −0.007 *** | 0.003 *** | 0.001 | −0.000 |
| (−1.15) | (−0.37) | (2.19) | (0.02) | (2.81) | (−4.00) | (2.99) | (0.58) | (−0.30) | |
| FDI | 0.000 | −0.000 | 0.000 | −0.000 | −0.000 | 0.000 | 0.000 | 0.000 | 0.000 |
| (0.36) | (−0.19) | (1.33) | (−0.61) | (−0.01) | (1.10) | (0.45) | (1.10) | (0.07) | |
| Education | 0.026 ** | 0.061 *** | 0.040 *** | 0.042 *** | −0.009 | 0.229 *** | 0.004 | 0.036 ** | 0.051 *** |
| (2.19) | (4.98) | (3.08) | (3.06) | (−0.93) | (10.19) | (0.28) | (2.13) | (3.40) | |
| Financial development | −0.001 *** | −0.001 *** | 0.000 | −0.001 | 0.000 | −0.003 *** | 0.000 | −0.000 | −0.001 * |
| (−2.99) | (−2.82) | (0.03) | (−1.51) | (1.31) | (−3.80) | (0.62) | (−0.69) | (−1.88) | |
| Absorptive capacity | −0.000 *** | −0.000 *** | −0.000 | −0.000 *** | −0.000 *** | −0.000 | −0.000 * | −0.000 | −0.000 ** |
| (−2.74) | (−2.72) | (−0.82) | (−4.40) | (−3.28) | (−1.44) | (−1.85) | (−0.67) | (−2.44) | |
| Constant | 0.222 *** | −0.067 | −0.332 *** | −0.079 | 0.063 | 0.393 *** | −0.033 | −0.052 | −0.112 |
| (3.67) | (−0.86) | (−4.19) | (−1.09) | (1.25) | (6.25) | (−0.42) | (−0.58) | (−1.45) | |
| Observations | 126 | 126 | 126 | 126 | 126 | 126 | 126 | 126 | 126 |
| R-squared | 0.520 | 0.588 | 0.574 | 0.347 | 0.566 | 0.577 | 0.451 | 0.409 | 0.350 |
| SOC | COM | NET | ESW | DTV | SOL | RFID | MOB | ROB | |
|---|---|---|---|---|---|---|---|---|---|
| β | 0.017 | −0.029 *** | 0.009 | −0.013 | 0.017 * | −0.106 *** | 0.042 * | 0.009 | 0.001 |
| (1.58) | (−2.92) | (0.44) | (−1.03) | (1.91) | (−6.20) | (1.79) | (0.72) | (0.05) | |
| Corruption | 0.077 | 0.013 | 0.091 | −0.022 | 0.034 | −0.267 *** | 0.202 * | 0.099 * | 0.024 |
| (1.21) | (0.37) | (0.93) | (−0.39) | (0.91) | (−2.73) | (2.00) | (1.68) | (0.25) | |
| Legal environment | −0.185 | −0.136 | −0.167 | 0.192 * | 0.117 * | 0.165 | −0.060 | −0.199 * | −0.238 |
| (−1.56) | (−1.54) | (−0.99) | (1.80) | (1.72) | (0.91) | (−0.34) | (−1.97) | (−1.48) | |
| Investment climate | 0.000 | 0.000 | −0.000 | −0.000 | 0.000 | −0.000 | 0.000 | 0.000 | 0.000 |
| (1.39) | (0.40) | (−0.02) | (−0.09) | (0.59) | (−1.41) | (1.42) | (0.85) | (0.41) | |
| Trade | 0.001 | −0.001 | −0.000 | −0.004 *** | −0.001 | −0.014 *** | 0.005 ** | 0.002 | 0.001 |
| (0.76) | (−0.92) | (−0.19) | (−2.67) | (−1.16) | (−5.29) | (2.14) | (1.36) | (0.55) | |
| FDI | 0.000 | 0.000 | 0.000 | 0.000 | −0.000 | 0.000 | 0.000 | 0.000 | −0.000 |
| (0.56) | (0.91) | (1.44) | (0.21) | (−0.09) | (1.06) | (1.33) | (1.22) | (−0.36) | |
| Education | −0.002 | 0.047 *** | 0.019 | 0.045 *** | 0.001 | 0.204 *** | −0.055 ** | 0.014 | 0.037 |
| (−0.08) | (5.92) | (0.76) | (2.82) | (0.09) | (8.43) | (−2.09) | (0.80) | (1.21) | |
| Financial development | 0.000 | 0.001 | 0.000 | −0.001 | −0.001 | −0.003 *** | 0.001 | 0.000 | 0.001 |
| (0.39) | (1.36) | (0.09) | (−1.65) | (−1.44) | (−2.72) | (1.51) | (0.72) | (0.69) | |
| Absorptive capacity | −0.000 *** | −0.000 * | 0.000 *** | −0.000 *** | −0.000 * | −0.000 | −0.000 | −0.000 | −0.000 ** |
| (−2.66) | (−1.71) | (2.86) | (−4.32) | (−1.72) | (−1.27) | (−0.78) | (−0.68) | (−2.37) | |
| Constant | 0.357 *** | −0.079 | −0.502 *** | −0.109 | −0.090 | −0.583 *** | −0.019 | −0.127 | 0.042 |
| (3.06) | (−0.95) | (−2.96) | (−1.00) | (−1.26) | (−3.18) | (−0.10) | (−1.21) | (0.26) | |
| Observations | 72 | 72 | 72 | 72 | 72 | 72 | 72 | 72 | 72 |
| R-squared | 0.293 | 0.569 | 0.496 | 0.609 | 0.417 | 0.768 | 0.140 | 0.371 | 0.263 |
| SOC | COM | NET | ESW | DTV | SOL | RFID | MOB | ROB | |
|---|---|---|---|---|---|---|---|---|---|
| β | 0.026 * | 0.037 * | 0.058 *** | 0.074 *** | 0.038 *** | −0.061 ** | 0.047 *** | 0.029 | 0.049 *** |
| (1.82) | (1.91) | (5.42) | (3.31) | (2.90) | (−2.17) | (3.52) | (1.13) | (2.70) | |
| Corruption | −0.065 | −0.070 | −0.131 ** | −0.108 * | −0.013 | −0.375 *** | −0.194 *** | −0.014 | −0.076 |
| (−1.21) | (−0.84) | (−2.55) | (−1.78) | (−0.23) | (−3.14) | (−3.54) | (−0.14) | (−1.28) | |
| Legal environment | 0.014 | 0.050 | −0.083 | 0.067 | −0.069 | 0.348 * | −0.022 | −0.051 | 0.049 |
| (0.17) | (0.39) | (−1.07) | (0.75) | (−0.82) | (1.93) | (−0.25) | (−0.33) | (0.55) | |
| Investment climate | 0.000 | −0.000 | 0.000 | 0.000 | 0.000 | −0.000 | 0.000 | −0.000 | −0.000 |
| (0.57) | (−0.32) | (0.37) | (0.56) | (0.61) | (−0.02) | (0.44) | (−0.09) | (−0.47) | |
| Trade | −0.001 | −0.002 | 0.002 ** | −0.000 | 0.001 | −0.002 | 0.002 * | −0.001 | −0.001 |
| (−1.31) | (−0.95) | (2.18) | (−0.03) | (0.46) | (−1.01) | (1.67) | (−0.47) | (−0.39) | |
| FDI | 0.000 | 0.000 | −0.000 * | −0.000 | 0.000 | 0.001 | −0.000 | 0.000 | 0.000 |
| (0.50) | (0.42) | (−1.68) | (−0.96) | (0.39) | (1.51) | (−1.62) | (0.59) | (0.42) | |
| Education | −0.002 | −0.044 | 0.050 * | −0.018 | −0.016 | 0.097 | 0.041 | −0.042 | −0.029 |
| (−0.05) | (−0.86) | (1.71) | (−0.50) | (−0.50) | (1.49) | (1.26) | (−0.67) | (−0.88) | |
| Financial development | −0.002 *** | −0.003 *** | 0.000 | −0.002 *** | −0.000 | −0.005 *** | 0.000 | −0.002 | −0.002 *** |
| (−3.67) | (−3.44) | (0.31) | (−3.15) | (−0.25) | (−3.72) | (0.41) | (−1.39) | (−3.74) | |
| Absorptive capacity | −0.000 | 0.000 | −0.000 *** | −0.000 | −0.000 | −0.000 | −0.000 *** | 0.000 | 0.000 |
| (−1.00) | (0.37) | (−3.34) | (−1.21) | (−0.79) | (−0.18) | (−2.68) | (0.63) | (0.23) | |
| Constant | 0.504 ** | 0.848 ** | −0.394 * | 0.397 | 0.176 | 0.275 | −0.285 | 0.604 | 0.531 ** |
| (2.04) | (2.27) | (−1.75) | (1.47) | (0.73) | (0.53) | (−1.11) | (1.32) | (2.13) | |
| Observations | 72 | 72 | 72 | 72 | 72 | 72 | 72 | 72 | 72 |
| R-squared | 0.630 | 0.593 | 0.700 | 0.528 | 0.534 | 0.700 | 0.674 | 0.383 | 0.533 |
Disclaimer/Publisher’s Note: The statements, opinions and data contained in all publications are solely those of the individual author(s) and contributor(s) and not of MDPI and/or the editor(s). MDPI and/or the editor(s) disclaim responsibility for any injury to people or property resulting from any ideas, methods, instructions or products referred to in the content. |
© 2023 by the authors. Licensee MDPI, Basel, Switzerland. This article is an open access article distributed under the terms and conditions of the Creative Commons Attribution (CC BY) license (https://creativecommons.org/licenses/by/4.0/).
Share and Cite
Zhang, N.; Sun, C.; Xu, M.; Wang, X.; Deng, J. Catching Up of Latecomer Economies in ICT for Sustainable Development: An Analysis Based on Technology Life Cycle Using Patent Data. Sustainability 2023, 15, 9038. https://doi.org/10.3390/su15119038
Zhang N, Sun C, Xu M, Wang X, Deng J. Catching Up of Latecomer Economies in ICT for Sustainable Development: An Analysis Based on Technology Life Cycle Using Patent Data. Sustainability. 2023; 15(11):9038. https://doi.org/10.3390/su15119038
Chicago/Turabian StyleZhang, Na, Chao Sun, Min Xu, Xuemei Wang, and Jia Deng. 2023. "Catching Up of Latecomer Economies in ICT for Sustainable Development: An Analysis Based on Technology Life Cycle Using Patent Data" Sustainability 15, no. 11: 9038. https://doi.org/10.3390/su15119038
APA StyleZhang, N., Sun, C., Xu, M., Wang, X., & Deng, J. (2023). Catching Up of Latecomer Economies in ICT for Sustainable Development: An Analysis Based on Technology Life Cycle Using Patent Data. Sustainability, 15(11), 9038. https://doi.org/10.3390/su15119038


