Article

Understanding the Impact Mechanism of User Behavior Pattern toward Real Estate APP Platforms in the Post-COVID Era: A Quantitative Analysis

1
School of Public Administration and Policy, Renmin University of China, Beijing 100872, China
2
College of Humanities and Education, Nanchang Institute of Technology, Nanchang 330044, China
3
School of Language and Communication Studies, Beijing Jiaotong University, Beijing 100044, China
4
School of Economics & Management, Jiangxi Science and Technology Normal University, Nanchang 330038, China
*
Author to whom correspondence should be addressed.
Sustainability 2023, 15(11), 8926; https://doi.org/10.3390/su15118926
Submission received: 16 March 2023 / Revised: 15 May 2023 / Accepted: 16 May 2023 / Published: 1 June 2023

Abstract

:
While technology factors are the main driver of the booming real estate APP platforms with important implications for user behavior pattern during and post-pandemic contexts, there is a lack of adequate research. In response, this study explores the user behavior pattern of real estate APP platforms to promote user mental health by taking the real estate APP platforms users as the participants based on theory of technology readiness and acceptance model. Data collected from offline surveys are analyzed using PLS-SEM. The results reveal the technology readiness index positively affects individuals’ perceived usefulness and satisfaction, ultimately positively affects individuals’ continuance intention with real estate APP platforms; satisfaction with real estate APP platforms mediated the relationship between technology readiness index, perceived ease of use, perceived usefulness, and individuals’ continuance intention with real estate APP platforms. However, the group comparison finds no significant difference in user behavior patterns by gender. The contribution of this study is to reveal the influence mechanisms of digital technology on users’ behavioral patterns toward real estate APP platforms, which can help guide the sustainable development of real estate APP platforms and promote user mental health and wellbeing in the post-COVID era.

1. Introduction

With the increasing prosperity and progress of society and the general improvement of people’s living standards, the public’s demand for intelligent housing services has been increasing. As the main tool for linking the public’s demand for intelligent housing services, the real estate APP platforms make an important contribution to the development of healthy, safe, comfortable, and environmentally friendly healthy habitat [1]. For example, intelligent activities such as virtual reality (VR) viewing, VR talking, and VR showing on real estate APP platforms are becoming more and more popular and becoming an increasingly hot topic in the society and a useful tool for the public to download onto the mobile phones. With the development of digital technology, real estate APP platforms enable consumers to perceive the need for healthy, safe, comfortable, and environmentally friendly living and influence consumer behavior. In particular, COVID-19 has prompted digital technology to become an important factor influencing consumer behavior on real estate APP platforms [2,3], motivating the public to pay more attention to “living space” and “healthy habitat”. However, as an attractive technology-based product, the real estate APP platforms have improved the public’s access to high-quality and efficient housing services such as purchasing new and second-hand houses, rentals, and renovations, but they also face the challenge of “digital technology” requirements while meeting the basic housing needs of the society [4]. In the context of information digital technology, the launch of a real estate APP platform, which meets the consumer’s physical, psychological, and social needs, leads to changes in user behavior patterns, and although it has become an important issue for healthy habitat in a competitive market [5,6], few scholars have conducted in-depth studies.
As a customized online marketing platform for real estate enterprises, the real estate APP covers all the docking processes of the real estate channels. Its VR function not only enables online house viewing and chatting, but also connects consumers, brokers, and sales at the same time, ensuring comprehensive information exchange and timely communication, more efficient showing and explaining, and helping consumers understand the housing situation more scientifically and comprehensively [3]. More importantly, the real estate APP takes small program as the carrier, digital content as the basis and data-driven as the core, covering the complete online and offline marketing scenarios. The real estate APP reconstructs the real estate marketing process, helps real estate companies reduce costs and increase efficiency in the era of supply and demand reversal and the disappearance of dividends, and redefines the new standard of real estate marketing in the digital era.
For consumers, the real estate APP platforms integrate the functions of second-hand, new housing and rental housing, which meet consumers’ housing search needs anytime and anywhere. Online anonymous consultation makes consumers at ease, news dynamic push makes them well-informed, service commitment gives them trust, and data real-time update constructs intimate relationship. In the real estate APP platforms, online house selection, VR viewing, online contracting, and other new scenarios of online house purchase break the time and space restrictions. Just a phone call, at any time, can be initiated to show and provide consumers with a safe and efficient service experience. Moreover, VR’s powerful product power can not only achieve 1:1 real show, effectively reconstructing the real situation of the house, but also reveal the real space of the house size, orientation, and distance, so that the consumers seem to be in the house themselves, experiencing more details.
Undoubtedly, the real estate APP platforms help to build the whole process of real estate marketing online customer acquisition, online follow-up, and online transaction services. However, consumers cannot achieve all this without the continuous use of the real estate APP. The only way to build customer satisfaction, build online marketing ecosystem, and enhance corporate brand influence is to get continuous use from users of real estate APP. It is indisputable that the issue of continuous user behavior of real estate APP platforms is crucial. Given the theory of technology readiness and acceptance model, technology readiness index (TRI) is a combination of psychological enablers and inhibitors that affect the individual’s attitude and tendency toward technology products, thus changing the user acceptance pattern of technology products [7,8]. For this reason, understanding TRI on user behavior patterns toward real estate APP platforms has become an urgent and important issue. Therefore, TRI brings new challenges along with opportunities for technology products. The real estate APP platforms are a typical technology product, and users’ continued use depends on the driving effect of TRI on consumers. However, empirical research on technology readiness is much limited as an important influencing factor driving consumer usage behavior [8,9] bringing positive drivers and negative disincentives to users. Drawing on the theory of technology readiness and acceptance model, it is therefore necessary to explore the important impact outcomes of TRI driving consumer usage behavior.
More importantly, previous studies have not explored user behavior patterns from the perspective of digital technology, which may ignore the high importance that users currently attach to “housing services” and “digital technology”. In particular, the global popularity of COVID-19 has led to an increased awareness of the importance of health, and people are paying more attention to the deeper relationship between “housing services” and “digital technology”. In summary, this paper proposes a conceptual theoretical model based on technology readiness and acceptance model and selects real estate APP platform users as participants to examine user sustainable behavior patterns toward real estate APP platforms using structural equation modeling (SEM). Our research helps to guide the management practices of real estate APP platforms to understand the importance of health, safety, comfort, and environmentally friendly living services to consumers, with a view to promote the sustainable development of real estate APP platforms in the post-COVID era, meet users’ basic psychological needs, and ultimately promote their physical and mental health. Figure 1 displays our theoretical model.

2. Theoretical Foundation and Research Hypotheses

2.1. Theory of Technology Readiness and Acceptance Model

Lin et al. [8] proposed a new theoretical model based on the technology acceptance model (TAM) by introducing TRI, which is the theory of technology readiness and acceptance model (TRAM). TAM has been applied mainly in studies to predict individuals’ acceptance behavior of technology products in the work environment or to explain the factors influencing the behavior of technology products [10], but the influence of individual differences in system users (i.e., technology readiness index) on this model was not discussed [11]. Therefore, Lin et al. [8] maintained a skeptical view of the applicability of TAM in marketing environments. To validate the role of individual differences (technological readiness) in technology products on continuance intention, Lin et al. [8] introduced TRI based on TAM to re-establish TRAM for the marketing context. The theoretical model emphasizes that TRI has an influencing role on the continuance intention and effectively explaining customer behavior patterns toward technology products. In addition, TRAM also asserts the relationship between individuals’ perceived usefulness and perceived ease of use with the intention to use, further explaining individual behavior patterns toward technology products [12,13,14].
TRI is defined as the tendency of individuals to accept and use new technological products in their lives or work, which can be classified as positive enablers and negative inhibitors; the former consists of two constructs, optimism and innovativeness, and the latter, discomfort, and insecurity [9,15]. Optimism reflects the fact that technology has enhanced the learning or productivity of individuals in their daily lives; innovativeness refers to the individual’s desire to be a pioneer or an influencer in the use of new technology; discomfort refers to individuals feeling incompetent with technology or uncomfortable with its actual use. Insecurity refers to individuals’ distrust of the invention or use of technology and negative doubts about the function of technology. The stronger positive enablers, the stronger technology readiness index, indicating positive behavioral intentions toward technology products, while negative inhibitors decreases the technology readiness index, indicating negative behavioral intentions toward technology products [9]. Overall, TRI reflects an individual’s overall state of mind, which is determined by the interaction of psychological enablers and inhibitors, and can be applied to consumers and any new technology product (especially Internet or APP-based products) to improve user satisfaction and behavior [13,14,16]. Following this logic, we argue that TRI positively affects the consumer usage intention for real estate APP platforms. The higher the degree of positive enablers, the higher the TRI, the higher the consumer willingness to use. This is because a higher degree of positive enablers is associated with a higher consumer TRI, prompting an increase in positive behavioral intentions toward real estate APP platforms. However, increasing levels of negative inhibitors may reduce consumer usage intentions as TRI increases. This is because negative inhibitors reduce individual TRI and lead to an increase in consumers’ negative behavioral intentions toward real estate APP platforms. Using the theory of technology readiness and acceptance mode, we therefore propose the TRI benefits consumer usage intentions.

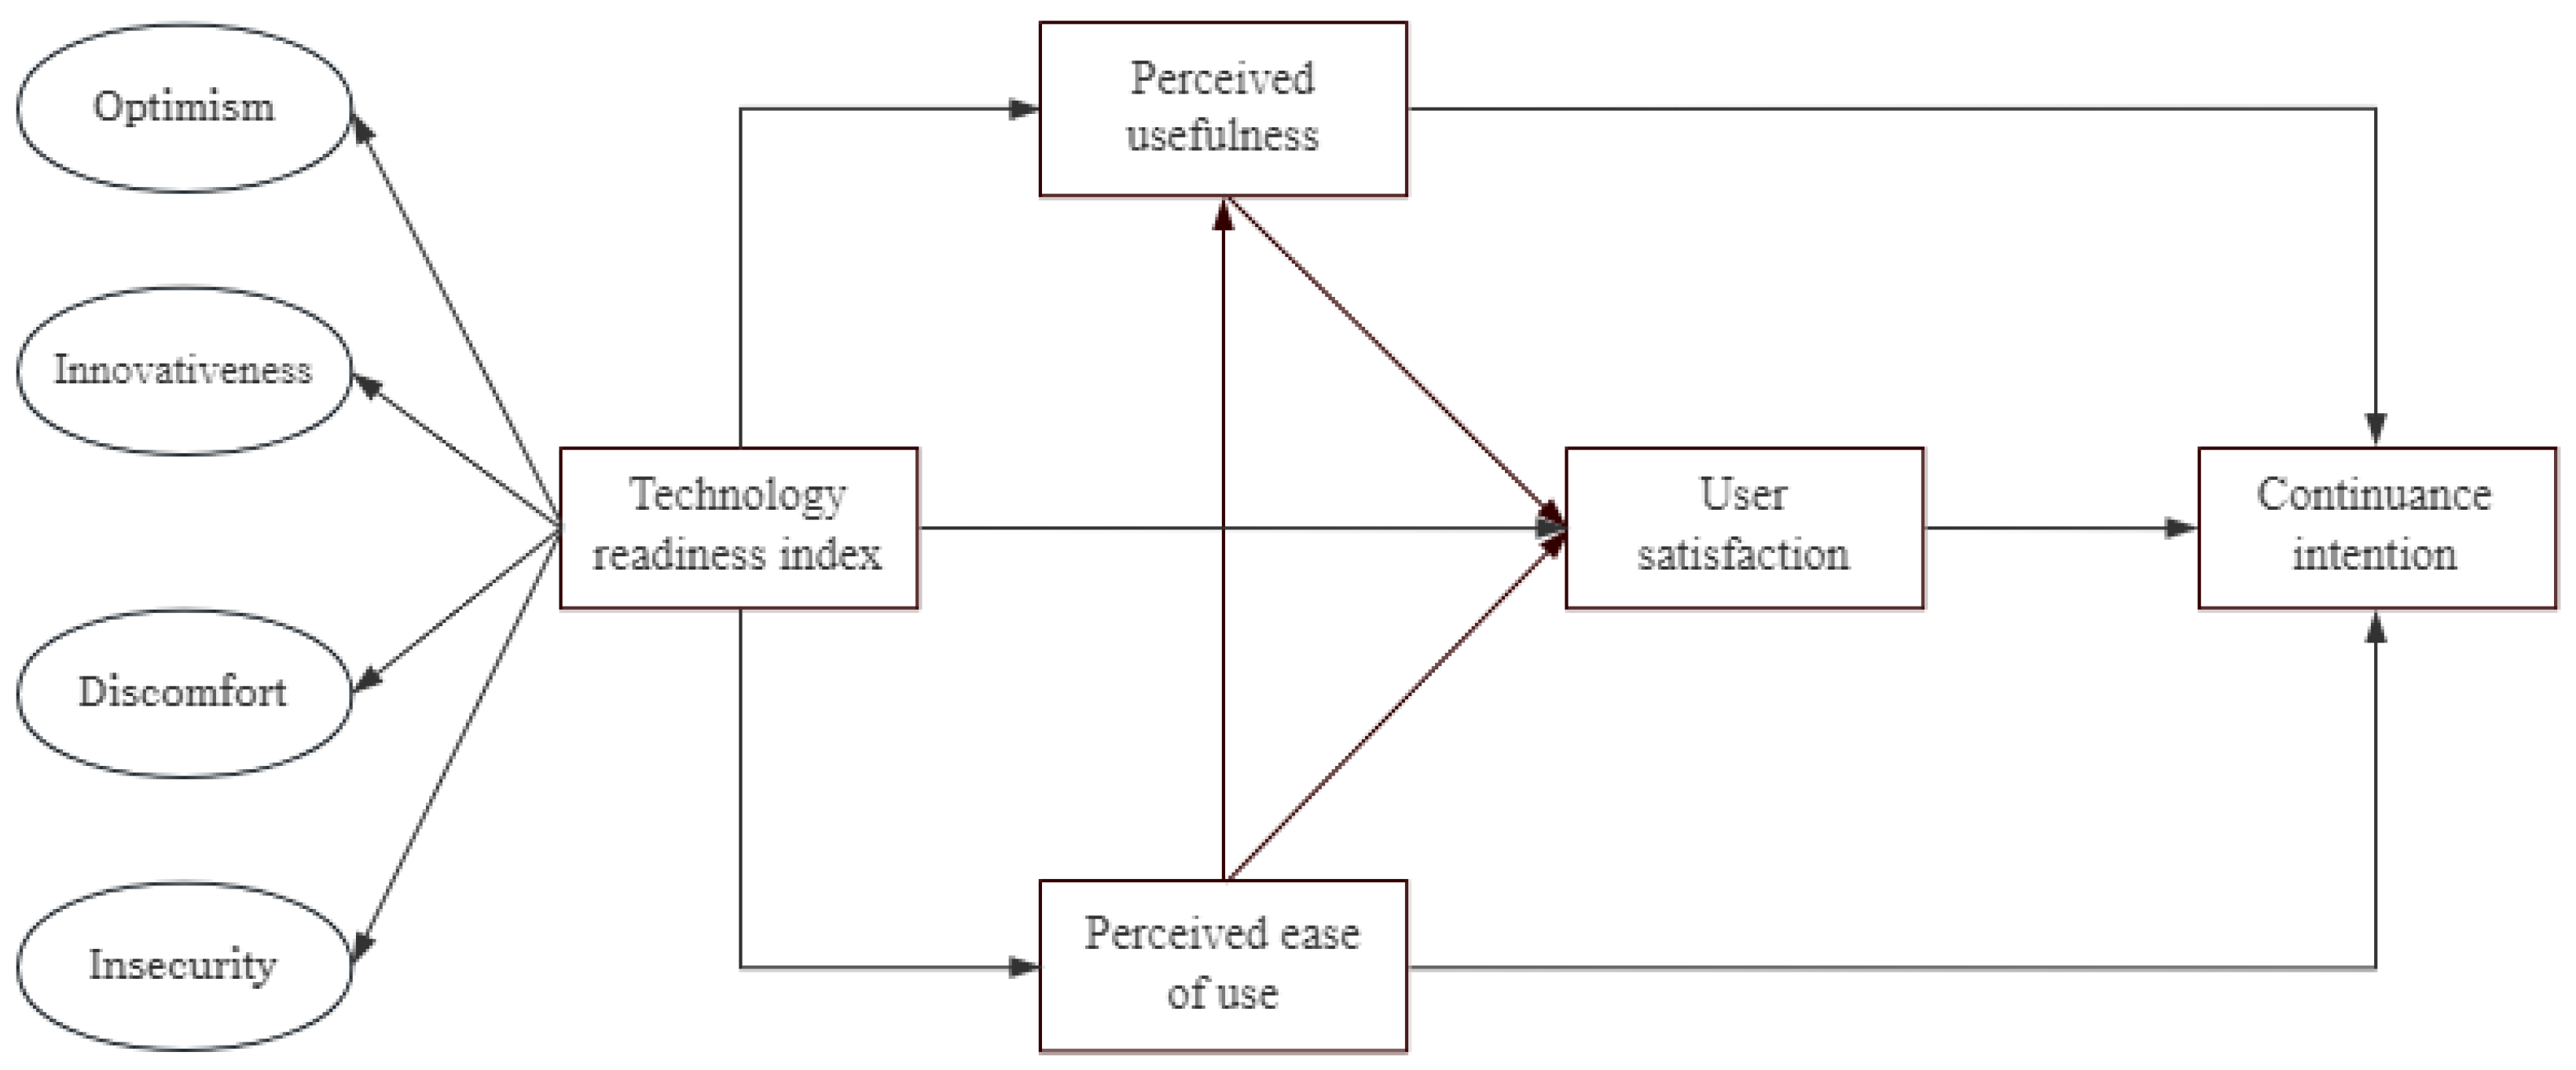
2.2. Research Model and Hypotheses

2.2.1. Technology Readiness Index, Perceived Usefulness, Perceived Ease of Use and Satisfaction toward Real Estate APP Platforms

TRAM suggests that TRI positively affects satisfaction, perceived usefulness, and perceived ease of use of technology products [12,13,14]. Moreover, expectation confirmation theory suggests that satisfaction is one of the most important factors in determining consumer behavior [8,17,18,19]. Combined with Lin & Hsieh [20] and Lin et al. [8], we hypothesize that TRI affects consumer satisfaction with real estate APP. In the context of real estate APP usage, as a digital service platform for the housing industry, the “high-tech” results of VR viewing based on real estate APP are reflected in all aspects of house buying and selling, and its TRI is more obvious. In particular, the higher the positive enablers in TRI, the higher the users’ positive intentions toward technology [7,9,10]. Enhancing users’ positive usage tendency of the technical factors of the real estate APP therefore supports increased consumer satisfaction, and also enhances the perceived usefulness and perceived ease of use for the real estate APP. Furthermore, since the real estate APP platforms are a typical technology-based product, given the applicability of TRAM in the real estate APP usage context, it can be seen that enhancing the positive enablers of TRI can make the real estate APP more satisfying, useful, and easy to use for consumers. Based on the above reasoning and in light of TRAM [8], we hypothesize:
H1: 
TRI positively affects individuals’ perceived usefulness toward real estate APP platforms.
H2: 
TRI positively affects individuals’ satisfaction with real estate APP platforms.
H3: 
TRI positively affects individuals’ perceived ease of use with real estate APP platforms.

2.2.2. Perceived Ease of Use and Perceived Usefulness toward Real Estate APP Platforms

TRAM illustrated the relationship between individuals’ perceived ease of use and perceived usefulness, suggesting that perceived usefulness positively affects individuals’ perceived ease of use and that higher perceived ease of use is associated with higher perceived usefulness [8,10,21]. In fact, considerable studies have demonstrated perceived ease of use has a significant effect on perceived usefulness [22,23]. This view is also suitable for real estate APP scenarios. At present, based on digital capability, real estate APPs are based on “people” (service providers), “things” (houses), and “transaction service process” to complete house buying and selling activities. It is clear that consumers not only feel the benefits of real estate APP in the house transaction process (i.e., perceptual ease of use), but also experience the usefulness of real estate APP. For example, consumers can see the actual properties without being physically present and switch to the decoration style with one click. In other words, the more obvious the perceived usability is, the more the perceived usefulness by the real estate APP is enhanced. This is consistent with prior scholarly testing of the important influence of individual perceived ease of use on perceived usefulness [22,23,24]. Thus, we expect that perceived ease of use by real estate APP platforms will induce perceived usefulness with real estate APP platforms.
H4: 
Perceived ease of use by real estate APP platforms positively affects individuals’ perceived usefulness with real estate APP platforms.

2.2.3. Perceived Usefulness, Perceived Ease of Use and Satisfaction toward Real Estate APP Platforms

TRAM and post-acceptance sustained use model theory of information system agree that both perceived usefulness and perceived ease of use influence satisfaction [8,25]. Scholars have conducted research on this topic, and studies have confirmed that users have post hoc expectations of the system (i.e., usefulness, ease of use), and that these expectations have a significant impact on user satisfaction with the system [24,26]. Given that a number of related works by scholars have confirmed that individuals’ perceived ease of use and perceived usefulness via information systems affects individual satisfaction [27,28], this research reasoned that the view should be equally suitable for real estate APP usage scenarios. In the context of real estate APP usage, sellers can answer customers’ house selection queries online through the real estate APP platforms, allowing consumers to achieve online reception without adding WeChat or Tencent Meeting. These online services allow consumers to experience the perceived usefulness of the real estate APP platforms. Furthermore, because the real estate APP platforms are supported by flexible control system and mature product functions, with process and data analysis technology as the means to bring users intelligent house hunting, VR house viewing and other advanced technology, house hunting functions to bring satisfactory experience for consumption. These further perceived usefulness and perceived ease of use, in turn, further increase consumer satisfaction [29,30]. Thus, we hypothesize:
H5: 
Perceived usefulness by real estate APP platforms positively affects individuals’ satisfaction with real estate APP platforms.
H6: 
Perceived ease of use by real estate APP platforms positively affects individuals’ satisfaction with real estate APP platforms.

2.2.4. Perceived Usefulness, Perceived Ease of Use and Continuance Intention toward Real Estate APP Platforms

Perceived ease of use and perceived usefulness affect individuals’ behavioral intentions toward technology products [31,32]. They are considered to be one of the dominant factors that promote users to use APP applications, and if users perceive a technology product easy to use, they will feel satisfied and use it [32,33,34,35]. Real estate APP platforms that are easy to use and provide useful assistance to consumers can influence customer satisfaction and propensity [31], thus prompting users to use real estate APPs more frequently. These prove Davis’ [10] argument that new technology products will not arouse continuance intention unless they are very easy to use. The real estate APP platforms allows real estate companies to transcend the offline marketing model and not be held back by distance and space, presenting their products online so that consumers can easily enjoy related services through the online platform. These perceived ease of use and perceived usefulness from the real estate APP platforms enable consumers to spend money online (e.g., viewing and buying a house), and increase the continuance intention of using the real estate APP platforms during the consumers’ viewing and buying process. In fact, numerous studies in the field have shown that perceived ease of use via real estate APP platforms may enhance individuals’ continuance intention [36,37]. Thus, we propose the following hypothesis in this research.
H7: 
Perceived usefulness of real estate APP platforms positively affects individuals’ continuance intention with real estate APP platforms.
H8: 
Perceived ease of use of real estate APP platforms positively affects individuals’ continuance intention with real estate APP platforms.

2.2.5. Satisfaction and Continuance Intention toward Real Estate APP Platforms

Satisfaction reflects the overall experience and the resulting evaluation and psychological state that individuals obtain through the system product or service and may promote eventual continued use [13,14,31,38,39]. Scholars [14,23,39] have found through empirical studies to verify the relationship between individuals’ satisfaction and continuance intention; when individuals are more satisfied with a technology product, more frequently will they show an intention to use it. In fact, in the past, some studies from different perspectives as well as different theoretical foundations have affirmed that individual satisfaction has an influential role on continuous use intention [31,36,40,41,42,43,44]. Given that the relationship between consumer satisfaction and continuance intention has become a hot research topic in both academia and business in recent years [5,24,45], we hypothesize that consumer satisfaction is undoubtedly an indispensable factor in assessing user behavior patterns of real estate APPs that influence user preference and continuance intention. Combined efficiently with PAD and cell phone instead of traditional manual statistics, real estate APP improves the efficiency of customer follow-up and transaction rate, and significantly improves the case site reception service and customer visits satisfaction, for case site management efficiency empowerment ultimately achieves efficient reception, customer follow-up, conversion, and users’ continuous intention to the platform [29]. Therefore, we expect that satisfaction will induce continuance intention toward real estate APP platforms.
H9: 
Satisfaction with real estate APP platforms positively affects individuals’ continuance intention with real estate APP platforms.

2.2.6. Mediating Role of Satisfaction toward Real Estate APP Platforms

The findings on TRAM suggested that TRI positively affected individuals’ perceived usefulness and ease of use, and ultimately individuals’ satisfaction [10,12,13,14]. Other works argued that TRI had a significant effect on satisfaction [20]. Chen et al. [46] conducted a study on customer experience and perceived value positively influencing sustainable social relationships in blogs and confirmed the effect of satisfaction on the continuance intention with blogs. According to the literature review and observation of user behavior, there is a very close relationship between TRI and continuance intention with APPs [47]. In general, after using the information system, users will naturally make an assessment of the TRI of the technology product, whether they are satisfied with the process or experience of using the technology product, to judge the influence of TRI on the users’ continuous use behavior [42]. Thus, we extend the previous literature argument that TRI affects satisfaction and ultimately continued usage intention. Whether perceived feelings affect continuous use behavior through customer satisfaction? It has been shown that individuals’ perceived usefulness and perceived ease of use not only have a direct driving role with persistent use behavior, but also indirectly influence persistent use behavior through satisfaction, and user satisfaction can generate continuous use behavior [26,32,33,34,35]. Therefore, we will analyze whether TRI and perceived feelings enhance users’ continuous use behavior patterns by influencing users’ satisfaction, i.e., satisfaction is a mediating role in influencing continuous use behavior. Thus, we propose:
H10a: 
Satisfaction with real estate APP platforms plays a mediating role between individuals’ TRI and individuals’ continuance intention toward real estate APP platforms.
H10b: 
Satisfaction with real estate APP platforms plays a mediating role between individuals’ perceived usefulness and individuals’ continuance intention toward real estate APP platforms.
H10c: 
Satisfaction with real estate APP platforms plays a mediating role between individuals’ perceived ease of use and individuals’ continuance intention toward real estate APP platforms.

3. Method

3.1. Participants and Procedure

Real estate APP platforms users were selected as participants in this study. Among the real estate APPs, Lianjia, BEKE, and Ziroom are the most basic real estate APPs with the strongest representation and the widest coverage of users. Lianjia is a data-driven property service platform based on a chain of more than 1000 directly managed shops and a team of more than 16,000 professional real estate property consultants and support staff, which allows consumers to filter properties by conditions. As a “technology-driven new housing service provider”, BEKE is committed to VR viewing/talking about housing and has provided 300 million Chinese families with a full range of high-quality and efficient housing services, including second-hand housing, new housing, leasing, and renovation. Ziroom has served nearly 5 million customers and managed over 1 million properties, eliminating all intermediate redundant links in the traditional rental model and establishing the largest O2O youth living community in China. Therefore, Lianjia, BEKE and Ziroom are the three real estate APPs in this study. If the conclusions drawn from our research can be verified by Lianjia, BEKE, and Ziroom, it will provide management suggestions for the corporate strategies for the platforms. Based on this perspective, the real estate APP platforms are responsive to our research. During the questionnaire survey, we first asked the head of human resources at Lianjia, BEKE, and Ziroom to recruit target participants and explain the purpose and process of this study to them. To ensure the reliability for the survey data, we selected users already using the APP for consumption. With the consent of the consumers, they were asked to participate in this questionnaire survey. We then sent the questionnaires (in envelopes) to the participants through the head of human resources at Lianjia, BEKE, Ziroom. Having been completed, the questionnaires were put back into the envelopes and sealed with double-sided tape, and then sent back and collected. And the participants got a nice gift as a souvenir. This study started mid 10 February 2022 and ended 19 June 2022.
We collected 350 paper questionnaires in total, excluding 52 invalid questionnaires, and finally received 298 valid questionnaires, with a sample efficiency of 66.2%. Based on this, this paper performs descriptive statistical analysis on the collected data. Descriptive statistics is a systematic method and statistical technique that takes a large amount of raw information, organizes, describes, and analyzes the information, and uses statistical tables to show the data clearly and in detail. In this study, SPSS24.0 statistical software was applied to investigate the control variables. Specifically, gender, age, education, marriage, and monthly consumption of the sample, and the number and percentage of class variables were analyzed. The valid sample of the questionnaire had the largest number of 154 (51.7%) males and 144 (48.3%) females. The largest number of participants were aged 25 to 35 years (49.7%), followed by 92 participants aged 36 to 45 years (30.9%) and 58 participants aged 45 years and over (19.4%). In terms of education level, 73 (24.5%) were undergraduates, 76 (25.5%) were specialists, and 149 (50.0%were postgraduates. As for the average monthly consumption level, 216 participants (72.5%) were below RMB 3500, 66 participants (20.1%) were between RMB 3500 and 6999, and 22 participants (7.4%) were above RMB 7000.

3.2. Measures

All measures in this study were derived from well-established scales that had been developed and validated in previous studies. Based on Brislin [48], we implemented the standard translation and back-translation procedures [48] to create the Chinese version measures, thus ensuring that all measurement items were applicable to the usage contexts of the real estate APP platforms. All measures were scored on a 7-point Likert scale ranging from 1 “strongly disagree” to 7 “strongly agree”, and see Appendix A for detailed measure items. Similar to Parasuraman & Charles [7]’s study, TRI was measured by using the abridged second-order scale of 18-item version of Parasuraman [9], Yen [49] and Chen et al. [36]. The scale is a formative second-order construct including 4 sub-constructs: optimism, innovativeness, discomfort, and insecurity. Participants rated the four-item scale developed by Davis [10] and Thong et al. [50] to evaluate their perceived usefulness. They assessed their perceived ease of use by using a 4-item scale adapted from Davis [10] and Thong et al. [50]. We used the 4-item scale from Bhattacherjee [25] that was specifically developed to measure the satisfaction of real estate APP platform users in the using process and the effect of real estate APP platforms. Similar to the study of Yang et al. [51], to measure the tendency of real estate APP platform users’ acceptance of the platforms after a long period of usage, we adopted the four-item scale from Bhattacherjee [27] and Thong et al. [50]. Finally, we also designed control variables. Scholars [50,52,53,54] noticed that demographic variables of interest had an impact on the relationship outcomes. Therefore, this study drew on previous research and collected control variables having explanatory power on the research model in the questionnaire survey. Statistical variables were gender, age, marriage, profession, and education.

3.3. Partial Least Squares (PLS)

The research model of this research include the formative indicators (i.e., technology readiness index), thus it is suitable to use PLS 4.0 to explore the user behavior patterns toward real estate APP platforms. PLS is an innovative and integrated approach across different academic fields, and has a high value in practical applications [55,56]. More importantly, the PLS statistical model can be set in both formative and reflective forms, which not only have the strength of mathematical calculations, but also are conducive to solving research problems, thus becoming a statistical methodological advantage [57,58,59]. Therefore, PLS is more suitable for the research topic of formative indicators [60]. SEM can better examine the causal relationship between potential variables and further test the model through path analysis. Our study contains both formative and reflective indicators, thus PLS quantitative statistical software is applied to examine PLS-SEM for theoretical exploration and theoretical validation.

4. Data Analyses

4.1. Outer Model

Fornell and Larker [61] and Nunnally [62] stated that factor loadings should be greater than 0.7, while composite reliability (CR) should be greater than 0.7, and Fornell and Larker [61] also suggested that average of variance extracted (AVE) should be greater than 0.5. Table 1 reports the convergent validity, the PLS analysis showed that factor loadings of OPT1, INN5, DIS2, and INS3 did not reach 0.7, and deleting these items would increase AVE and CR, thus they were deleted. Further data analysis showed that the factor loadings of the retained items were greater than 0.7 and therefore met the criteria. Moreover, the CR of all variables ranges from 0.89 to 95; indicating that the CR were greater than 0.7. In addition, the AVE of each variables ranges from 0.61 to 0.80; indicating that the AVE were greater than 0.5. According to the above statistical data, the study has good convergent validity.
Immediately afterwards, we examined the discriminant validity. First, for discriminant validity analysis for reflective indicators, we chose the AVE method for formative indicators (as shown in Table 2). This method indicated that the root of the AVE for each variables should be greater than the correlation coefficient of each pair of variables to indicate the discriminant validity among the constructs of reflective indicators [61]. The data of this study showed that the AVE between each variables were greater than the square of the correlation coefficient. According to the above statistical data, the study has good discriminant validity.
Second, discriminant validity analysis for formative indicators (as shown in Table 3). The correlation between the formative constructs should be less than 0.70, indicating good discriminant validity between the formative constructs [63,64]. The data of this study showed that the correlation between the variables of formative indicators was less than 0.70, which showed the qualified discriminant validity between the second-order formative model indicators. Therefore, each construct of reflective and formative indicators in this study has good discriminant validity.

4.2. Inner Model

4.2.1. Predictive Power Analysis for Inner Model

Smart PLS emphasizes the ability to construct formative indicators and does not provide goodness of fit index values, unlike the estimation of sample covariates that construct all constructs as reflective indicators. The R2 value and path coefficients are the major reference for judging the merits of the research model [65], and R2 values of endogenous potential variables greater than 0.67 are considered high explanatory power, R2 > 0.33 are considered medium explanatory power, and R2 > 0.19 are considered low explanatory power [65,66]. R2 = 0.62 for continuance intention, R2 = 0.56 for satisfaction, R2 = 0.37 for perceived usefulness, and R2 = 0.15 for perceived ease of use. Thus, R2 illustrates the excellent explanatory power for the inner model. The hypotheses test is determined by T-value, which is appropriate for the suitability of the potential variables, and a larger t-value indicates a stronger suitability strength. PLS uses a resample procedure for testing the significance of the path coefficients, and this study used bootstrapping [65] to analyze the significance of the path coefficients. If the standard value of T-value > 1.96, the level of significance is reached and the hypothesis is supported. See Table 4 for the path coefficients.
First, the direct impact of TRI on perceived usefulness was tested. The results were significant (T-value = 4.35 > 1.96): the TRI apparently impacts the perceived usefulness, thus supporting H1. Next, the direct effect of TRI on user satisfaction and the perceived ease of use were tested. The direct links between TRI and user satisfaction and perceived ease of use were correlated with H2 and H3 respectively. Results found that, both user satisfaction and perceived ease of use rose as TRI increased (Table 4). H2 (T-value = 8.25 > 1.96) and H3 (T-value = 6.44 > 1.96) were therefore both confirmed. H4 and H6 posited that perceived usefulness (H4) and user satisfaction (H6) benefits were perceived as the degree of perceived ease of use increased. The hypotheses testing indicated that the T-value perceived usefulness and user satisfaction benefits were indeed perceived to be higher as the degree of perceived ease of use increased. The path coefficient confirmed the significance of these differences in T-value (T-value = 6.62 > 1.96 for perceived usefulness and T-value = 5.71 > 1.96 for user satisfaction), thus confirming H4 and H6. Similarly, H5 (concerning the effect of perceived usefulness positively influences user satisfaction) and H7 (concerning the effect of perceived usefulness positively influences individuals’ continuance intention) were also confirmed, because the indirect effect was significant (T-value = 3.72 > 1.96 for user satisfaction and T-value = 3.72 > 1.96 for individuals’ continuance intention) (Table 4). Hence, H5 and H7 were supported. H8 concerning the direct influences of perceived ease of use affects individuals’ continuance intention was refuted because the direct effect was not significant (T-value = 1.92 < 1.96), thus the perceived ease of use does not positively influence individuals’ continuance intention. For H9 concerning the direct influences of user satisfaction benefits on continuance intention, the results were significant and confirmed the direct and positively influences of user satisfaction on individuals’ continuance intention. It appeared that user satisfaction (T-value = 14.08 > 1.96) increased the individuals’ continuance intention (Table 4). H9 was therefore accepted and supported.

4.2.2. Validity Analysis for Inner Model

According to Cohen [67], the effect size f2 = 0.02–0.15 (low), 0.15–0.35 (medium), >0.35 (high). The results of validity analysis for inner model is shown in Table 5. First, TRI → perceived usefulness, f2 = 0.10; TRI → satisfaction, f2 = 0.04; and perceived usefulness → continuance intention, f2 = 0.07; and perceived ease of use→ continuance intention, f2 = 0.02; thus, the above has a low effect size. Second, perceived usefulness → user satisfaction, f2 = 0.33; and perceived ease of use → perceived usefulness, f2 = 0.19; and perceived ease of use → user satisfaction, f2 = 0.15; TRI → perceived ease of use, f2 = 0.18; thus, the above has a medium effect size. Third, user satisfaction → continuance intention, f2 = 0.54; thus, this has a high effect size. As a result, all hypotheses have good effect size.

4.3. Mediating Effect Analysis

We finally tested the indirect influences of the degree of perceived usefulness, perceived ease of use and TRI on individuals’ continuance intention through the mediating variables considered in this research to deepen our knowledge of the mechanisms that govern this link between perceived usefulness, perceived ease of use, TRI, and continuance intention. H10a, H10b, and H10c were postulated for this purpose. We used the Sobel test method. When z-value > 1.96, it means that the result is supported at α = 0.05, that is, the mediation effect exists; partial mediation if the direct role is supported; fully mediated if the direct role is not supported [68,69].
The results, reported in Table 6, confirm the influences of perceived usefulness on continuance intention via user satisfaction (Sobel test z-value = 8.86 > 1.96), indicating that the result is significant at α = 0.05 and thus the mediating effect exists, and validates H10a. The results (see Table 6), confirm the indirect influences of perceived ease of use on continuance intention via user satisfaction (Sobel test z-value = 8.86 > 1.96), indicating that the result is significant at α = 0.05 and thus the mediating effect exists, and validates H10b. The results (see Table 6), confirm the influences of TRI on continuance intention via user satisfaction (Sobel test z-value = 8.86 > 1.96), indicating that the result is significant at α = 0.05 and thus the mediating effect exists, and validates H10c.

4.4. Further Analysis: Group Comparison between Male and Female

The above data analyzed user behavior patterns toward real estate APP platforms to verify the mediating role of satisfaction; more importantly, to verify the explanatory power of behavioral intention of real estate APP platforms. Based on this, we further analyzed whether there were gender differences in users’ usage behaviors on the real estate APP platforms through a multi-group comparison (MGA). That is, we discussed the invariance of the structural model of this study with cross-gender cohorts and the difference in usage behavior between male and female users. The users were further subdivided into two subgroups, male users and female users, and MGA using PLS was performed.
The purpose of multi-group analysis was to check for differences in path coefficients between the two different subgroups [70,71]. This study was based on a MGA of gender according to the parametric test (parametric test) provided by Sarstedt et al. [72]. See Table 7, the p-values of nine path coefficients were greater than α = 0.05, and the path coefficients for the male and female groups were not significantly different. Therefore, male and female users did not create further consumption differences and segmentation because of the differences (as shown in Table 7).

5. Conclusions

5.1. Discussion

First, H1, H2, and H3 are supported. And the findings are consistent with the results from the existing literature [8,12,13,14]. TRI positively influences perceived usefulness (H1). The reasons for this are presumed to be as follows. The higher the TRI, the greater the chance that users will be able to use it without much effort to solve technical problems, and with little effort to acquire health knowledge, such as healthy and environmentally friendly house decoration solutions and other practices contributing to digital technology. Thus, when TRI is high, digital technology awareness is also high, and accordingly, user perceived usefulness is high. TRI positively influences perceived ease of use (H2). The reasons for this are presumed to be as follows. The real estate APP platforms are designed to take into account the public’s demand for green and healthy ideas. Thus, when users use the APP, it is easy to get the general knowledge of healthy decoration. Therefore, when TRI is high, the digital technology awareness is also high, and the user perceived ease of use is high. TRI positively affects satisfaction (H3). The reason for this is that the higher the TRI, the higher the chance that users do not need to spend much time to resolve tech problems before using the APP. Spending overly long time can be harmful for users’ health, such as damaging eye sight, causing fatigue, and so on. Therefore, when TRI is high, the digital technology awareness is also high, and user satisfaction also rises.
Second, H4 is supported with results consistent with most TRAM findings [10,21,22,23,24]. The reason for this is that the easier the property APP to use, the greater the chance that users will not need to spend much time and effort in using it to solve digital technology-related problems, and spending less time and effort to learn about digital technology. Therefore, when the perceived ease of use is high, the perceived usefulness is also high. In addition, the findings show that both H5 and H6 are supported, and the results validate the arguments of Chen et al. [24] and Yin & Lin [26]. The possible reason for this is inferred to be that the real estate APP platforms satisfy the public’s need for digital technology and allows users to feel satisfied with the healthy renovation. The real estate APP platforms are the latest technology product and users attach considerable importance to the perceived ease of use and perceived usefulness of digital technology features. After using the real estate APP platforms, users have achieved the expected effect of providing digital technology (e.g., general knowledge of healthy decoration) on the real estate APP platforms, which is conducive to the users’ satisfaction of using the real estate APP platforms.
Third, on the one hand, the findings reveal that satisfaction by real estate APP platforms positively affects individuals’ continuance intention with real estate APP platforms (H9), and the results match those of Yin and Lin [26]. The possible reasons are inferred as follows. Users are more satisfied with the functions and operation methods of digital technology provided by the real estate APP platforms. For example, digital technology has become one of the topics that consumers care about in terms of home renovation. With a perfect operation system, the real estate APP platforms dispel users’ doubts, ensure the quality of renovation, and open up a beautiful, healthy, and happy lifestyle for users. Digital technology is recognized by users while the accumulated satisfaction positively influences continuance intention. Moreover, the current healthy habitat culture in China is prevalent; the real estate APP platforms in function just cater to the public demand for healthy habitat. Thus, it is accepted by people and stimulates users’ continuance intention. On the other hand, the results of the study confirm that perceived usefulness positively impacts continuance intention (H7), and the results match those of Osman et al. [13], Alonso-Dos-Santos et al. [31], and Marhefka et al. [14]. The main reason is that the real estate APP platforms provide services related to healthy habitat, so that users can feel that these healthy habitat services can help them, and continue to use the APP due to the benefits of digital technology. In addition, to enhance individuals’ usefulness by digital technology and to actively understand individuals’ needs in healthy habitat are also an important reasons for users’ continuance intention.
Fourth, the results of the research reveal that perceived ease of use does not have a significant effect on continuance intention (H8), which is inconsistent with the results of the existing literature [8,10,31,32,36,37]. The possible reasons for the inference are as follows. Although users are satisfied with the interface, various functions, and usage experience of the real estate APP platforms (i.e., perceived ease of use), perceived ease of use does not have a direct effect on continuance intention, but has a significant effect only via digital technology. In other words, it may be that whether or not users feel digital technology is the fundamental factor results from whether or not they can achieve a house purchase. When the role of digital technology is not obvious (i.e., less than expected or no results in use), the intention to use the real estate APP platforms is significantly reduced. More importantly, the digital technology consumer psychology may have a moderating role on the mass user usage behavior pattern. Since the real estate APP platforms mainly attract users through recommendation algorithm, i.e., capturing users’ consumption behavior and pushing their preferred content to them by means of technology. However, technology itself does not carry on a smart living role, which can lead to digital technology-hazardous behaviors in the process of buying and selling houses, and thus affects the continuous use behavior.
Fifth, the mediating role of satisfaction is confirmed. Individuals’ satisfaction is a mediating variable of continuance intention by individuals’ TRI, perceived ease of use, and perceived usefulness of real estate APP platforms. TRI can be used to motivate users’ behavioral intention to continue using real estate APP through customer satisfaction. Although satisfaction mediates the role of individuals’ perceived usefulness and perceived ease of use by real estate APP platforms on continuance intention, respectively, perceived ease of use and perceived usefulness have different effect sizes on continuance intention with real estate APP platforms. The magnitude of the effect of perceived usefulness and perceived ease of use on continuance intention differs; where perceived usefulness and continuance intention show a significant effect on each other, while the effect of individuals’ perceived ease of use is not supported. The reason for the inference is as follows. The real estate APP platforms should innovate perceptual ease of use from judging users’ perception of digital technology when cracking users’ consumption continuance intention. That is, design the real estate APP platforms with differentiation from the perspective of digital technology to break through the boundary of operational innovation in the homogeneous competition of APP platforms. To strengthen user digital technology differentiation on the basis of satisfaction is the most important concern of the current real estate APP platforms. In other words, the functional design of the homogenization problem of the real estate APP platforms is serious; the operation of the real estate APP platforms and the difficulty of the use are not significantly different, that is, the problem of homogeneity is outstanding. Moreover, the differentiation of digital technology is more obvious, that is, the differentiated application of users is prominent. This leads to the result that perceptual ease of use does not affect continuance intention via satisfaction, but affects continuance intention through the mediating role of digital technology.
Sixth, further analysis: the group comparison does not differ significantly in gender. The results of further analysis show that there is no significant difference between male and female users in the path coefficients of TRI on the continuance intention model. It indicates that the driving effect of TRI on the continuance intention model is stable in terms of behavioral intention and does not differ by gender. The reasons for this are inferred as follows. In recent years, high-quality smart living housing products and services have become a fashionable trend. Driven by the wave of technological revolution, the strong demand of the real estate market and the introduction and encouragement of corresponding innovation and entrepreneurship policies, there is a rapid rise of smart living as the core of the real estate APP applications. As a new type of product that provides sales of new and second-hand houses, rental houses and commercial offices, home decoration and cleaning services, and so on, the real estate APP comprehensively satisfies consumers’ concept of healthy living, the product functions and positioning are more likely to be liked and accepted by the younger generation of consumers. Among them, the users of the real estate APP platforms are mainly young people aged 25–35, and these young people have received higher education and have higher acceptance ability to promote the concept of smart living. Therefore, there is no difference between women and men in the pursuit of healthy living environment as a trend and fashion. Therefore, the path coefficients for the male and female groups were not significantly different.

5.2. Theoretical Contributions

First, the present study reveals that TRAM has strong theoretical explanation for the user behavior pattern of Chinese real estate APP platforms. Although relevant research on the users’ behavioral intentions toward real estate APP platforms in developed countries has been relatively abundant, research on continuous consumption behavior of real estate APP platforms users in China is extremely limited. Given the differences in social contexts such as socio-cultural, national laws, and consumption habits, it is highly necessary to analyze the universality of persistent usage behavior patterns of real estate APP platform users from a theoretical perspective. The hypotheses of this study are verified from H1 to H10, except for H8, which is not verified. More importantly, the structural model validity of this study indicates that most of the R2 values are >3, indicating that the inner model has excellent explanatory power. And the outer model has good convergent validity and discriminant validity, so the findings presented by the data on the use of real estate APP platforms by the mass users verified by the study sample can explain the actual usage situation.
Second, the applicability of TRAM is verified by introducing TRI into the real estate APP platforms usage context. At present, TRAM has been a frontier theory for theoretical innovation and business practice concerns, and has received wide attention, in-depth development and application in the fields of information systems and high-tech products, etc., for example, exploring the impact of user behavior patterns based on TRAM, and exploring the mechanism of the role of continuous use of virtual information systems, etc. However, in the face of the booming and widespread use of real estate APP platforms, the differences between the use contexts and the broader information system environment, in addition to the similarities, are clearly more pronounced, such as the characteristics of VR viewing, VR speaking, and VR showing. Based on this, this study applies TRAM to the real estate APP usage context. This is a further expansion and development of the application of TRAM from the information system environment to a specific real estate APP, extending a new research area for the application of TRAM.
Third, a theoretical model of technological factors influencing persistent intention is established. At present, empirical research on the factors influencing real estate APPs is limited, previous scholars mostly studied the formation motives of real estate APP platforms, the continuance intention and role mechanism based on the qualitative research paradigm, and findings lack the empirical evidence testing support, which affects the generalizability of the conclusions. To make up for the shortcomings of previous empirical studies in the field of real estate APPs, this study uses questionnaires to collect data from users of Lianjia, BEKE, and Ziroom, and constructs a structural equation model to predict users’ continuance intention by technological factors. As a result of PLS-SEM, this paper finds the influencing role of users’ TRI, perceived ease of use, and perceived usefulness on usage behavior, and examines the mediating role of satisfaction. The findings of this paper make up for the shortcomings of previous empirical studies on the influence of real estate APP usage behavior, and enrich the research on explaining users’ continuance intention from the perspective of technology factors, and provide reference for further research.

5.3. Practical Implications

First, highlight the role of smart living in user behavior patterns toward real estate APP platforms. With the dramatic growth of PC and rise of network economy, China’s real estate APP platforms are emerging, and various APPs are taking turns to win the “hearts” of consumers and the favor of the capital market. With the attraction of many real estate APP platforms, the number of real estate APP platforms around digital technology is also increasing, but the initial development period of the market shows a lack of constraints. In this regard, the relevant departments and industry associations should attach importance to the function of digital technology in the real estate APP platforms and restrain the users of the real estate APP platforms from continuously using digital technology-related content in their behavior patterns, such as, developing digital technology monitoring index system in the real estate APP platforms, and providing users with a variety of intelligent services by integrating resources and creating a platform. Moreover, consumers not only demand better homes, but also pay more attention to environment, health, and intelligence. In this regard, real estate APP platforms should provide healthy home as the fundamental condition to meet consumers’ needs, provide consumers with information of second-hand houses, new houses, rental houses, commercial offices, home decoration, cleaning, and other services from the perspective of digital technology, and promote the use value and long-term effectiveness of human-computer interaction in user behavior patterns. For example, cooperate with professional institutions to form a theoretical basis to do indoor environment analysis, so as to meet the demands of different customers, different climates, different spaces, different times, different individual health and comfort.
Second, insight into the changes in consumer behavior and psychology to guide healthy consumer behavior. Real estate APP platforms bring consumers basic needs while accompanied by great instability, and needs deep insight into the changes in consumer behavior and psychology to guide healthy consumer behavior. In 2020, COVID-19 arrived unexpectedly, triggering the public to think about “life” and “healthy lifestyles”, and prompting human beings to raise the requirements of living space to a higher level. In this regard, through the real estate APP platforms to respond to the user demand for a better living space, real estate APP platforms can help people plan and improve the housing epidemic prevention and ventilation, space drainage, and other living conditions closely related to health. For example, a series of user pain points are solved with professional overall solutions. With the sharing activities of the real estate APP platforms, we provide users with high-quality residences, so that more families have ideal high-quality home life and help upgrade the quality of the real estate industry. The healthy habitat research is conducted through the real estate APP platforms, and related products and services are launched to create a healthier living environment and a healthier lifestyle for customers. Focusing on the perspective of digital technology, we focus on digging deeper into the current habitat pain points and help healthy user behavior patterns. To meet the basic requirements of residential buildings, we highlight the health elements by carefully considering every detail of the residents’ lives to meet their basic psychological needs at multiple levels and create a healthier, safer, more comfortable, and environmentally friendly high-quality community for the residents.
Third, enhance TRI’s positive enablers in the real estate APP platforms. With the global epidemic of COVID-19, there is a growing concern about the insightful relationship between housing and health. As an important part of the real estate industry, real estate APP platforms should demonstrate TRI’s active role in addressing COVID-19, meeting people’s needs for quality housing and healthy habitat, utilize the positive driving force of TRI in the real estate APP platforms to enhance user satisfaction and behavior patterns. We implant smart home system, improve indoor environment quality, improve public activity space, provide medical rescue services in the community, and dock property services in the real estate APP platforms. Through the timely response of the real estate APP platforms to the needs of users and convenient and rapid communication, the application gives intelligent and healthy home use scenarios to thousands of households to bring well-being to users by utilizing the positive driving force of TRI in the real estate APP platforms, and implanting an intelligent building system in the real estate APP platforms to enhance user perceptions and behavioral patterns. Intelligent building is a combination of green technology and health and safety, a new product closely related to users’ health, which realizes the standard of healthy habitat in multiple dimensions such as upgrading architectural design from green technology, upgrading living space for comfort and health, and upgrading ecological environment for energy saving and environmental protection. Therefore, with the positive driving force of TRI, the intelligent building function in the real estate APP platforms can be studied and developed in depth and promote the physical and mental health of building users.

5.4. Limitations and Future Research

First, there are limitations in the data collection of this study. As the study was performed offline, questionnaire collection and survey during COVID-19 proved to be difficult. Although the questionnaire was distributed with due consideration to the representatives of the sample to the overall population, the collection process was complex and labor intensive, and limitations existed of the questionnaire in controlling for external variables. More importantly, the impact of COVID-19 led to the difficulty posed by offline questionnaires. These co-existing objective circumstances together lead to a sample with some limitations. Future attempts could be made to increase the number of data collected by a larger questionnaire or by adopting an online questionnaire, thus enhancing the representative of the data analysis results.
Second, there are limitations in the source of the group samples in this study. Although this study used a progressive paradigm of multiple group analyses, which is significantly superior to the research paradigm relative to general quantitative studies, the groups in this study were limited to gender attributes only, and future studies could conduct data collection in a broader context. For example, in cities with obvious economic consumption levels and characteristics, such as eastern, central, and greater southwest, we can conduct group comparison analyses with larger sample groups. Furthermore, a group comparison of real estate APP platforms in foreign developed countries is carried out to explore consumer behavior patterns in different economic regions and countries, and provide marketing strategies for real estate APP platforms in different market segments, thus enhancing the universality of research results.
Additionally, this research concerned the mechanism of user influence on the behavioral patterns from a technological perspective, and public health may be an important perspective in influencing user behavior pattern toward real estate APP platforms. However, specific aspects of public health were not developed to be discussed, for example, low-carbon, sub-health, high-end healthy communities, mental health, and subjective well-being, etc. Thus, future research can consider further exploring the enablers and inhibitors brought by TRI to users based on different components of public health, and examining the changes in the impact of TRI on user behavioral patterns in specific public health contexts.

Author Contributions

Conceptualization, M.Y. and L.F.; methodology, M.Y., P.L. and L.F.; formal analysis, P.L., H.Z., Z.L. and L.F.; supervision, M.Y. and L.F.; validation, M.Y. and L.F.; writing—original draft preparation, M.Y., H.Z., Z.L. and P.L.; writing—review and editing, M.Y., H.Z., Z.L. and L.F. All authors have read and agreed to the published version of the manuscript.

Funding

This research was financially supported by Humanities and Social Sciences Planning Project of the Ministry of Education (No. 21YJA630014).

Institutional Review Board Statement

Not applicable.

Informed Consent Statement

Not applicable.

Data Availability Statement

The data presented in this study are available on request from the corresponding author.

Conflicts of Interest

The authors declare no conflict of interest.

Appendix A

Table A1. Measure items.
VariablesItemsSource
OptimismOPT1: I hope I could use the most advance technology.
OPT2: Technology allows me to work more efficiently.
OPT3: I am excited about new technology.
OPT4: Technology allows me to have more freedom for action.
OPT5: I feel that learning how to use the technology could bring me a lot of benefits.
[7,9,36,49]
InnovativenessINNO1. My friends would like to learn the knowledge of new technology from me.
INNO2. The problems I encountered when using high-tech products are less comparing with others.
INNO3. When there is a new high-tech product available, I am usually the first one to acquire it among my friends.
INNO4. I can understand the new high-tech products or services by myself.
INNO5. In my field of interests, I can always keep up with the latest technology.
[7,9,36,49]
DiscomfortDIS1. Occasionally, I think some technology products are not designed for the general public to use.
DIS2. I am embarrassing when I cannot not use the high-tech products right.
DIS3. The manual of high-tech products (services) is not easy to understand.
DIS4. When I receive technical support from high-tech product or service provider, sometimes I feel I take advantage of others.
[7,9,36,49]
InsecurityINS1: I think it is not secure to enter the credit card number on Internet.
INS2: I think it is not safe to do financial transactions online.
INS3: I am worried about the information I sent over the Internet would be seen by the others.
INS4: I do not have confidence in transactions that could only be done online.
[7,9,36,49]
Perceived ease of usePEOU1. The process of using Lianjia/BEKE/Ziroom is competent for me.
PEOU2. It is easy to use Lianjia/BEKE/Ziroom to operate intelligent housing service.
PEOU3. I can clearly understand how to use Lianjia/BEKE/Ziroom.
PEOU4. I can use all the functions provided by Lianjia/BEKE/Ziroom skillfully.
[10,50]
Perceived usefulnessPU1. Using Lianjia/BEKE/Ziroom can promote the goal of intelligent housing services.
PU2. Using Lianjia/BEKE/Ziroom can increase the effect of intelligent housing services.
PU3. Using Lianjia/BEKE/Ziroom can improve the efficiency of intelligent housing services.
PU4. Overall, I think that using Lianjia/BEKE/Ziroom is useful for promoting intelligent housing services.
[10,50]
User satisfactionUS1. I am satisfied with the service provided by Lianjia/BEKE/Ziroom.
US2. I am satisfied with the efficiency of sharing information and contact with Lianjia/BEKE/Ziroom.
US3. My decision to use Lianjia/BEKE/Ziroom is wise.
US4. Overall, I think the experience of using Lianjia/BEKE/Ziroom is satisfactory.
[25]
Continuance intentionCI1. I use Lianjia/BEKE/Ziroom to communicate with friends and share information.
CI2. When I have the need, I use Lianjia/BEKE/Ziroom.
CI3. In the future, I will continue to use Lianjia/BEKE/Ziroom.
CI4. I recommend Lianjia/BEKE/Ziroom to my friends.
[27,50,51]

References

  1. Milkovich, K.; Shirur, S.; Desai, P.K.; Manjunath, L.; Wu, W. ZenDen—A Personalized House Searching application. In Proceedings of the 2020 IEEE Sixth International Conference on Big Data Computing Service and applications (BigDataService), Oxford, UK, 28 August 2020. [Google Scholar]
  2. Yoon, Y.K. O2O Service Based Mobile Real Estate Brokerage Service APP Design Development Plan. J. Cult. Prod. Des. 2020, 62, 145–156. [Google Scholar]
  3. Kim, W.; Yoon, Y.K. A Study on Real Estate Service Design Using Untact Culture and 360 VR. J. Cult. Prod. Des. 2020, 63, 229–238. [Google Scholar]
  4. Sook, S.I. An Empirical Study on Real Estate Brokerage APP Based on O2O Service. Soc. Converg. Knowl. Trans. 2019, 7, 87–93. [Google Scholar]
  5. Seo, I.J.; Lee, J.Y.; Lee, J.S. A study on consumer satisfaction toward real estate mobile APP. Consum. Policy Educ. Rev. 2017, 13, 125–150. [Google Scholar] [CrossRef]
  6. Lee, H.; Jaewoong, W.; Park, D. The Effects of Real Estate Service Platforms on Changes in User Perception and Real Estate Related Activity. J. Real Estate Policy Res. 2022, 23, 42–56. [Google Scholar]
  7. Parasuraman, A.; Charles, L.C. An updated and streamlined technology readiness index: TRI 2.0. J. Serv. Res. 2015, 18, 59–74. [Google Scholar] [CrossRef]
  8. Lin, C.H.; Shih, H.Y.; Sher, P.J. Integrating technology readiness into technology acceptance: The TRAM model. Psychol. Mark. 2007, 24, 641–657. [Google Scholar] [CrossRef]
  9. Parasuraman, A. Technology readiness index: A multiple-item scale to measure readiness to embrace new technologies. J. Serv. Res. 2000, 2, 307–320. [Google Scholar] [CrossRef]
  10. Davis, F.D. Perceived usefulness, perceived ease of use, and user acceptance of information technology. MIS Q. 1989, 13, 319–340. [Google Scholar] [CrossRef]
  11. Mathieson, K. Predicting user intentions: Comparing the technology acceptance model with the theory of planned behavior. Inf. Syst. Res. 1991, 2, 173–191. [Google Scholar] [CrossRef]
  12. Walczuch, R.; Lemmink, J.; Streukens, S. The effect of service employees’ technology readiness on technology acceptance. Inf. Manag. 2007, 44, 206–215. [Google Scholar] [CrossRef]
  13. Osman, H.M.; Mahinderjit, M.; Serafin, M.; Rahman, A.; Abu, A. Enhanced analytical hierarchy process for u-learning with near field communication (nfc) technology. Int. J. Adv. Comput. Sci. Appl. 2018, 9, 281–290. [Google Scholar] [CrossRef]
  14. Marhefka, S.L.; Turner, D.; Lockhart, E. Understanding women’s willingness to use e-health for hiv-related services: A novel application of the technology readiness and acceptance model to a highly stigmatized medical condition. Telemed. E-Health 2019, 25, 511–518. [Google Scholar] [CrossRef] [PubMed]
  15. Zhao, Q.; Shi, G.H.; Shao, S.L. Effect Mechanism of Technical Readiness on Mobile Library Service Quality. Libr. Inf. Serv. 2015, 59, 33–40. [Google Scholar]
  16. Shi, G.H.; Xia, Q.L. Technology Readiness: Connotation, Dimensions, Measurement and Review. Sci. Technol. Prog. Policy 2014, 31, 120–125. [Google Scholar] [CrossRef]
  17. Nguyen, G.D.; Ha, M.T. The role of user adaptation and trust in understanding continuance intention towards mobile shopping: An extended expectation-confirmation model. Cogent Bus. Manag. 2021, 8, 1980248. [Google Scholar] [CrossRef]
  18. Tse, D.K.; Wilton, P.C. Models of consumer satisfaction formation: An extension. J. Mark. Res. 1988, 25, 204–212. [Google Scholar] [CrossRef]
  19. Oliver, R.L.; Richard, L. A cognitive model of the antecedents and consequences of satisfaction decision. J. Mark. Res. 1980, 17, 460–469. [Google Scholar] [CrossRef]
  20. Lin, C.J.S.; Hsieh, P.L. The influence of technology readiness on satisfaction and behavioral intentions toward self-service technologies. Comput. Hum. Behav. 2007, 23, 1597–1615. [Google Scholar] [CrossRef]
  21. Lin, C.W.; Tsai, Y.X.; Chang, Y.S.; Ding, Y.J.; Liu, J.C.; Lin, Y.S. Applying the Decomposed Theory of Planned Behavior to Explore the Influencing Factors of NTC APP Usage Intention. J. Funct. Spaces 2021, 2021, 7045242. [Google Scholar] [CrossRef]
  22. Motaher, H.M.; Zahidul, I.; Al, M.A.; Sukanta, B.; Alamgir, H.M. Behavioral intention and continued adoption of facebook: An exploratory study of graduate students in Bangladesh during the COVID-19 pandemic. Management 2021, 25, 153–186. [Google Scholar]
  23. Lin, H.C.; Chiu, Y.H.; Chen, Y.J.; Wuang, Y.P.; Chen, C.P.; Wang, C.C.; Huang, C.L.; Wu, T.M.; Ho, W.H. Continued use of an interactive computer game-based visual perception learning system in children with developmental delay. Int. J. Med. Inform. 2017, 107, 76–87. [Google Scholar] [CrossRef] [PubMed]
  24. Chen, S.C.; Yenb, D.C.; Pengc, S.C. Assessing the impact of determinants in e-magazines acceptance: An empirical study-sciencedirect. Comput. Stand. Interfaces 2018, 57, 49–58. [Google Scholar] [CrossRef]
  25. Bhattacherjee, A. Understanding information systems continuance: An expectation- confirmation model. MIS Q. 2001, 25, 351–370. [Google Scholar] [CrossRef]
  26. Yin, L.X.; Lin, H.C. Predictors of customers’ continuance intention of mobile banking from the perspective of the interactivity theory. Econ. Res.-Ekon. Istraz. 2022, 34, 6820–6849. [Google Scholar] [CrossRef]
  27. Bhattacherjee, A. An empirical analysis of the antecedents of electronic commerce service continuance. Decis. Support Syst. 2001, 32, 201–214. [Google Scholar] [CrossRef]
  28. Wu, H.C.; Cheng, C.C.; Hussein, A.S. What drives experiential loyalty towards the banks? The case of Islamic banks in Indonesia. Int. J. Bank Mark. 2019, 37, 595–620. [Google Scholar] [CrossRef]
  29. Lim, M.H.; Lim, G.G. A study on the satisfaction and reuse of real estate O2O (online to offline) APP services. Inf. Syst. Rev. 2016, 18, 97–110. [Google Scholar] [CrossRef]
  30. Kang, S.G.; Kim, D.Y.; HO, R.M. Real Estate Service APP Review Analysis Using Text Mining. J. Inf. Syst. 2021, 30, 227–245. [Google Scholar]
  31. Alonso-Dos-Santos, M.; Soto-Fuentes, Y.; Valderrama-Palma, V.A. Determinants of mobile banking users’ loyalty. J. Promot. Manag. 2020, 26, 615–633. [Google Scholar] [CrossRef]
  32. Zhang, T.; Lu, C.; Kizildag, M. Banking “on-the-go”: Examining consumers’ adoption of mobile banking services. Int. J. Qual. Serv. Sci. 2018, 10, 279–295. [Google Scholar] [CrossRef]
  33. Veríssimo, J.M.C. Enablers and restrictors of mobile banking APP use: A fuzzy set qualitative comparative analysis (fsQCA). J. Bus. Res. 2016, 69, 5456–5460. [Google Scholar] [CrossRef]
  34. Sampaio, C.H.; Ladeira, W.J.; Santini, F.D.O. APP for mobile banking and customer satisfaction: A cross-cultural study. Int. J. Bank Mark. 2017, 35, 1133–1153. [Google Scholar] [CrossRef]
  35. Shankar, A.; Jebarajakirthy, C.; Ashaduzzaman, M. How do electronic word of mouth practices contribute to mobile banking adoption? J. Retail. Consum. Serv. 2020, 52, 101920. [Google Scholar] [CrossRef]
  36. Choi, K.J.; Wang, Y.; Sparks, B.A.; Choi, S.M. Privacy or Security: Does It Matter for Continued Use Intention of Travel Applications? Cornell Hosp. Q. 2023, 64, 267–282. [Google Scholar] [CrossRef]
  37. Cho, J. The impact of post-adoption beliefs on the continued use of health APP. Int. J. Med. Inform. 2016, 87, 75–83. [Google Scholar] [CrossRef] [PubMed]
  38. Zhao, L.; Lu, Y. Enhancing perceived interactivity through network externalities: An empirical study on micro-blogging service satisfaction and continuance intention. Decis. Support Syst. 2012, 53, 825–834. [Google Scholar] [CrossRef]
  39. Lin, C.P.; Yuan, H.T.; Chiu, C.K. Modeling customer loyalty from an integrative perspective of self-determination theory and expectation–confirmation theory. J. Bus. Psychol. 2009, 24, 315–326. [Google Scholar] [CrossRef]
  40. Zhou, T. An empirical examination of users’ post-adoption behavior of mobile services. Behav. Inf. Technol. 2011, 30, 241–250. [Google Scholar] [CrossRef]
  41. Chen, S.C.; Yen, D.C.; Hwang, M.I. Factors influencing the continuance intention to the usage of web 2.0: An empirical study. Comput. Hum. Behav. 2012, 28, 933–941. [Google Scholar] [CrossRef]
  42. Roca, J.C.; Chiu, C.M.; Martínez, F.J. Understanding e-learning continuance intention: An extension of the technology acceptance model. Int. J. Hum.-Comput. Stud. 2006, 64, 683–696. [Google Scholar] [CrossRef]
  43. Kwon, N. User satisfaction with referrals at a collaborative virtual reference service. Inf. Res. 2006, 11, 246. [Google Scholar]
  44. Tam, C.; Santos, D.; Oliveira, T. Exploring the influential factors of continuance intention to use mobile apps: Extending the expectation confirmation model. Inf. Syst. Front. 2020, 22, 243–257. [Google Scholar] [CrossRef]
  45. Lin, H.C.; Han, X.; Tu, L.; Ho, W.H.; Xu, Y.; Hsieh, T.C.; Zhu, L.; Zhang, L. Task-technology fit analysis of social media use for marketing in the tourism and hospitality industry: A systematic literature review. Int. J. Contemp. Hosp. Manag. 2020, 32, 2677–2715. [Google Scholar] [CrossRef]
  46. Chen, S.C.; Liu, M.L.; Lin, C.P. Integrating technology readiness into the expectation-confirmation model: An empirical study of mobile services. Cyberpsychol. Behav. Soc. Netw. 2013, 16, 604–612. [Google Scholar] [CrossRef]
  47. Gan, C.M.; Lin, T.T.; Xiao, C.; Xu, J.Y. An Empirical Study on Social Commerce Intention: From the Perspective of S-O-R Model. J. Mod. Inf. 2018, 38, 64–97. [Google Scholar]
  48. Brislin, R.W. The wording and translation of research instruments. In Field Methods in Cross-Cultural Research; Lonner, W.J., Berry, J.W., Eds.; Sage: Thousand Oaks, CA, USA, 1986; pp. 137–164. [Google Scholar]
  49. Yen, H.R. An attribute-based model of quality satisfaction for Internet self-service technology. Serv. Ind. J. 2005, 25, 641–659. [Google Scholar] [CrossRef]
  50. Thong, J.Y.L.; Hong, S.J.; Tam, K.Y. The effects of post-adoption beliefs on the expectation-confirmation model for information technology continuance. Int. J. Hum.-Comput. Stud. 2006, 64, 799–810. [Google Scholar] [CrossRef]
  51. Yang, M.S.; Hu, S.G.; Kpandika, B.E.; Liu, L. Effects of Social Attachment on Social Media Continuous Usage Intention: The mediating role of affective commitment. Hum. Syst. Manag. 2021, 40, 619–631. [Google Scholar] [CrossRef]
  52. Tsui, A.S.; O’Reilly, C.A. Beyond simple demographic effects: The importance of relational demography in superior-subordinate dyads. Acad. Manag. J. 1989, 32, 402–423. [Google Scholar] [CrossRef]
  53. Tepper, B.J.; Moss, S.E.; Duffy, M.K. Predictors of abusive supervision:supervisor perceptions of deep-level dissimilarity, relationship conflict, and subordinate performance. Acad. Manag. J. 2011, 54, 279–294. [Google Scholar] [CrossRef]
  54. Roberts, J.A.; David, M.E. Boss phubbing, trust, job satisfaction and employee performance. Personal. Individ. Differ. 2020, 155, 109702. [Google Scholar] [CrossRef]
  55. Dijkstra, T.K. PLS Janus Face-Response to Professor Risdon’s ‘Rethinking Partial LEAST Squares Modeling: In Praise of Simple Methods’. Long Range Plan. 2014, 47, 146–153. [Google Scholar] [CrossRef]
  56. Dijkstra, T.K.; Henseler, J. Consistent and asymptotically normal PLS estimators for linear structural equations. Comput. Stat. Data Anal. 2015, 81, 10–23. [Google Scholar] [CrossRef]
  57. Huber, F.; Herrmann, A.; Frederik, M.; Vogel, J.; Vollhardt, K. Kausalmodellierung Mit Partial Least Squares-Eine Anwendungsorientierte Einführung; Gabler: Wiesbaden, Germany, 2007. [Google Scholar]
  58. Henseler, J.; Ringle, C.M.; Sinkovics, R.R. The use of partial least squares path modeling in international marketing. In New Challenges to International Marketing. Bingley; Sinkovics, R.R., Ghauri, P.N., Eds.; Emerald: Bingley, UK, 2009; pp. 277–319. [Google Scholar]
  59. Bentler, M.; Huang, W. On Components, Laten Variables, PLS and Simple Methods: Reaction to Rigdon’s of PLS. Long Range Plan. 2014, 47, 138–145. [Google Scholar] [CrossRef]
  60. Fornell, C.; Bookstein, F.L. Two structural equation models: LISREL and PLS applied to consumer exit-voice theory. J. Mark. Res. 1982, 19, 440–452. [Google Scholar] [CrossRef]
  61. Fornell, C.; Larker, D.F. Evaluating structural equation models with unobservable variables and measurement error. J. Mark. Res. 1981, 18, 39–50. [Google Scholar] [CrossRef]
  62. Nunnally, J.C. Psychometric Theory, 2nd ed.; McGraw-Hill: New York, NY, USA, 1978. [Google Scholar]
  63. MacKenzie, S.B.; Podsakoff, P.M.; Jarvis, C.B. The problem of measurement model misspecification in behavioral and organizational research and some recommended solutions. J. Appl. Psychol. 2005, 90, 710–730. [Google Scholar] [CrossRef]
  64. Bruhn, M.; Georgi, D.; Hadwich, K. Customer equity management as formative second-order construct. J. Bus. Res. 2008, 61, 1292–1301. [Google Scholar] [CrossRef]
  65. Chin, W.W. The partial least squares approach for structural equation modeling. In Modern Methods for Business Research; Marcoulides, G.A., Ed.; Lawrence Erlbaum Associates: Mahwah, NJ, USA, 1998; pp. 295–336. [Google Scholar]
  66. Ringle, C.M. Gütemaße für den Partial Least Squares—Ansatz zur Bestimmungvon Kausalmodellen (Industrielles Management Arbeitspapier Nr. 16; Universität Hamburg: Hamburg, Germany, 2004. [Google Scholar]
  67. Cohen, J. Statistical Power Analysis for the Behavioral Sciences, 2nd ed.; Lawrence Earlbaum Associates: Hillsdale, NJ, USA, 1988. [Google Scholar]
  68. Sobel, M.E. Asymptotic confidence intervals for indirect effects in structural equation models. Sociol. Methodol. 1982, 13, 290–312. [Google Scholar] [CrossRef]
  69. MacKinnon, D.P.; Fritz, M.S.; Williams, J.; Lockwood, C.M. Distribution of the product confidence limits for the indirect effect: Program prodclin. Behav. Res. Methods 2007, 39, 384–389. [Google Scholar] [CrossRef] [PubMed]
  70. Gu, J.C.; Fan, L.; Suh, Y.H.; Lee, S.C. Comparing utilitarian and hedonic usefulness to user intention in multipurpose information systems. Cyberpsychol. Behav. Soc. Netw. 2010, 13, 287–297. [Google Scholar] [CrossRef] [PubMed]
  71. Wu, C.H.; Chen, S.C. Understanding the relationships of critical factors to Facebooks educational usage intention. Internet Res. Electron. Netw. Appl. Policy 2015, 25, 262–278. [Google Scholar] [CrossRef]
  72. Sarstedt, M.; Henseler, J.; Ringle, C.M.; Christian, M. Multigroup analysis in partial least squares (pls) path modeling: Alternative methods and empirical results. In Measurement and Research Methods in International Marketing; Emerald Group Publishing Limited: Bingley, UK, 2011. [Google Scholar]
Figure 1. Theoretical model.
Sustainability 15 08926 g001
Table 1. Convergent validity.
VariablesItemsFactor LoadingsCRAVER2
InsecurityINS10.870.880.71
INS20.92
INS40.72
DiscomfortDIS10.790.930.61
DIS30.72
DIS40.83
InnovativenessINN10.790.890.67
INN20.84
INN30.83
INN40.80
OptimismOPT20.850.900.77
OPT30.89
OPT40.87
OPT50.91
Perceived ease of usePEOU10.730.900.610.15
PEOU20.78
PEOU30.82
PEOU40.79
Perceived usefulnessPU10.900.950.800.37
PU20.92
PU30.89
PU40.87
User satisfactionUS10.880.930.780.56
US20.86
US30.88
US40.90
Continuance intentionCI10.850.940.750.62
CI20.89
CI30.84
CI40.88
Table 2. Discriminant validity analysis for reflective indicators.
Variables1234
1. Continuance intention0.87
2. User satisfaction0.770.88
3. Perceived ease of use0.460.630.78
4. Perceived usefulness0.630.680.560.89
Table 3. Discriminant validity analysis for formative indicators.
VariablesDiscomfortOptimismInnovativeness
Optimism0.31
Innovativeness0.460.42
Insecurity0.440.190.38
Table 4. Hypotheses testing.
Path Path CoefficientS.E.T-Value
H1: 0.290.074.35
H2: 0.160.068.25
H3:0.390.066.44
H4: 0.390.066.62
H5: 0.590.0512.17
H6: 0.300.055.71
H7: 0.220.063.72
H8: −0.090.051.92
H9: 0.670.0514.08
Table 5. f2 influence of exogenous variables on endogenous variables.
Pathf2Effect Size
H1:0.10low
H2:0.19medium
H3:0.07low
H4:0.15medium
H5:0.54high
H6:0.33medium
H7:0.02low
H8:0.18medium
H9:0.04low
Table 6. The analysis of mediating effect.
PathSobel Test z-Value
H10a: TRI → SAT → CI6.76
H10b: PU → SAT → CI8.86
H10c: PEOI → SAT → CI5.48
Table 7. Multi-group analysis for gender.
PathMaleFemaleDIFFt-ValueDFSIG.
Original SampleStandard ErrorOriginal SampleStandard Error
PEOU → CI0.0460.112−0.1540.0810.2001.2791470.203
PEOU → PU0.4760.1690.4350.0970.0410.2121470.832
PEOU → SAT0.3880.1670.2640.0800.1230.7291470.467
PU → CI0.2600.0950.2490.1210.0110.0491470.961
PU → SAT0.5300.1540.4750.0670.0540.327470.745
SAT → CI0.5990.1300.6690.087−0.0700.4151470.679
TRI → PEOU0.3760.2150.3090.1050.0680.3071470.760
TRI → PU0.2470.1820.1730.1160.0730.3221470.748
TRI → SAT−0.0490.1000.2010.108−0.2501.2501470.213
Note: TRI, technology readiness index; PEOU, perceived ease of use; PU, perceived usefulness; SAT, satisfaction; CI, continuance intention.
Disclaimer/Publisher’s Note: The statements, opinions and data contained in all publications are solely those of the individual author(s) and contributor(s) and not of MDPI and/or the editor(s). MDPI and/or the editor(s) disclaim responsibility for any injury to people or property resulting from any ideas, methods, instructions or products referred to in the content.

