Abstract
As a designated national low-carbon pilot city, Nanjing faces the challenge of reducing energy consumption and carbon emissions while experiencing rapid economic growth. This study developed a localized Long-range Energy Alternatives Planning System (LEAP) model specifically for Nanjing and constructed four different development scenarios. By utilizing the Log Mean Divisia Index (LMDI) decomposition, the Tapio decoupling elasticity coefficient, and comparing the emission reduction effects of individual measures and their cross-elasticity of carbon reduction, this study investigated the key factors and their carbon reduction path characteristics in Nanjing toward its carbon peak target by 2030. The results indicate that: (i) Nanjing could reach its peak carbon target of about 3.48 million tons by 2025 if carbon reduction measures are strengthened; (ii) The main elements influencing Nanjing’s carbon peak include controlling industrial energy consumption, restructuring the industry, promoting the construction of a new power system, and developing green transportation; (iii) Controlling industrial energy consumption and changing industrial structure have a greater impact on reducing carbon emissions than other measures, and both have a synergistic effect. Therefore, Nanjing should prioritize these two strategies as the most effective methods to reduce carbon emissions. Additionally, to slow down the growth of urban carbon emissions, policies aimed at reducing the energy intensity and carbon intensity of energy consumption should be formulated. For instance, the integration and innovation of green industries within the city region, such as new energy vehicles, new energy materials, and big data, should be accelerated, and the proportion of clean energy consumption in urban areas should be increased. The LEAP (Nanjing) model has successfully explored Nanjing’s low-carbon pathway and provided policy guidance for the optimal transformation of industrial cities and early carbon peaking.
1. Introduction
To achieve the “double carbon” target, China’s national “14th Five-Year Plan” proposes supporting qualified localities to take the lead in reaching peak carbon emissions and developing action plans to reach this goal by 2030. Cities are major contributors to greenhouse gas emissions and primary administrative units for developing a low-carbon economy and achieving green transformation [1]. In 2018, the total carbon emissions from 288 Chinese cities were 13.7 billion tons CO2 (Figure 1). Cities with high CO2 emissions are predominantly located in the north, northeast, and coastal areas of China. For instance, Beijing, Tianjin, Tangshan, Ordos, Shanghai, and Nanjing had emissions exceeding 150 million tons, making them crucial areas for carbon reduction efforts.
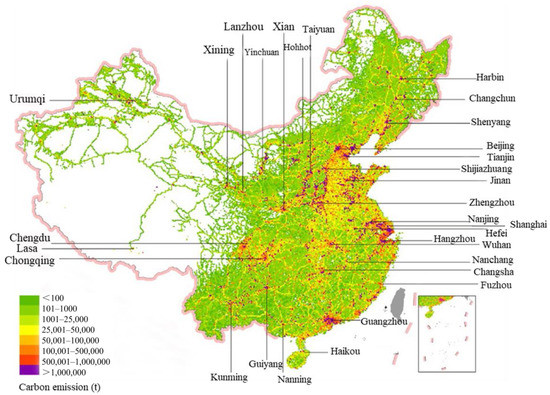
Figure 1.
Spatial map of total CO2 emissions in 288 cities in China.
Nanjing is the capital of Jiangsu Province, a vital economic center in East China, near Shanghai, with over eight million residents. The city has a heavy chemical industry with traditional energy consumption, resulting in rapid carbon emissions growth, leading it to be classified as a national low-carbon pilot city [2]. Despite promoting upgrading of the heavy chemical industry and innovation of production technology and processes in recent years, Nanjing is confronting constraints such as investment, cost, and market, and there is significant pressure on energy conservation and emission reduction in traditional industries. Specifically, the steel, petrochemical, and electric power industries have emerged as large comprehensive emitters. Additionally, many energy-consuming industries consume a considerable amount of energy with low energy consumption per unit of output. The six high energy-consuming industries, including the production of chemical raw materials and products, waste metal and mineral products, ferrous and nonferrous metal smelting and rolling, petroleum processing, smelting and nuclear fuel processing, and the production and supply of power and thermal energy, account for more than 90% of all energy consumption. Nanjing’s energy structure heavily relies on traditional energy and lacks appropriate diversification, with traditional energy dominated by raw coal and oil decreasing from 81.7% in 2000 to 72.6% in 2016 [2]; nonetheless, this level remains high. Therefore, as Nanjing experiences rapid economic growth, it faces the challenge of reducing its energy consumption and carbon emissions. Achieving its carbon peak target is crucial for driving the comprehensive green transformation of its economic and social development during the 14th Five-Year Plan period. The findings can serve as a reference for other cities with higher CO2 emissions or low-carbon pilot cities.
Following the introduction of China’s Nationally Determined Contributions (NDC) target, studies have designed scenarios for peak carbon emissions by 2030, exploring the timing of peaking, peak levels, and critical policy assessments [3]. Some studies supporting the “early peak” target have simulated peak times between 2020 and 2030 in various models [4]. Other studies have investigated peak pathways based on sectoral carbon emission characteristics [5] and regional carbon emission characteristics [3], which suggest that peak pathways depend on industry, energy, and environmental economics policy drivers. In addition, critical policy assessments have focused on the impact of energy and environmental fiscal policies such as renewable energy subsidies and carbon taxes [6,7], exploring the synergistic effects of early peaking policies and environmental governance policies [8]. These studies have utilized models and scenario analyses to provide a decomposition of peak carbon values and paths, compare the impacts of various policy instruments, and highlight the effects of policy synergies, benefits, and drawbacks [9]. To the best of our knowledge, few comprehensive studies have examined the drivers of carbon peaking, specific policy paths, and synergistic control of pollutants, regarding the goal of carbon peaking. In policy practice, there is a lack of attention at the city level, especially for pilot cities, which makes it challenging to highlight the demonstration significance of pilot cities and provide practical references.
The Long-range Energy Alternatives Planning System (LEAP) Model is a bottom-up energy–environment accounting tool developed jointly by Stockholm Environment Institute and Boston University based on scenario analysis. It predicts energy supply and demand under various driving factors and calculates the emissions of air pollutants and greenhouse gases during energy circulation and consumption. Currently, the model is widely used in studying energy and greenhouse gas emissions, but mostly focuses on one or several sectors, and is primarily based on a national scale. For instance, Wang et al. [10] conducted a LEAP model-based study on road traffic carbon emissions in Chengdu, Duan et al. [11] predicted peak carbon emissions and emission reduction paths during the construction operation period in Jilin Province using the LEAP model, and Nnaemeka et al. [12] applied scenario-based analysis to explore Nigeria’s future energy demand, supply, and associated GHG emissions from 2010 to 2040 using the LEAP model.
Accordingly, this study proposes constructing a LEAP model for Nanjing to explore key influencing factors and carbon emission reduction pathways under different economic development scenarios. The LMDI decomposition, Tapio elasticity coefficient, comparison of emission reduction effects of single measures, and cross-elasticity analysis of pollution reduction and carbon reduction will be used. The possible contributions of this study are three-fold. Firstly, current carbon reduction measures in Nanjing are unlikely to achieve the 2030 peak carbon emission target. However, strengthening certain measures such as controlling industrial energy consumption, promoting the construction of a new power system, and implementing waste classification management may enable Nanjing to achieve the decoupling of economic growth and carbon emissions and reach the carbon peak target by 2025. Secondly, the primary factors influencing the attainment of the carbon peak in Nanjing are controlling industrial energy consumption, restructuring the industry, and promoting the construction of a new power system. Among these factors, controlling industrial energy consumption and changing the industrial structure have a greater impact on reducing carbon emissions than other measures, and both have a synergistic impact. Thirdly, this study expects to provide a reference for preparing Nanjing’s peak carbon emission action plan by 2030. Carbon emission reduction policies in Nanjing should aim to reduce the energy and carbon intensity of energy consumption, as it can significantly slow the growth of carbon emissions in cities. Policies such as the integration and innovation of green industries, new energy vehicles and materials, and big data within the city region can accelerate the proportion of clean energy consumption in urban areas, achieve sustainable urban development, and encourage energy and industrial transformation at the local level, leading to smarter city growth.
The structure of this paper is as follows: the second part is the methodology and data; the third part is the results analysis and discussion; the fourth part is the conclusion and limitations.
2. Methodology and Data
2.1. LEAP Mode
The LEAP model simulated and forecasted energy demand and CO2 emissions in Nanjing from 2020 to 2035. The simulated test period was from 2020 to 2022, and the forecast period was from 2023 to 2035. The LEAP model is a widely used tool for analyzing energy demand, carbon emissions, and energy-saving and emission-reduction potential at the regional level due to its clear energy flow structure, transparent data processing, and robust scenario analysis. Many scholars have used the LEAP model for this purpose, including [13,14]. In this study, the LEAP (Nanjing) model is constructed based on four modules: resources, conversion, end-use demand, and drivers, as shown in Figure 2. The resource module reflects Nanjing’s energy resources, including primary energy (such as coal, natural gas, and wind energy) and secondary energy (such as electricity, diesel, and kerosene). The power conversion module simulates the city’s power production, including thermal power generation, hydroelectric power generation, and wind power generation, converting primary energy into secondary energy for end consumption. In Nanjing, 25.2% of electricity was transferred from external sources annually from 2015 to 2020 [15], and the rest was produced locally. The end demand module is divided into seven sectors based on energy use: residential life, agriculture, industry, construction, services, transportation, and others. The drivers of end-user demand are population, economic development, and urbanization. The LEAP model calculates total energy consumption and carbon emissions as the sum of the conversion and end-use demand components.
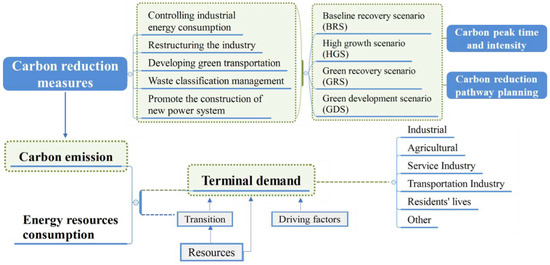
Figure 2.
The structure of the LEAP (Nanjing) model.
2.1.1. Calculation of Energy Demand
The LEAP (Nanjing) model divides terminal energy demand into six parts: industry, agriculture, service industry, transportation industry, residential life, and others. The energy demand of each industry is determined by the level of economic activity and the energy intensity of a unit of economic activity. Meanwhile, the energy demand of residents is determined by the size of the population and the per capita energy consumption. (Equations (1)–(3)).
where i represents industry, agriculture, service industry, transportation industry, residential life, and others; Ei refers to the energy demand of the industry; Vi is the added value of industry i; EIi is the energy demand of unit value added of the industry I; Ep is the energy demand generated by residents’ daily life; P is population size; EP is per capita energy demand; TE is the total energy consumption of Nanjing.
2.1.2. Calculation of Carbon Emissions
The carbon emissions in the LEAP (Nanjing) model consist of energy-related CO2 emissions, carbon emissions and carbon sinks from land use change and forestry, agricultural activities, and waste disposal. The calculation method and correlation coefficient used in this study refer to the “2006 IPCC Guide for National Greenhouse Gas Inventories” and the “Guide for Provincial Greenhouse Gas Inventory Preparation.” (Equations (4)–(6)) [13,14].
where j is raw coal, coke, oil, natural gas, and other energy sources other than electricity, and k is electricity; TCO2i represents CO2 emissions caused by industrial energy consumption; aij is the proportion of j energy in the energy consumed by the industry i; fj is the emission coefficient of the j energy; aik is the proportion of electricity in the energy consumed by industry i; e is the emission factor of power supply in Nanjing; TCO2p is CO2 emissions generated by residential energy consumption; apj is the proportion of j energy in the energy consumed by residents; apk is the proportion of electricity in the energy consumed by residents; TCO2 is the total greenhouse gas emission of the whole city; TCO2agr and TCO2dip represent greenhouse gas emissions from agricultural activities and waste disposal, respectively. TCO2sink represents land use change and forestry carbon sink, which is negative.
2.2. LMDI Decomposition
The factor decomposition method was utilized to identify the key factors that influence carbon peak in Nanjing from 2020 to 2035. This information will serve as a basis for planning the carbon reduction pathway in Nanjing. The LMDI decomposition method is widely used due to its ability to decompose multiple factors, handle zero values in the data, and produce zero residuals in the decomposition results [16]. In this study, the total carbon emissions of Nanjing from 2020 to 2035 were decomposed into three sectors, carbon emissions from residential consumption (CL), carbon emissions from industrial terminals (CI), and carbon emissions from conversion sectors (CT). This was performed based on the principle of kaya constant equation, as shown in Equations (8)–(10) [5]:
where CL, CL,j, EL,j, EL, P denote the total carbon emissions from residential life consumption, the total carbon emissions from residential life using j energy (j = 1, 2, 3, denoting coal, oil, natural gas), the total energy consumption using j energy, the total energy consumption of residential life, and the total population of residents, respectively, in residential life; ∆LU, ∆LC, ∆LA, ∆P denote the carbon emission coefficient effect, energy structure effect, per capita energy consumption effect, and population effect of residential life sector, respectively.
CI, Ci,j, Ei,j, Ei, Gi, G denote the total carbon emission, the total carbon emission of industry i using energy source j (i = 1, 2, 3, denotes primary, secondary, and tertiary industries; j = 1, 2, 3, denotes coal, oil, natural gas), the total energy consumption of industry i using energy source j, the total energy consumption of industry i, the value added of industry i, the total value added; ∆IU, ∆IC, ∆IE, ∆IS, ∆G denote, respectively, the carbon emission coefficient effect, the energy structure effect, the energy consumption intensity effect, the industrial structure effect, and the total economic effect of industrial end sectors.
In the conversion sector, CT, ET, QFT, and Q denote the total carbon emission, fossil energy consumption of thermal power generation, thermal power generation, and total power generation, respectively; ∆TU, ∆TS, ∆TC, and ∆Q denote the carbon emission factor effect, energy conversion efficiency effect, power production structure effect, and total power generation effect in the conversion sector, respectively (although external green power transfer is also an effective means to achieve energy cleanup, it mainly affects indirect CO2 emissions. Therefore, we mainly discuss Nanjing’s total power generation effect and its impact on carbon peaking).
Each effect is calculated in Equation (11) [8], where X is any of the 13 effects mentioned above. Generally, the default carbon emission factor of each energy source is constant, thus the carbon emission factor effect is zero (∆LU = ∆IU = ∆TU = 0)
2.3. Tapio Decoupling Elasticity Coefficient
Tapio decoupling elasticity coefficients are commonly used to analyze the correlation between economic growth and environmental pressure and to evaluate the relationship between economic growth and carbon emissions at national and provincial levels [17]. In this study, Tapio’s elasticity coefficients were applied to determine the decoupling between economic growth and total carbon emissions in Nanjing, under each scenario from 2020 to 2035. The decoupling elasticity coefficients were calculated using Equation (12) [18].
where e is the decoupling elasticity coefficient; ΔC and ΔGDP denote the changes in carbon emissions and GDP; Ct0 and GDPt0 denote the carbon emissions and GDP in the base period t0; Ct1 and GDPt1 denote the carbon emissions and GDP in the period t1. When e > 1, there is a negative decoupling when both carbon emissions and economic growth are positive, and the growth rate of carbon emissions is higher than economic growth.
2.4. Cross-Elasticity of Pollution Reduction and Carbon Reduction
CO2 and air pollutants are primarily generated through the combustion of fossil fuels. As a result, there is a homology between them, which suggests that carbon reduction measures may have a synergistic effect [19]. In other words, controlling greenhouse gas emissions can also reduce emissions of other local air pollutants (LAP). This study utilized the cross-elasticity of carbon reduction to analyze the synergistic effects of carbon reduction measures on both CO2 and LAP [20].
According to the relevant provisions of the “Environmental Protection Tax Law of the People’s Republic of China” [21], the LAP is accounted for by Equation (13). Where α, β, γ, δ, and ε are the equivalent value coefficients of SO2, NOx, TSP, CO, and CH4 converted to LAP, which are 1/0.95, 1/0.95, 1/2.18, 1/16.7, and 1/21, respectively.
The cross-elasticity analysis method is used to assess the degree of synergistic reduction in CO2 and other pollutants by emission reduction measures. Accordingly, the specific calculation of the cross-elasticity of pollution and carbon reduction shows in Equation (14) [22].
2.5. Datasets
The base year energy data (e.g., coal, oil, natural gas) for the LEAP model in 2020 were obtained from the “China Energy Statistical Yearbook” [23]. Pertinent data for Nanjing, such as GDP, output value of agriculture, industry and service industry, population, and other related data, were obtained from the “Nanjing Statistical Yearbook” [24]. Data on SO2, NOx, TSP, CO, CH4, and the parameters for the 2021–2035 scenarios were obtained from the “Nanjing ‘14th Five-Year’ Air Pollution Prevention and Control Plan” [25]. The “Nanjing New Electricity System Construction Master Plan (2021–2025)” [26] was used to obtain data on electricity generation. The resource utilization rate of urban household waste was obtained from the “Nanjing ‘14th Five-Year’ Open Economy Development Plan” [27]. Data related to green transportation development were obtained from the “Nanjing ‘14th Five-Year’ Major Infrastructure Construction Plan” [28] and “Nanjing ‘14th Five-Year’ Modern Service Industry Development Plan” [29]. The LMDI decomposition data, Tapio decoupling elasticity coefficients, and cross-elasticity data of pollution reduction and carbon reduction were obtained from the LEAP (Nanjing) model analysis results.
2.6. Scenario Setting
The LEAP (Nanjing) model utilizes 2020 as the base year and 2035 as the long-term target year. The driving factors for end-use demand are the economic growth rate, population growth, and urbanization rate. The “Notice of Nanjing Municipal People’s Government on the Issuance of Nanjing’s 13th Five-Year Plan for Controlling Greenhouse Gas Emissions” [30] and other documents propose several measures to reduce carbon emissions. These measures include controlling industrial energy consumption, promoting the construction of a new power system, implementing waste classification management, developing green transportation, and restructuring the industry.
This study utilizes the “Nanjing ‘14th Five-Year’ Air Pollution Prevention and Control Plan” [25], the “Nanjing New Electricity System Construction Master Plan (2021–2025)” [26], and other planning documents of Nanjing Municipality as the basis for setting model parameters (Table 1) during the simulated test interval from 2020 to 2022. Four differentiated development scenarios were established for the forecast period from 2023 to 2035.

Table 1.
The main carbon emission reduction measures and their specific targets in Nanjing.
The study sets four differentiated development scenarios for the forecast period from 2023 to 2035. These scenarios are as follows:
Baseline Recovery Scenario (BRS): Nanjing implements all carbon reduction measures at the same level as the “14th Five-Year Plan” without any additional measures. The economic development rate is set according to the requirements of Nanjing’s 2022 government work report.
High Growth Scenario (HGS): Nanjing implements carbon reduction measures with the same intensity as during the “14th Five-Year Plan” without any additional measures. The development approach relies mainly on high investment to drive high growth in economic output.
Green Development Scenario (GDS): Nanjing takes first-tier cities such as Beijing, Shanghai, Guangzhou, and Shenzhen as benchmarks and vigorously implements various carbon emission reduction measures. Economic development is driven by efficient investment to achieve a green economy with high efficiency and low pollution as the primary goal.
Green Recovery Scenario (GRS): Nanjing takes first-tier cities such as Beijing, Shanghai, Guangzhou, and Shenzhen as benchmarks and vigorously implements various carbon emission reduction measures with green and low-carbon as the primary goal. The economic development rate is set according to the requirements proposed in Nanjing’s 2021 government work report.
The main assumptions of the four scenarios are shown in Table 2.
Table 2.
Key parameter settings for each scenario of LEAP (Nanjing) model.
3. Analysis of Results and Discussion
3.1. Analysis of Total Energy Demand
Figure 3 illustrates the trends in energy demand under various scenarios from 2020 to 2035. The BRS shows a stable upward trend in total energy consumption in Nanjing, increasing from 63.24 million tce (tons of coal equivalent) in 2020 to 134.71 million tce in 2035, with an average annual growth rate of 4.76%. Under the HGS, Nanjing’s energy demand grows more significantly than the BRS, reaching 175.73 million tce by 2035, with an average annual growth rate of 7.49%, about 1.6 times that of the BRS. The GDS shows an upward trend in total energy demand from 2020 to 2023, reaching 92.21 million tce in 2023. The total energy demand from 2024 to 2035 is controlled at about 83.57–85.48 million tce, with an average growth rate of 0.09% from 2020 to 2035. The GRS peaks at 92.10 million tce in 2023 and then gradually decreases to 40.57 million tce in 2035, with an average annual growth rate of −0.56%. Therefore, the total energy demand in Nanjing under the GDS and GRS is significantly lower than the other two scenarios due to the focus on increasing energy efficiency and promoting the use of renewable energy sources. The total energy demand in Nanjing under the GDS shows a slight increase initially but remains stable at a lower level for the remainder of the period. In contrast, the total energy demand under the GRS peaks in 2023 and then decreases over time, indicating the success of efforts in transitioning towards a more sustainable energy system. Izabela et al. [31] studied the path of ecological transformation of energy structure in European countries and found that the most effective method in achieving environmental goals is the rapid and consistent abolition of coal, replacing it with renewable energy, nuclear energy, and hydropower.
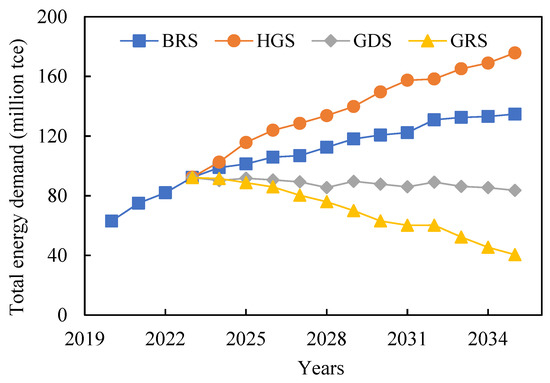
Figure 3.
Trends in energy demand under various scenarios from 2020 to 2035 (Baseline recovery scenario (BRS), High growth scenario (HGS), Green development scenario (GDS), Green recovery scenario (GRS)).
3.2. Analysis of Total Carbon Emissions
Figure 4 displays the trends in total carbon emissions under various scenarios from 2020 to 2035. Nanjing’s annual carbon emissions continue to rise under the BRS, increasing from 2.50 million tons in 2020 to 5.84 million tons in 2035. The rising carbon emissions trend in Nanjing is more evident under the HGS, growing to 9.42 million tons in 2035. The BRS and the HGS fail to achieve the carbon peak target by 2030. Carbon emissions in Nanjing under the GDS will keep rising from 2020 to 2025, with total carbon emissions of 3.48 million tons in 2025. In 2026–2030. The total carbon emissions fluctuate in the range of 2.95–3.41 million tons but do not exceed the carbon emissions peak in 2025. Carbon emissions are generally believed to plateau and fluctuate after reaching the peak [32]. Under the GRS, Nanjing’s carbon emissions increased from 2020 to 2022 and then steadily decreased after reaching a peak of 3.31 million tons in 2022, with a total of 1.34 million tons in 2035. The GDS and the GRS enable Nanjing to achieve the peaking carbon target by 2030. It should be noted that while Nanjing increases its carbon emission reduction efforts under the GRS, it maintains the expected economic development rate proposed in the Nanjing government’s work report. The expected target is generally the bottom line of the economic growth rate, and the actual growth rate is usually higher than the expected target. Especially under the incentive of “competition with the ruler”, it is common to exceed the economic growth target [33]. Therefore, Nanjing’s future development is likely to fall between the GDS and GRS, with peak carbon emissions expected to be between 2.78 and 2.95 million tons by 2025. Other prediction studies support this trend, such as Yang et al. [34], who predicted that Nanjing could achieve peak carbon emissions of about 200 million tons by 2025, and Yue et al. [35], who predicted that Nanjing could reach peak carbon emissions by 2030.
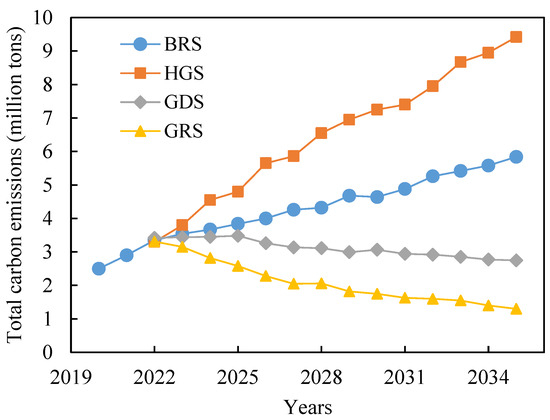
Figure 4.
Trends in total carbon emissions under various scenarios from 2020 to 2035 (Baseline recovery scenario (BRS), High growth scenario (HGS), Green development scenario (GDS), Green recovery scenario (GRS)).
3.3. Analysis of the Factors Influencing the Carbon Peak and the Characteristics of the Carbon Reduction Path
3.3.1. Analysis of the Factors Influencing Carbon Peaking
Figure 5 illustrates the factors influencing carbon peaking in Nanjing under four different scenarios. The economic aggregation effect, energy consumption intensity effect, and total power generation effect have stable emission-increase effects in all four scenarios, with the economic aggregation effect having a particularly significant increase effect. The cumulative emission increase in economic aggregates in the BRS, HGS, GDS, and GRS from 2020 to 2035 is 8295.53, 11922.14, 12652.38, and 7308.89 million tons, respectively, with emission-increase contribution rates of 59.43%, 63.97%, 55.78%, and 47.34%, respectively.
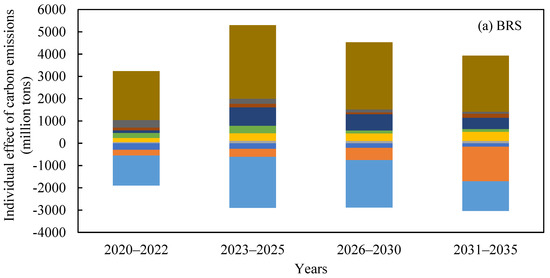
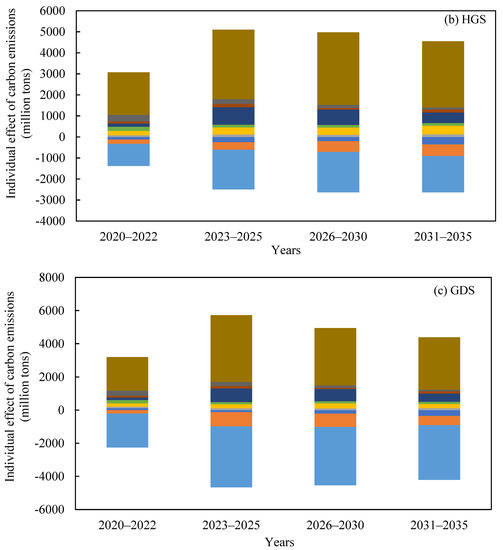
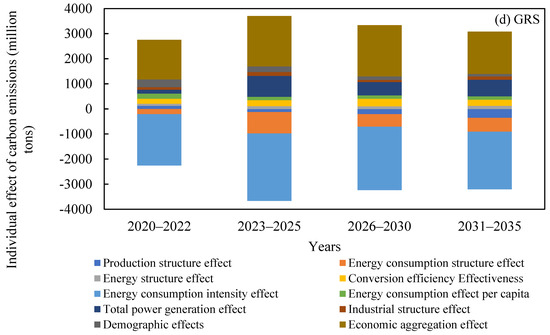
Figure 5.
Analysis of factors influencing carbon peaking in Nanjing under four different scenarios (Baseline recovery scenario (BRS), High growth scenario (HGS), Green development scenario (GDS), Green recovery scenario (GRS)).
The industrial energy consumption intensity effect, energy consumption structure effect, and electricity production structure effect have strong emission-reduction effects, especially in the GDS and GRS scenarios. From 2020 to 2035, the cumulative emission reduction in the industrial energy intensity effect in the four scenarios is 8557.62, 8204.55, 4538.79, and 3938.83 million tons, and the emission-reduction contribution rates are 38.68%, 33.45%, 44.92%, and 49.09%, respectively. The emission-reduction contribution of the energy consumption structure effect in the four scenarios is 6.38%, 8.67%, 13.32%, 16.62%, respectively. The emission-reduction contribution of the production structure effect of electricity in the four scenarios is 6.57%, 5.63%, 7.09%, and 9.40%, respectively.
Comparing the GDS and GRS, which can achieve the carbon peak, with the BRS and HGS, it is evident that reducing the industrial end-use energy intensity and improving the energy consumption structure, industrial structure, and electricity production structure can contribute significantly to achieving the carbon peak in Nanjing. The cumulative emission reduction contribution rates in the GDS and GRS from 2020 to 2035 are 69.09% and 74.97%, respectively. In particular, the industrial structure effect presents an emission increase in both the BRS and the HGS. However, it can play a positive emission-reduction role in the GDS and GRS, with cumulative emission reduction contribution rates of 3.09% and 4.42% from 2020 to 2035.
In general, the reduction in carbon emissions in Nanjing depends on various factors. The economic aggregation effect, energy consumption intensity effect, and total power generation effect are the primary drivers of carbon emissions. However, there is a strong potential for reducing carbon emissions through the industrial energy consumption intensity effect, energy consumption structure effect, and electricity production structure effect. To achieve a carbon peak in Nanjing, it is essential to reduce industrial end-use energy intensity and improve energy consumption and production structures. Xiao et al. [36] identified industrial structure, energy intensity, energy price, and level of openness as the main factors influencing regional carbon emission intensity. Therefore, according to the “14th Five-Year Plan” of Nanjing, reducing industrial end-use energy intensity and improving energy consumption and production structures might contribute significantly to the reduction in carbon emission intensity in the region.
3.3.2. Decoupling Analysis of Economic Development and Carbon Emissions
Table 3 presents the Tapio decoupling coefficients for each scenario during the period of 2022–2035. During the simulated test interval from 2020 to 2022, the Tapio decoupling coefficients of Nanjing for 2020 to 2021 and 2021 to 2022 were 0.28 and 0.57, respectively, indicating weak decoupling states. The decoupling coefficients of the BRS, HGS, GDS, and GRS were primarily negative. In the simulated forecast intervals from 2022 to 2035, the decoupling coefficients for each year under the BRS and the HGS were mostly between 0 and 1, indicating weak decoupling. The decoupling coefficients for each year were largely negative in the GDS and GRS, indicating strong decoupling of economic growth and carbon emissions. From 2022 to 2035, the decoupling coefficients for the BRS, HGS, GDS, and GRS were 0.38, 0.48, −0.11, and −0.06, respectively. This indicated that the decoupling coefficients of carbon emissions and economic growth in Nanjing under the BRS and HGS were weak. However, the GDS and GRS scenarios have the potential to achieve strong decoupling of economic growth and carbon emissions by 2035, leading to green and low-carbon economic development.
Table 3.
Tapio decoupling coefficients of each scenario during 2022–2035.
3.3.3. Analysis of Emission Reduction Effects of Key Carbon Reduction Measures
Based on the BRS and the HGS, individual measures to reduce carbon emissions were strengthened one by one according to the measures in the GDS and GRS to examine the variation in total carbon emissions in 2035, assuming that the strength of other measures remains unchanged. As shown in Figure 6, based on the BRS, the total carbon emissions in 2035 will be 1.36 million tons, resulting in a 43.27% reduction contribution rate after strengthening the control of industrial energy consumption alone (the energy consumption of industrial value-added will reach 1.6 tce per million yuan in 2035). Furthermore, restructuring the industry (the proportion of tertiary industry will reach 82.40% in 2035) will reduce carbon emissions by 1.19 million tons compared to the baseline scenario, with a reduction contribution rate of 20.27%. Additionally, promoting the construction of a new power system (the installed ratio of clean energy generation will be greater than 50% by 2035), developing green transportation (the green travel sharing rate in the central city will be greater than 75% by 2035), and implementing waste classification management (the resource utilization rate of urban household waste will be greater than 95% by 2035) also have good effects on reducing emissions, resulting in reductions of 0.18–0.76 million tons, with contribution rates of 12.78%, 10.59%, and 3.06%, respectively.
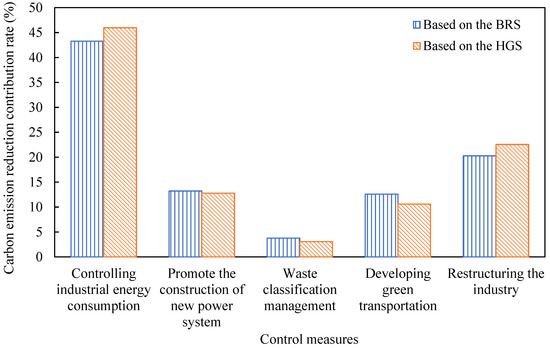
Figure 6.
Emission reduction effects of priority measures in 2035 based on the BRS and HGS (Baseline recovery scenario (BRS), High growth scenario (HGS)).
When comparing the emission reductions achieved by intensifying individual measures with the HGS as the baseline, controlling industrial energy consumption and restructuring the industry also have significant contributions to reducing carbon emissions. Compared to the BRS, the reductions in carbon emissions were 4.33 and 2.13 million tons in 2035, with reduction contribution rates of 45.97% and 22.56%, respectively. Based on the BRS and the HGS, the total reduction contribution of controlling industrial energy consumption and restructuring the industry exceeded 63.5%, which should be regarded as the priority measures in the path to reduce carbon emissions in Nanjing.
Therefore, to strengthen the path of planning for carbon emission reduction under Nanjing’s carbon peak target, it is necessary to prioritize controlling industrial energy consumption and adjusting the industrial structure [37]. First, it is necessary to phase out backward industrial production capacity with high energy consumption and encourage industrial enterprises to promote the cleanliness and efficiency of the production process through technological innovation to reduce industrial energy consumption and carbon emissions [38]. On the other hand, Nanjing needs to continue to increase its efforts to adjust the industrial structure and reduce carbon emissions from industry, transportation, and other high-emission sectors through the development of strategic new service industries [39]. By achieving a strong decoupling of economic growth and carbon emissions as early as possible, Nanjing can ensure the successful achievement of the carbon peak target and lay a solid foundation for the long-term goal of carbon neutrality.
3.3.4. Analysis of the Synergy Effect of Key Carbon Reduction Measures
Based on the BRS and the HGS, assuming that the other measures remain unchanged, the cross-elasticity of synergistic control was measured based on the strength of the measures in the GDS and GRS. The impact of carbon reduction in 2035, which is presented in Table 4, was used to compute the cross-elasticity of synergistic control for each measure. A value greater than 0 was obtained for each measure, indicating that all measures have synergistic effects on mitigating both CO2 and LAP emissions [15]. Four measures, namely, controlling industrial energy consumption, promoting the construction of new power systems, developing green transportation, and restructuring the industry, yielded a cross-elasticity of synergistic control between 0 and 1, indicating a more significant effect on CO2 emission reduction than LAP in achieving synergistic emission reduction. On the other hand, waste classification management had a cross-elasticity of synergistic control above one, indicating a greater effect on reducing LAP emissions. Thus, it is crucial to prioritize the implementation of these measures to effectively reduce both CO2 and LAP emissions. A combination of measures may be beneficial in achieving the desired level of emission reduction. Furthermore, it is essential to continue monitoring and evaluating the effectiveness of these measures to identify any potential improvements or adjustments that may be necessary.
Table 4.
Results of cross-elasticity analysis of carbon reduction under various emission reduction measures in 2035.
4. Conclusions and Limitations
Nanjing is currently facing challenges in achieving its peak carbon target by 2030 with its current carbon emission reduction measures. However, if some measures are strengthened, it is possible for Nanjing to decouple economic growth and carbon emissions, reaching its peak carbon target by 2025 with a peak of approximately 3.48 million tons. Factors such as controlling industrial energy consumption, restructuring the industry, promoting the construction of a new power system, developing green transportation, and waste classification management all play a role in Nanjing’s ability to achieve its carbon peaking target. In both the GDS and GRS from 2020 to 2035, these factors have a cumulative emission reduction contribution rate of 69.09% and 74.97%, respectively. Controlling industrial energy consumption and restructuring the industry have been identified as key measures for reducing carbon emissions in Nanjing, with total emission reduction contribution rates exceeding 63.5% in the baseline recovery scenario and the high growth scenario. These measures can not only help reduce carbon emissions but also have the added benefit of controlling local pollutant emissions, leading to a synergistic effect of reducing pollution and carbon.
Based on the research and the distinct urban features and developmental prospects of Nanjing, it is noteworthy that a crucial measure towards realizing peak carbon in the region involves the reduction in both energy intensity and carbon intensity of energy consumption. This can be achieved through a combination of measures, such as promoting energy-efficient buildings, encouraging the use of renewable energy sources, and implementing energy-saving technologies in industries. In addition, the integration and innovation of green industries within the city region can play a significant role in reducing carbon emissions. For example, the development of new energy vehicles and materials can help reduce the carbon footprint of transportation, while the use of big data can help optimize energy consumption and reduce waste. Increasing the proportion of clean energy consumption in urban areas is also essential for achieving peak carbon in Nanjing. This can be achieved through the promotion of renewable energy sources, such as solar and wind power, and the implementation of energy-efficient technologies in buildings and industries. Finally, achieving sustainable urban development is a key goal of these policies. This can be achieved by encouraging energy and industrial transformation at the local level, promoting the use of sustainable materials and technologies, and supporting the development of green infrastructure, such as public transportation and bike-sharing programs. Overall, these low carbon recommendations provide a roadmap for Nanjing to achieve its peak carbon target by 2025. By implementing these policies, Nanjing can not only reduce its carbon emissions but also promote sustainable urban development and economic growth.
This paper has certain limitations that need to be further explored to improve it. The study’s findings are based on a specific set of assumptions and scenarios. For example, the study assumes that Nanjing will implement certain low carbon recommendations and that these policies will be effective in reducing carbon emissions. However, the actual implementation and effectiveness of these policies may vary depending on a range of factors, such as political will, funding availability, and stakeholder engagement. Additionally, while the study provides valuable insights into the factors contributing to carbon emissions in Nanjing, it is important to note that the findings may not be generalizable to other regions or contexts. Regional variations in economic structure, energy consumption patterns, and policy frameworks can significantly impact the effectiveness of low carbon recommendations and the feasibility of achieving peak carbon targets. Furthermore, the study’s focus on relative changes across sectors rather than absolute numbers may limit its usefulness for policymakers and stakeholders who require more precise and accurate data to inform decision-making.
Future research directions may include exploring alternative methodologies for measuring carbon emissions, such as life cycle assessment or input-output analysis, to gain a more comprehensive understanding of the carbon footprint of different activities and processes. These methodologies can provide more precise and accurate data to inform decision-making and policy development. Additionally, future research may benefit from exploring the effectiveness of different low carbon recommendations in different regions and contexts. This can help identify the most effective policies and strategies for reducing carbon emissions and achieving peak carbon targets in different settings. Furthermore, future research may benefit from exploring the social and economic impacts of low carbon policies and strategies. This can help identify potential trade-offs and unintended consequences of different policies and strategies and inform the development of more equitable and sustainable low carbon solutions. Finally, future research may benefit from exploring the role of technology and innovation in reducing carbon emissions and achieving peak carbon targets. This can include exploring the potential of emerging technologies, such as carbon capture and storage, renewable energy storage, and smart grid systems, to reduce carbon emissions and promote sustainable urban development.
Author Contributions
C.C. contributed to writing review and editing and supervision; M.C. was involved in formal analysis and investigation and writing—original draft preparation; C.Z., J.L. and W.C. performed writing—reviewing and editing. All authors have read and agreed to the published version of the manuscript.
Funding
The National Social Science Foundation of China (No. 20AGL020). The 2021 Philosophy and Social Science Research Project of Universities in Jiangsu Province (2021SJA0785). National Natural Science Foundation youth Project (71802069).
Institutional Review Board Statement
Not applicable.
Informed Consent Statement
Not applicable.
Data Availability Statement
The data that support the findings of this study are available in (https://www.hbzhan.com/news/detail/153021.html) (accessed on 6 September 2022), (https://kjc.jit.edu.cn/info/1017/4883.htm) (accessed on 14 August 2017), (http://www.js.sgcc.com.cn/nj/) (accessed on 5 May 2021), and (https://www.nanjing.gov.cn) (accessed on 8 September 2020), Nanjing Statistical Yearbook.
Conflicts of Interest
The authors declare no conflict of interest.
References
- Wei, C. Historical trend and drivers of China’s CO2 emissions from 2000 to 2020. Environ. Dev. Sustain. 2022, 75, 1–20. [Google Scholar] [CrossRef] [PubMed]
- Wang, Y.; Yang, H.; Sun, R. Effectiveness of China’s provincial industrial carbon emission reduction and optimization of carbon emission reduction paths in “lagging regions”: Efficiency-cost analysis. J. Environ. Manag. 2020, 275, 111221. [Google Scholar] [CrossRef] [PubMed]
- Cheng, Y.; Gu, B.; Tan, X.; Yan, H.; Sheng, Y. Allocation of provincial carbon emission allowances under China’s 2030 carbon peak target: A dynamic multi-criteria decision analysis method. Sci. Total Environ. 2022, 837, 155798. [Google Scholar] [CrossRef]
- Wu, X.; Xu, C.; Ma, T.; Xu, J.; Zhang, C. Carbon emission of China’s power industry: Driving factors and emission reduction path. Environ. Sci. Pollut. Res. 2022, 29, 78345–78360. [Google Scholar] [CrossRef]
- Xu, T.; Kang, C.; Zhang, H. China’s efforts towards carbon neutrality: Does energy-saving and emission-reduction policy mitigate carbon emissions? J. Environ. Manag. 2022, 316, 115286. [Google Scholar] [CrossRef]
- Chang, W.Y.; Wang, S.; Song, X.; Zhong, F. Economic effects of command-and-control abatement policies under China’s 2030 carbon emission goal. J. Environ. Manag. 2022, 312, 114925. [Google Scholar] [CrossRef]
- Liu, J.; Duan, Y.; Zhong, S. Does green innovation suppress carbon emission intensity? New evidence from China. Environ. Sci. Pollut. Res. 2022, 29, 86722–86743. [Google Scholar] [CrossRef]
- Liu, J.; Bai, J.; Deng, Y.; Chen, X.; Liu, X. Impact of energy structure on carbon emission and economy of China in the scenario of carbon taxation. Sci. Total Environ. 2021, 762, 143093. [Google Scholar] [CrossRef] [PubMed]
- Tang, D.; Zhang, Y.; Bethel, B.J. A comprehensive evaluation of carbon emission reduction capability in the Yangtze River economic belt. Int. J. Environ. Res. Public Health 2020, 17, 545–550. [Google Scholar] [CrossRef]
- Wang, J.J.; Li, Y.; Zhang, Y. Research on carbon emissions of road traffic in Chengdu city based on a LEAP model. Sustainability 2022, 14, 5625–5642. [Google Scholar] [CrossRef]
- Duan, H.Y.; Zhang, S.P.; Duan, S.Y. Carbon emissions peak prediction and the reduction pathway in buildings during operation in Jilin province based on LEAP. Sustainability 2019, 11, 4540–4562. [Google Scholar] [CrossRef]
- Nnaemeka, V.E.; Chinenye, C.E.; Girish, P.M. Energy policy for low carbon development in Nigeria: A LEAP model application. Renew. Sustain. Energy Rev. 2017, 68, 247–261. [Google Scholar] [CrossRef]
- Qu, S.; Yang, H.; Ji, Y. Low-carbon supply chain optimization considering warranty period and carbon emission reduction level under cap-and-trade regulation. Environ. Dev. Sustain. 2021, 23, 18040–18067. [Google Scholar] [CrossRef]
- An, Y.; Zhou, D.; Yu, J.; Shi, X. Carbon emission reduction characteristics for China’s manufacturing firms: Implications for formulating carbon policies. J. Environ. Manag. 2021, 284, 112055. [Google Scholar] [CrossRef] [PubMed]
- Gallaher, M.; Delhotal, K.C. Modeling the impact of technical change on emissions abatement investments in developing countries. J. Technol. Transf. 2004, 30, 211–225. [Google Scholar] [CrossRef]
- Lin, X.; Zhang, Y.; Zou, C.; Peng, L. CO2 emission characteristics and reduction responsibility of industrial subsectors in China. Sci. Total Environ. 2020, 699, 134386. [Google Scholar] [CrossRef]
- Dong, F.; Qin, C.; Zhang, X.; Zhao, X.; Pan, Y. Towards carbon neutrality: The impact of renewable energy development on carbon emission efficiency. Int. J. Environ. Res. 2021, 18, 167–179. [Google Scholar] [CrossRef]
- Li, L.; Ye, F.; Li, Y.; Chang, C.T. How will the Chinese certified emission reduction scheme save cost for the national carbon trading system? J. Environ. Manag. 2019, 244, 99–109. [Google Scholar] [CrossRef]
- Singer, C.E.; Rethinaraj, T.S.G.; Addy, S.; Durham, D. Probability distributions for carbon emissions and atmospheric response. Clim. Chang. 2008, 88, 309–342. [Google Scholar] [CrossRef]
- Jiang, K.; Masui, T.; Morita, T.; Matsuoka, Y. Long-term emission scenarios for China. Environ. Econ. Policy Stud. 1999, 2, 267–287. [Google Scholar] [CrossRef]
- Song, X.; Geng, Y.; Li, K.; Zhang, X.; Wu, F. Does environmental infrastructure investment contribute to emissions reduction? A case of China. Front. Energy 2020, 14, 57–70. [Google Scholar] [CrossRef]
- Liu, Z.; Li, L.; Zhang, Y. Investigating the CO2 emission differences among China’s transport sectors and their influencing factors. Nat. Hazards 2015, 77, 1323–1343. [Google Scholar] [CrossRef]
- National Bureau of Statistics of China. China Energy Statistical Yearbook; China Statistics Press: Beijing, China, 2020; (In Chinese). Available online: https://data.cnki.net/v3/trade/Yearbook/Single/N2022060061?zcode=Z025 (accessed on 3 March 2021).
- Bureau of Statistics of Nanjing. Nanjing Statistical Yearbook, 2020; Nanjing Statistics Press: Nanjing, China, 2020; (In Chinese). Available online: https://www.yearbookchina.com/navibooklist-n3020013098-1.html (accessed on 5 March 2021).
- Bureau of Ecological Environment of Nanjing. Nanjing ‘14th Five-Year’ Air Pollution Prevention and Control Plan; Bureau of Ecological Environment of Nanjing Press: Nanjing, China, 2022; (In Chinese). Available online: https://www.hbzhan.com/news/detail/153021.html (accessed on 6 September 2022).
- State Grid Nanjing Power Supply Company. Nanjing New Electricity System Construction Master Plan (2021–2025); State Grid Nanjing Power Supply Company Press: Nanjing, China, 2022; (In Chinese). Available online: https://wap.yzwb.net/wap/news/1985192.html (accessed on 26 February 2022).
- Nanjing Municipal People’s Government. Nanjing ‘14th Five-Year’ Modern Service Industry Development Plan; Nanjing Municipal People’s Government Press: Nanjing, China, 2021; (In Chinese). Available online: https://www.nanjing.gov.cn/zdgk/202110/t20211018_3160918.html (accessed on 26 September 2021).
- Nanjing Municipal People’s Government. Nanjing ‘14th Five-Year’ Major Infrastructure Construction Plan; Nanjing Municipal People’s Government Press: Nanjing, China, 2021; (In Chinese). Available online: http://www.nanjing.gov.cn/zdgk/202111/t20211118_3199930.html (accessed on 22 September 2021).
- Nanjing Municipal People’s Government. Nanjing ‘14th Five-Year’ Open Economy Development Plan; Nanjing Municipal People’s Government Press: Nanjing, China, 2021; (In Chinese). Available online: http://www.nanjing.gov.cn/zdgk/202203/t20220314_3317374.html (accessed on 17 November 2021).
- Nanjing Municipal People’s Government. Notice of Nanjing Municipal People’s Government on the Issuance of Nanjing’s 13th Five-Year Plan for Controlling Greenhouse Gas Emissions; Nanjing Municipal People’s Government Press: Nanjing, China, 2017; (In Chinese). Available online: https://kjc.jit.edu.cn/info/1017/4883.htm) (accessed on 14 August 2017).
- Izabela, J.K. Towards the reduction of CO2 emissions. Paths of pro-ecological transformation of energy mixes in European countries with an above-average share of coal in energy consumption. Resour. Policy 2022, 77, 102701. [Google Scholar] [CrossRef]
- Wang, F.; Ge, X. Inter-provincial responsibility allocation of carbon emission in China to coordinate regional development. Environ. Sci. Pollut. Res. 2022, 29, 7025–7041. [Google Scholar] [CrossRef] [PubMed]
- Dong, F.; Zhu, J.; Li, Y.; Chen, Y.; Gao, Y. How green technology innovation affects carbon emission efficiency: Evidence from developed countries proposing carbon neutrality targets. Environ. Sci. Pollut. Res. 2022, 29, 35780–35799. [Google Scholar] [CrossRef] [PubMed]
- Yang, Y.; Dong, S.; Li, F. An analysis on the adoption of an interregional carbon emission reduction allocation approach in the context of China’s interprovincial carbon emission transfer. Environ. Dev. Sustain. 2021, 23, 4385–4411. [Google Scholar] [CrossRef]
- Yue, D.; Sarkar, A.; Cui, Y. Ecological compensation of grain trade within urban, rural areas and provinces in China: A prospect of a carbon transfer mechanism. Environ. Dev. Sustain. 2021, 23, 16688–16712. [Google Scholar] [CrossRef]
- Xiao, H.W.; Ma, Z.Y.; Zhang, P.; Liu, M. Study of the impact of energy consumption structure on carbon emission intensity in China from the perspective of spatial effects. Nat. Hazards 2018, 99, 1365–1380. [Google Scholar] [CrossRef]
- Tang, K.; Liu, Y.; Zhou, D.; Qiu, Y. Urban carbon emission intensity under emission trading system in a developing economy: Evidence from 273 Chinese cities. Environ. Sci. Pollut. Res. 2021, 28, 5168–5179. [Google Scholar] [CrossRef]
- Liu, M.L.; Li, Z.H.; Anwar, S.; Zhang, Y. Supply Chain carbon emission reductions and coordination when consumers have a strong preference for low-carbon products. Environ. Sci. Pollut. Res. 2021, 28, 19969–19983. [Google Scholar] [CrossRef]
- Dong, Z.; Chen, W.; Wang, S. Emission reduction target, complexity and industrial performance. J. Environ. Manag. 2020, 260, 110–118. [Google Scholar] [CrossRef] [PubMed]
Disclaimer/Publisher’s Note: The statements, opinions and data contained in all publications are solely those of the individual author(s) and contributor(s) and not of MDPI and/or the editor(s). MDPI and/or the editor(s) disclaim responsibility for any injury to people or property resulting from any ideas, methods, instructions or products referred to in the content. |
© 2023 by the authors. Licensee MDPI, Basel, Switzerland. This article is an open access article distributed under the terms and conditions of the Creative Commons Attribution (CC BY) license (https://creativecommons.org/licenses/by/4.0/).