Article

Evolutionary Game Analysis of Abandoned-Bike-Sharing Recycling: Impact of Recycling Subsidy Policy

1
School of Advanced Interdisciplinary Studies, Hunan University of Technology and Business, Changsha 410205, China
2
Xiangjiang Laboratory, Changsha 410205, China
3
School of Resources and Environment, Hunan University of Technology and Industry, Changsha 410205, China
*
Author to whom correspondence should be addressed.
Sustainability 2023, 15(11), 8834; https://doi.org/10.3390/su15118834
Submission received: 13 November 2022 / Revised: 9 April 2023 / Accepted: 16 April 2023 / Published: 30 May 2023

Abstract

:
The launch of large-scale bike sharing in China has effectively met the demand for low-carbon short-distance travel, but it has also led to the emergence of a large number of abandoned bikes, which is called the “bike-sharing siege”. In order to achieve the sustainable development of the bike-sharing industry, this paper discusses how to encourage bike-sharing companies to recycle and reuse abandoned bikes and improve the efficiency of local government financial resources based on the promotion of the EPR system. We apply the evolutionary game to investigate the interaction mechanism of complex behaviors between local governments and bike-sharing companies under two subsidy policies: a fixed recycling subsidy and regressive recycling subsidy. The results show that both recycling subsidy policies have diminishing marginal effects. In addition to incentives, local governments need to unify bike-sharing parking, establish bike-sharing monitoring platforms, and reasonably allocate bike parking spaces to ensure the quality of the urban environment. Under effective regulation, by implementing a regressive recycling subsidy policy and setting a rational amount for the recycling subsidy, local governments can effectively promote the EPR system, strengthen the environmental responsibility of companies, and avoid the “free-rider phenomenon”. Based on the current situation in China, this research provides references for each local government to formulate management policies from the perspective of subsidy policy.

1. Introduction

1.1. Background

The rapid development of bike sharing in China has effectively met the “last mile” travel needs of local residents, not only bringing economic benefits to individuals and collectives [1], but also playing an important role in net zero [2]. However, in the process of the development of the bike-sharing industry, there are also problems that need to be regulated (commonly known as the “bike-sharing siege”), such as abandoned bikes being discarded at will, bikes being parked indiscriminately, operation and maintenance not being in place, disorderly competition among companies, and the main responsibility of companies not being implemented. As solid waste, abandoned bikes not only crowd public roads, but they also produce large amounts of harmful gases (CO2, SO2, NOX, etc.) [2] and heavy metals [3]. Abandoned bikes are difficult to dismantle, difficult to repair, have a low recycling price, are widespread, and produce heavy pollution, which bring new challenges to urban environmental management. Currently, it is mainly the local governments in China, as enablers, that are attempting to solve the problem of the “bike-sharing siege” by limiting bike placement and implementing mandatory cleaning or recycling [4,5].
China urgently needs a scientific, green, and efficient approach to manage the bike-sharing industry in order to balance, as much as possible, the reduction in the financial pressure on local governments and the sustainable development of the bike-sharing industry, and to contribute to the goal of carbon neutrality [6]. Therefore, the General Office of the State Council of China issued a program for the promotion of the extended producer responsibility (EPR) system, which is a necessary system option for developing a circular economy [7]. This program aims to encourage producers to undertake their resource and environmental responsibilities, thereby boosting the overall competitiveness of their products and improving resource and environmental benefits [8,9]. In the traditional management approach, producers shift the responsibility for green development to the government through the payment of environmental taxes, and they rely on the government to deal with the pollution issues generated during the product life cycle in a uniform manner. In contrast to the traditional management approach in which environmental tax (ET) is the main measure, EPR emphasizes the sharing of responsibilities among different actors in the product life cycle, such as producers, consumers, recyclers, and government. EPR also implements the incentives and penalties in the system in the form of local government penalties, subsidies, and recycling conversion benefits. The development of EPR has led to the involvement of stakeholders in environmental protection actions and has achieved remarkable results worldwide. For example, Spain and Portugal have achieved a significant increase in the recycling rate of waste plastics through the EPR system [10]. EPR is an effective tool for the development of a circular economy, and the promotion of the EPR system will effectively improve resource utilization, reduce waste emissions, and protect the environment [11].
This study attempts to construct an evolutionary game model that involves two parties: local governments and bike-sharing companies. The study takes a systemic perspective and considers the satisfaction of residents under two policies: ET and EPR. In this paper, local governments and bike-sharing companies are considered as two large groups participating in the game, rather than the single-individual competition [12,13,14] or few individuals in the traditional game [15,16,17,18,19,20,21]. In contrast to traditional game theory, which is modified instantly based on the optimal response function [17,18,19,20,21], evolutionary game theory offers a more comprehensive and precise approach to studying problems. This is because evolutionary game theory not only accounts for the players’ rationality, but also considers their decision reaction time. In addition, it allows for a smooth presentation of the evolution of the players’ strategies. Therefore, evolutionary game theory is a feasible and effective tool for analyzing and solving group decision problems [22,23,24,25,26,27]. Because local governments will periodically adjust their recycling subsidies, this paper investigates the impact of the regressive recycling subsidy policy (i.e., adopting a regressive subsidy policy in which the subsidy amount is negatively correlated with the promotion rate) on the behavioral decisions of bike-sharing companies and local governments, based on the consideration of the fixed recycling subsidy policy. In addition, this paper investigates the impact of the recycling subsidy amount on EPR promotion. The work mentioned above will provide a visionary reference for each local government to develop subsidy policies when promoting the EPR system.
This paper answers the following key questions:
(1)
How do the recycling subsidy amount and resident satisfaction affect stakeholder decisions?
(2)
In order to implement the EPR system nationwide, what subsidy policy should local governments adopt: the fixed-amount recycling subsidy policy or regressive recycling subsidy policy?
(3)
Under the policy of regressive recycling subsidies, how can local governments influence stakeholders’ decisions to promote the EPR system?

1.2. Related Literature

At present, bike-sharing-related research focuses on five aspects: economic value analysis [1], environmental benefit analysis [28,29], industry impact factor analysis [30,31,32,33,34,35], market mechanism analysis [12,36,37,38,39], and industry management [13,14,15,16,17,18,19,20,21,22,23,24,25,26,40], which provide a theoretical basis for further research on the bike-sharing industry from multiple levels, but still lack a systematic and dynamic research approach.
As mentioned above, the existing studies only consider single-individual competition [13,14] or competition with a few individuals [15,16,17,18,19,20,21] in the bike-sharing industry and cannot provide effective guidance on the promotion of the EPR system (i.e., they cannot predict the trajectory of the strategy evolution between local governments and bike-sharing companies in the game process). Behavioral psychology shows that decision makers have short-sighted behavior, for which individuals are heterogeneous and parties tend to have limited rationality [25]. Therefore, the implementation of an EPR system in China’s bike-sharing industry needs to be based on a systemic approach [41], which considers the complex interests of local governments, bike-sharing companies, residents, and recycling suppliers [37] (see Figure 1), and pays attention to the self-organizing role of the system (natural selection, survival of the fittest) and the imperfectly rational behavior of individuals. In the dynamic interaction between the two groups of local governments and bike-sharing companies, the market size owned by bike-sharing companies in different scenarios changes continuously, and both parties repeatedly adjust their strategies in the process of environmental changes, each choosing and replicating advantageous strategies [42,43,44,45].
Indeed, the impact of the policy environment and service quality on the market size (e.g., consumer preferences) owned by bike-sharing companies should also be considered [46]. Most polluting companies tend to avoid the NIMBY (Not In My Back Yard) campaign caused by pollution [47], while local governments need to fulfill their commitments and gain the advocacy of residents [48]. Meanwhile, the competition for market share among bike-sharing companies with the same price but different service qualities is also a non-negligible influencing factor, which is a hot research topic in the sharing economy [36,37,38,39]. The reason is that during the seven years of development of China’s bike-sharing industry, its market model has gradually evolved from one that follows Anglo-Saxon capitalism to one that follows Rhineland capitalism. Competition for market share among bike-sharing companies has shifted from competition to maximize production and lower prices through brutal launches [49,50] to competition for service quality with converging rental prices [51,52]. Hence, we also need to consider the impact of resident satisfaction on the behavioral decisions of companies and governments [30,31,32,33,34,35,53]. Different from the two-stage game model constructed in the literature [38], we analyze the behavioral strategies of local governments and bike-sharing companies by introducing resident satisfaction for evolutionary game modeling, taking into account the differentiated competition of products. It is worth mentioning that, as local governments manage on a small scale to avoid unnecessary management costs, it is common for local governments to use a single policy, or to overwhelmingly apply the same policy, to protect the interests of the vast majority of residents, rather than a combination of policies [54]. Thus, this paper only examines the proportion of individuals in the local government group who implement a particular strategy to the total group, without considering whether a particular individual has a combined strategy.

1.3. Paper Organization

The rest of the paper is summarized as follows: Section 2 constructs the model framework of the two-group evolutionary game based on the assumptions and provides the payoff matrix. Section 3 obtains the replicated dynamic equations for both players and analyzes the two-group evolutionary game. Section 4 analyzes and proves the evolutionary stability strategy based on two subsidy policies and two case combinations. Section 5 uses the available data to analyze the sensitivity of the recycling subsidy amount and resident satisfaction under two recycling subsidy policies in the evolutionary process. Section 6 summarizes the conclusions and limitations of the study, revealing the impacts of the different recycling subsidy policies and resident satisfaction on the promotion of the EPR system.

2. Evolutionary Game Modeling between Local Governments and Bike-Sharing Companies

The Chinese government acts as an invisible hand in the market, playing the role of a supervisor. In the bike-sharing industry, local governments act as enablers of the EPR system in order to achieve green, sustainable, and high-quality development. Local governments not only need to take on the cost of regulation (CG), but they also need to consider the amount of the recycling subsidies needed to promote the EPR system. In addition, the results of government efforts need to be considered in order to gain the support of local residents (T). The residents’ support (T) is based on the residents’ satisfaction (CP), (i.e., T = δCP (δ > 0, CP∈R)). Meanwhile, we use ηδCP to denote the rewarding and punishing behaviors of local governments towards the operation of bike-sharing companies, where η(η > 0) is the rewarding and punishing coefficient. Strategies for local governments include continuing to adopt the ET policy or implementing the EPR system. At the same time, bike-sharing companies not only need to provide transportation services to residents and accept policy guidance from local governments, but also consider the recycling of abandoned bikes. Against the above background, bike-sharing companies need to operate in a way that takes into account their revenues and the potential risk of fines. The companies should also find an efficient way to recover abandoned bikes from the streets, disassemble them, and reuse their parts. Bike-sharing companies have two alternative recycling strategies: first-party reverse logistics (bike-sharing companies carry out the recycling) or third-party reverse logistics (also known as contract logistics, in which a third-party recycling provider is entrusted to carry out the recycling). We assume in this paper that the production costs and rental charges of bike sharing are uniform across the country (as China is currently dominated by two companies that produce bike sharing), and let the production costs be CE0 and the rental revenues be RE. Acronyms and parameters are summarized in Table 1.
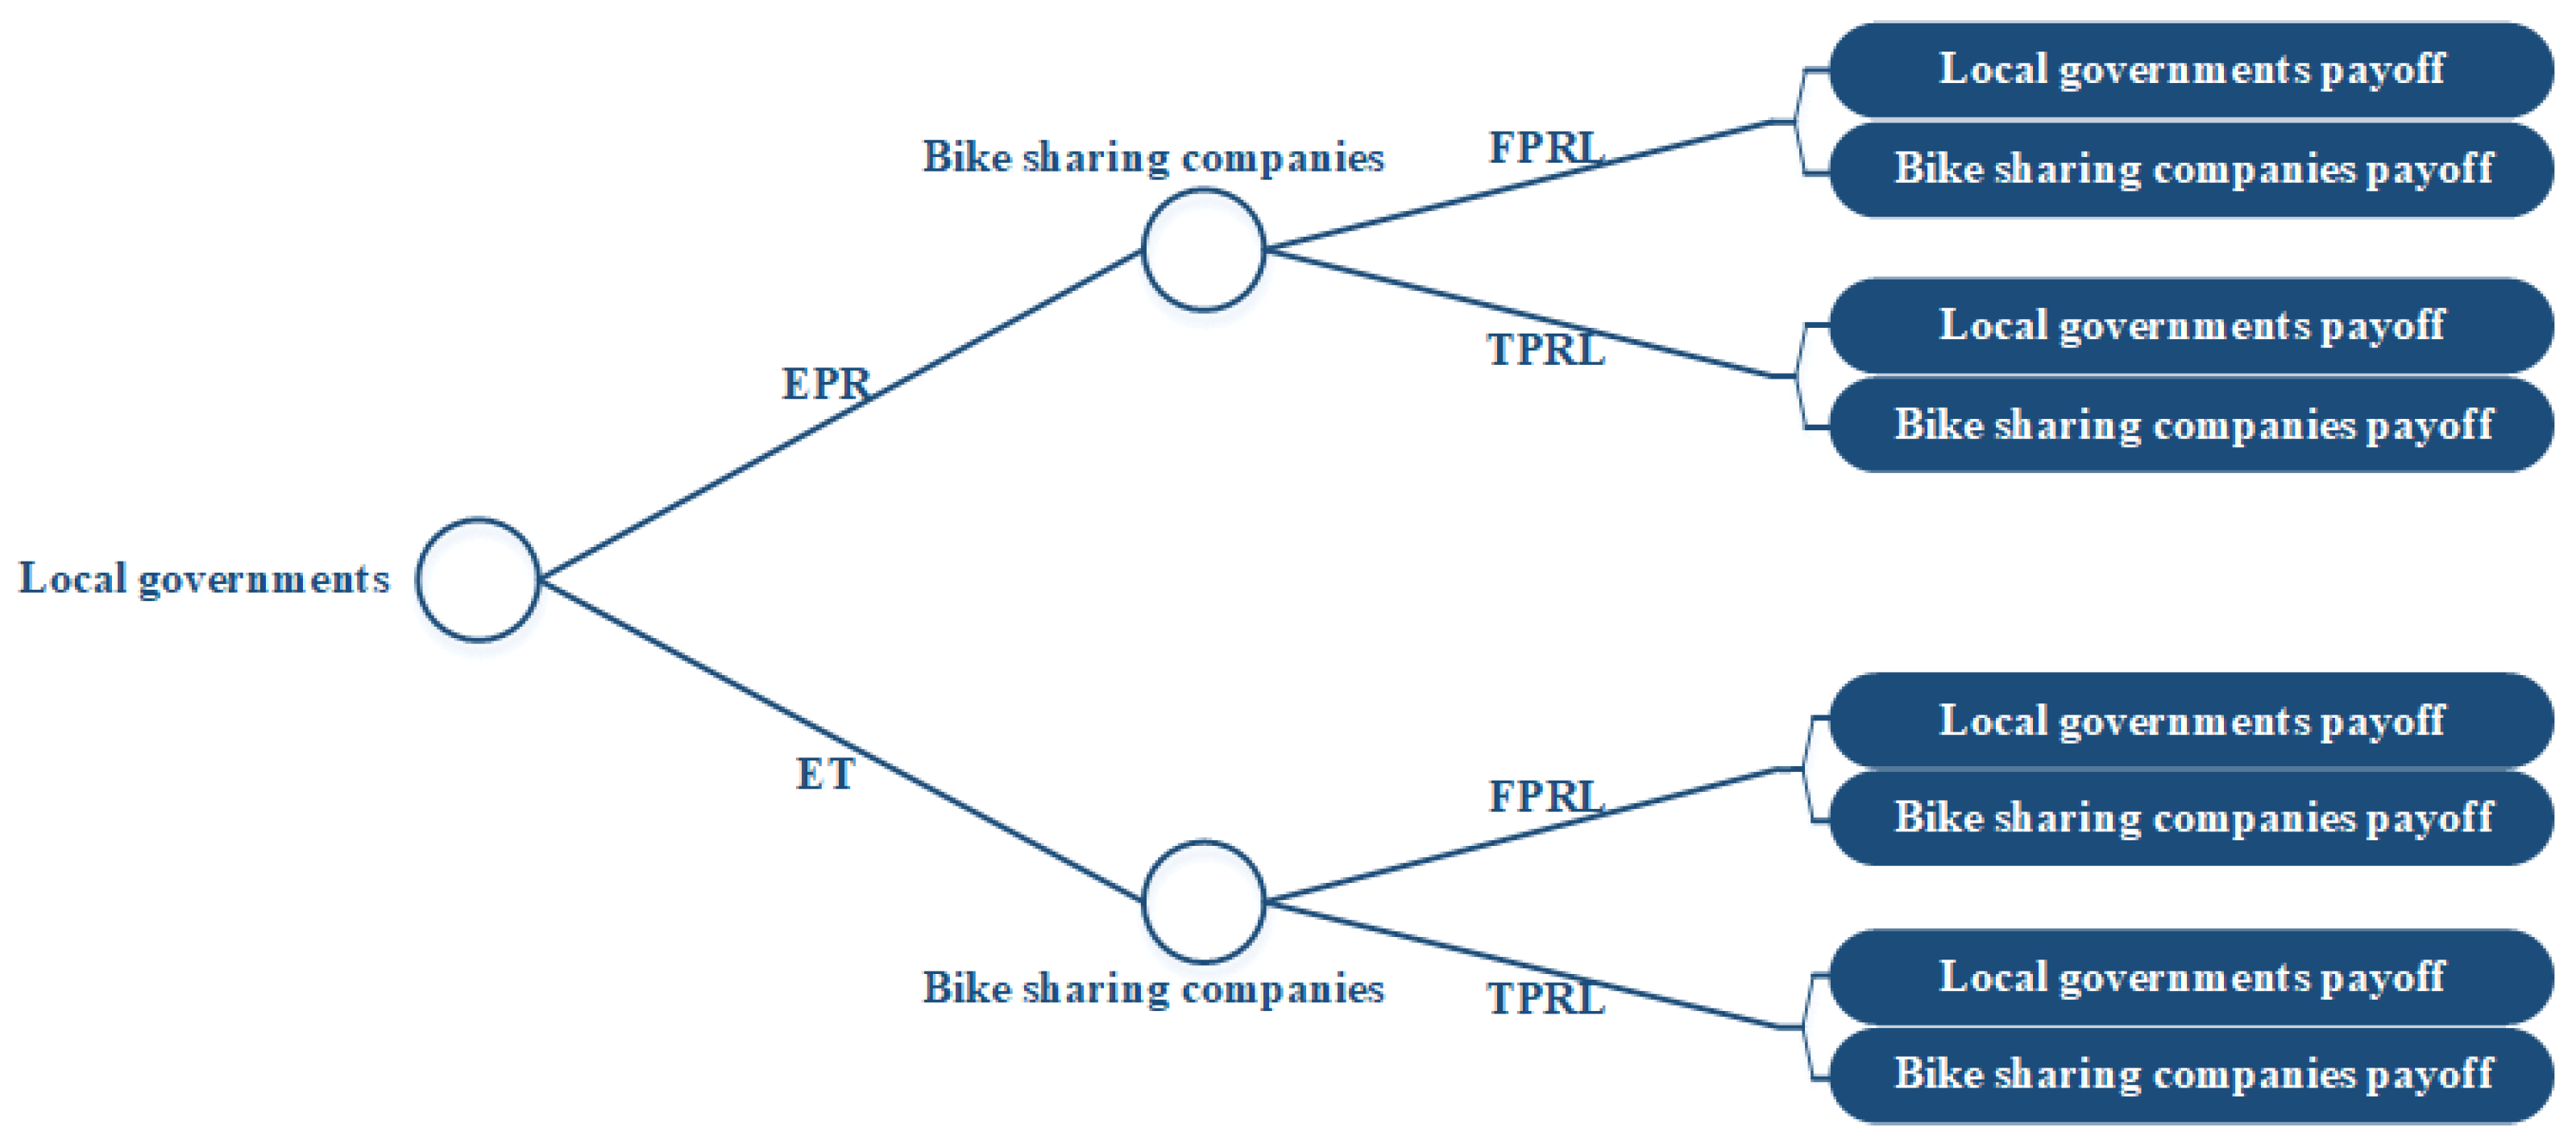
In this paper, we construct an evolutionary game model with a large dual population consisting of a limited number of individual local governments and bike-sharing companies. Each of the two groups has two pure strategies to choose from. The strategy space for local governments is SG = {ET, EPR}, and the strategy space for bike-sharing companies is SE = {FPRL, TPRL}. When bike-sharing companies choose FPRL, they pay the recovery cost (CE1). Meanwhile, in order to reduce the product disposal rate and prevent a vicious cycle, local governments implementing ET will collect recycling and disposal payments from bike-sharing companies (CE3) [55]. Because EPR is designed to incentivize bike-sharing companies to participate in environmental protection, they receive both recycling benefits (ε) and subsidies (θε) from local governments (θ is the recycling subsidy coefficient). The game tree of the two-group game model is shown in Figure 2.
In Table 2, we show the payoff matrices of both strategy combinations based on the assumptions above.

3. Model Analysis

3.1. Strategy Stability Analysis of Bike-Sharing Companies

The income matrix is defined as A and is shown below:
A = R E + η δ C P γ C E 0 C E 0 C E 1 C E 3 R E + η δ C P γ C E 0 C E 0 C E 2 R E + ( 1 + θ ) ε + η δ C P C E 0 C E 1 R E + ( 1 + θ ) ε + η δ C P C E 0 C E 2
When bike-sharing companies choose the FPRL strategy, their expected utility is as follows:
U E 1 = e A T X = 1   0 R E + η δ C P γ C E 0 C E 0 C E 1 C E 3 R E + ( 1 + θ ) ε + η δ C P C E 0 C E 1 R E + η δ C P γ C E 0 C E 0 C E 2 R E + ( 1 + θ ) ε + η δ C P C E 0 C E 2 x 1 x = x ( R E + η δ C P γ C E 0 C E 0 C E 1 C E 3 ) + ( 1 x ) ( R E + ( 1 + θ ) ε + η δ C P C E 0 C E 1 )
The average expected utility of bike-sharing companies is as follows:
U ¯ E = Y T A T X = y   1 y R E + η δ C P γ C E 0 C E 0 C E 1 C E 3 R E + ( 1 + θ ) ε + η δ C P C E 0 C E 1 R E + η δ C P γ C E 0 C E 0 C E 2 R E + ( 1 + θ ) ε + η δ C P C E 0 C E 2 x 1 x = y [ x ( R E + η δ C P γ C E 0 C E 0 C E 1 C E 3 ) + ( 1 x ) ( R E + ( 1 + θ ) ε + η δ C P C E 0 C E 1 ) ] + ( 1 y ) [ x ( R E + η δ C P γ C E 0 C E 0 C E 2 ) + ( 1 x ) ( R E + ( 1 + θ ) ε + η δ C P C E 0 C E 2 ) ]
According to the Malthusian equation, the growth of bike-sharing companies’ choice of the FPRL strategy is equal to the expected utility (UE1) minus the average expected utility ( U ¯ E ). Therefore, the replication dynamic equation of bike-sharing companies is as follows:
F ( y ) = y ( U E 1 U ¯ E ) = y ( e A T X Y T A T X ) = y ( 1 y ) ( C E 3 x + C E 2 C E 1 )
The first-order derivative of F(y) is as follows:
F ( y ) y = ( 1 2 y ) C E 3 x + C E 2 C E 1
According to the stability theorem, when F(y) = 0, F(y) ≤ 0, y is the evolutionary stability strategy (ESS) of bike-sharing companies. From F(y) = 0, we have y = 0, y = 1, and x* = (CE2CE1)/CE3. Then, we discuss the stability of the replicated dynamic equations under uncertainty:
(1)
If x = (CE2CE1)/CE3, then for any y ∈ {0,1}, there is F(y) in the steady state;
(2)
If x ≠ (CE2CE1)/CE3, then we conduct the following discussion:
  • a. Case 1: If (CE2CE1)/CE3 < 0 (i.e., CE2 < CE1), then (CE2CE1)/CE3 < x ≤ 1, F(y)|y=0 < 0, F(y)|y=1 > 0, from which we can conclude that the ESS is y = 0.
Case 1 shows that bike-sharing companies will compare the costs of FPRL and TPRL and choose the less costly strategy to maximize business benefits;
  • b. Case 2: If 0 < (CE2CE1)/CE3 < 1, and if x < (CE2CE1)/CE3, then we have F(y)|y=0 > 0, F(y)|y=1 < 0, and then the ESS is y = 1; if x > (CE2CE1)/CE3, F(y)|y=0 < 0, F(y)|y=1 > 0, then the ESS is y = 0.
Case 2 reveals that if the difference between the TPRL cost and FPRL cost is smaller than the government recycling cost, then bike-sharing companies, in the context of the EPR policy, are more willing to entrust the recycling and disposal to a third party;
  • c. Case 3: If (CE2CE1)/CE3 > 1, then 0 ≤ x ≤ 1,1 < (CE2CE1)/CE3. Then, we have F(y)|y=0 > 0, F(y)|y=1 < 0, and so the ESS is y = 1.
Case 3 shows that if the cost difference between TPRL and FPRL is significantly greater than the cost of government recycling and disposal, then bike-sharing companies will choose to dispose of the recycled waste bikes themselves.
Figure 3 presents the dynamic evolutionary path and stability of the strategies of bike-sharing companies.

3.2. Strategy Stability Analysis of Local Governments

As in the previous section, the benefit matrix for local governments is expressed as follows:
B = δ C P η δ C P + γ C E 0 + C E 3 C G δ C P η δ C P + γ C E 0 C G δ C P η δ C P C G   θ ε δ C P η δ C P C G   θ ε
When local governments choose the ET strategy, their expected utility is as follows:
U G 1 = e B Y = 1   0 δ C P η δ C P + γ C E 0 + C E 3 C G δ C P η δ C P + γ C E 0 C G δ C P η δ C P C G   θ ε δ C P η δ C P C G   θ ε   y 1 y = y ( δ C P η δ C P + γ C E 0 + C E 3 C G ) + ( 1 y ) ( δ C P η δ C P + γ C E 0 C G )
The average expected utility of local governments is as follows:
U ¯ G = X B Y = x   1 x δ C P η δ C P + γ C E 0 + C E 3 C G δ C P η δ C P + γ C E 0 C G δ C P η δ C P C G   θ ε δ C P η δ C P C G   θ ε   y 1 y = x y ( δ C P η δ C P + γ C E 0 + C E 3 C G ) + ( 1 y ) ( δ C P η δ C P + γ C E 0 C G ) + ( 1 x ) ( δ C P η δ C P C G   θ ε )
Similar to Equation (4) in Section 3.1, the dynamic equation is replicated as follows:
F ( x ) = x ( U G 1 U ¯ G ) = x ( e B Y X B Y ) = x ( 1 x ) ( C E 3 y + θ ε η δ C P )
The first-order derivatives of F(x) are as follows:
F ( x ) x = ( 1 2 x ) ( C E 3 y + θ ε η δ C P )
According to the stability theorem, when F(x) = 0 and F(x) ≤ 0, x is the ESS of bike-sharing companies. If F(x) = 0, then we have x = 0, x = 1, and y* = (ηδCPθε)/CE3. Similarly, we discuss the stability of the replicated dynamic equations under uncertainty:
(1)
If y = (ηδCPθε)/CE3, then for any x∈{0,1}, there is F(x) in the steady state;
(2)
If y ≠ (ηδCPθε)/CE3, we conduct the following analysis:
  • a. Case 4: If ηδCPθε < 0, then we have 1 ≥ y ≥ (ηδCPθε)/CE3, F(x)|x=0 > 0, F(x)|x=1 < 0. Therefore, the ESS is x = 1. Limited rational local governments will choose the EPR policy to manage the local bike-sharing industry.
Case 4 shows that, in the process of implementing the extended production responsibility system, if the bike-sharing companies fail to achieve the efficient recycling and disposal of abandoned bikes, local governments will eventually abandon the implementation of the EPR system and continue to choose the environmental tax policy instead;
  • b. Case 5: If 0 < ηδCPθεCE3, when 1 ≥ y > (ηδCPθε)/CE3, F(x)|x=0 > 0, F(x)|x=1 < 0, then the ESS is x = 1. When 0 ≤ y < (ηδCPθε)/CE3, F(x)|x=0 < 0,F(x)|x=1 > 0, then the ESS is x = 0.
Case 5 reveals that when local residents are more satisfied with the urban environment, local governments will continue to promote the EPR system despite the higher cost of providing incentives to companies. Conversely, local governments will still adopt the ET strategy;
  • c. Case 6: If ηδCPθε > CE3, then we have y < (ηδCPθε)/CE3, F(x)|x=0 < 0, F(x)|x=1 > 0, and the ESS is x = 0.
Case 6 implies that when residents are more satisfied with the urban environment and have a higher preference for green, local governments will definitely insist on the extended producer responsibility system.
Figure 4 presents the dynamic evolutionary path and stability of the local government strategies.

4. Analysis and Proof of ESS between Local Governments and Bike-Sharing Companies

We consider the current management of shared bicycles in China, local residents’ attitudes toward shared bicycles, the level of disposal and reuse, and the logistics and transportation capacity, and we proceed to the next step in this paper based on the conditions of {Case 2, Case 4} and {Case 2, Case 5}.
In reality, while local governments incentivize bike-sharing companies to improve their recycling efficiency, in order to reduce management costs, local governments generally opt for a regressive subsidy policy (i.e., local governments gradually reduce the amount of the recycling subsidies to bike-sharing companies as the promotion rate of the EPR system increases). In order to discuss the difference between the two recycling subsidy policies, we take the recycling subsidy coefficient of the regression subsidy policy as θ =: αx (the recycling subsidy coefficient is negatively correlated with the promotion rate), and let the local governments provide fixed recycling subsidy coefficients to bike-sharing companies as θ =: α (i.e., x = 1); the recycling subsidy coefficient is independent of the promotion rate, where α > 0.

4.1. Analysis and Proof of ESS under Fixed Recycling Subsidy Policy

When the local government chooses the fixed recycling subsidy policy, the replicated dynamical system consisting of both is obtained from the replicated dynamical Equations (4) and (9). This two-dimensional nonlinear dynamical system is as follows:
F ( y ) = y ( 1 y ) ( C E 3 x + C E 2 C E 1 ) F ( x ) = x ( 1 x ) ( C E 3 y + θ ε η δ C P )
The following equilibrium points can be interpreted to replicate the stability conditions of a dynamic system:
{(0,0),(0,1),(1,0),(1,1),(x*,y*)}
where x* = (CE2CE1)/CE3, and y* = (ηδCPθε)/CE3.
According to Friedman’s theory of dynamic evolutionary equilibrium, the equilibrium point that satisfies that all the eigenvalues of the Jacobian matrix are nonpositive is the evolutionary stability strategy of the system when describing the population evolution by dynamics defined by differential equations. The Jacobian matrix (J) of the replicated dynamical system is as follows:
J = F ( x ) x F ( x ) y F ( y ) x F ( y ) y =   ( 1 2 x ) ( y C E 3 + θ ε η δ C P ) x ( 1 x ) C E 3   y ( 1 y ) ( C E 3 ) ( 1 2 y ) C E 3 x + C E 2 C E 1

4.1.1. Analysis and Proof of ESS Based on Case 2 and Case 4

Proposition 1.
Among the five equilibrium points of this replicated dynamical system, ( x 1 * , y 1 * ) and (0,1) are the saddle points, (0,0) and (1,1) are the instability points, and (1,0) is the asymptotic evolutionary stable strategy.
Based on the conditions of {0 < (CE2CE1)/CE3 < 1, ηδCPθε < 0,0 ≤ x ≤ 1, 0 ≤ y ≤ 1} in Case 2 and Case 4, the five-equilibrium stability analysis is shown in Appendix A, Table A1. Because the determinants of the Jacobian matrices of (0,0) and (1,1) are greater than 0 but the trace is not less than 0, these two points are unstable. The Jacobian matrix determinants of ( x 1 * , y 1 * ) and (0,1) are less than 0, and so they are saddle points. Moreover, the determinant of the Jacobian matrix of (1,0) is greater than 0 and the trace is less than 0, and so it is a stable point.

4.1.2. Analysis Based on Case 2 and Case 5

Proposition 2.
Among the five equilibrium points of this replicated dynamic system, (0,0), (0,1), (1,1), and (1,0) are the saddle points. ( x 2 * , y 2 * ) is the central point, but not the asymptotic evolutionary stable strategy.
Based on the conditions {0 < (CE2CE1)/CE3 ≤ 1, 0 < ηδCPθεCE3, 0 ≤ x ≤ 1, 0 ≤ y ≤ 1} in Case 2 and Case 5, the stability analysis of the five equilibrium points shown in Table A2 in Appendix B can be obtained. Because the determinants of the Jacobian matrices of points (0,0), (0,1), (1,0), and (1,1) are less than 0, these four points are saddle points. The determinant of the Jacobian matrix of ( x 2 * , y 2 * ) is greater than 0 and the trace is equal to 0, and so it is the center point.

4.2. Analysis and Proof of ESS under Regressive Recycling Subsidy Policy

When the local government chooses the regressive recycling subsidy policy, this two-dimensional nonlinear dynamic system is as follows:
F ( y ) = y ( 1 y ) ( C E 3 x + C E 2 C E 1 ) F ( x ) = x ( 1 x ) ( C E 3 y + α ε x η δ C P )
The following equilibria can be interpreted as stability conditions for this replicated dynamical system:
{ ( 0 , 0 ) , ( 0 , 1 ) , ( 1 , 0 ) , ( 1 , 1 ) , ( x 3 * , y 3 * ) }
where x 3 * = (CE2 − CE1)/CE3, and y 3 * = x 3 * ( x 3 * −1)(ηδCPαε x 3 * )(ηδCPαε x 3 * CE3).
The Jacobian matrix (J3) of the replicated dynamic system is as follows:
J 3 = F ( x ) x F ( x ) y F ( y ) x F ( y ) y = x ( 1 x ) α ε +   ( 1 2 x ) ( y C E 3 + α ε x η δ C P ) x ( 1 x ) C E 3   y ( 1 y ) ( C E 3 ) ( 1 2 y ) C E 3 x + C E 2 C E 1
Similar to the method of discriminating unstable points, saddle points, center points, and stable points in Section 4.1, the stability of each point can be discriminated by referring to the determinant of the Table A3 Jacobian matrix and the sign of the trace in Appendix C. We will discriminate the stability points according to the real situation in the simulation (see Section 5.2).

5. Simulation

We conducted interviews with bike-sharing companies (Hello Bike, etc.) and local governments (Changsha Municipal Government, etc.), and searched for public data to finally obtain the relevant parameters in the game model. We further analyzed, validated, and tested the model in this paper, and analyzed the sensitivity of multiple parameters to gain insights for local governments and bike-sharing companies in sustainable green operation management.
According to the public documents of local governments, at least 20 of China’s 34 provincial administrative regions have publicly released the implementation plan of the extended producer responsibility system, and so let x = 0.4 in this simulation. Meanwhile, we take y = 0.6 from the results of the research on bike-sharing companies and their recycling suppliers in several places. From the results of the literature [56], we obtained that the unit production cost of a Meituan bike is CE0 = CNY 600, the unit cost of first-party reverse logistics transportation is CNY 9.20, and the unit cost of third-party reverse logistics transportation is CNY 16.73. According to the literature [57], we obtain a unit revenue of CNY 5 for the disposal of abandoned bicycles. According to the Technical and Service Specifications for Shared Bicycle Systems, the end-of-life time limit for bike sharing is three years [58]. The public data show that the damage rate of bike sharing in January is 10%–20%. We take the median damage rate of 15%, and the total damage rate of three years is calculated to be 99.71%, and then there is an annual average unit abandonment rate of 33.23%. Therefore, the unit cost of first-party reverse logistics recycling processing is CE1 = CNY 1.40, and the unit cost of third-party reverse logistics recycling processing is CE2 = CNY 3.90, in the experiment of this paper. Referring to the Beijing Municipal Commission of Transport’s “Public Notice on the supervision of the Internet rental bicycle industry’s camp management in the first quarter of 2020”, “Public Notice on the supervision of the Internet rental bicycle industry’s operation in 2020 and the scale of vehicle placement in 2021”, and “List of Administrative Punishment Matters in Transportation” [59,60,61], the government received 96 complaints from residents in the first quarter. The Transportation Commission fined the bike-sharing company CNY 50,000 to clean up a total of 14,215 bikes operated in violation of the law in five enforcement sessions. A bike-sharing unit has a daily turnover rate of 1.1 and a charge of CNY 1.50 per ride. We obtained a resident satisfaction conversion coefficient (δ = 1.04%), a company reward and punishment coefficient (η = 17.59), and a bike-sharing rental unit revenue (RE = 1.65). From the literature [62], it is known that bike sharing can obtain about 5% of the manufacturing cost after recycling and disposal; then, the average recycling conversion benefit (ε = CNY 9.97) is obtained based on the average damage rate. We obtained the cost of the government regulation of shared bicycle units (CG = CNY 0.8) from interviews with the Changsha municipal government. Table 3 provides a summary of the initial values of the key parameters.

5.1. Evolutionary Game Analysis under Fixed Recycling Subsidy Policy

In this paper, we obtained several conclusions in Section 5.1.1 and Section 5.1.2 through simulation against the background of the local government’s choice of a fixed recycling subsidy policy (θ = α).

5.1.1. Simulation Based on Case 2 and Case 4

Based on the conditions of Case 2 and Case 4 {0 < (CE2CE1)/CE3 ≤ 1, ηδCPαεx < 0, 0 ≤ x ≤ 1}, numerical simulations are conducted for the government to fix the recycling subsidy amount (θ = α) for bike-sharing companies.
(1)
Evolutionary simulation of two groups with different initial strategy proportions
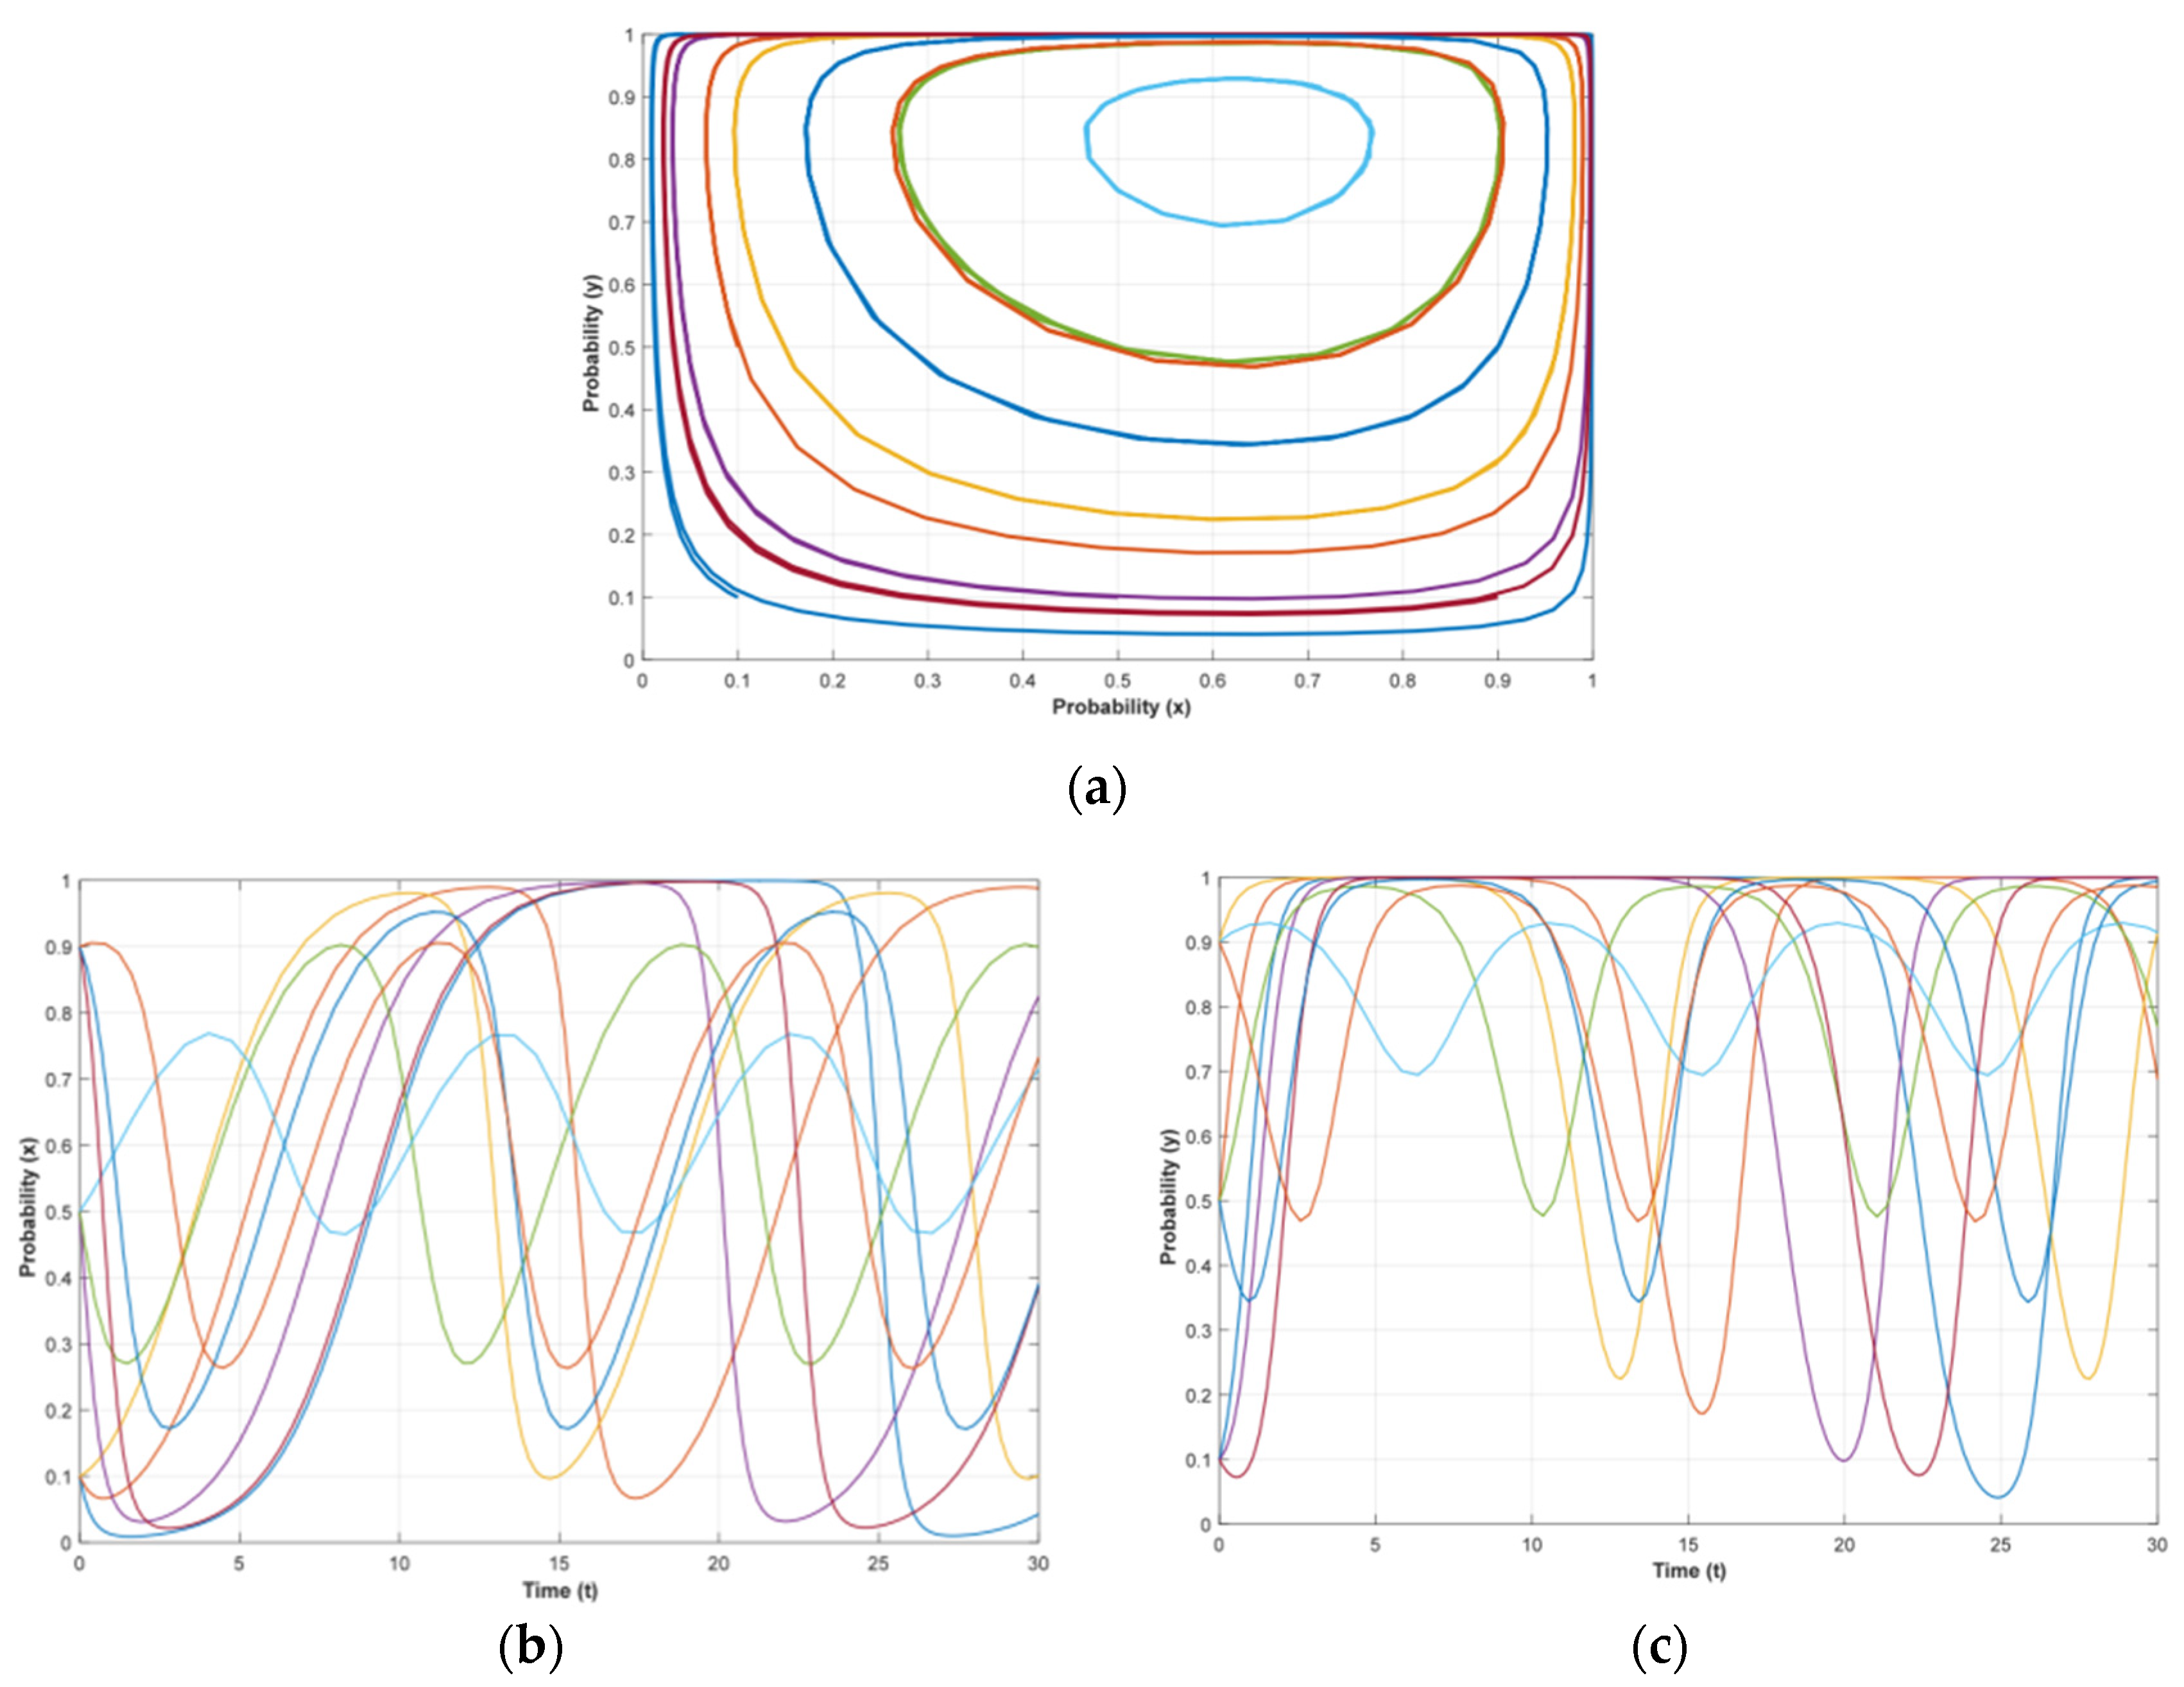
We set θ =α = 2, CP = 1, x = {0.1,0.3,0.5,0.7,0.9}, and y = {0.1,0.3,0.5,0.7,0.9}, and we obtained Figure 5. As shown in Figure 5a, the proportion of the strategies of the two groups in the evolutionary game gradually changes to the stability point (1,0) over time. The conclusion in Section 4.1. for Case 2 and Case 4 is verified experimentally; that is, when the conditions of Case 2 and Case 4 are satisfied, the evolutionary stability point is E(1,0).
(2)
Effects of recycling subsidy given by local government
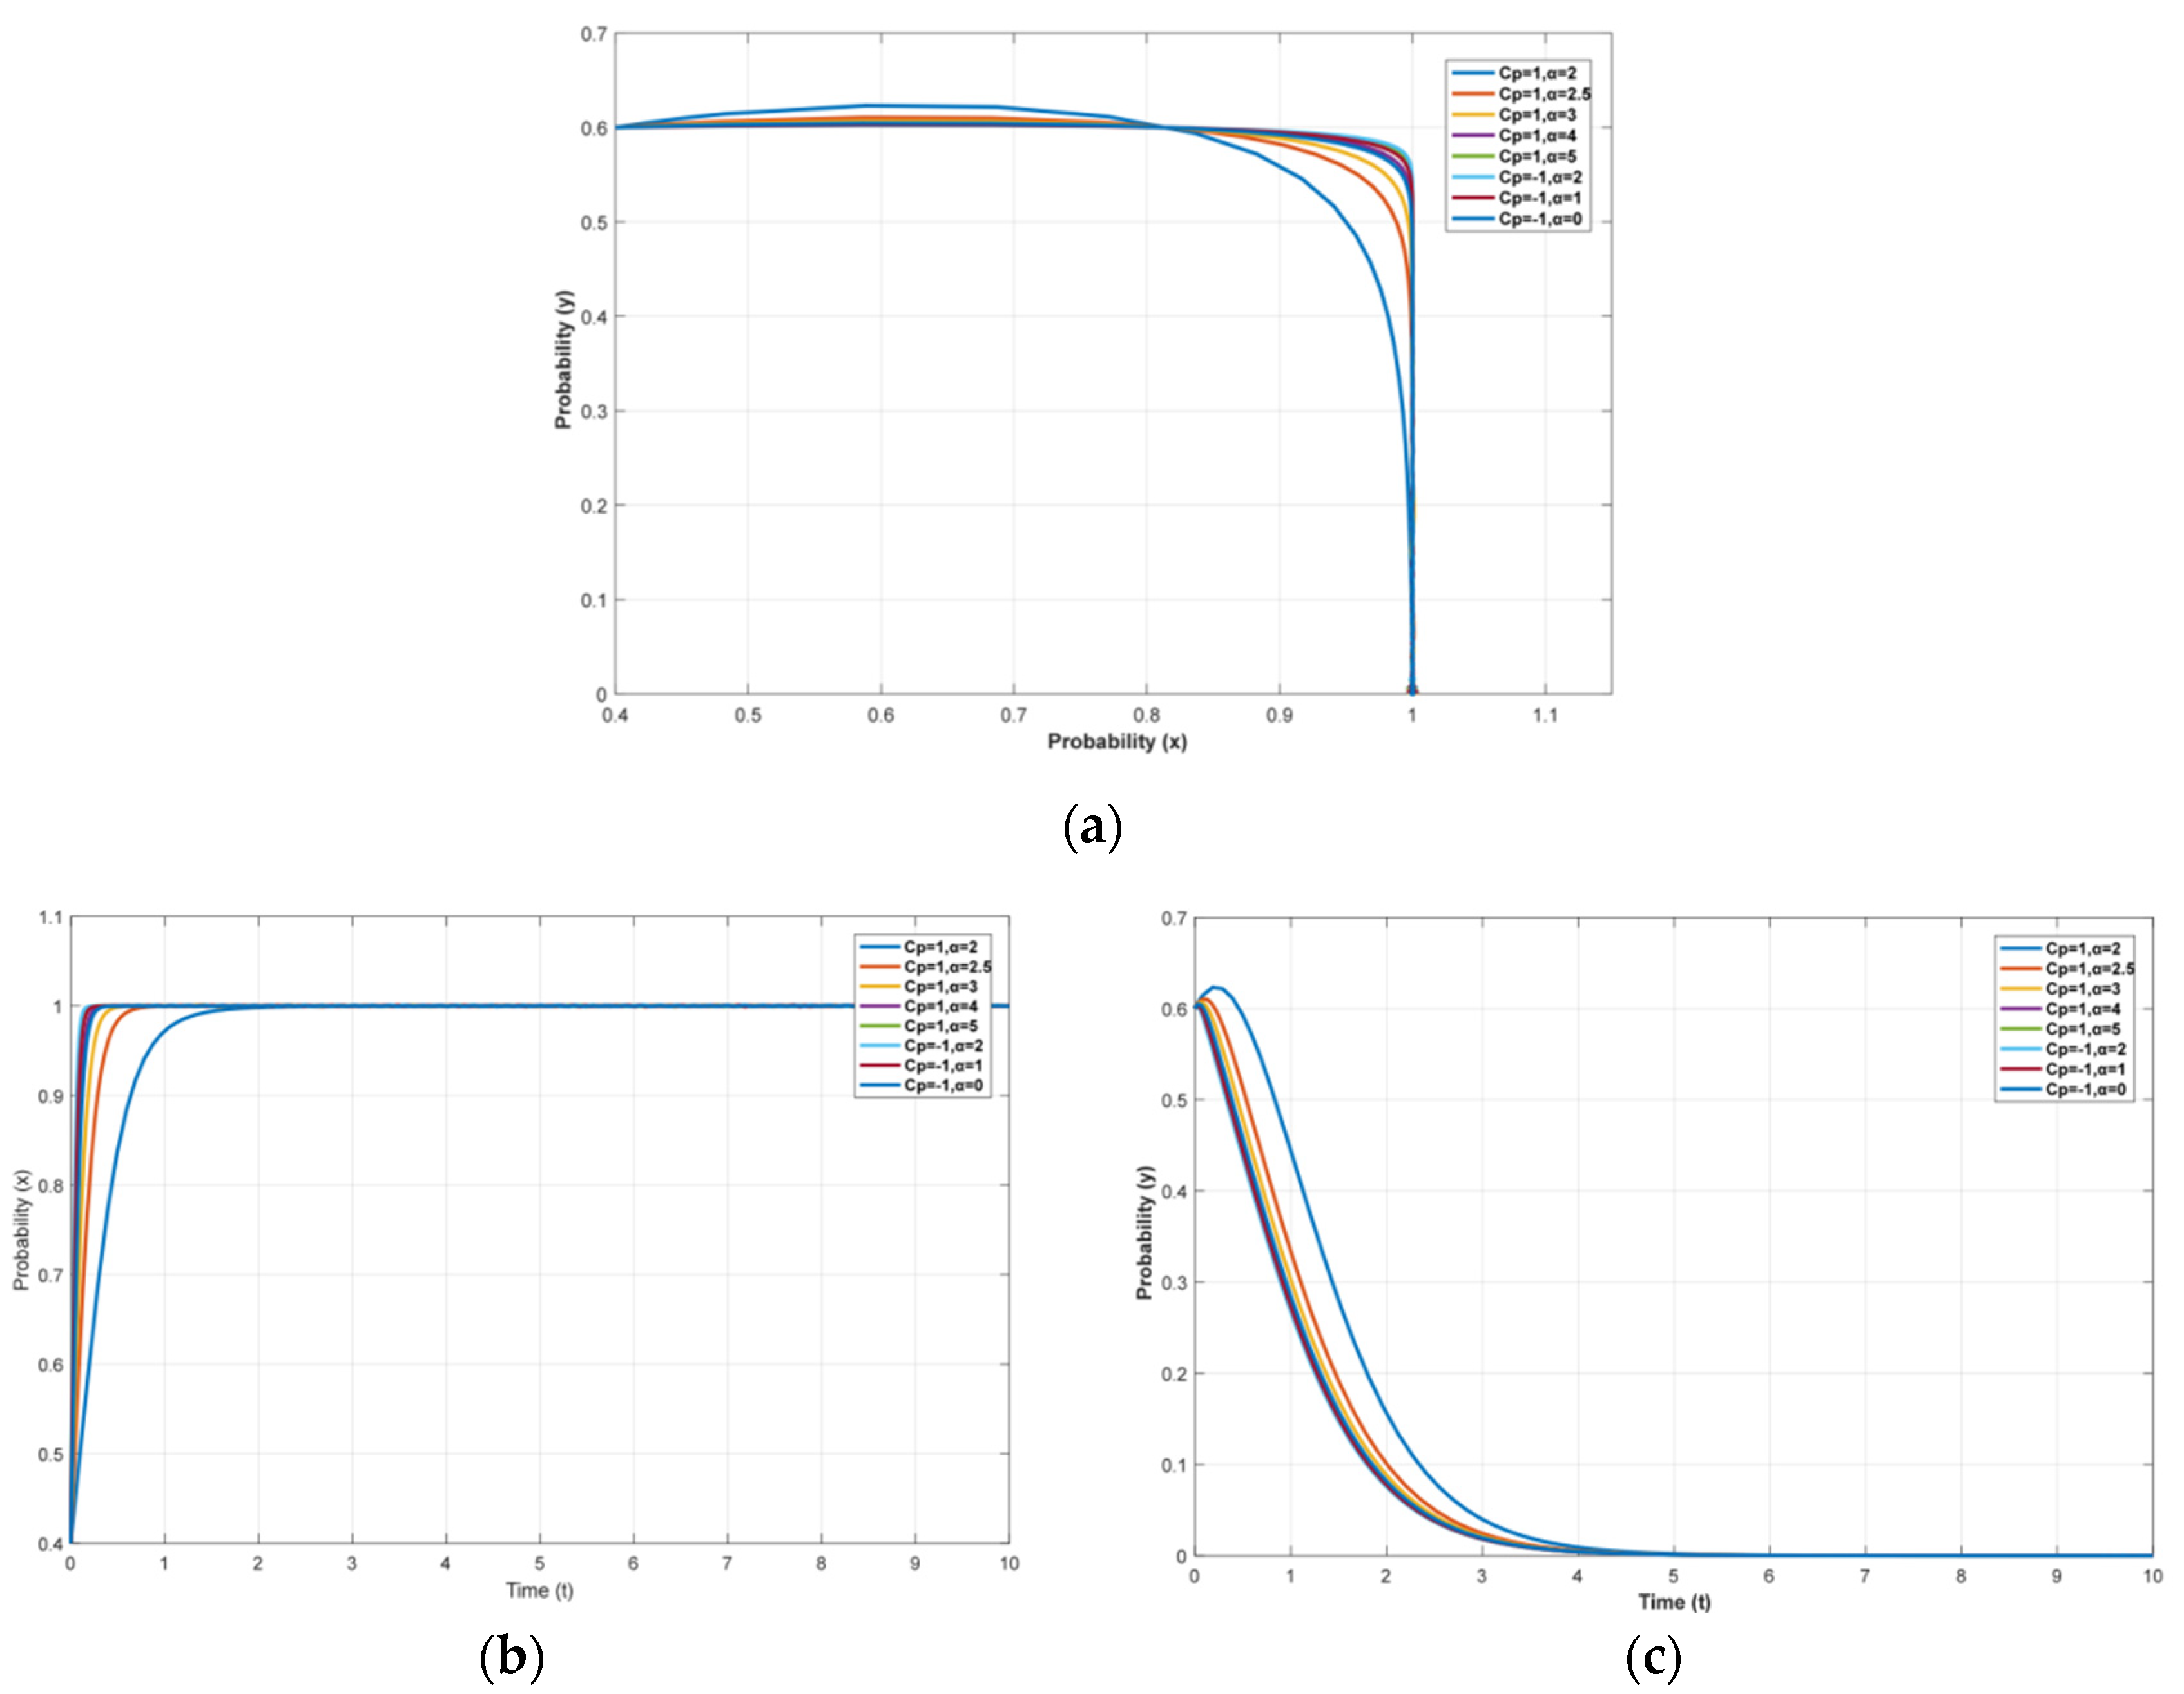
To study the effect of the recycling subsidy policy on the trajectory of the strategy in the evolutionary system when the local government adopts the EPR system, we consider the different values of the recycling subsidy coefficient (α) based on resident satisfactions (CP) of 1 and −1. Let the initial values of the parameters be {CP = 1, θ = α = 2, 2.5, 3, 4, 5} and {CP = −1, α = 0, 1, 2}. From Figure 6, it can be observed that when the current condition is satisfied, regardless of whether the CP is positive or negative, the bike-sharing companies gradually abandon the third-party reverse logistics strategy as the base (α) of the recycling subsidy coefficient increases. Moreover, the recycling subsidy coefficient has a diminishing effect on the strategy trajectory, which suggests a marginal diminishing effect of over-subsidized incentives.
(3)
Effects of resident satisfaction
Considering that residents in different places have different demands on the local public environment and for bike sharing, and different qualities of bike-sharing services, let α = 2, θ = α, and CP be assigned as −5, −4, −3, −2, −1, 0.5, 0, 0.5, 1, respectively. From Figure 7, it can be observed that when other parameters are fixed and CP is on the interval [–1, 1], the resident satisfaction has a greater influence on the behavioral strategies of bike-sharing companies and local governments. However, when the CP is in the range of [–5, –1], there is an incrementally larger marginal decreasing effect of the CP on the strategies of both players of the game. This phenomenon reflects that, in a realistic scenario, the resident satisfaction has a limited but not negligible influence on the management of bike-sharing companies and the implementation of local government policies.

5.1.2. Simulation Based on Case 2 and Case 5

Similar to Section 5.1.1, this section is based on the conditions {0 < (CE2CE1)/CE3 ≤ 1, 0 < ηδCPθεCE3} of Case 2 and Case 5 for numerical simulation.
(1)
Evolutionary simulation of two groups with different initial strategy proportions
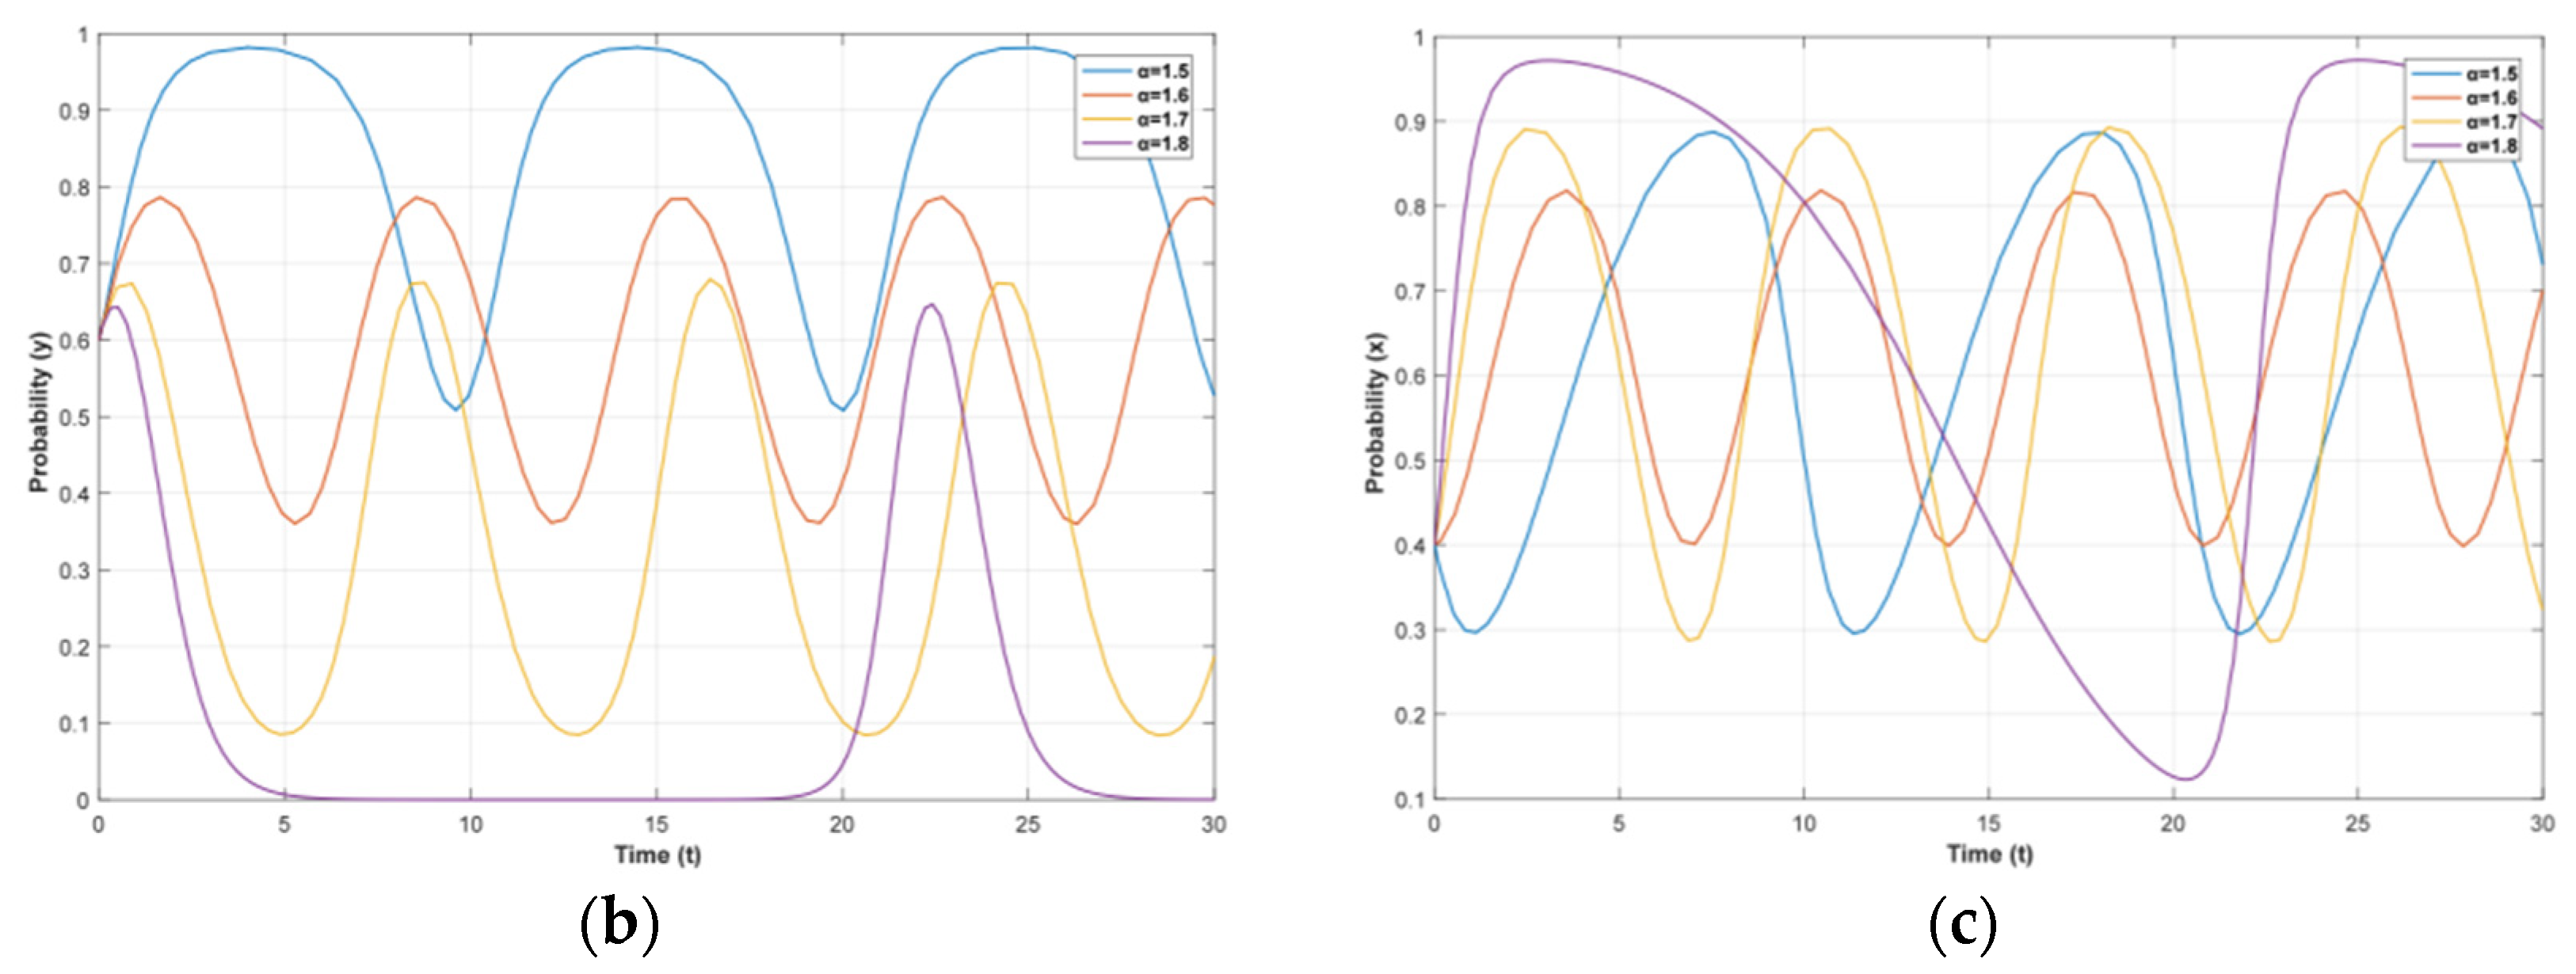
Let θ = α =1.5, CP = 1, x = {0.1,0.3,0.5,0.7,0.9}, and y = {0.1,0.3,0.5,0.7,0.9}, which gives Figure 8. It is obvious from Figure 8a that the evolutionary trajectory of the replicated dynamic system is a closed loop around a central point, and the closer the initial point (x,y) is to the central point, the more the evolutionary trajectory resembles a circle. For both groups in this replicated dynamic system (local governments and bike-sharing companies), neither has an evolutionary stable strategy. Meanwhile, Figure 8b,c reflects that the population proportions of local governments and bicycle-sharing companies change periodically, which reveals that the population sizes of the two groups are not stable.
(2)
Effects of recycling subsidy given by local government
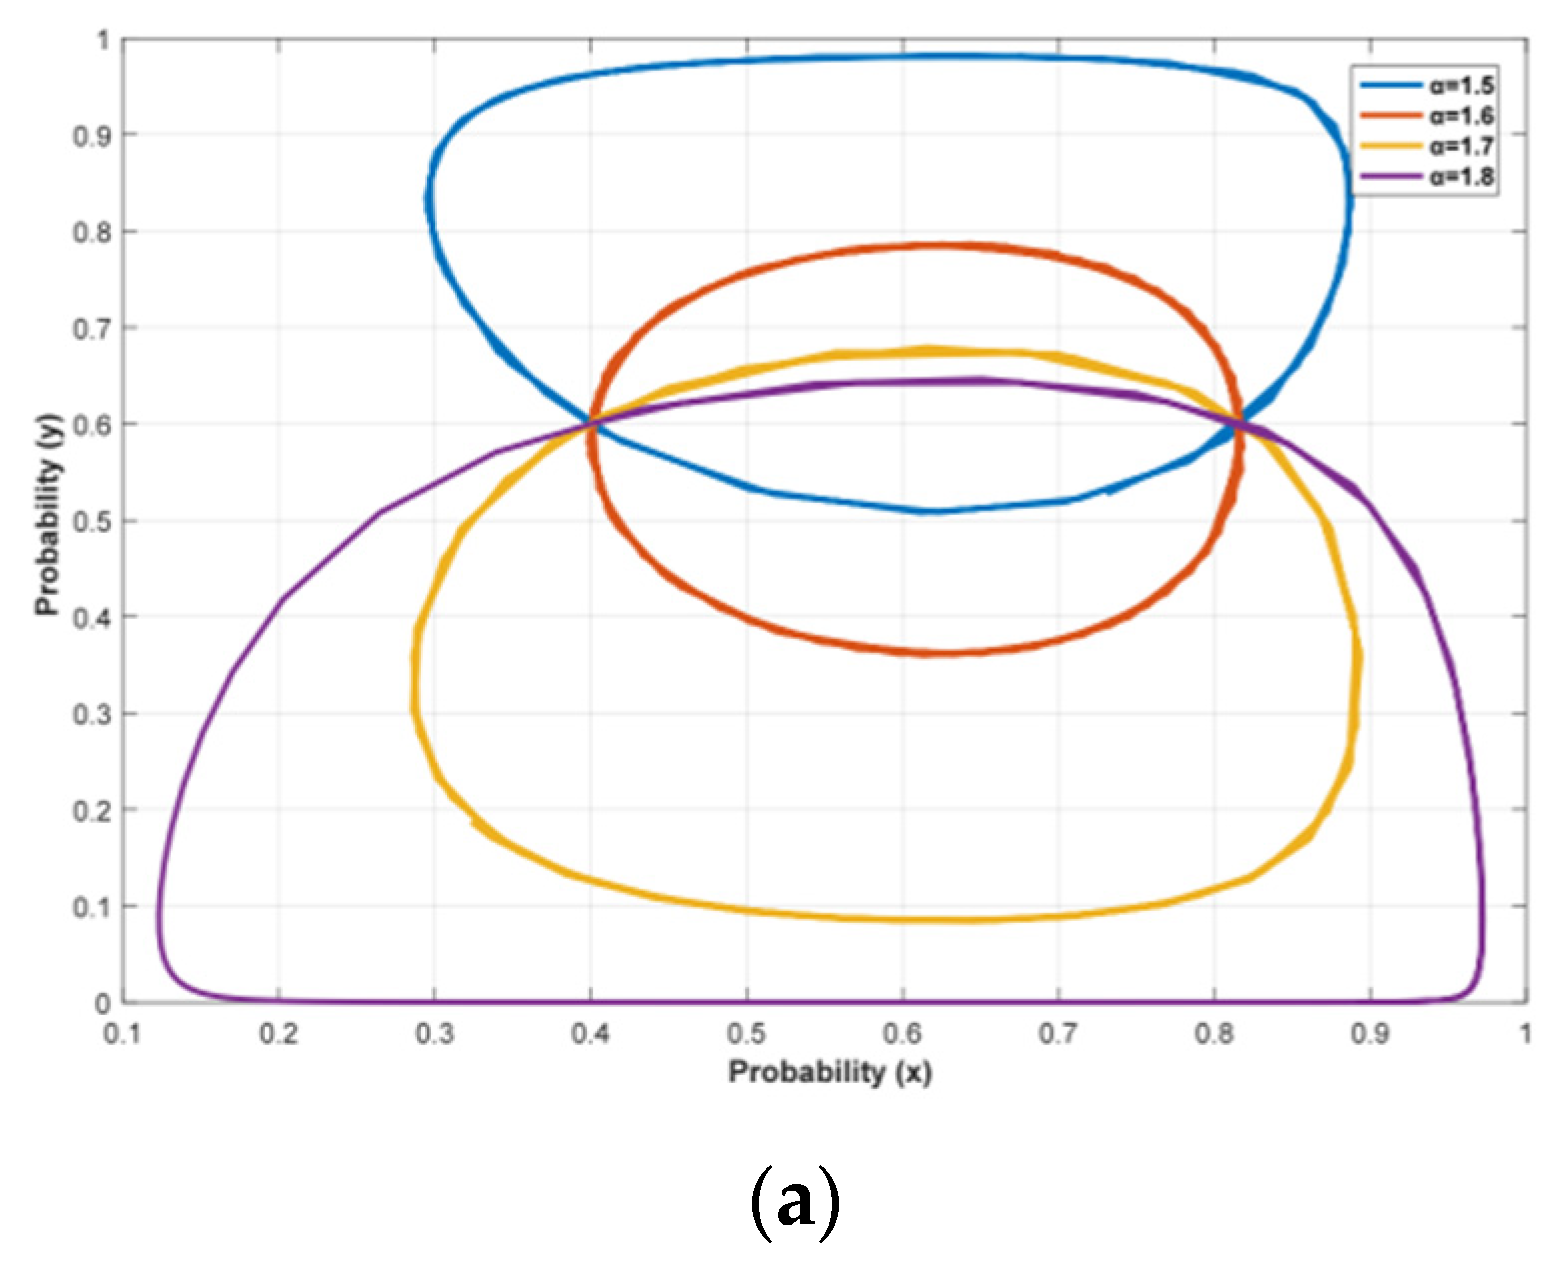
Let CP = 1, and let α be assigned as 1.5, 1.6, 1.7, and 1.8, to obtain Figure 9. From Figure 9a, it can be observed that, along with the increase in the α from small (from 1.5 to 1.8), the closed loop presented by the evolutionary trajectory shows a gradual downward trend in the y-axis (i.e., bike-sharing companies gradually tend to choose third-party reverse logistics to deal with abandoned bikes). Meanwhile, when | y y * | is the smallest, the relatively most stable closed loop is obtained (i.e., θ = α = ( η δ C P y C E 3 ) / ε 1.5941 ). This reflects that a rational amount of recycling subsidy has a significant impact not only on the behavioral strategy bias of bike-sharing firms, but also on the implementation of the EPR system.
(3)
Effects of resident satisfaction
On the basis of 5.1.2.(2), we set the initial values of parameters {α = 1.5, CP = 0.9, 1} and {α = 2, CP = 1.1, 1.2, 1.3} and obtained Figure 10 in order to analyze the influence of the resident satisfaction on the evolutionary process. There is a closed-loop curve that is relatively most stable when min{ | y y * | } (i.e., C P = ( α ε + y C E 3 ) / ( η δ ) ). The central point (x*,y*) is jointly influenced by the α and CP, thus determining the magnitude of the fluctuation of the strategy trajectory with the trajectory curve of the point (x,y), which plays a decisive role in the stability of the population ratio of the two groups.

5.2. Evolutionary Game Analysis under Regressive Recycling Subsidy Policy

In order to investigate the impact of different recycling subsidies on the evolutionary trajectory, we set the recycling subsidy amount (θ = αx) as negatively related to the promotion rate and compared it with Section 5.1 while analyzing the sensitivity of the replicated dynamic system to the key parameters.
(1)
Evolutionary simulation of two groups with different initial strategy proportions
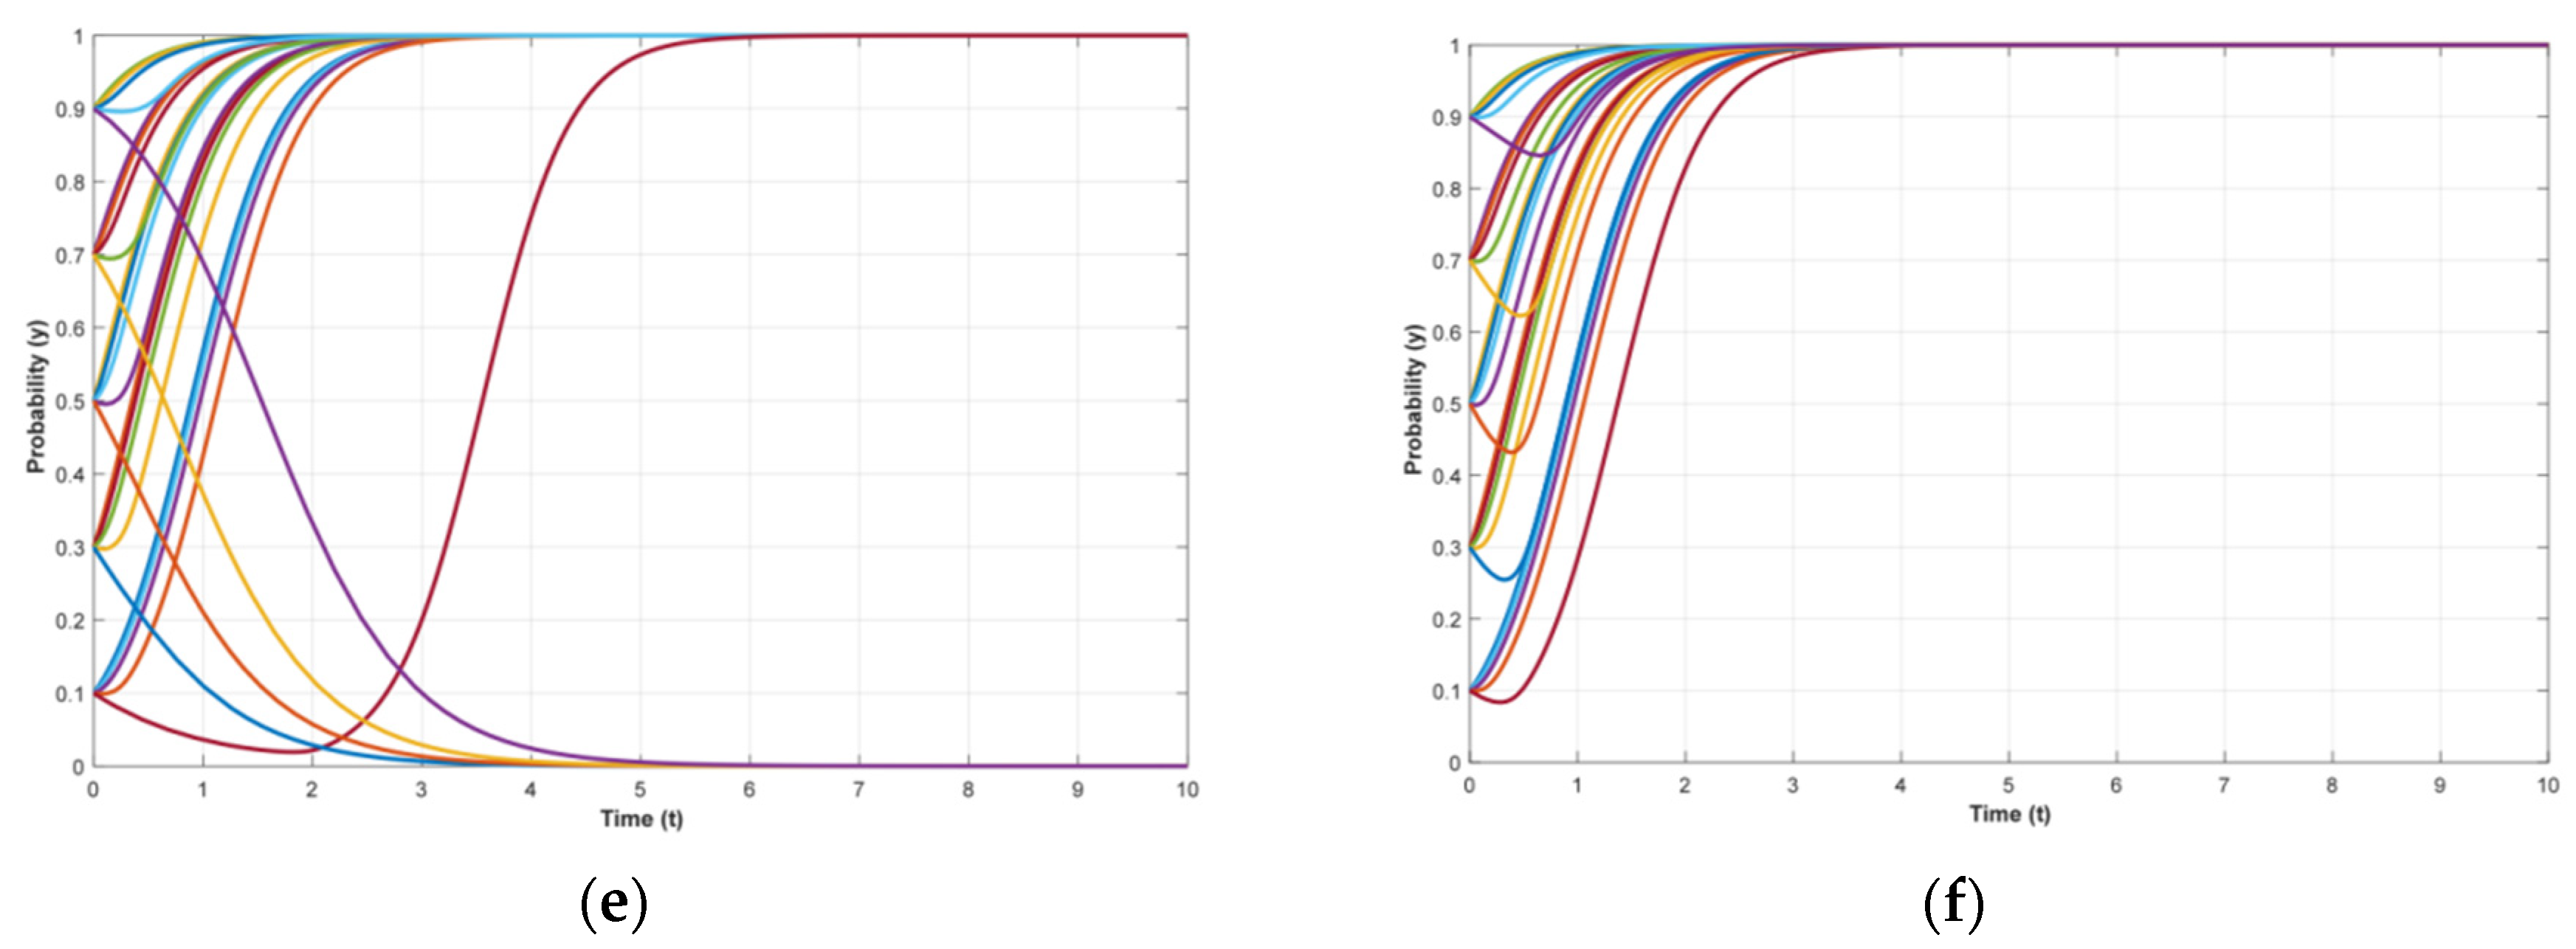
Based on (1) of Section 5.1.1 and (2) of Section 5.1.2, Figure 11 was obtained by setting the initial parameters: x = {0.1,0.3,0.5,0.7,0.9}, y = {0.1,0.3,0.5,0.7,0.9}, {θ = αx = 2x, CP = 1}, and {θ = αx = 1.5x, CP = 1}. From Figure 11a,b, it is obvious that when θ = αx = 2x, CP = 1, there are two stable points: E(0,1) and E(1,0); when θ =αx = 1.5x, CP = 1, there is only one stable point: E(0,1), which is consistent with the inference that can be obtained in Table A3. The change in recycling subsidy policy has led to a fundamental change in the evolutionary trajectory of the replication dynamic system. In particular, for the initial condition {θ = αx = 1.5x, CP = 1} (see Figure 8a and Figure 11b), the regressive recycling subsidy policy induces a replicated dynamical system with no stable point to transform into one with a stable point and satisfies the current need to promote the EPR system in China (i.e., induces x = 0).
(2)
Effects of recycling subsidy given by local government
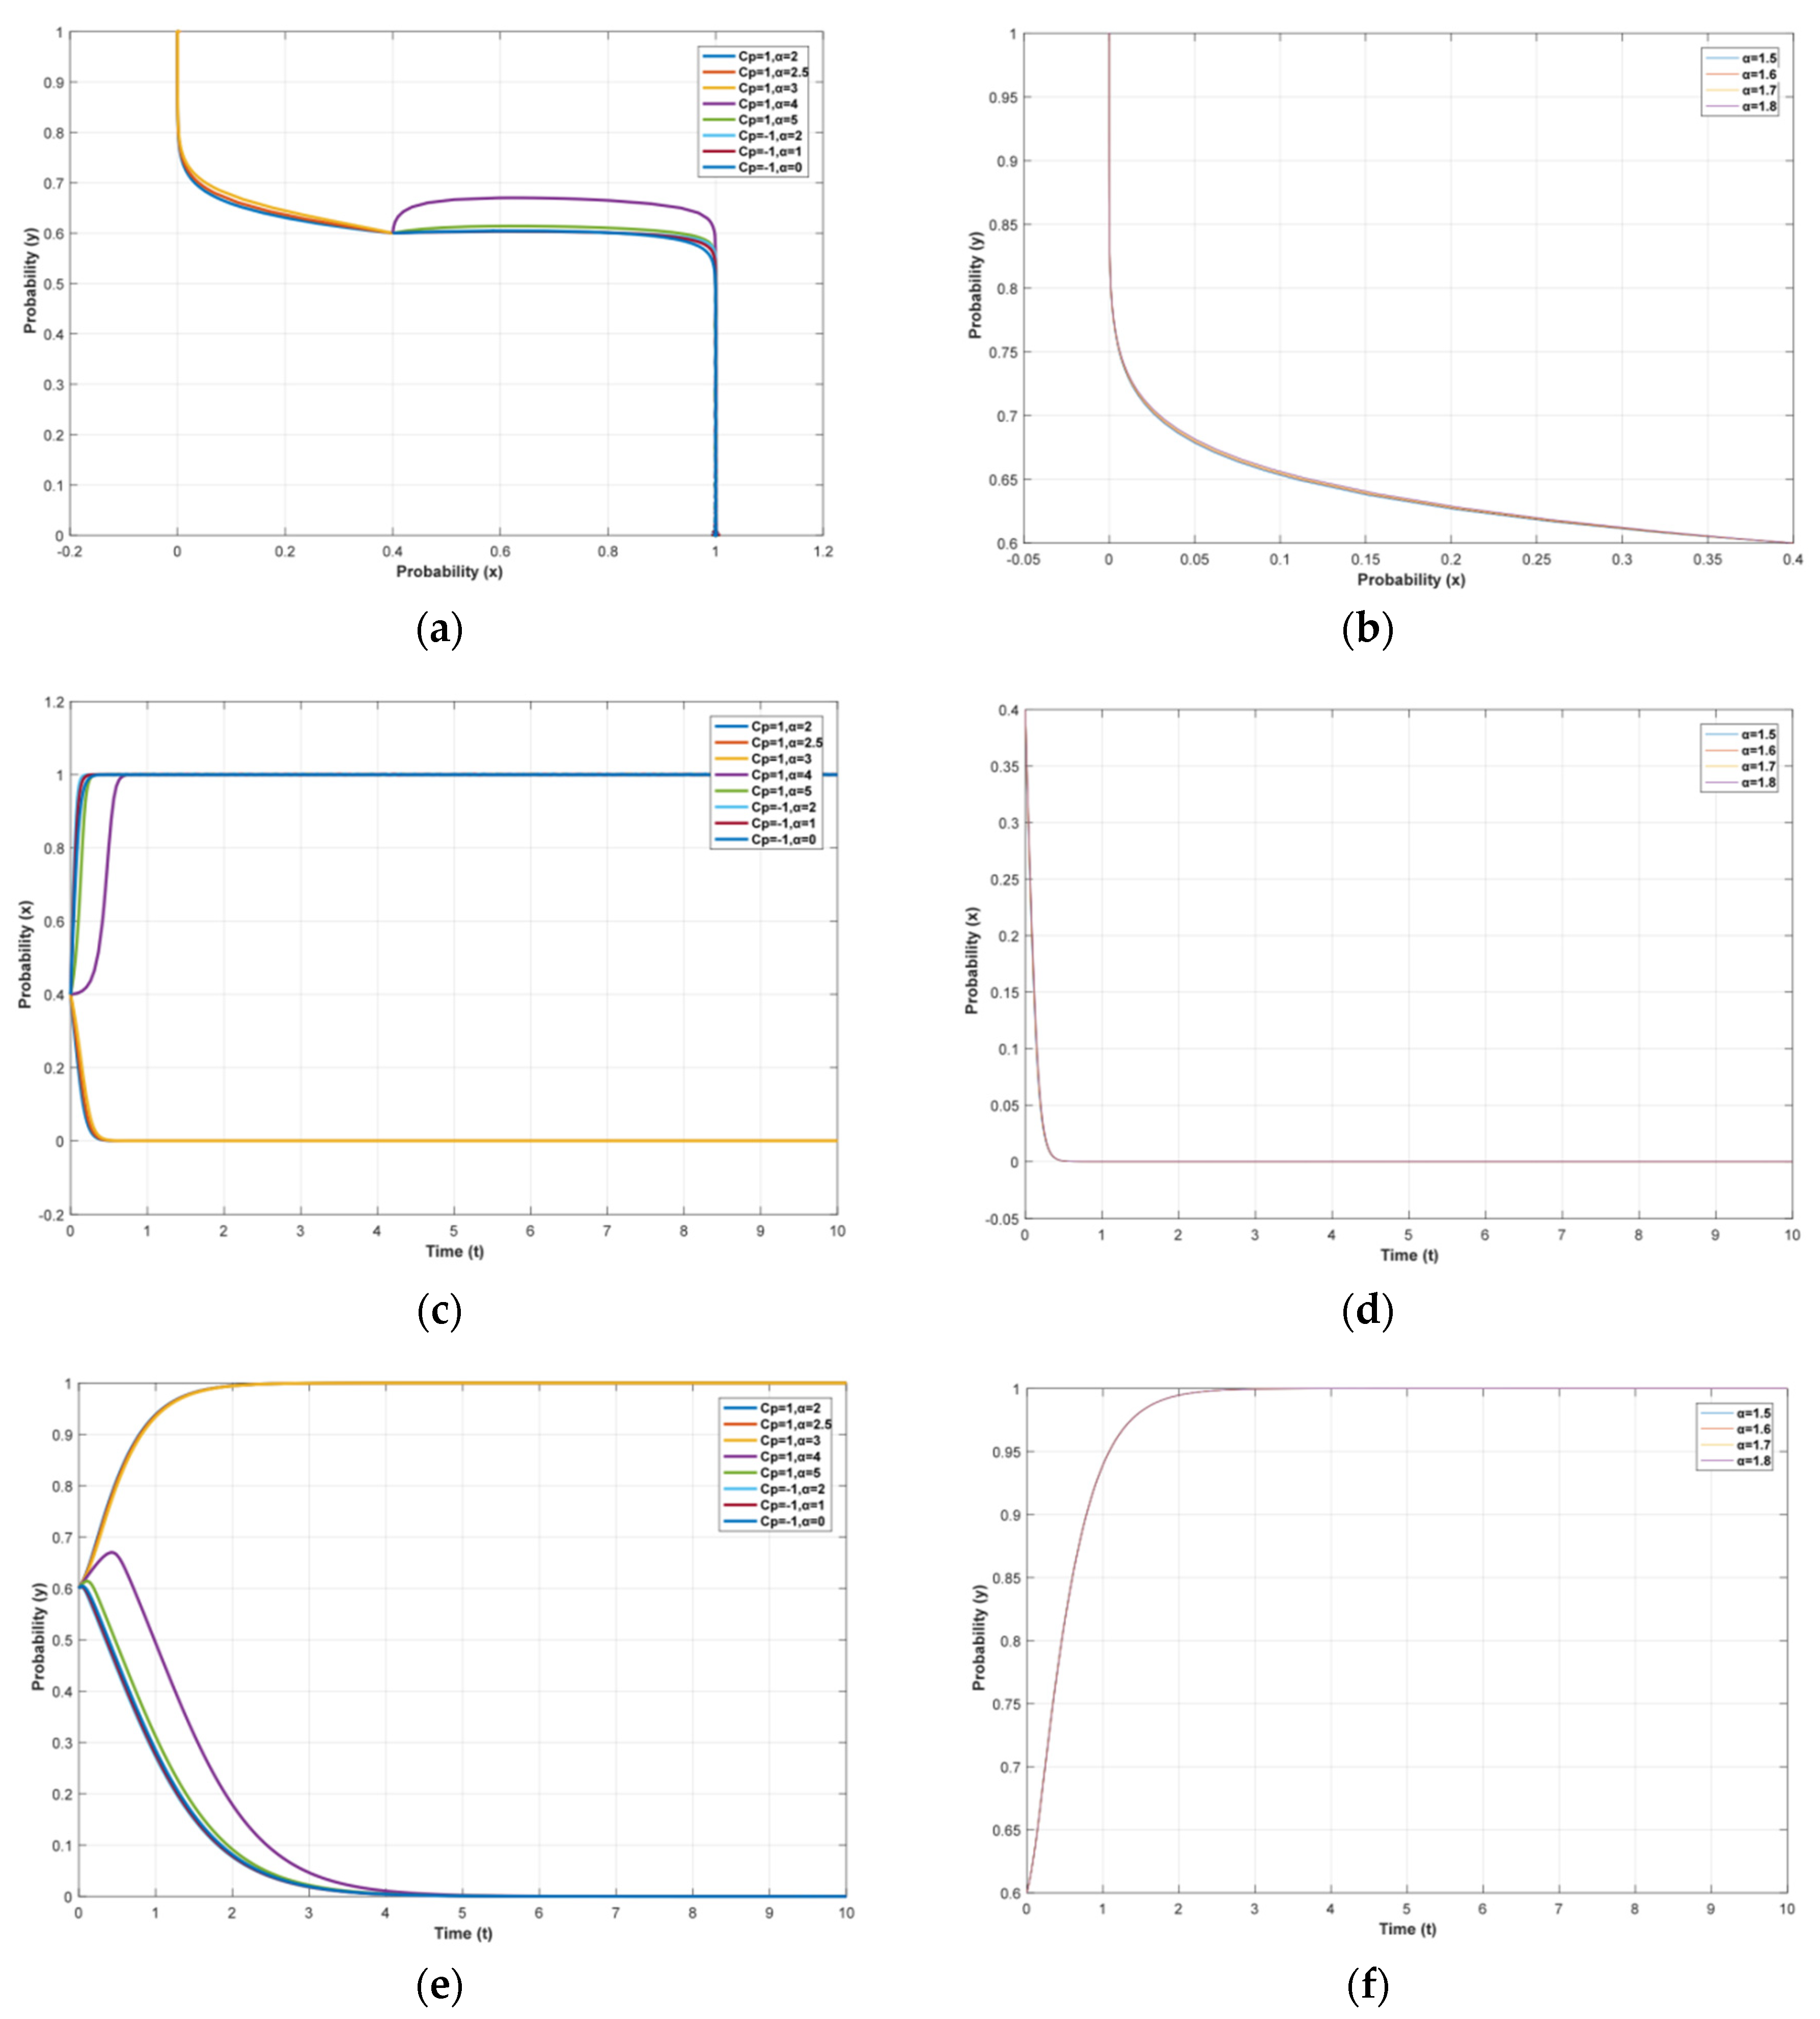
In order to compare the effects of the recycling subsidy coefficients on the behavioral decisions of local governments and bike-sharing enterprises under different subsidy policies, the initial parameters are set as {CP = 1; θ = αx = 2x, 2.5x, 3x, 4x, 5x}, {CP = −1; θ = αx = 2x, x, 0}, and {CP = 1; θ = αx = 1.5x, 1.6x, 1.7x, 1.8x}, so that the initial states of the replicated dynamic system are the same as (2) of Section 5.1.1 and (2) of Section 5.1.2, respectively. As shown in Figure 12, there are two potential stabilization points (E(0,1) and E(1,0)) in the nonlinear dynamic system, which is consistent with the corollary that can be obtained in Table A3 (i.e., Sign(det(J3) > 0 and Sign(tr(J3) < 0). Comparisons between Figure 6a and Figure 12a and between Figure 9a and Figure 12b show the following: when the CP is positive, the local government increase in the recycling subsidy base (α) can induce a faster evolutionary process (i.e., faster EPR system promotion); when the CP is negative, the local government increase in the recycling subsidy coefficient can slow down the rate of evolution and maintain the promotion speed of the EPR system to a certain extent. However, there is also a marginal decreasing effect of the recycling subsidy base (α) on the evolutionary trajectory, as shown in Figure 12c–f.
In addition, the change in recycling subsidy policy not only induces a change in the stability point of the replicated dynamic system, but also changes the sensitivity of the replicated dynamic system to the recycling subsidy coefficient (α). By observing Figure 9a and Figure 12b, as compared with the fixed recycling subsidy policy, the sensitivity of the replicated dynamic system to the recycling subsidy base (α) decreases substantially under the combined effect of the diminishing marginal benefit and the change in the recycling subsidy policy. Therefore, local governments need to choose appropriate management policies in the process of regulating the market. Moreover, in order to promote EPR, local governments need to improve the local business environment as much as possible and rationalize the planning of public areas in streets, and in other ways, and bike-sharing companies need to improve their service quality to meet the needs of local residents.
(3)
Effects of resident satisfaction
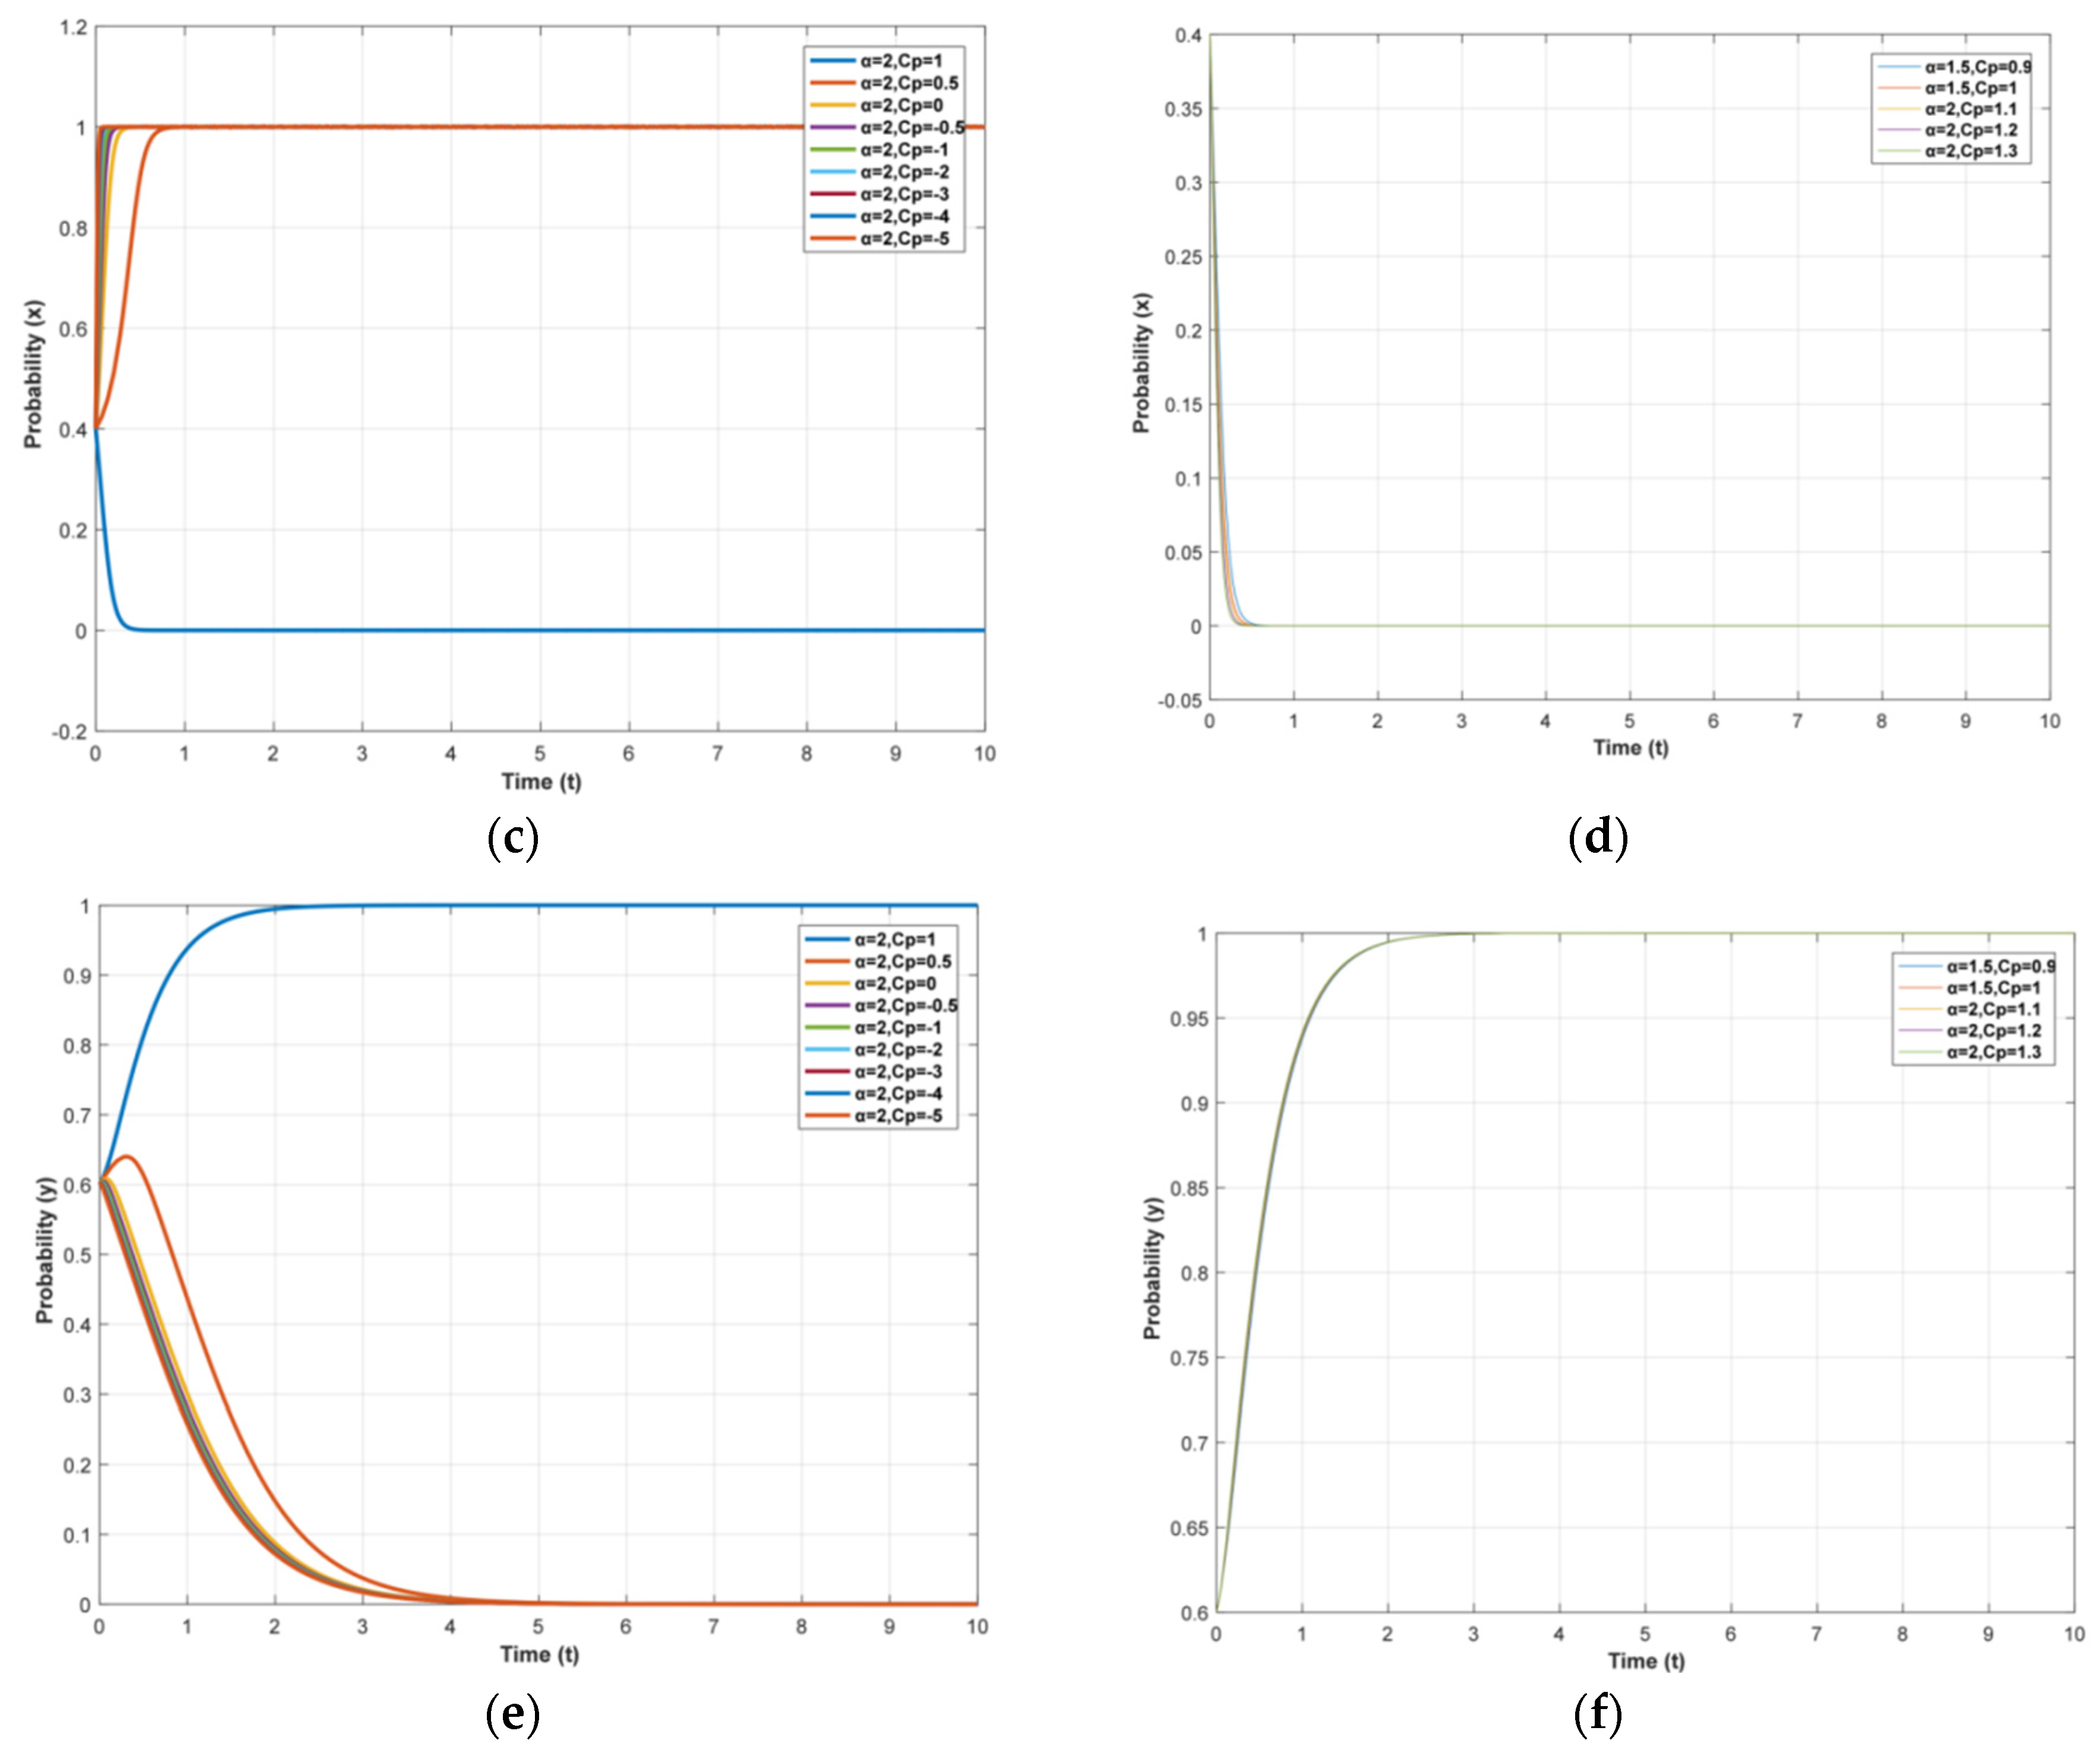
To compare the effects of different recycling subsidy policies on the behavioral strategies of local governments and bike-sharing companies while analyzing the sensitivity of the resident satisfaction, the initial states of the replicated dynamic system are made the same as in (3) of Section 5.1.1 and (3) of Section 5.1.2, respectively (i.e., {θ = αx = 2x, CP = 5, −4, −3, −2, −1, −0.5, 0, 0.5, 1} and {θ = αx = 1.5x, CP = 0.9, 1}, {θ = αx = 2x, CP = 1.1, 1.2, 1.3}). From Figure 7a and Figure 13a, it can be seen that, while the marginal decreasing phenomenon still exists, a threshold effect appears in the replication dynamic system due to the change in recycling subsidy policy, and the stable point of the system will change when the resident satisfaction (Cp) exceeds the threshold. Therefore, local governments need to set the recycling subsidy coefficient rationally based on the satisfaction of local residents for the purpose of promoting the EPR system.
The implementation of the regressive recycling subsidy policy changes the evolutionary trajectory of the closed loop in Figure 10a, which contributes to the promotion of the EPR system (see Figure 13b). From Figure 13d,f, it can be seen that the change in the recycling subsidy coefficient (α) has no significant effect on the behavioral strategies of bike-sharing companies, while it has a more significant effect on the behavioral strategies of local governments, which once again emphasizes the impact of the rationality of the recycling subsidy coefficient on the promotion rate of the EPR system.

6. Conclusions and Management Implications

Local government financial incentives for bike-sharing companies have been the focus of debates among regulators, the bike-sharing industry, and academic researchers. In previous studies, the traditional game theory does not consider the reaction time in the equilibrium realization process and the stability of the equilibrium point. Moreover, the related work does not consider either the satisfaction of local residents or the influence of local government financial subsidies on stakeholders’ behavioral strategies. This paper uses the evolutionary game theory of dual groups as an analytical tool, combined with the empirical analysis of cases and sensitivity analysis, to study the dynamic evolution of the strategies of local government groups and groups of bike-sharing companies against the background of two policies: the environmental protection tax and extended producer responsibility system. This study can assess stakeholders’ reactions in advance in the process of the government promotion of the EPR system as a way to provide scientific and insightful suggestions for both parties.
The main conclusions are as follows:
(1)
When the resident satisfaction is positive, local governments can induce an acceleration of the evolutionary process by increasing the amount of the recycling subsidy. When the resident satisfaction is negative, the impact of the recycling subsidy amount on the evolutionary trajectory decreases. This implies that excessive subsidies will have diminishing marginal effects, which will lead to the inefficient and inflexible use of financial resources. In addition, a threshold effect emerges within the replication dynamic system when a regressive recovery subsidy policy is adopted. When the resident satisfaction exceeds a certain threshold, it will directly lead to a change in the stability point of this system;
(2)
The regressive recycling subsidy policy can effectively achieve the nationwide replication of the EPR system. The change in the recycling subsidy policy leads to a fundamental change in the evolutionary trajectory of the replication dynamic system. Under certain conditions, local governments can induce a replication dynamical system without a stability point to transform it into a replication dynamical system with a stability point, and that stability point is E(0,1) (i.e., all local governments implement the EPR system);
(3)
Proactive regulation to ensure a high level of resident satisfaction is the basis for local governments to further develop recycling subsidy policies and promote EPR systems. With effective regulation, local governments can effectively promote the EPR system by implementing a regressive recycling subsidy policy, strengthen the environmental responsibility of enterprises, and avoid the “free-rider phenomenon”. In addition, local governments need to control the amount of the recycling subsidy according to local conditions. This is because excessive recycling subsidies may inadvertently not only fail to use financial resources effectively, but also curb the promotion of the EPR system (see Figure 12a).
Based on the above conclusions, we came up with the following management insights:
(1)
From the perspective of improving the local environment: Local governments need to take a series of remedial measures to directly correct the current chaos in the bike-sharing industry, such as the huge fines, mandatory recycling, credit records, and reductions in bike size. Moreover, they should plan unified bike-sharing parking spaces, establish a bike-sharing supervision platform, reasonably allocate bike parking lots, and build a long-term supervision mechanism;
(2)
From the perspective of setting the recycling subsidy amount: The incentive effect of increasing the amount of recycling subsidies has a marginal decreasing phenomenon, and it is not the case that the higher the amount of recycling subsidies, the better. Therefore, local governments need to set a reasonable amount for recycling subsidies on the basis of the local environment in order to avoid the waste of financial resources;
(3)
From the perspective of formulating recycling subsidy policy: The recycling subsidy policy that is negatively related to the promotion of the EPR system is counterintuitive. However, by adopting a regressive recycling subsidy policy, setting reasonable recycling subsidy coefficients, and with effective regulation, it can improve the utilization of financial funds and achieve the green and sustainable development of the bike-sharing industry.
This paper considers the effects of recycling subsidy policies and resident satisfaction on the decisions of local governments and bike-sharing companies, which is a degree of improvement compared with previous studies. However, this paper is still incomplete in considering the effects of a range of behaviors of residents and recycling suppliers. First, we consider the impact of the local resident satisfaction on stakeholders’ behavioral decisions. Although we consider bike-sharing rental income in this paper, in practice, the price of bike-sharing rentals may have an impact on customer satisfaction. The measurement of the local resident satisfaction still requires as reasonable a method as possible for evaluation, such as the preference-based fuzzy evaluation method study we have conducted [63]. Therefore, in the next step, we will conduct a more in-depth study based on the fuzzy evaluation method based on resident satisfaction.
Although the factors considered in the model-based study may be slightly different from the specific situation of each locality and the study has some limitations, this may provide avenues for future research. For studies involving the sustainable green development of the bike-sharing industry, we believe that modeling the interactive behaviors of the key stakeholders in the bike-sharing supply chain to address the problem, such as local governments, bike-sharing companies, residents, and recycling suppliers, is a feasible and promising research direction.

Author Contributions

Conceptualization, Z.L.; Methodology, Z.L.; Validation, Y.Y.; Investigation, B.S. and X.L.; Resources, L.L.; Writing—original draft, Z.L.; Writing—review & editing, Y.Y.; Visualization, Z.L.; Supervision, L.L.; Project administration, L.L. All authors have read and agreed to the published version of the manuscript.

Funding

This research was supported by the Major Project for National Natural Science Foundation of China (No. 71991465), National Key R&D Program of China (No. 2021YFC3300603), “Smart Society Big Data Intelligence Research Center” Key Research Base of Philosophy and Social Science in Hunan Province, Changsha Artificial Intelligence Social Laboratory.

Institutional Review Board Statement

Not applicable.

Informed Consent Statement

Not applicable.

Data Availability Statement

Data sharing not applicable.

Conflicts of Interest

The authors declare no conflict of interest.

Appendix A

Table A1. ESS analysis of both players based on case 2 and case 4.
PointSign(det(J1))Sign(tr(J1))Result
(0,0)+UncertainInstability point
(0,1)-UncertainSaddle point
(1,0)+-Stability point
(1,1)++Instability point
( x 1 * , y 1 * ) -0Saddle point

Appendix B

Table A2. ESS analysis of both players based on case 2 and case 5.
PointSign(det(J2))Sign(tr(J2))Result
(0,0)-UncertainSaddle point
(0,1)-UncertainSaddle point
(1,0)-UncertainSaddle point
(1,1)-UncertainSaddle point
( x 2 * , y 2 * ) +0Central point
Proof of Proposition 2.
The Jacobian matrix of the central point ( x 2 * , y 2 * ) in this replicated dynamic system is as follows:
J 2 = 0 ( C E 2 C E 1 ) ( C E 2 C E 1 C E 3 ) / C E 3 ( η δ C P θ ε ) ( η δ C P θ ε C E 3 ) / C E 3 0 .
where (ηδCPθε)(ηδCPθεCE3)/CE3 < 0, −(CE2 − CE1)(CE2CE1CE3) > 0.
Moreover, we can obtain the eigenvalues of the Jacobian matrix J 2 :
λ 1 , 2 = ± i   | ( η δ C P θ ε ) ( η δ C P θ ε C E 3 ) ( C E 2 C E 1 ) ( C E 2 C E 1 C E 3 ) |   C E 3 2 = ± i ( η δ C P θ ε ) ( η δ C P θ ε C E 3 ) ( C E 2 C E 1 ) ( C E 2 C E 1 C E 3 ) C E 3
According to the Routh–Hurwitz stability criterion, the centroid (x*,y*) of the replicated dynamical system is not an asymptotically evolving stable strategy because the eigenvalues of J 2 are imaginary roots. That is, the system’s system of differential equations is stable in the limit ring, but not asymptotically stable. In this paper, we refer to the literature [64] to explain the periodic fluctuations in replicated dynamical systems, and we study the stability of the fixed points in the above differential equations using Lyapunov’s first method. The trajectory of the replicated dynamical model at the point of hybrid equilibrium is as follows:
x = x * + x ( 0 ) cos ω t y ( 0 ) sin ω t y = y * + x ( 0 ) sin ω t + y ( 0 ) cos ω t
x(0), y(0) are the time-varying states (x(t), y(t)) in the system at t = 0. Moreover, we assume that the initial probabilities of x,y are x0 and y0, x0 = x(0) + x*, and y0 = y(0) + y*.
The above trajectory is expressed as follows:
x = x * + A cos ( ω t + φ ) y = y * + A sin ( ω t + φ )
The amplitude of this trajectory is expressed as follows:
A = ( x 0 x * ) 2 + ( y 0 y * ) 2
The angular frequency of this trajectory is expressed as follows:
ω = ( η δ C P θ ε ) ( η δ C P θ ε C E 3 ) ( C E 2 C E 1 ) ( C E 2 C E 1 C E 3 ) / C E 3
The phase angle of this trajectory is expressed as follows:
φ = arctan ( y 0 y * ) / ( x 0 x * ) i f ( y 0 y * ) / ( x 0 x * ) > 0 π + arctan ( y 0 y * ) / ( x 0 x * ) i f ( y 0 y * ) / ( x 0 x * ) 0  
Therefore, the hybrid strategy trajectory of the replicated dynamic system is a closed-loop curve around ( x 2 * , y 2 * ) . If the initial point ( x 0 , y 0 ) is close to the equilibrium point ( x 2 * , y 2 * ) , then the strategy trajectory is a circular orbit, which can be expressed as follows:
( x x * ) 2 + ( y y * ) 2 = A 2

Appendix C

Table A3. Signs of determinant and trace for Jacobian matrix.
PointSign(det(J3))Sign(tr(J3))
(0,0) C P | C P | C E 2 C E 1 η δ C P | C E 2 C E 1 η δ C P |
(0,1) ( C E 3 η δ C P ) | C E 3 η δ C P | C E 3 η δ C P ( C E 2 C E 1 ) | C E 3 η δ C P ( C E 2 C E 1 ) |
(1,0) ( η δ C P α ε ) | η δ C P α ε | η δ C P α ε + C E 2 C E 1 C E 3 | η δ C P α ε + C E 2 C E 1 C E 3 |
(1,1) ( η δ C P α ε C E 3 ) | η δ C P α ε C E 3 | ( η δ C P α ε C E 3 ) ( C E 2 C E 1 C E 3 ) | ( η δ C P α ε C E 3 ) ( C E 2 C E 1 C E 3 ) |
(x*,y*) ( η δ C P α ε x 3 * ) ( C E 3 η δ C P α ε x 3 * ) | ( η δ C P α ε x 3 * ) ( C E 3 η δ C P α ε x 3 * ) | +

References

  1. Bullock, C.; Brereton, F.; Bailey, S. The economic contribution of public bike-share to the sustainability and efficient functioning of cities. Sustain. Cities Soc. 2017, 28, 76–87. [Google Scholar] [CrossRef]
  2. Jca, B.; Dan, Z.; Yue, Z.C.; Bw, D.; Tian, W.E. Life cycle carbon dioxide emissions of bike sharing in china: Production, operation, and recycling. Resour. Conserv. Recycl. 2020, 162, 105011. [Google Scholar]
  3. Li, T.Z.; Qian, F.; Su, C. Energy consumption and emission of pollutants from electric bicycles. In Advances in Transportation, Pts 1 and 2; Bao, T., Ed.; Trans Tech Publications Ltd.: Stafa-Zurich, Switzerland, 2014; pp. 327–333. [Google Scholar]
  4. Xinhua. Beijing Launched a Special Action to Share Bicycles, Focusing on the Treatment of the Problem of Concentrated Areas. Available online: https://baijiahao.baidu.com/s?id=1633465777724622982&wfr=spider&for=pc (accessed on 15 May 2019).
  5. Hunan Daily. Changsha Cleanup and Recycling of Unlicensed Electric Bike Is Effective, but Chaos still Exists with the Bike. Available online: https://hunan.voc.com.cn/article/202011/202011250909068038.html (accessed on 25 November 2020).
  6. The State Council of China. 2021 Government Work Report. Available online: http://www.gov.cn/guowuyuan/zfgzbg.htm (accessed on 5 March 2021).
  7. The State Council of China. Extended Producer Responsibility System Implementation Program. Available online: http://www.gov.cn/xinwen/2017-01/03/content_5156100.htm (accessed on 25 December 2016).
  8. The People’s Government of Sichuan Province. Sichuan Province to Promote the Extended Producer Responsibility System. Available online: https://www.sc.gov.cn/10462/11555/11563/2017/9/14/10433675.shtml?cid=303 (accessed on 6 September 2017).
  9. Hainan Development and Reform Commission. Hainan Province to Implement the Extended Producer Responsibility System Implementation Plan. Available online: http://plan.hainan.gov.cn/sfgw/0503/202008/a6fc525965f8448d8d3045f754152d28/files/e62803b50d4f443aa6e4aaff01fda629.doc (accessed on 12 August 2020).
  10. Rubio, S.; Ramos, T.R.P.; Leitão, M.M.R.; Barbosa-Povoa, A.P. Effectiveness of extended producer responsibility policies implementation: The case of Portuguese and Spanish packaging waste systems. J. Clean. Prod. 2019, 210, 217–230. [Google Scholar] [CrossRef]
  11. Thomas, L.; Reid, L. What’s in a Name: Producer or Product Responsibility? J. Ind. Ecol. 1997, 1, 6–7. [Google Scholar]
  12. Lai, X.; Sun, Z.; Liu, J.; Wu, G. Resource recycle efficiency improvement analysis for sharing bicycles: Value chain perspective. J. Clean. Prod. 2020, 255, 120284. [Google Scholar] [CrossRef]
  13. Ren, X.; Herty, M.; Zhao, L. Optimal price and service decisions forsharing platform and coordination between manufacturer and platform with recycling. Comput. Ind. Eng. 2020, 147, 106586. [Google Scholar] [CrossRef]
  14. Chiariotti, F.; Pielli, C.; Zanella, A.; Zorzi, M. A Bike-sharing Optimization Framework Combining Dynamic Rebalancing and User Incentives. ACM Trans. Auton. Adapt. Syst. 2020, 14, 11. [Google Scholar] [CrossRef] [Green Version]
  15. Shan, H.; Yang, J. Promoting the implementation of extended producer responsibility systems in china: A behavioral game perspective. J. Clean. Prod. 2019, 250, 119446. [Google Scholar] [CrossRef]
  16. Zhang, W.; Wang, Z.; Yuan, H.; Xu, P. Investigating the inferior manufacturer’s cooperation with a third party under the energy performance contracting mechanism. J. Clean. Prod. 2020, 272, 122530. [Google Scholar] [CrossRef]
  17. Wang, L.; Zhao, N.; Liu, D. Complex disaster management: A dynamic game among the government, enterprises, and residents. J. Clean. Prod. 2020, 266, 122091. [Google Scholar] [CrossRef]
  18. Wang, Z.; Zheng, L.; Zhao, T.; Tian, J. Mitigation strategies foroveruse of chinese bikesharing systems based on game theory analyses of three generations worldwide. J. Clean. Prod. 2019, 227, 447–456. [Google Scholar] [CrossRef]
  19. Yu, M.; Li, Q.; Wu, Z. Multi-player Game Model and Mixed Strategy Analysis in Sharing System. In Proceedings of the 2019 IEEE Symposium on Product Compliance Engineering—Asia (ISPCE-CN), Hong Kong, China, 23–26 October 2019. [Google Scholar]
  20. Zhang, L.; Long, R.; Huang, Z.; Li, W.; Wei, J. Evolutionary game analysis on the implementation of subsidy policy for sustainable transportation dev-elopment. J. Clean. Prod. 2020, 267, 122159. [Google Scholar] [CrossRef]
  21. Wang, Z.; Huo, J.; Duan, Y. The impact of government incentives and penalties on willingness to recycle plastic waste: An evolutionary game theory perspective. Front. Environ. Sci. Eng. 2020, 14, 29. [Google Scholar] [CrossRef]
  22. Cui, H.; Wang, R.; Wang, H. An evolutionary analysis of green finance sustainability based on multi-agent game. J. Clean. Prod. 2020, 269, 121799. [Google Scholar] [CrossRef]
  23. Ma, L.; Zhang, L. Evolutionary game analysis of construction waste re-cycling management in china. Resour. Conserv. Recycl. 2020, 161, 104863. [Google Scholar] [CrossRef]
  24. Ji, S.F.; Zhao, D.; Luo, R.J. Evolutionary game analysis on local governments and manufacturers’ behavioral strategies: Impact of phasing out subsidies for new energy vehicles. Energy 2019, 189, 116064. [Google Scholar] [CrossRef]
  25. Wang, X.; He, Q.L.; Ji, Q. Evolutionary dynamics of consumers’ crowdfunding strategies based on replicator dynamics. Syst. Eng. Eory Pract. 2017, 37, 2812–2820. [Google Scholar]
  26. Cui, R.Y.; Hultman, N.; Cui, D.; Mcjeon, H.; Zhu, M. A plant-by-plant strategy for high-ambition coal power phaseout in china. Nat. Commun. 2021, 12, 1468. [Google Scholar] [CrossRef] [PubMed]
  27. Weibull, J.W. Evolutionary Game Theory (Paper); MIT Press: Cambridge, MA, USA, 2009; Available online: https://econpapers.repec.org/bookchap/mtptitles/0262731215.htm (accessed on 12 November 2022).
  28. Zhang, Y.; Mi, Z. Environmental benefits of bike sharing: A big data-based analysis. Appl. Energy 2018, 220, 296–301. [Google Scholar] [CrossRef]
  29. Cheng, B.; Li, J.; Su, H.; Lu, K.; Chen, H.; Huang, J. Life cycle assessment of greenhouse gas emission reduction through bike-sharing for sustainable cities. Sustain. Energy Technol. Assess. 2022, 53, 102789. [Google Scholar] [CrossRef]
  30. Zhu, M.; Hu, X.; Lin, Z.; Li, J.; Wang, C. Intention to adopt bicycle-sharing in China: Introducing environmental concern into the theory of planned behavior model. Environ. Sci. Pollut. Res. 2020, 27, 41740–41750. [Google Scholar] [CrossRef] [PubMed]
  31. Chen, Y.; Sun, X.; Deveci, M.; Coffman, D.M. The impact of the COVID-19 pandemic on the behaviour of bike sharing users. Sustain. Cities Soc. 2022, 84, 104003. [Google Scholar] [CrossRef]
  32. Belk, R.W.; Eckhardt, G.M.; Bardhi, F. (Eds.) Handbook of the Sharing Economy; Edward Elgar Publishing: Cheltenham, UK, 2019. [Google Scholar]
  33. Cheng, X.; Long, R.; Chen, H.; Yang, J. Does social interaction have an impact on residents’ sustainable lifestyle decisions? A multi-agent stimulation based on regret and game theory. Appl. Energy 2019, 251, 113366. [Google Scholar] [CrossRef]
  34. Si, H.; Su, Y.; Wu, G.; Liu, B.; Zhao, X. Understanding bike-sharing users’ willingness to participate in repairing damaged bicycles: Evidence from china. Transp. Res. Part A Policy Pract. 2020, 141, 203–220. [Google Scholar] [CrossRef]
  35. Ye, X. Bike-Sharing Adoption in Cross-National Contexts: An Empirical Research on the Factors Affecting Users’ Intentions. Sustainability 2022, 14, 3208. [Google Scholar] [CrossRef]
  36. Kavurmacioglu, E.; Alanyali, M.; Starobinski, D. Competition in private commons: Price war or market sharing? IEEE/ACM Trans. Netw. 2016, 24, 29–42. [Google Scholar] [CrossRef] [Green Version]
  37. Meng, Q.; Chu, L.; Li, Z.; Chen, J.; Wu, C. Cooperation performance of multi-organisations operating in a sharing economy: Game theory with agent-based modelling. Int. J. Prod. Res. 2019, 48, 1–14. [Google Scholar] [CrossRef]
  38. Jiang, Z.; Lei, C.; Ouyang, Y.; Mannering, F. Optimal investment and management of shared bikes in a competitive market. Transp. Res. Part B Methodol. 2020, 135, 143–155. [Google Scholar] [CrossRef]
  39. Wang, Y.; Sun, S. Does large scale free-floating bike sharing really improve the sustainability of urban transportation? Empirical evidence from Beijing. Sustain. Cities Soc. 2022, 76, 103533. [Google Scholar] [CrossRef]
  40. Federico, C.; Chiara, P.; Andrea, Z.; Michele, Z. A dynamic approach to rebalancing bike-sharing systems. Sensors 2018, 18, 512. [Google Scholar]
  41. Hotelling, H. The economics of exhaustible resources. Bull. Math. Biol. 1931, 53, 281–312. [Google Scholar] [CrossRef]
  42. Björnerstedt, J.; Weibull, J.W. Nash Equilibrium and Evolution by Imitation (No. 407); IUI Working Paper; 1994; Available online: https://econpapers.repec.org/paper/hhsiuiwop/0407.htm (accessed on 12 November 2022).
  43. Dufwenberg, M.; Guth, W. Indirect evolution vs. strategic delegation:a c-omparison of two approaches to explaining economic institutions. Eur. J. Political Econ. 1999, 15, 281–295. [Google Scholar] [CrossRef]
  44. Huck, S.; Oechssler, J. The indirect evolutionary approach to explaining fair allocations. Games Econ. Behav. 1999, 28, 13–24. [Google Scholar] [CrossRef] [Green Version]
  45. Quijano, N.; Ocampo-Martinez, C.; Barreiro-Gomez, J.; Obando, G.; Pantoja, A.; Mojica-Nava, E. The role of population games and evolutionary dynamics in distributed control systems: The advantages of evolutionary game theory. IEEE Control Syst. 2017, 37, 70–97. [Google Scholar]
  46. Hotelling, H. Stability in Competition. In The Collected Economics Articles of Harold Hotelling; Darnell, A.C., Ed.; Springer: New York, NY, USA, 1990. [Google Scholar]
  47. O’Hare, M. Not on my Block You Don’t: Facility siting and the strategic importance of compensation. Public Policy 1977, 25, 407–458. [Google Scholar]
  48. McCrea, R.; Shyy, T.K.; Stimson, R.J. Satisfied residents in different types of local areas: Measuring what’s most important. Soc. Indic. Res. 2014, 118, 87–101. [Google Scholar] [CrossRef]
  49. Konzelmann, S.; Fovargue-Davies, M.; Schnyder, G. The faces of liberalcapitalism: Anglo-saxon banking systems in crisis? Camb. J. Econ. 2012, 36, 495–524. [Google Scholar] [CrossRef]
  50. Amable, B. The Diversity of Modern Capitalism; Oxford Academic: Oxford, UK, 2003. [Google Scholar]
  51. Bátiz–Lazo, B.; Locke, R.R.; Müller, K. The future of rhineland capitalismacross the polish-german border. J. Manag. Hist. 2013, 14, 12–22. [Google Scholar]
  52. Report of Market Prospective and Investment Strategy Planning on China Shared Bicycle Industry (2021–2026). Available online: https://bg.qianzhan.com/report/detail/1703231703145753.html (accessed on 31 March 2021).
  53. Mouratidis, K.; Ettema, D.; Nss, P. Urban form, travel behavior, and travel satisfaction. Transp. Res. Part A Policy Pract. 2019, 129, 306–320. [Google Scholar] [CrossRef]
  54. National Development and Reform Commission. Opinions on Further Strengthening the Management of Plastic Pollution. Available online: https://www.ndrc.gov.cn/xxgk/zcfb/tz/202001/t20200119_1219275.html (accessed on 3 January 2017).
  55. Zhou, W.; Zheng, Y.; Huang, W. Competitive advantage of qualified weee recyclers through epr legislation. Eur. J. Oper. Res. 2017, 257, 641–655. [Google Scholar] [CrossRef]
  56. Mao, M.; Bao, Z.; Tang, Y.; Qin, H.; Ai, M. Recycling and repair strategies of fault sharing bicycles. Comput. Integr. Manuf. Syst. 2022, 28, 3967. (In Chinese) [Google Scholar]
  57. Si, H.; Shi, J.; Wu, G.; Wang, H. The evolution of Multi-agent Game in Recycling of Waste Bike Sharing. J. Beijing Inst. Technol. 2020, 22, 13. (In Chinese) [Google Scholar] [CrossRef]
  58. Beijing Municipal Commission of Transport. Technical and Service Specifications for Bike Sharing Systems. Available online: http://jtw.beijing.gov.cn/xxgk/tzgg/201709/t20170921_1279546.html (accessed on 19 September 2017).
  59. Beijing Municipal Commission of Transport. On the Internet Rental Bicycle Industry in the First Quarter of 2020 Operation and Management Supervision. Available online: http://jtw.beijing.gov.cn/xxgk/tzgg/202005/t20200527_1909462.html (accessed on 27 May 2020).
  60. Beijing Municipal Commission of Transport. About the Internet Rental Bicycle Industry in 2020 Operation Regulation and 2021 Vehicle Launch Scale. Available online: http://jtw.beijing.gov.cn/xxgk/tzgg/202104/t20210413_2354015.html (accessed on 13 April 2021).
  61. Beijing Municipal Commission of Transport. Transportation Administrative Penalties List. Available online: http://jtw.beijing.gov.cn/xxgk/tzgg/201709/t20170920_1279545.html (accessed on 20 September 2017).
  62. Mao, G.; Hou, T.; Liu, X.; Zuo, J.; Sandhu, S. How can bicycle-sharing have a sustainable future? a research based on life cycle assessment. J. Clean. Prod. 2020, 282, 125081. [Google Scholar] [CrossRef]
  63. Yuan, T.; Yang, Y. Sustainable e-bike sharing recycling supplier selection: An interval-valued pythagorean fuzzy magdm method based on preference information technology. J. Clean. Prod. 2020, 287, 125530. [Google Scholar]
  64. Liu, D.; Xiao, X.; Li, H.; Wang, W. Historical evolution and benefit-cost explanation of periodical fluctuation in coal mine safety supervision: An evolutionary game analysis framework. Eur. J. Oper. Res. 2015, 243, 974–984. [Google Scholar] [CrossRef]
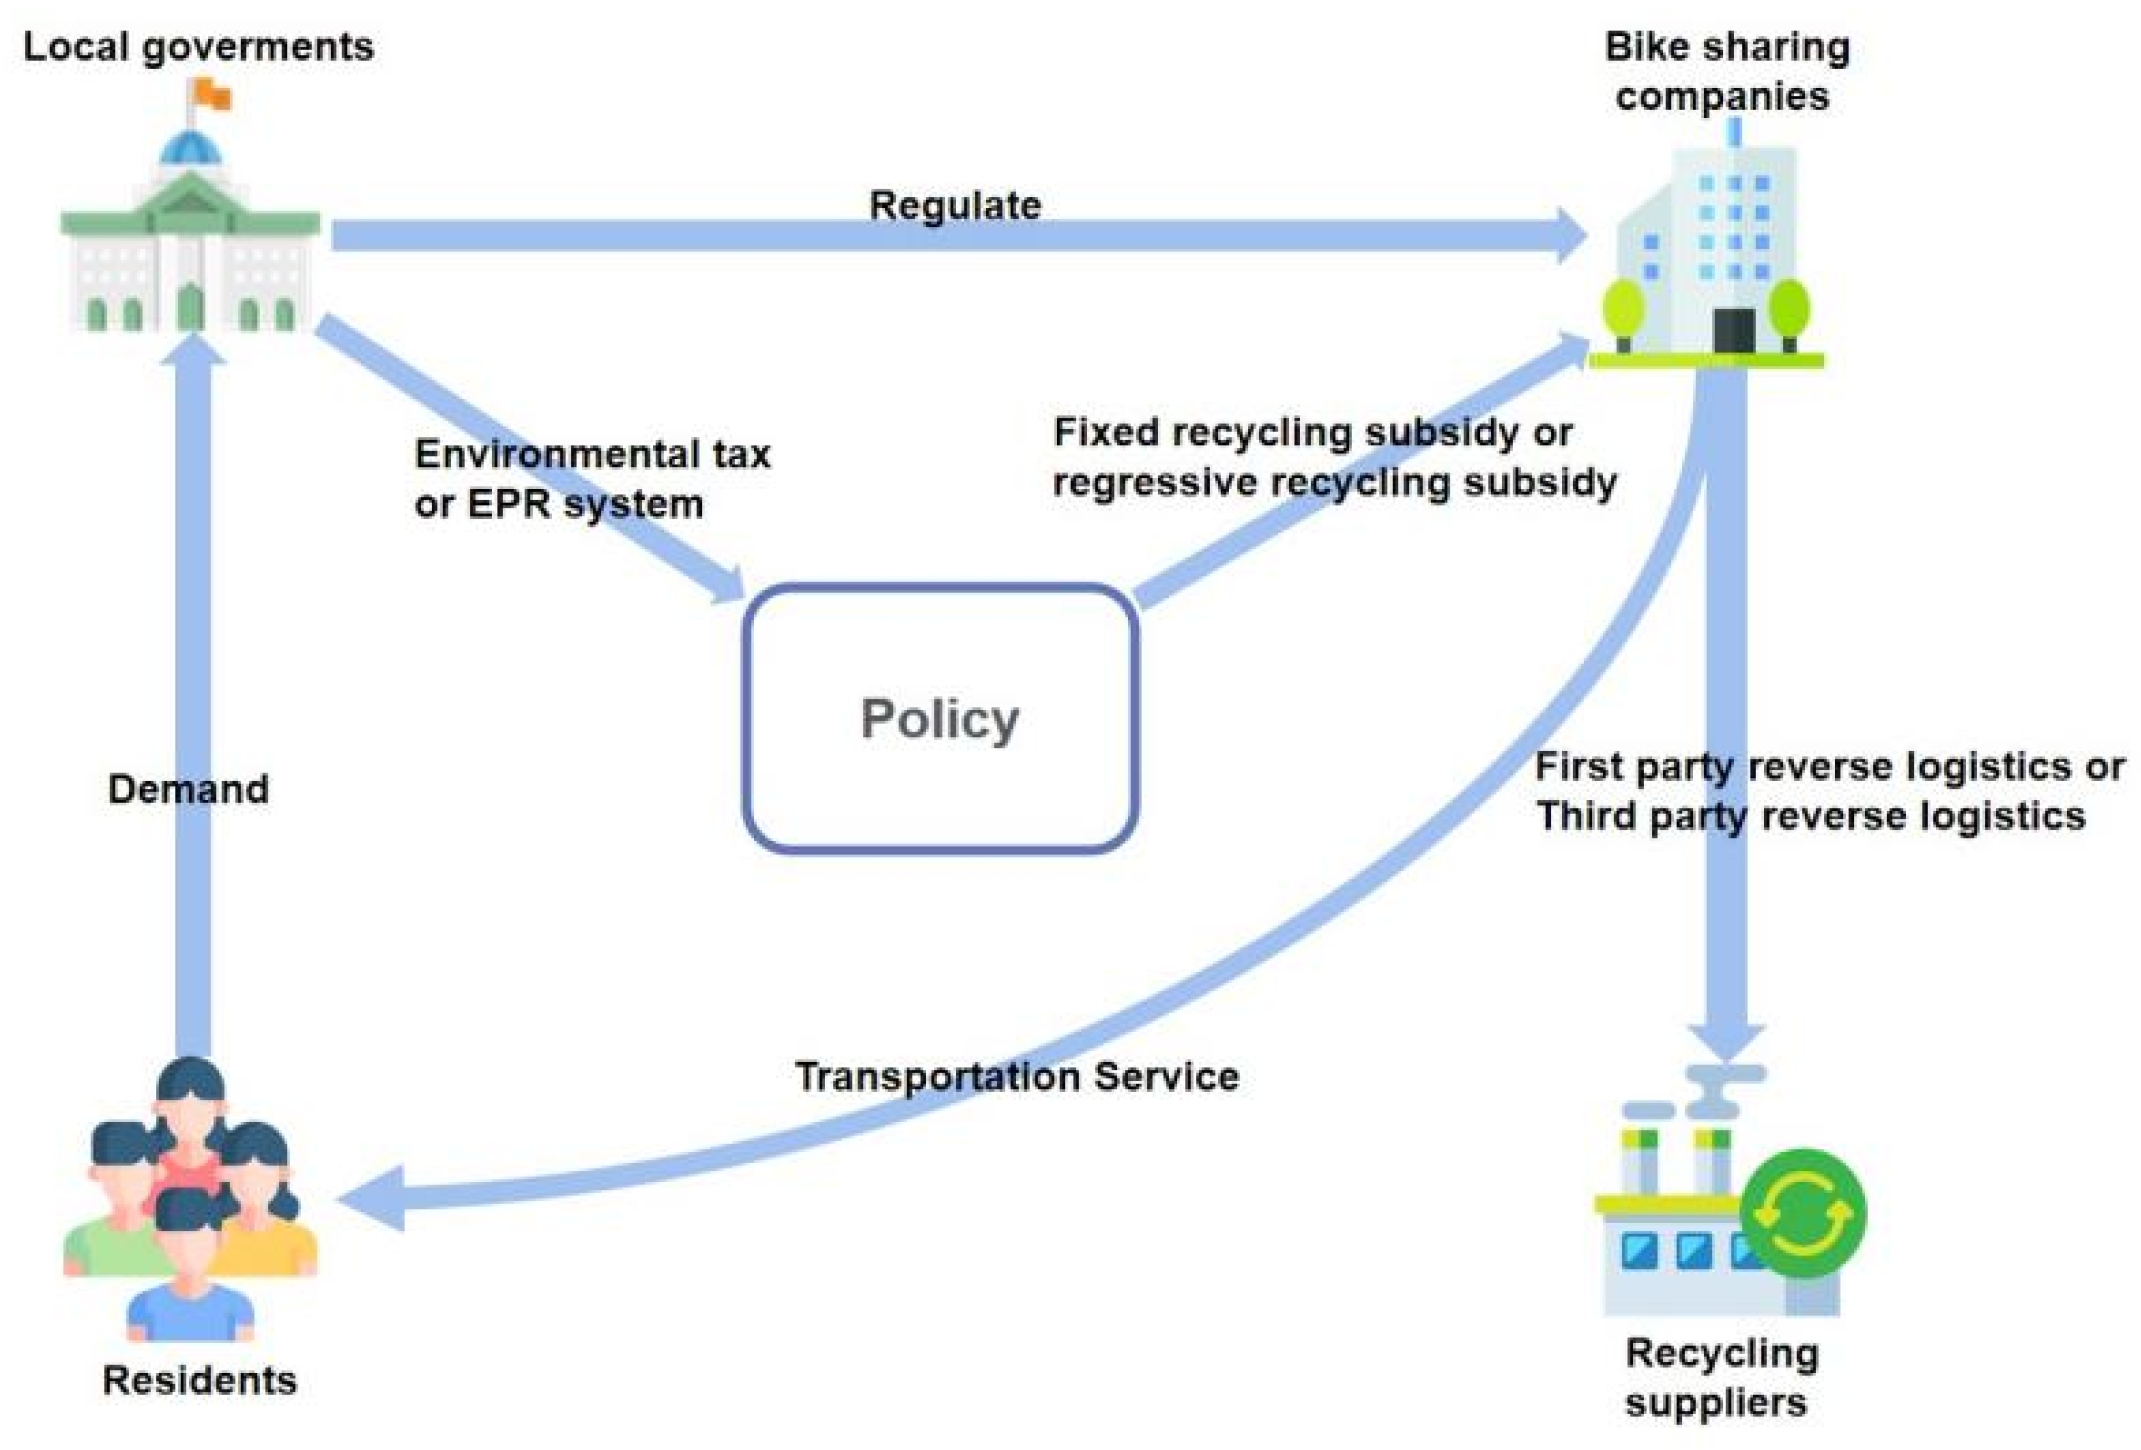
Figure 1. Interactive relationships of stakeholders.
Sustainability 15 08834 g001
Figure 2. Decision tree of local governments and bike-sharing companies.
Sustainability 15 08834 g002
Figure 3. Phase diagrams for bike-sharing companies’ strategies.
Sustainability 15 08834 g003
Figure 4. Phase diagrams for local government strategies.
Sustainability 15 08834 g004
Figure 5. The evolutionary process between local governments and bike-sharing companies under different initial strategy proportions. (a) The evolutionary trajectory; (b) The evolution of local governments; (c) The evolution of bike-sharing companies.
Sustainability 15 08834 g005
Figure 6. The evolutionary process between local governments and bike-sharing companies under different recycling subsidy amounts. (a) The evolutionary trajectory; (b) The evolution of local governments; (c) The evolution of bike-sharing companies.
Sustainability 15 08834 g006
Figure 7. The evolutionary process between local governments and bike-sharing companies under different resident satisfaction. (a) The evolutionary trajectory; (b) The evolution of local governments; (c) The evolution of bike-sharing companies.
Sustainability 15 08834 g007
Figure 8. The evolutionary process between local governments and bike-sharing companies under different initial strategy proportions. (a) The evolutionary trajectory; (b) The evolution of local governments; (c) The evolution of bike-sharing companies.
Sustainability 15 08834 g008
Figure 9. The evolutionary process between local governments and bike-sharing companies under different recycling subsidy amounts. (a) The evolutionary trajectory; (b) The evolution of local governments; (c) The evolution of bike-sharing companies.
Sustainability 15 08834 g009aSustainability 15 08834 g009b
Figure 10. The evolutionary process between local governments and bike-sharing companies under different resident satisfaction. (a) The evolutionary trajectory; (b) The evolution of local governments; (c) The evolution of bike-sharing companies.
Sustainability 15 08834 g010
Figure 11. The evolutionary process between local governments and bike-sharing companies under different initial strategy proportions. (a) The evolutionary trajectory based on Section 5.1.1; (b) The evolutionary trajectory based on Section 5.1.2; (c) The evolution of local governments based on Section 5.1.1; (d) The evolution of local governments based on Section 5.1.2; (e) The evolution of bike-sharing companies based on Section 5.1.1; (f) The evolution of bike-sharing companies based on Section 5.1.2.
Sustainability 15 08834 g011aSustainability 15 08834 g011b
Figure 12. The evolutionary process between local governments and bike-sharing companies under different recycling subsidy amounts. (a) The evolutionary trajectory based on Section 5.1.1; (b) The evolutionary trajectory based on Section 5.1.2; (c) The evolution of local governments based on Section 5.1.1; (d) The evolution of local governments based on Section 5.1.2; (e) The evolution of bike-sharing companies based on Section 5.1.1; (f) The evolution of bike-sharing companies based on Section 5.1.2.
Sustainability 15 08834 g012
Figure 13. The evolutionary process between local governments and bike-sharing companies under different resident satisfaction. (a) The evolutionary trajectory based on Section 5.1.1; (b) The evolutionary trajectory based on Section 5.1.2; (c) The evolution of local governments based on Section 5.1.1; (d) The evolution of local governments based on Section 5.1.2; (e) The evolution of bike-sharing companies based on Section 5.1.1; (f) The evolution of bike-sharing companies based on Section 5.1.2.
Sustainability 15 08834 g013aSustainability 15 08834 g013b
Table 1. Nomenclature.
Acronyms
GLocal governmentEBike-sharing companies
ETEnvironment taxEPRExtended producer responsibility
FPRLFirst-party reverse logisticsTPRLThird-party reverse logistics
xProportion implementing environmental tax strategyyProportion implementing first-party reverse logistics strategy
ESSEvolutionary stability strategy
Parameters
(a) Local government
CGLocal government regulatory costsγEnvironmental tax rate
ηCoefficient of local government performance on rewards and punishments of bike-sharing companiesTPolitical performance of local government from resident satisfaction: T = δCP
θRecycling subsidy coefficients under EPR system
(b) Bike-sharing company
CE0Unit production costs of bikesCE2Third-party reverse logistics costs
CE1First-party reverse logistics costs for bike-sharing companiesCE3Government recycling and disposal fees for abandoned bikes under environmental tax policy
REUnit revenue from bike-sharing rentalsβDamage rate of bike
εTransformational benefits of recycling and disposal for bike-sharing companies
Table 2. Payoff matrix for both players.
Bike-Sharing Companies
FPRL (y)TPRL (1 − y)
Local
governments
ET (x)δCP + γCE0 + CE3ηδCPCG,
RE + ηδCPγCE0CE0CE1CE3
δCP + γCE0ηδCPCG,
RE + ηδCPγCE0CE0CE2
EPR (1 − x)δCPηδCPCGθε,
RE + ηδCP + ε+θεCE0CE1
δCPηδCPCGθε,
RE + ηδCP + ε+θεCE0CE2
Table 3. Initial key parameter values.
ParameterInitial ValueUnit
CG0.8CNY
CE0600CNY
CE11.40CNY
CE23.90CNY
CE34.00CNY
RE1.65CNY
β33.23%
δ1.04%
ε9.97CNY
γ0.5CNY
η17.59
x0.4
y0.6
Disclaimer/Publisher’s Note: The statements, opinions and data contained in all publications are solely those of the individual author(s) and contributor(s) and not of MDPI and/or the editor(s). MDPI and/or the editor(s) disclaim responsibility for any injury to people or property resulting from any ideas, methods, instructions or products referred to in the content.