Article

Insight into the Enzymatic Mechanism of Straw Carbon Source and Its Denitrification Availability

1
Department of Environmental Engineering, Peking University, Beijing 100871, China
2
School of Environmental Science and Engineering, Suzhou University of Science and Technology, Suzhou 215009, China
3
Hubei Dongfang Chemical Industry Co., Ltd., Xiangyang 441404, China
*
Author to whom correspondence should be addressed.
Sustainability 2023, 15(11), 8818; https://doi.org/10.3390/su15118818
Submission received: 17 March 2023 / Revised: 9 May 2023 / Accepted: 10 May 2023 / Published: 30 May 2023
(This article belongs to the Section Environmental Sustainability and Applications)

Abstract

:
The application of an enzymatic straw carbon source (SCS) to a denitrifying system was a promising method for recycling straw waste. However, the total components of an enzymatic SCS, and their effectiveness for denitrification, are still controversial, which hinders its application to denitrifying. In this study, we combined silylation derivatization and GC-MS technology to conduct a comprehensive analysis of the enzymatic SCS components, and further identified the availability of the components in nitrogen removal. The addition of cellulase could improve both the carbon release amount (increase by 300%) and its effectiveness (66% to 83.7%). The components in both the SCS and enzymatic SCS could be divided into three categories: saccharides, VFAs and aromatic structures. Both saccharides and VFAs were effective for denitrifying and accounted for 86.8% of the enzymatic SCS. Most of the invalid components (aromatic structure) belonged to benzoic acid derivatives which originated from the fragments of straw lignin. In summary, the parameters regarding the components, manufacture and availability of the enzymatic SCS were figured out in this study, laying the foundation for straw waste application to the denitrifying process.

1. Introduction

For many years, the total production of straw in China has reached 800 million tons every year, with a substantial amount going unutilized [1]. An enormous amount of biomass energy stored within the cross-linked polymers of cellulose, hemicellulose and lignin that make up straw is wasted without any recycling. Despite efforts to develop sustainable methods for utilizing straw, there is still a significant amount of straw being burned in open fields. This practice not only contributes to air pollution but also reduces the amount of straw available as a potential source of bioenergy [2]. Using enzymes to dispose of straw waste is a promising technology with many benefits. Compared to other treatments such as chemical, thermal or physical processes, enzyme treatment is gentle and does not need special equipment to work. Enzyme treatment is also cost-effective and eco-friendly since it does not create harmful by-products [3]. Many attempts have been made to utilize straw waste to produce fuel alcohol and biodiesel using enzyme catalytic technologies [4,5].
The low carbon-to-nitrogen ratio wastewater is typically addressed using techniques such as anaerobic ammonium oxidation, simultaneous nitrification and denitrification [6]. However, these methods come with drawbacks such as intricate operation and management, significant energy consumption and high costs. It is known that biological nitrogen removal relies on ammonia oxidation and nitrate reduced to N2 [7]. Water contaminated with nitrate typically has low levels of carbon content [8]. However, the nitrogen removal process requires a significant amount of traditional carbon sources, whereby the adding of which would escalate the cost of denitrification [9]. The carbon source serves as an electron donor in mainstream anaerobic denitrification [10]. When there is a shortage of a carbon source, it often results in low nitrogen removal efficiency [11]. In addition, traditional carbon sources such as sodium acetate, methyl alcohol, ethyl alcohol and glucose have been found to be economically unfeasible and can lead to secondary pollution [12]. Due to these environmental and economic concerns, there is a need for new alternative carbon sources to replace the traditional ones. An enzymatic straw carbon source (SCS) has advantages over a traditional carbon source, including recycling, low cost, sustainability, accessibility and low toxicity. Furthermore, it can also play the role of carrier for microbial growth [13]. Therefore, it is a clean and sustainable technology to apply straw waste to denitrification.
Despite the benefits of combining straw waste and denitrification, there are still challenges in converting straw cellulose (hemicellulose) to available carbon sources [14,15]. Firstly, breaking down the crystalline structure of straw cellulose is a crucial step in converting straw waste to a carbon source. However, current methods such as acid–alkali pretreatment [16] and steam-explosion pretreatment [17] are complex and require significant energy consumption. Secondly, the straw cellulose degradation process including enzymatic saccharification and the detailed components are controversial [18,19]. Additionally, the effective constituents for denitrification in the enzymatic SCS remain unknown. Thus, it is necessary to explore the straw cellulose degradation mechanism and the bioavailability ratio of the enzymatic SCS for the denitrifying process.
Given the current research status, the novelty and significance of this study lie in the comprehensive analysis of the intermediate products and main components during the enzymatic hydrolysis process by combining silylation derivatization and gas chromatography-mass spectrometry (GC-MS). The study further provides a detailed understanding of the transformation pathway from cellulose chains to disaccharides, monosaccharides, other sugar structures and finally to small molecular organic acids. In addition, effective components are also distinguished from invalid compounds using a high-efficiency microbial denitrification system.

2. Materials and Methods

2.1. Materials

Rice straw was harvested in Guizhou province, China. It was washed with pure water three times and dried at 105 °C for 2 h, and the straw was milled into particles (<0.63 mm) using a planetary muller. Relevant parameters of rice straw are shown in Table 1. The commercial cellulase complexes (item number M049326-1g) were purchased from Beijing Mreda Technology Co., Ltd., Beijing, China.

2.2. Straw Carbon Release under Different Enzyme Activity and Substrate Loading

The rice straw was enzymatically hydrolyzed for 72 h under various filter paper activities (FPA) (group 1), various straw amounts (group 2), various temperatures (group 3) and various pH values (group 4), as seen in Table 2. The samples were taken in a timely manner and filtrated using a 0.45 μm millipore filter to test the total organic carbon (TOC). The kinetic fitting models, pseudo-first-order model, pseudo-second-order model, Elovich model and internal diffusion model were used to fit the carbon release data [20].

2.3. Component Test Procedure and Related Parameter Settings

Sixteen grams of sterilized straw particles were mixed with 800 mL of deionized water at a pH of 4.5 and a temperature of 45 °C. Cellulase was added to achieve an enzyme activity of 640 U/mL, and a GC-MS test was conducted after sampling. The sample pretreatment steps were as follows: 5 mL of the mixture was sampled and filtered using a 0.45 μm millipore filter. Then, 100 μL of 20% NaOH was added to the filtrate, which was then quickly frozen using liquid nitrogen, freeze-dried and re-dissolved in 5 mL of acetone. Next, 1.5 mL of solution was taken, and 50 μL of silane derivatization reagent (N,O-bis(trimethylsilyl)trifluoroacetamide, containing trimethyl chlorosilane) was added. The mixture was incubated for one hour at 65 °C and finally tested using GC-MS [21].
The organic compounds in the water samples were analyzed using the 6890N/5973 GC-MS system from Agilent Corporation based in the USA. High-purity helium gas with 99.999% purity was used as the carrier gas at a flow rate of 1 mL/min. Separation was carried out using a DB-35MS capillary column with an inner diameter of 0.25 mm and a length of 30 m. The gasification compartment was set initially to 40 °C for 5 min before being linearly ramped up at a rate of 5 °C/min to 280 °C, and then maintained at that temperature. The electron energy and double voltage were set to 70 eV and 1400 V, respectively. Molecular weight was scanned within a range of 40 to 800 Da, and the NIST2008 mass spectral library database was referenced to analyze the organic compounds. By comparing the results with those of the silanized acetone sample, the organic components were determined.

2.4. The Denitrifying Treatment of the Carbon Source

The mature biofilm was selected to be used as the denitrifying bacteria for the batch experiment. The inoculated strain was a type of bacterial powder (named B350, as shown in Figure S1), which was purchased from BIONETIX Co. in Canada. To obtain a mature biofilm, add B350 (1 g/L) to the continuous flow biological filter (Figure S2) and operate it for about 16 days (2 days of adapted stage followed by 14 days of continuous flow) using the operation parameters outlined in Tables S1 and S2. When the mature biofilm was obtained, it was first washed with deionized water three times and nitrate was added to make the concentration of N-nitrate 1000 mg/L; then, it was incubated for 24 h at 32 °C. The purpose of this step was to eliminate the influence of endogenous denitrification. Three kinds of carbon source, SCS, enzymatic SCS and glucose, were added into denitrification bottles and incubated for 72 h. The TOC and GC-MS of the SCS and enzymatic SCS were measured regularly.

3. Results and Discussion

3.1. Carbon Release Kinetics via Cellulase Hydrolysis

The investigation into the kinetics of the straw carbon release was a crucial aspect in comprehending the interaction mechanism between cellulase and straw cellulose [22]. As depicted in Figure 1, as cellulase activity varied from 0 to 1000 U/mL, the quantity of carbon released increased with time and peaked at 24 h. The higher the enzyme activity, the greater the carbon released. Four dynamical models, namely pseudo-first-order, pseudo-second-order, the Elovich model and internal diffusion model [20], were utilized to fit the carbon release curve as shown in Table 3. The coefficient of determination, R2, indicated that the pseudo-first-order, pseudo-second-order and Elovich models matched well with the straw carbon release data and, among which, the pseudo-second-order model was the most optimal. Ho first proposed the pseudo-second-order model in 1995 [23], and several studies have demonstrated that the model provides a better fit for the chemical reaction process relevant to adsorption [24]. The primary step of straw enzymatic degradation is the adsorption of endoglucanase (or exoglucanase) onto the surface of straw lignincellulose [25]; hence, the pseudo-second-order model was suitable for describing the enzymatic straw carbon release process.
Regarding the pseudo-second-order model, at different levels of cellulase activity (0, 40, 160, 640 and 1000 U/mL), the equilibrium carbon release quantity (Qe) reached 22.19, 39.17, 49.33, 63.45 and 66.71 mg/g, respectively. This meant that the Qe from enzymatic hydrolysis (1000 U/mL) was 300% higher than that in the group without enzymes (0 U/mL). Additionally, the kinetic constant (k2) indicated that the carbon release rate increased with cellulase activity, suggesting that higher enzyme activity can increase the adsorption sites of effective cellulase components on the straw surface and accelerate the carbon release rate [24].
The Elovich model uses α and β to represent the initial carbon release rate and activation of the energy constant, respectively [26]. When cellulase increased from 0 to 1000 U/mL, the constant α rose from 13.78 to 69.17 mg/g·h, which was consistent with the finding of the pseudo-second-order model. Conversely, the β decreased from 0.92 to 0.09 g/mg, indicating that the activation energy of the enzymatic process gradually decreased after adding the cellulase. This meant that adding cellulase made it easier for organic carbon to be released. The release of carbon from straw was related to its diffusion from the inner of the lignocellulose structure, and the internal diffusion model could help to describe the process [27]. The internal diffusion constant (Kint) increased from 0.64 to 13.46 mg/(g·h0.5), indicating that the carbon source would be released faster from the lignocellulose structure with an increase in cellulose activity, while the boundary constant (C) showed that there was still some diffusion resistance throughout the carbon release process.
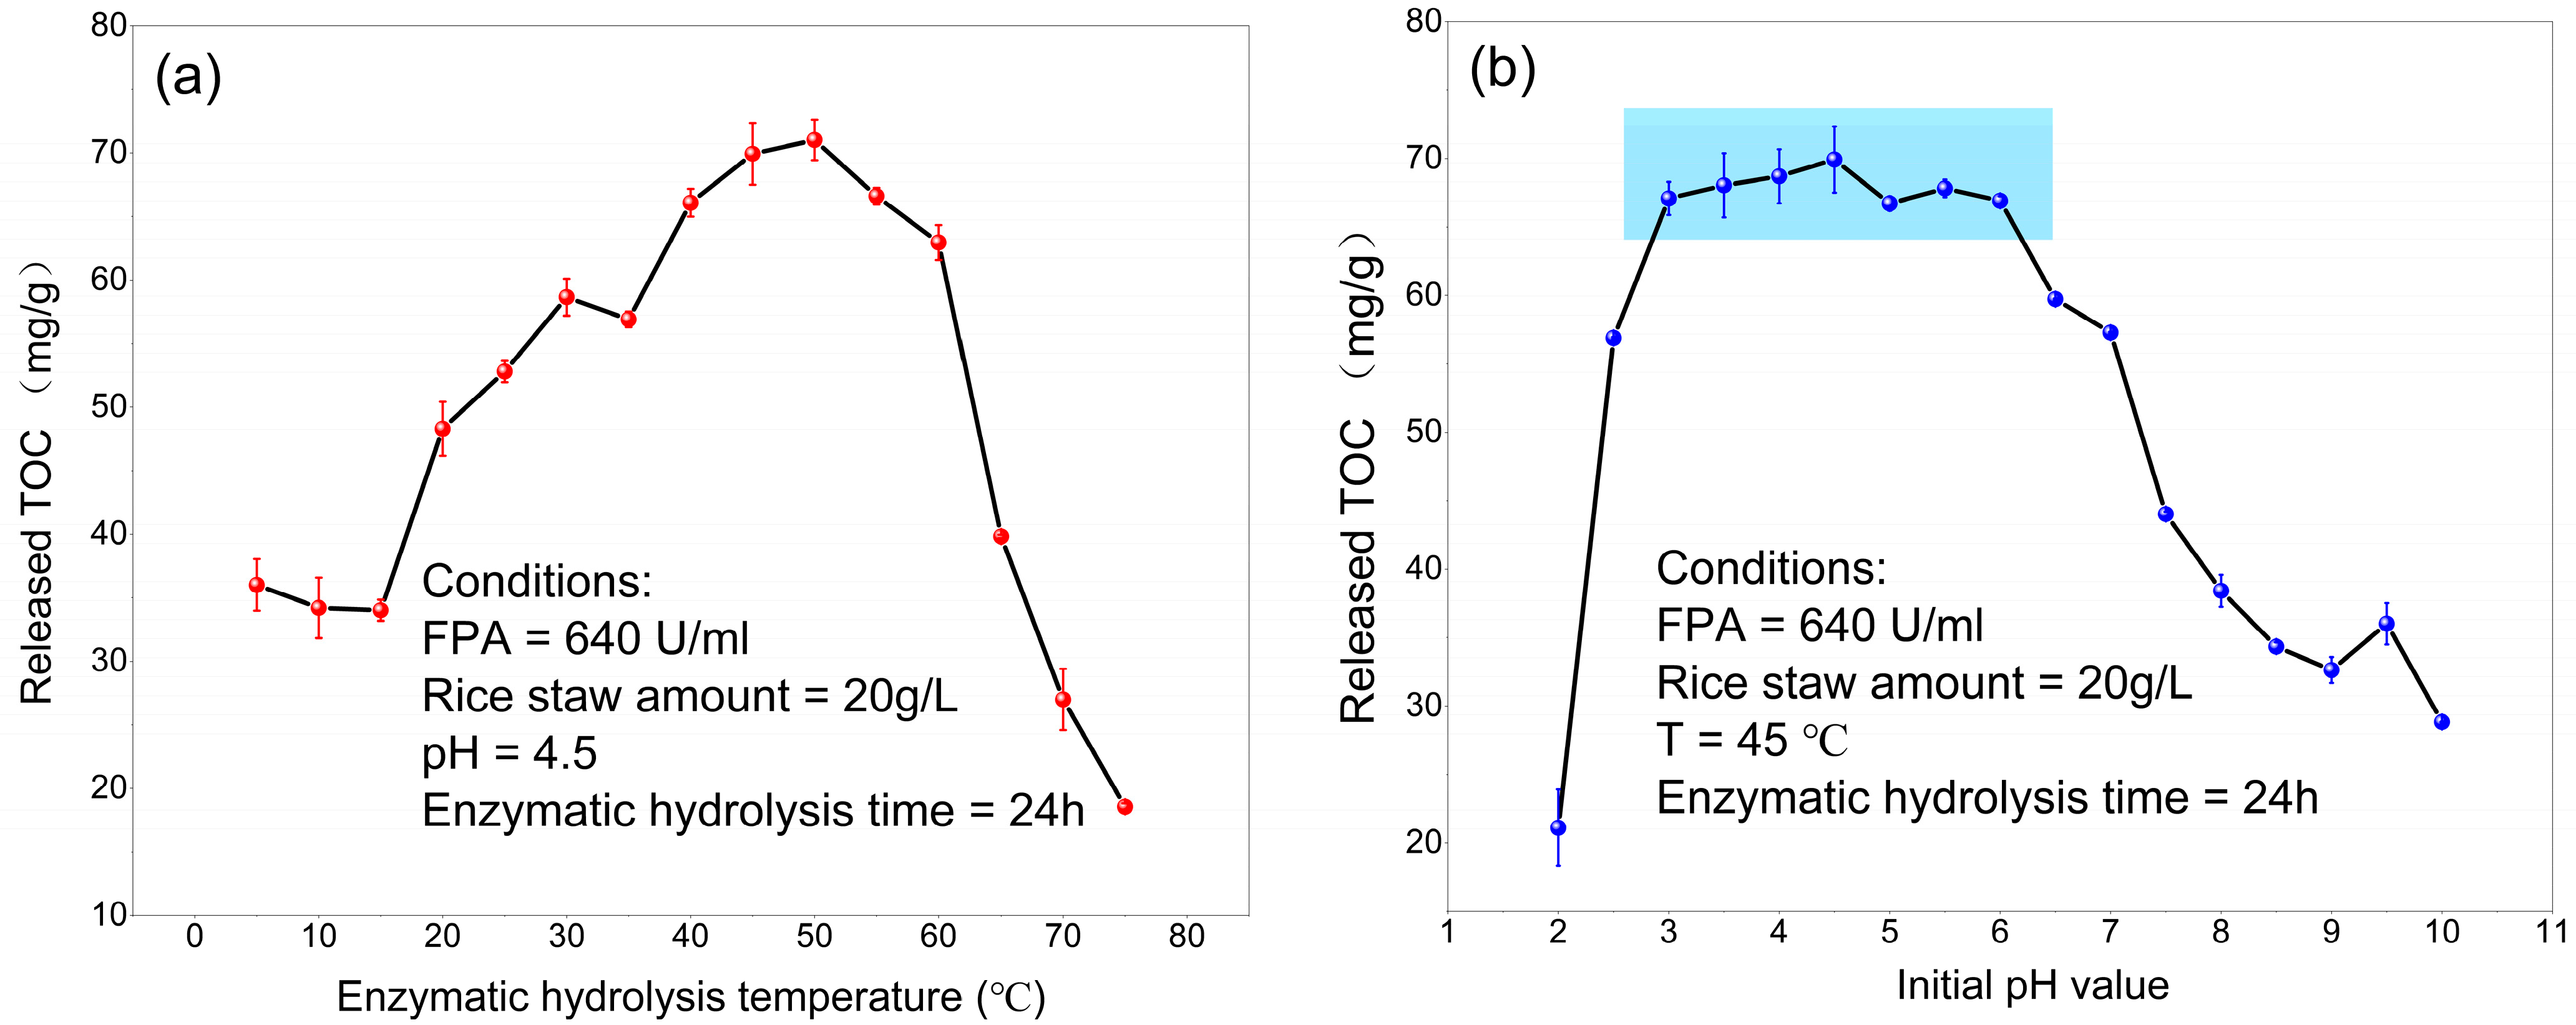
Figure 1 indicated that increasing cellulase activity from 640 to 1000 U/mL did not result in a significant increment in carbon release. Thus, for further experiments, the cellulase activity of 640 U/mL was selected. Figure 2 reveals that the carbon release amount per unit mass of straw decreased (81.23 to 57.44 mg/g) with an increase in straw substrate concentration (1 to 50 g/L). This decrease was due to the high concentration of organic carbon causing mass transfer resistance, which prevented the further release of the carbon source [28]. Enzymes typically have an optimum temperature and pH at which the reaction velocity is maximized, and beyond which the velocity decreases [29]. Figure 3 illustrates that the straw carbon release amount reached its maximum at temperature 45–50 °C (69.9–71 mg/g) and at pH range of 3–6 (66.7–69.9 mg/g). The optimum pH range was wider than that reported in other studies [30,31], indicating that the cellulase used could adapt to a greater range of external stresses.

3.2. Component Analysis of the Enzymatic SCS

Currently, there are only a few studies available on the components of straw carbon sources. Zhang et al. conducted an analysis of 10 different types of straw leaching solutions, and discovered that the primary constituents were organic acids, carbohydrate and nitrogenous organics, which contained a total of 16 compounds [32]. Similarly, Qi et al. carried out experiments on six different types of straw and found that cellulose extracts contained a mixed carbon source system including small molecular organic acids, sugars, nitrogen-containing organic components and esters [33]. However, these studies have their limitations when it comes to component analysis. For instance, while SCS may contain up to 30 components, only 16 substances can be detected due to constraints in the testing methods used. Hence, there have been quite a few studies to date that have undertaken a comprehensive analysis of the total components in both an SCS and enzymatic SCS.
The silane derivatization process can use silyl to replace the active hydrogen in various non-volatile structures. This results in a decrease in the polarity of compounds and weakens their ability to form hydrogen bonds. The trimethylsilane derivatives (TMSs) formed are volatile, weakly polar and thermally stable, and are suitable for GC-MS analysis [34]. By combining silane derivatization with a gas chromatographic technique, it is possible to detect a greater number of non-volatile components, such as sugars and phenols in an SCS and enzymatic SCS [35].
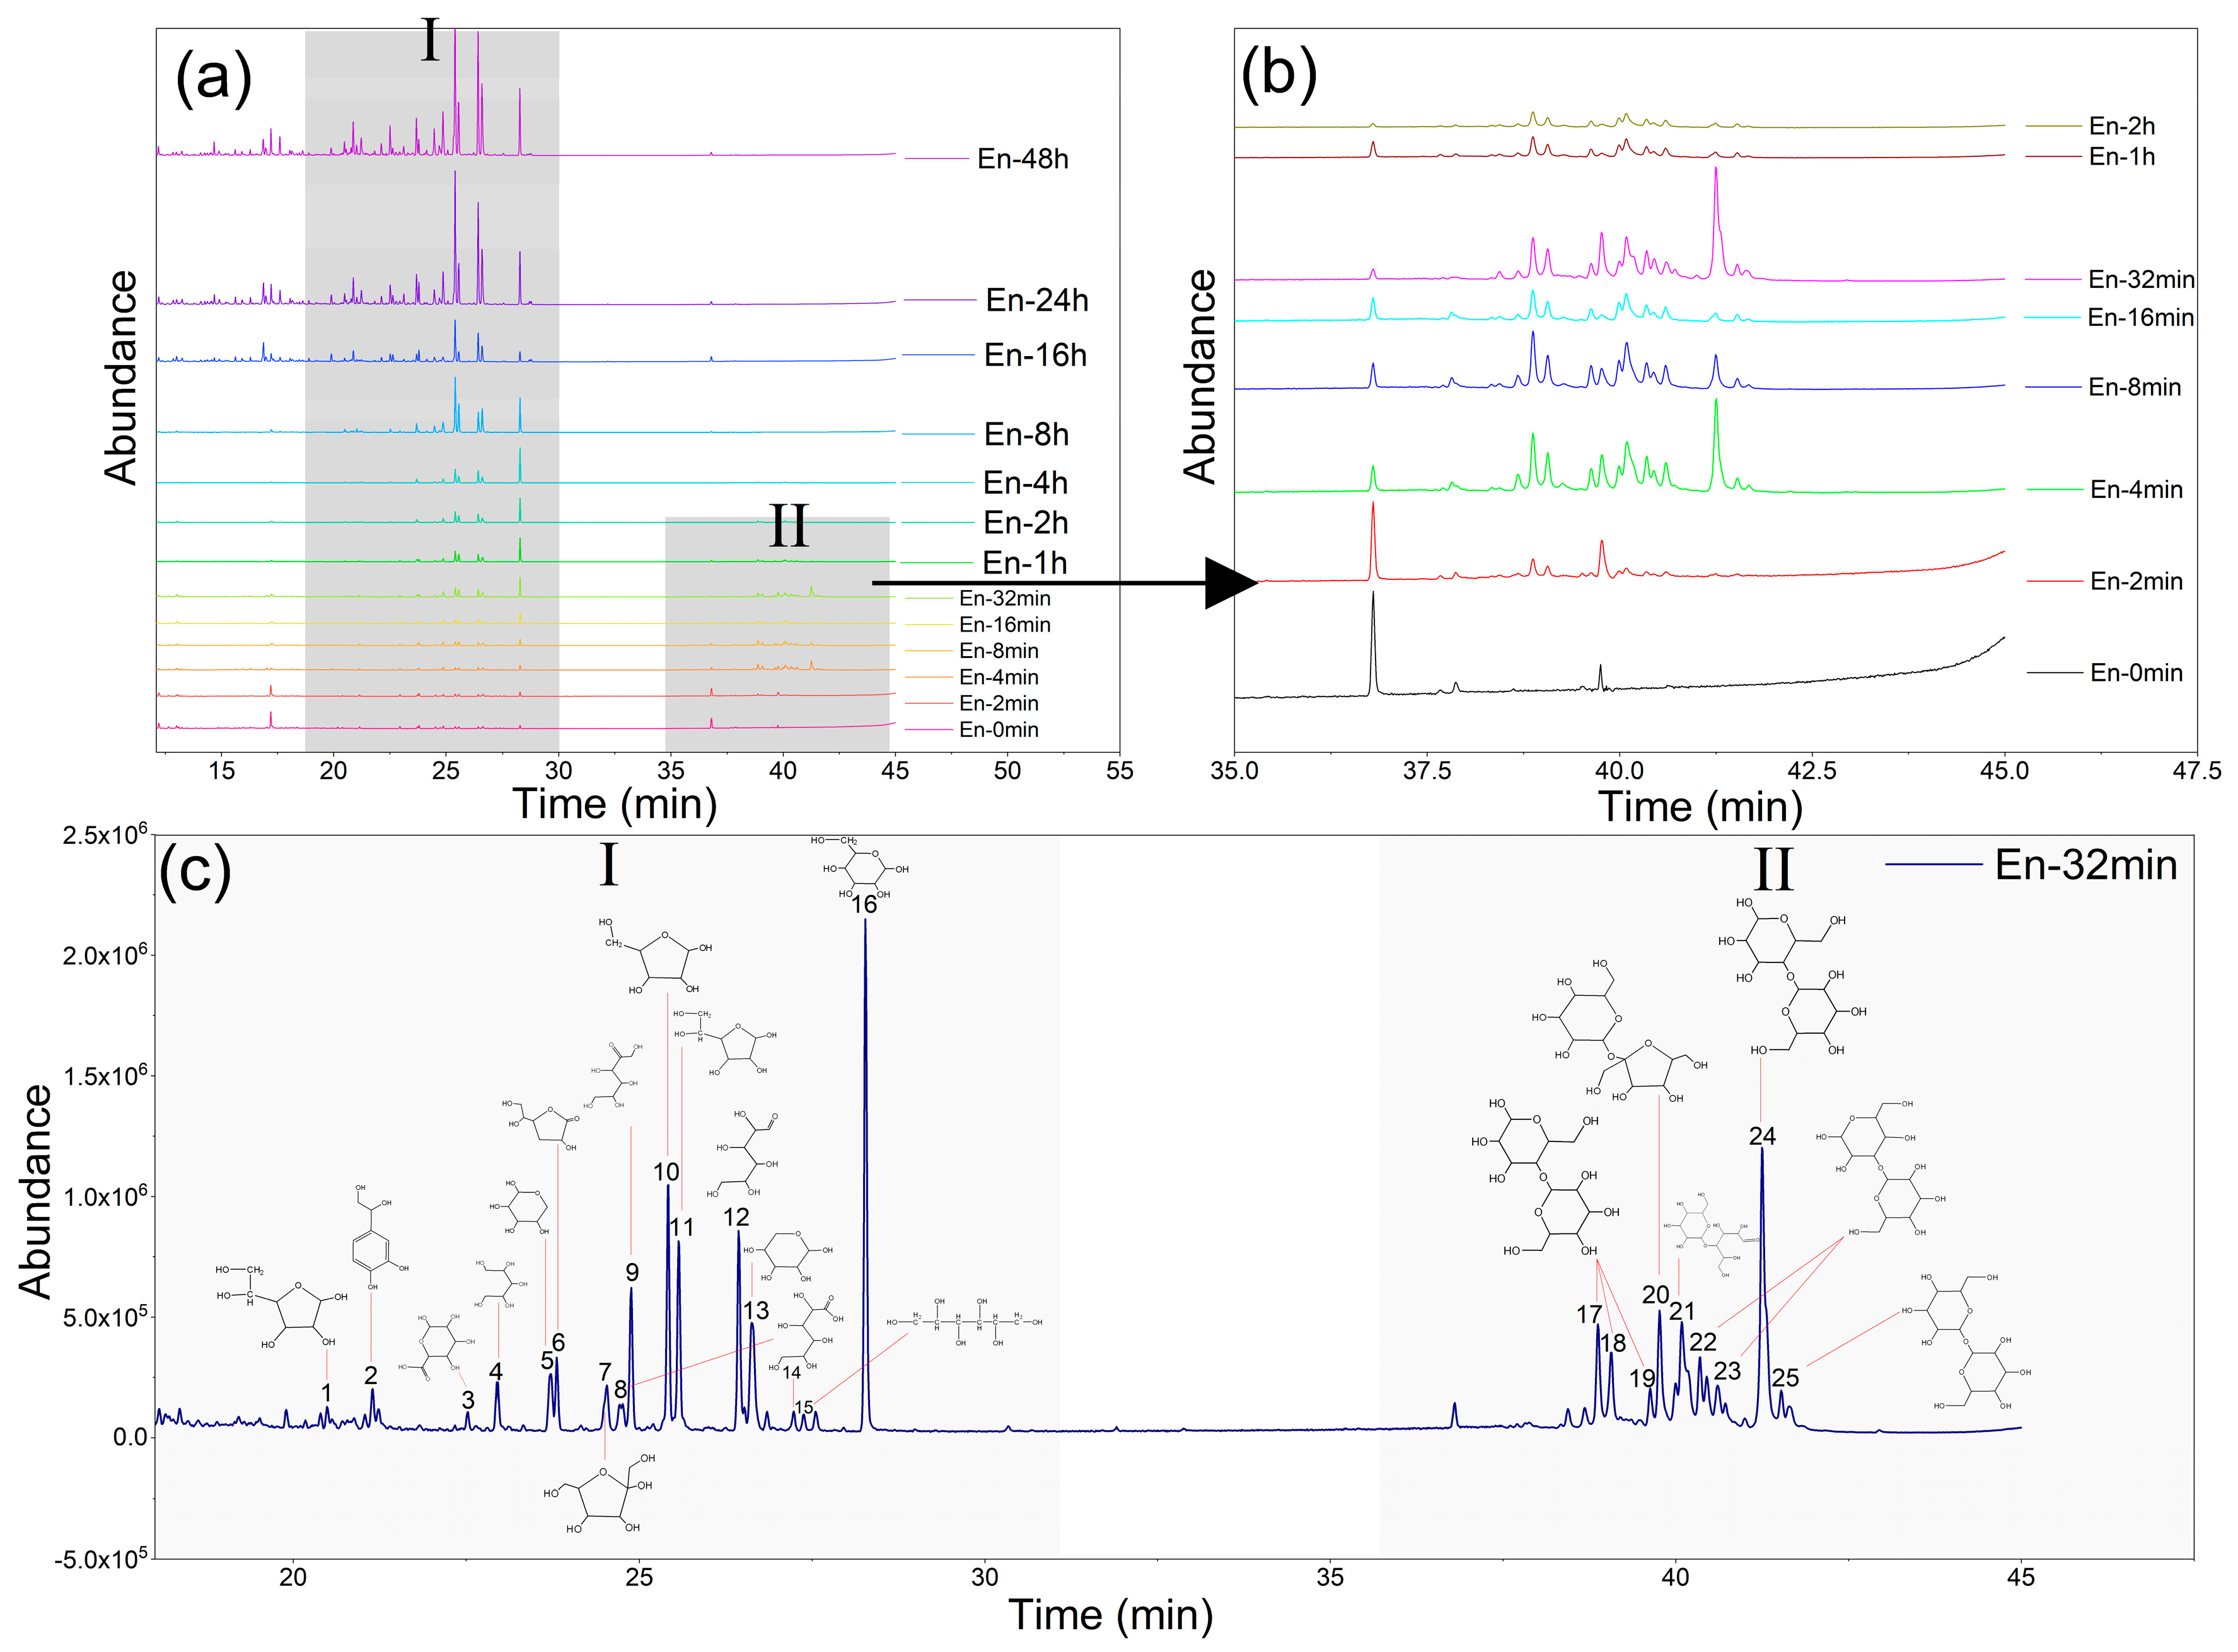
The enzymatic SCS composition analysis result is presented in Figure 4. The characteristic peaks gradually increased with enzymatic hydrolysis time, and the optimal time for obtaining the enzymatic SCS was found to be between 24 and 48 h. Region I and II were identified as the main areas of the carbon source components, and specific molecular structures are listed in Figure 4c. Region I represented monose or volatile fatty acids (VFAs), including open-chain glucose (peak 16), glucofuranose (peaks 10 and 11), glucopyranose (peaks 5 and 12), xylose (peaks 3 and 13) and fructose (peaks 7 and 9), while region II represented the disaccharide structure. In region II, many compounds (such as cellobiose identified at peaks 17, 18, 19 and 24) had more than two peaks due to tautomerism [36]. The detection of only the disaccharide structure during the period of 2–32 min and its absence in the subsequent stages (Figure 4b) might be attributed to the low activity of β-glucosidase in the initial stage compared to exoglucanase. Exoglucanase cleaved cellulose into disaccharides, while β-glucosidase cleaved disaccharide into monose [37]. Therefore, disaccharide structures only appeared when the exoglucanase activity was greater than that of β-glucosidase.
Based on the component analysis of Figure 4, the production of disaccharides and monosaccharides followed a clear chronological order, allowing us to infer the collaborative work process among the three main components of cellulase. Mechanistically, glycosidic bonds on the cellulose chain are not entirely equivalent. Endoglucanase and exoglucanase in cellulase could only cleave the cellulose chain in units of disaccharides (as shown in Figure 5), producing only disaccharide structures rather than cellulotriose or longer sugar chains. Due to different monomers, the straw cellulose chains could be categorized into three types: type I (cellulobiose as monomer), type II (nigerose as monomer) and type III (trehalose as monomer). Exoglucanases were cleaved from the ends of various cellulose chains, producing cellulobiose, nigerose and trehalose. All generated disaccharide structures could then be hydrolyzed by β-1,4-glucosidase to generate glucopyranose.
To provide a clear understanding of the enzymatic SCS components, we specifically chose the total ion chromatogram at 24 h for detailed explanation (Figure 6b), and the relevant information is compiled in Table 4. Additionally, we included the component information of the SCS as a control, which is presented in Figure 6a and Table 4. For more detailed molecular formulas, structural formulas and other relevant information of all components, please refer to Tables S3 and S4.
Figure 6 illustrates that the quantity and concentration of ingredients in the enzymatic SCS were much higher than those in the SCS. Our analysis, as presented in Table 4, revealed that the components of both the SCS and enzymatic SCS could be roughly categorized into three groups: saccharides, VFAs and aromatic structures. Enzymatic SCS contained a total of 55 ingredients, whereas SCS had only 27 species. In the case of the enzymatic SCS, the numbers of saccharides, VFAs and aromatics were 12, 23 and 20, respectively, accounting for 66.4%, 20.4% and 13.2% of the total ingredients. Notably, the proportion of saccharides and VFAs in the enzymatic SCS was significantly higher than that in the SCS (59.5% and 14.4%, respectively). Therefore, the addition of cellulase could substantially alter the quality of the SCS.
In the enzymatic SCS, the primary saccharides present were glucofuranose (23.5%), glucopyranose (16.1%), xylose (9.2%), open-chain glucose (5.8%), fructofuranose (4%) and D-ribofuranose (4%). Glucose, the dominant ingredient, had three different structures, furan form, pyran form and open-chain form, which together made up 45.4% of the total organic matters. The two most abundant substances in the VFAs were glycerol (5.6%) and oxalic acid (2%), which were also detected in the SCS. Other major VFA components also included glycolic acid (1.59%), adipic acid (1.59%) and 3-hydroxypropionic acid (1.2%). Rahayu’s research revealed that the hydrolysates after acid pretreatment and enzymatic saccharification contained glucose, xylose, galactose, arabinose and mannose [38]. This study further refined the specific structures and their proportions based on Rahayu’s findings. The third part showed that the aromatic structure contained 20 constituents, which accounted for 13.2% of the enzymatic SCS (see Table S4), with the benzoic acid derivative being the most prevalent.
In general, endoglucanases break down the cellulose chain structure randomly, resulting in the formation of cellulose, cellotetrose and even polysaccharides with a higher degree of polymerization [39]. However, during the enzymatic hydrolysis, only disaccharides were detected within 2–32 min (Figure 4b). The three disaccharide structures were cellobiose (peaks 17–19 and 24), nigerose (peaks 22 and 23) and trehalose (peak 25), which were isomers of each other. Cellobiose is widely known as a repeat segment of straw cellulose chains [25,40], but the discovery of nigerose and trehalose [41] during enzymatic hydrolysis suggested another two structures of straw cellulose (Figure 5) that differed from the traditional view that straw cellulose is composed solely of cellobiose [42,43]. Figure 7 gives both the degradation pathway of three kinds of cellulose chains and the reciprocal transformation mechanism of sugars. It further explains why glucofuranose dominated in the enzymatic SCS instead of glucopyranose.
The degradation steps of straw cellulose could be summarized in Figure 7 using the pathway prediction system (PPS) [44] based on the analysis of primary components in the enzymatic SCS. Firstly, exoglucanases (S1–S3) cleaved the cellulose into three isomers—cellobiose, nigerose and trehalose. The three disaccharide structures were then broken down into glucopyranose (S4–S6) by β-glucosidase. Secondly, the glucopyranose translated into fructofuranose (S9) under the action of phosphohexose ismerase [45], and then the five-membered ring of fructofuranose opened and further decomposed into dioxyacetone and glycerinum (S10–S12). This process has been shown to be feasible using PPS. Thirdly, breaking the anomeric C-O bond (S13) led to the translation of glucopyranose into open-chain glucose, which subsequently formed glucofuranose via the reaction between the hydroxyl group on C4 and the aldehyde (S16) [46].
Theoretically, the three structures of glucose could translate to each other via the analysis of PPS, ultimately breaking down into glycerinum and oxalic acid (S20–S21, S26). The mutual transformation of these three main glucose structures resulted in the high percentage of glucofuranose (23.52%) in the enzymatic SCS. Meanwhile, another common ingredient, xylose, may result from glucopyranose transformation (S18) [47]. However, some researchers believe that xylose comes from the degradation of hemicellulose [48]. Finally, ribofuranose, which was derived from the lysis of plant straw cells or hemicellulose [49], could be transformed into arabinose (S23) and ultimately degraded to oxalic and glyceric acid (S24–S25).

3.3. Carbon Source Availability and Component Change in Denitrification

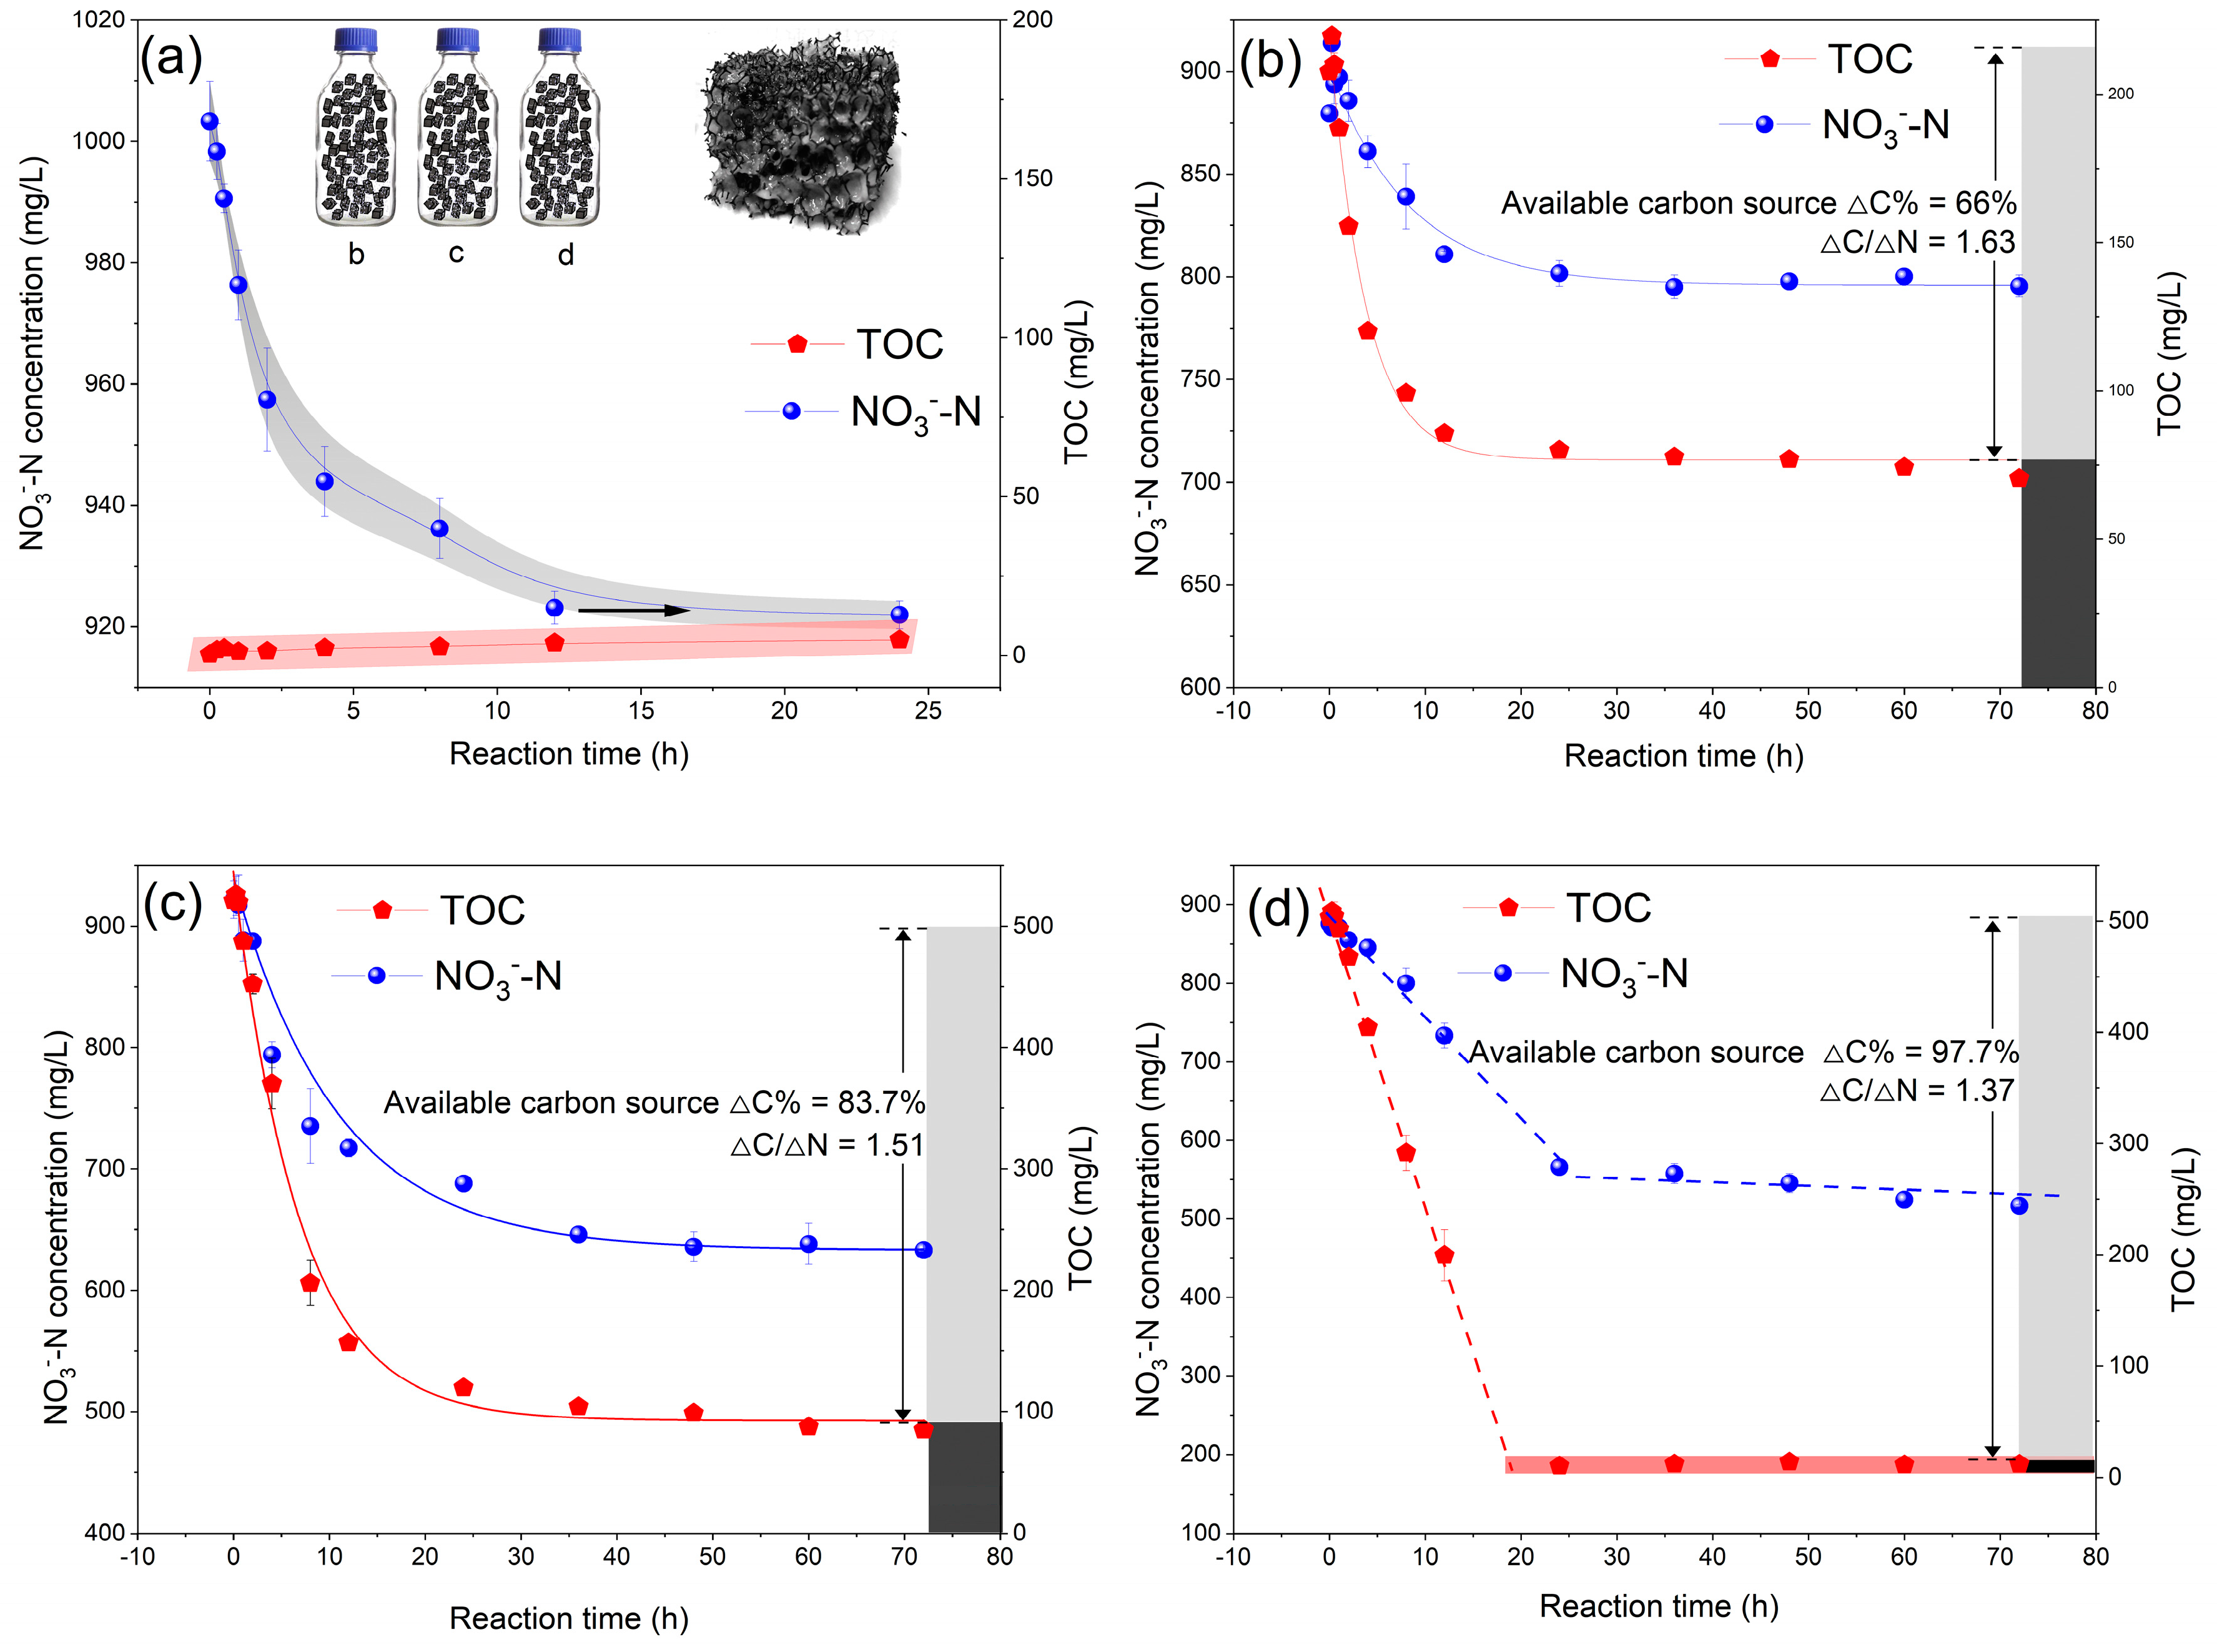
To investigate the availability of the enzymatic SCS in the denitrification process, the mature biofilm (Figure 8a) was used to conduct the experiment. The mature biofilm offered the advantage of ensuring an adequate denitrifying capacity while minimizing exogenous pollution. Firstly, the endogenous nitrogen removal capacity of the biofilm should be eliminated, as in Figure 8a. After 24 h of treatment, without the addition of an external carbon source, the biofilms were unable to remove any nitrogen, though they still maintained better denitrifying activity. Next, three types of carbon sources were introduced into the biofilm system. The result indicated that both the SCS and enzymatic SCS consumption matched well with the pseudo-second-order model (Figure 8b,c), whereas the glucose carbon source exhibited a linear drop (Figure 8d).
The SCS decreased from 207.6 mg/L to 70.5 mg/L, while N-nitrate went down from 879.5 mg/L to 795.5 mg/L. The effective carbon source (ΔC = 137.1 mg/L) accounted for 66% of the total SCS. The N-nitrate removal amount (ΔN) was 84 mg/L. It could be calculated that the ΔC/ΔN value was 1.63 (Table 5), indicating that removing 1 g of N-nitrate required 1.63 g of an effective SCS (equivalent to 2.47 g of an SCS). Another study showed that 2.47 g of methanol was required to reduce 1g of N-nitrate [9]. This suggested that the straw carbon source could serve as a viable replacement for methanol as a good electron donor in a denitrifying system with equal quantities.
Similarly, the ΔC/ΔN ratio of the enzymatic SCS was 1.51, indicating that the removal of 1 g of N-nitrate required 1.51 g of effective enzymatic SCS (equivalent to 1.8 g enzymatic SCS). In the control group, glucose exhibited a ΔC/ΔN ratio of 1.37, indicating that 1.37 g of glucose was needed to reduce 1 g of N-nitrate. The effective fraction of the enzymatic SCS (ΔC = 436.3 mg/L) accounted for 83.7% of the total TOC, which was similar to the proportion (86.8%) of saccharides and VFAs. This suggests that saccharides and VFAs might be the effective constituents.
Figure 9 vividly illustrates the utilization of components in the SCS and enzymatic SCS during the nitrogen removal process. Figure 9a displays that residual compounds in the SCS after denitrification were primarily composed of aromatic structures. The effective constituents were saccharides and most VFAs, which were consumed within the first two hours. Similarly, the analysis results of the enzymatic SCS for nitrogen removal were comparable to those of the SCS (Figure 9b).
According to Table 5, the theoretical lowest COD/N ratio in the normal denitrification process was 3.7 based on the glucose experiment. This finding was similar to Bernat et al.’s research where they demonstrated that the minimum external COD consumption was 4.1 mg to reduce 1 mg N-nitrate when operating the denitrifying process [50]. However, the COD/N ratio of the denitrifying system is often larger than 3.7, and is typically considered to be reasonable at 5 within the industry [51]. The ΔC/ΔN ratio may vary depending on the carbon source used, and previous studies have suggested that the value for nearly complete denitrification (97–100%) for glucose was 2 g C/g NO3-N [10]. The glucose ΔC/ΔN ratio obtained in this study was lower (1.37) than the ratio obtained in previous studies (2).
The characteristic peaks of aromatic constituents remained unchanged during the denitrifying process for both the SCS and enzymatic SCS (Figure 9). This indicated that the aromatic components were the invalid part of the carbon source. Furthermore, it was found that benzoic acid derivatives accounted for a significant proportion of the total aromatic substances (Tables S3 and S4). Zhu et al. identified that 4-hydroxybenzoic acid, vanillic acid and benzoic acid accounted for a 42% proportion of metabolites when decomposing lignin [52]. Additionally, another piece of research proposed a method to produce vanillin and methyl vanillate from lignin via oxidation [53]. Song et al. also reported a three-step strategy for the production of terephthalic acid from lignin-derived monomer mixtures [54]. All of these ingredients were identified as lignin degradation products and were found in this study (Tables S3 and S4). Therefore, the invalid components (aromatic structures) of the carbon source were mainly from the fragments of straw lignin.
To sum up, our study showed that straw carbon source release was generally applicable to pseudo-second-order kinetics, and cellulase can significantly improve the carbon release amount (increase by 300%) and carbon source availability (66% to 83.7%). Meanwhile, this study identified the specific components of the SCS (27 species) and enzymatic SCS (55 species), which could be divided into three categories: saccharides, VFAs and aromatic structures. These components well covered most of the possible organic ingredients of the SCS and enzymatic SCS.
The PPS system further confirmed that the effective components such as sugars in the enzymatic SCS could be transformed into each other and the final product was mainly oxalic acid and glycerol. The increase in saccharides and VFAs resulted in the enzymatic SCS being more available than the SCS when denitrifying, and the residual compounds after denitrifying were aromatic structures, which mainly originated from the straw lignin fragment. In future studies, efficient microorganisms should be screened to utilize the residual aromatic structures. This work clarified the details of the enzymatic hydrolysis process of straw waste and figured out the availability of the enzymatic SCS for nitrogen removal, which provides technical support for straw recycling in the field of denitrification.

4. Conclusions

This article combined silane derivatization and GC-MS technology to comprehensively analyze the intermediate products and detailed components of the enzymatic SCS. It also tested the effectiveness of rice straw carbon sources via denitrification batch experiments. The conclusions are as follows: firstly, it was confirmed that the release process of the SCS and enzymatic SCS conformed to pseudo-second-order kinetics, and the addition of cellulase could significantly increase the release amount of the carbon source. Secondly, three disaccharide intermediates were found to be produced in the enzymatic hydrolysis of straw, and, based on this, it was speculated that there were three types of cellulose chains, namely type I (cellobiose as monomer), type II (nigerose as monomer) and type III (trehalose as monomer). Thirdly, it was found that the enzymatic SCS contained a total of 55 organic components, which could be classified into saccharides (12 species), VFAs (13 species) and aromatics (20 species), whereby among which glucopyranose could be converted into other sugars and ultimately generate small molecule organic acids such as oxalic acid and glycerol. Denitrification batch experiments verified that saccharides and most VFAs were effective components for denitrification, while the aromatics were ineffective for nitrogen removal.

Supplementary Materials

The following supporting information can be downloaded at: https://www.mdpi.com/article/10.3390/su15118818/s1. Figure S1: Inoculated denitrification strain (B350); Figure S2: Continuous flow biological filter; Table S1: Operation parameters for biological filter; Table S2: Parameters for various kinds of stock solution; Table S3: Components list of straw carbon source (SCS); Table S4: Components list of rice enzymatic SCS.

Author Contributions

Conceptualization, L.L. and Z.Y.; methodology, K.W.; software, C.L.; validation, L.L., Z.Y. and J.Q.; formal analysis, L.L.; investigation, S.Z.; resources, W.H.; data curation, S.Z.; writing—original draft preparation, L.L.; writing—review and editing, L.L.; visualization, W.H.; supervision, Z.Y.; project administration, Z.Y.; funding acquisition, Z.Y. All authors have read and agreed to the published version of the manuscript.

Funding

This research received no external funding.

Institutional Review Board Statement

Not applicable.

Informed Consent Statement

Not applicable.

Data Availability Statement

Not applicable.

Acknowledgments

We thank Yihuan Deng for his grammatical help in writing the manuscript.

Conflicts of Interest

The authors declare no conflict of interest.

References

  1. Xu, C.; Ji, L.; Chen, Z.; Zhou, X.; Fang, F. Analysis of China’s rice industry in 2018 and the outlook for 2019. China Rice 2019, 25, 1–9. Available online: http://www.zgdm.net/CN/10.3969/j.issn.1006-8082.2019.02.001 (accessed on 20 March 2019).
  2. Ren, J.; Yu, P.; Xu, X. Straw utilization in China—status and recommendations. Sustainability 2019, 11, 1762. [Google Scholar] [CrossRef]
  3. Singh, S.K. Biological treatment of plant biomass and factors affecting bioactivity. J. Clean. Prod. 2020, 279, 123546. [Google Scholar] [CrossRef]
  4. Li, C.; Yang, X.; Gao, S.; Chuh, A.H.; Lin, C.S.K. Hydrolysis of fruit and vegetable waste for efficient succinic acid production with engineered Yarrowia lipolytica. J. Clean. Prod. 2018, 179, 151–159. [Google Scholar] [CrossRef]
  5. Harding, K.; Dennis, J.; von Blottnitz, H.; Harrison, S. A life-cycle comparison between inorganic and biological catalysis for the production of biodiesel. J. Clean. Prod. 2008, 16, 1368–1378. [Google Scholar] [CrossRef]
  6. Chen, Y.; Peng, Y.; Wang, J.; Zhang, L. Biological phosphorus and nitrogen removal in low C/N ratio domestic sewage treatment by A2/O-BAF combined system. Acta Sci. Circumstantiae 2010, 30, 1957–1963. Available online: https://www.oalib.com/paper/1590576 (accessed on 1 October 2010).
  7. Li, Y.; Wang, S.; Li, Y.; Kong, F.; Xi, H.; Liu, Y. Corn Straw as a Solid Carbon Source for the Treatment of Agricultural Drainage Water in Horizontal Subsurface Flow Constructed Wetlands. Water 2018, 10, 511. [Google Scholar] [CrossRef]
  8. Liu, G.Y.; Zhang, H.Z.; Li, W.; Zhang, X. Advances of External Carbon Source in Denitrification. Adv. Mater. Res. 2012, 518–523, 2319–2323. [Google Scholar] [CrossRef]
  9. Wang, L.; Zhao, L.; Tan, X.; Yan, B. Influence of different carbon source and ratio of carbon and nitrogen for water denitrification. Environ. Prot. Sci. 2004, 30, 15–17. (In Chinese) [Google Scholar] [CrossRef]
  10. Her, J.-J.; Huang, J.-S. Influences of carbon source and C/N ratio on nitrate/nitrite denitrification and carbon breakthrough. Bioresour. Technol. 1995, 54, 45–51. [Google Scholar] [CrossRef]
  11. Ma, Y.; Zheng, X.; He, S.; Zhao, M. Nitrification, denitrification and anammox process coupled to iron redox in wetlands for domestic wastewater treatment. J. Clean. Prod. 2021, 300, 126953. [Google Scholar] [CrossRef]
  12. Fu, X.; Hou, R.; Yang, P.; Qian, S.; Feng, Z.; Chen, Z.; Wang, F.; Yuan, R.; Chen, H.; Zhou, B. Application of external carbon source in heterotrophic denitrification of domestic sewage: A review. Sci. Total Environ. 2022, 817, 153061. [Google Scholar] [CrossRef]
  13. Aslan, Ş.; Türkman, A. Simultaneous biological removal of endosulfan (α+β) and nitrates from drinking waters using wheat straw as substrate. Environ. Int. 2004, 30, 449–455. [Google Scholar] [CrossRef]
  14. Liu, G.; Han, D.; Yang, S. Combinations of mild chemical and bacterial pretreatment for improving enzymatic saccharification of corn stover. Biotechnol. Biotechnol. Equip. 2022, 36, 598–608. [Google Scholar] [CrossRef]
  15. Tang, W.; Wu, X.; Huang, C.; Ling, Z.; Lai, C.; Yong, Q. Natural surfactant-aided dilute sulfuric acid pretreatment of waste wheat straw to enhance enzymatic hydrolysis efficiency. Bioresour. Technol. 2021, 324, 124651. [Google Scholar] [CrossRef]
  16. Li, P.; Cai, D.; Zhang, C.; Li, S.; Qin, P.; Chen, C.; Wang, Y.; Wang, Z. Comparison of two-stage acid-alkali and alkali-acid pretreatments on enzymatic saccharification ability of the sweet sorghum fiber and their physicochemical characterizations. Bioresour. Technol. 2016, 221, 636–644. [Google Scholar] [CrossRef] [PubMed]
  17. Hu, Q.; Su, X.; Tan, L.; Liu, X.; Wu, A.; Su, D.; Tian, K.; Xiong, X. Effects of a Steam Explosion Pretreatment on Sugar Production by Enzymatic Hydrolysis and Structural Properties of Reed Straw. Biosci. Biotechnol. Biochem. 2013, 77, 2181–2187. [Google Scholar] [CrossRef]
  18. Kuo, C.-H.; Lee, C.-K. Enhancement of enzymatic saccharification of cellulose by cellulose dissolution pretreatments. Carbohydr. Polym. 2009, 77, 41–46. [Google Scholar] [CrossRef]
  19. Seo, D.-J.; Sakoda, A. Assessment of the structural factors controlling the enzymatic saccharification of rice straw cellulose. Biomass Bioenergy 2014, 71, 47–57. [Google Scholar] [CrossRef]
  20. Deng, Y.; Wheatley, A. Mechanisms of Phosphorus Removal by Recycled Crushed Concrete. Int. J. Environ. Res. Public Health 2018, 15, 357. [Google Scholar] [CrossRef]
  21. Yadav, S.; Chandra, R. Biodegradation of organic compounds of molasses melanoidin (MM) from biomethanated distillery spent wash (BMDS) during the decolourisation by a potential bacterial consortium. Biodegradation 2012, 23, 609–620. [Google Scholar] [CrossRef] [PubMed]
  22. Desvaux, M.; Guedon, E.; Petitdemange, H. Kinetics and Metabolism of Cellulose Degradation at High Substrate Concentrations in Steady-State Continuous Cultures of Clostridium cellulolyticum on a Chemically Defined Medium. Appl. Environ. Microbiol. 2001, 67, 3837–3845. [Google Scholar] [CrossRef] [PubMed]
  23. Ho, Y.S.; McKay, G. A Comparison of Chemisorption Kinetic Models Applied to Pollutant Removal on Various Sorbents. Process Saf. Environ. Prot. 1998, 76, 332–340. [Google Scholar] [CrossRef]
  24. Yu, L. New insights into pseudo-second-order kinetic equation for adsorption. Colloids Surf. A. 2008, 320, 275–278. [Google Scholar] [CrossRef]
  25. Hamid, S.B.A.; Islam, M.M.; Das, R. Cellulase biocatalysis: Key influencing factors and mode of action. Cellulose 2015, 22, 2157–2182. [Google Scholar] [CrossRef]
  26. Chien, S.H.; Clayton, W.R. Application of Elovich Equation to the Kinetics of Phosphate Release and Sorption in Soils. Soil Sci. Soc. Am. J. 1980, 44, 265–268. [Google Scholar] [CrossRef]
  27. Can, M. Studies of the Kinetics for Rhodium Adsorption onto Gallic Acid Derived Polymer: The Application of Nonlinear Regression Analysis. Acta Phys. Pol. A 2015, 127, 1308–1310. [Google Scholar] [CrossRef]
  28. Chuah, L.F.; Klemeš, J.J.; Yusup, S.; Bokhari, A.; Akbar, M.M. A review of cleaner intensification technologies in biodiesel production. J. Clean. Prod. 2016, 146, 181–193. [Google Scholar] [CrossRef]
  29. Fromm, H.J. The Effect of Temperature and pH on Enzyme Activity; Springer: Berlin/Heidelberg, Germany, 1975; pp. 201–235. [Google Scholar] [CrossRef]
  30. Gou, C.; Wang, X.; Yu, Y.; Huang, J.; Wang, X.; Hui, M. One-step enzymatic hydrolysis of sweet potato residue after gelatinization for bioethanol production by Saccharomyces cerevisiae. Biomass Convers. Biorefinery 2023, 1–10. [Google Scholar] [CrossRef]
  31. Mokale, A.L.; Chio, C.; Khatiwada, J.R.; Shrestha, S.; Chen, X.; Han, S.; Li, H.; Jiang, Z.-H.; Xu, C.C.; Qin, B. Characterization of Cellulose-Degrading Bacteria Isolated from Soil and the Optimization of Their Culture Conditions for Cellulase Production. Appl. Biochem. Biotechnol. 2022, 194, 5060–5082. [Google Scholar] [CrossRef]
  32. Zhang, W.; Zhang, Y.; Yin, L.; Ruan, X. The characteristics of carbon sources for denitrification in groundwater from ten kinds of agricultural wastes. Acta Sci. Circumstantiae 2017, 37, 1787–1797. Available online: http://en.cnki.com.cn/Article_en/CJFDTotal-HJXX201705021.htm (accessed on 1 May 2017).
  33. Qi, L.; Li, L.; Yin, L.; Zhang, W. Study on the properties of denitrifying carbon sources from cellulose plants and their nitrogen removal mechanisms. Water Sci. Technol. 2021, 85, 719–730. [Google Scholar] [CrossRef] [PubMed]
  34. Li, D.; Dong, M.; Shim, W.J.; Kannan, N. Application of pressurized fluid extraction technique in the gas chromatography–mass spectrometry determination of sterols from marine sediment samples. J. Chromatogr. 2007, 1160, 64–70. [Google Scholar] [CrossRef]
  35. Li, D.; Park, J.; Oh, J.-R. Silyl Derivatization of Alkylphenols, Chlorophenols, and Bisphenol A for Simultaneous GC/MS Determination. Anal. Chem. 2001, 73, 3089–3095. [Google Scholar] [CrossRef] [PubMed]
  36. Ünver, H.; Polat, K.; Uçar, M.; Zengin, D. Synthesis and Keto-Enol Tautomerism in N-(2-Hydroxy-1-Naphthylidene) Anils. Spectrosc. Lett. 2003, 36, 287–301. [Google Scholar] [CrossRef]
  37. Taj-Aldeen, S.; Alkenany, K. Separation and partial purification of beta-glucosidase and two endoglucanases in Aspergillus niveus. Microbiol. 1996, 12, 91–98. Available online: https://pubmed.ncbi.nlm.nih.gov/9019140/ (accessed on 1 March 1996).
  38. Rahayu, F.; Tajima, T.; Kato, J.; Kato, S.; Nakashimada, Y. Ethanol yield and sugar usability in thermophilic ethanol production from lignocellulose hydrolysate by genetically engineered Moorella thermoacetica. J. Biosci. Bioeng. 2020, 129, 160–164. [Google Scholar] [CrossRef]
  39. Sharma, A.; Tewari, R.; Rana, S.S.; Soni, R.; Soni, S.K. Cellulases: Classification, Methods of Determination and Industrial Applications. Appl. Biochem. Biotechnol. 2016, 179, 1346–1380. [Google Scholar] [CrossRef]
  40. Kipper, K.; Väljamäe, P.; Johansson, G. Processive action of cellobiohydrolase Cel7A from Trichoderma reesei is revealed as ‘burst’ kinetics on fluorescent polymeric model substrates. Biochem. J. 2005, 385 Pt 2, 527–535. [Google Scholar] [CrossRef]
  41. Ohno, E.; Miyafuji, H. Production of disaccharides from glucose by treatment with an ionic liquid, 1-ethyl-3-methylimidozolium chloride. J. Wood Sci. 2014, 61, 165–170. [Google Scholar] [CrossRef]
  42. Glasser, W.G.; Atalla, R.H.; Blackwell, J.; Malcolm Brown, R.; Burchard, W.; French, A.D.; Klemm, D.O.; Nishiyama, Y.J.C. About the structure of cellulose: Debating the Lindman hypothesis. Cellulose 2012, 19, 589–598. [Google Scholar] [CrossRef]
  43. Jele, T.B.; Lekha, P.; Sithole, B. Role of cellulose nanofibrils in improving the strength properties of paper: A review. Cellulose 2021, 29, 55–81. [Google Scholar] [CrossRef]
  44. Ellis, L.B.; Gao, J.; Fenner, K.; Wackett, L.P. The University of Minnesota pathway prediction system: Predicting metabolic logic. Nucleic Acids Res. 2008, 36, W427–W432. [Google Scholar] [CrossRef] [PubMed]
  45. DeLorenzo, R.J.; Ruddle, F.H. Genetic control of two electrophoretic variants of glucosephosphate isomerase in the mouse (Mus musculus). Biochem. Genet. 1969, 3, 151–162. [Google Scholar] [CrossRef] [PubMed]
  46. Agarwal, V.; Dauenhauer, P.J.; Huber, G.W.; Auerbach, S.M. Ab initio dynamics of cellulose pyrolysis: Nascent decomposition pathways at 327 and 600 °C. J. Am. Chem. Soc. 2012, 134, 14958–14972. [Google Scholar] [CrossRef]
  47. Li, R.; Lin, Q.; Wang, Y.; Yang, W.; Liu, X.; Li, W.; Wang, X.; Wang, X.; Liu, C.; Ren, J. Brønsted acid-driven conversion of glucose to xylose, arabinose and formic acid via selective C–C cleavage. Appl. Catal. B 2021, 286, 119862. [Google Scholar] [CrossRef]
  48. Huber, G.W.; Iborra, S.; Corma, A. Synthesis of Transportation Fuels from Biomass: Chemistry, Catalysts, and Engineering. Chem. Rev. 2006, 106, 4044–4098. [Google Scholar] [CrossRef]
  49. Kelly, S.D.; Williams, D.M.; Nothof, J.T.; Kim, T.; Lowary, T.L.; Kimber, M.S.; Whitfield, C. The biosynthetic origin of ribofuranose in bacterial polysaccharides. Nat. Chem. Biol. 2022, 18, 530–537. [Google Scholar] [CrossRef] [PubMed]
  50. Bernat, K.; Wojnowska-Baryła, I.; Dobrzyńska, A. Denitrification with endogenous carbon source at low C/N and its effect on P(3HB) accumulation. Bioresour. Technol. 2008, 99, 2410–2418. [Google Scholar] [CrossRef]
  51. Dobbeleers, T.; D’aes, J.; Miele, S.; Caluwé, M.; Akkermans, V.; Daens, D.; Geuens, L.; Dries, J. Aeration control strategies to stimulate simultaneous nitrification-denitrification via nitrite during the formation of aerobic granular sludge. Appl. Microbiol. Biotechnol. 2017, 101, 6829–6839. [Google Scholar] [CrossRef]
  52. Zhu, D.; Zhang, P.; Xie, C.; Zhang, W.; Sun, J.; Qian, W.-J.; Yang, B. Biodegradation of alkaline lignin by Bacillus ligniniphilus L1. Biotechnol. Biofuels 2017, 10, 44. [Google Scholar] [CrossRef] [PubMed]
  53. Rodrigues, A.E. Comments on “Demonstration of a Process for the Conversion of Kraft Lignin into Vanillin and Methyl Vanillate by Acidic Oxidation in Aqueous Methanol”. Ind. Eng. Chem. Res. 2010, 49, 3500. [Google Scholar] [CrossRef]
  54. Song, S.; Zhang, J.; Gözaydın, G.; Yan, N. Production of terephthalic acid from corn stover lignin. Angew. Chem. Int. Ed. 2019, 58, 4934–4937. [Google Scholar] [CrossRef] [PubMed]
Figure 1. Carbon release kinetics under various enzyme activities.
Sustainability 15 08818 g001
Figure 2. Carbon release kinetics under various straw substrate amounts.
Sustainability 15 08818 g002
Figure 3. Carbon release amounts of various temperatures (a) and various pH values (b).
Sustainability 15 08818 g003
Figure 4. Total ion chromatogram of enzymatic straw carbon source sampled from 0 h to 48 h: (a) total chromatogram; (b) detailed chromatogram of region II; (c) detailed chromatogram labeled with molecular structures at 32 min (En-32 min). The black arrow depicts an enlarged view of region II.
Sustainability 15 08818 g004
Figure 5. Schematic diagram of enzymatic hydrolysis of straw cellulose. The black arrows represent the molecular structure of the three disaccharide monomers that are formed.
Sustainability 15 08818 g005
Figure 6. Total ion chromatogram of the SCS (a) and enzymatic SCS (b).
Sustainability 15 08818 g006
Figure 7. The degradation steps of straw cellulose.
Sustainability 15 08818 g007
Figure 8. Carbon source availability in denitrification using batch test, excluding endogenous nitrogen removal capacity (a), nitrate nitrogen concentration change in SCS (b), enzymatic SCS (c) and glucose carbon source (d).
Sustainability 15 08818 g008
Figure 9. Total ion chromatogram of the SCS (a) and enzymatic SCS (b) before and after denitrification.
Sustainability 15 08818 g009
Table 1. Parameters of rice straw for experiment.
Moisture Content Porosity *CarbonNitrogenCelluloseHemicelluloseLignin
(% wet weight)(%)(% dry mass)
Rice Straw22.7 ± 1.937.6 ± 1.843.4 ± 0.020.48 ± 0.0130.5 ± 0.225.1 ± 0.3616.6 ± 0.28
* Mercury intrusion porosimetry.
Table 2. Parameters of enzymolysis experiment.
Group 1Group 2Group 3Group 4
FPA (U/mL)0, 40, 160, 640, 1000640640640
Straw amount (g/L)201, 5, 20, 502020
Temperature (°C)45455–7545
Initial pH value4.54.54.52–10
Table 3. Kinetic fitting result of carbon release catalyzed by cellulase.
Enzyme
Activity
Pseudo-1st-OrderPseudo-2st-OrderElovich ModelInternal Diffusion Model
Qe
mg/g
k1
1/h
R2Qe
mg/g
k2
g/mg·h
R2α
mg/g·h
β
g/mg
R2Kint
mg/(g·h0.5)
CR2
0 U/mL21.910.330.98422.190.490.999713.780.920.99520.6419.750.6204
40 U/mL39.580.370.980339.170.740.992229.180.230.93924.6619.980.8
160 U/mL49.770.420.994449.331.010.995260.070.160.97645.7226.410.4002
640 U/mL62.10.50.730763.451.390.989160.060.10.9468.8427.40.4821
1000 U/mL64.310.560.883266.711.470.988569.170.090.95613.4615.230.9171
Table 4. Components of the SCS and enzymatic SCS.
SCSEnzymatic SCS
PeakComponentsPeakComponentsPeakComponents
1Terephthalic acid1Oxalic acid29Pinacol
2Methyl syringate2Gentisic acid302-Acetonaphthone
3Benzoic acid33-Hydroxypropionic acid31Dihydroxyacetophenone
4Glycerinum4Methyl vanillate32Phthalimide
52-Isopropylphenol5Lactic acid33Adipic acid
6Resacetophenone6Glycolic acid341,3-propanediol
7Methyl 2,4-dihydroxybenzoate73-Hydroxybenzoic Acid35Glycidol
83-Ethylphenol8 *D-Ribofuranose362,6-Ditert-butylphenol
92-Methylphenol9Benzoic acid374-n-Propylphenol
10Methyl vanillate10Glycerol38Erythritol
11Meso-Erythritol11Urea39Pyrogallol
124-tert-Butyl phenol12Gluconic acid404,4-Bibenzoic acid
13Pyrogallol13Propionic acid41Mercaptoacetone
14Oxalic acid14 *D-fructofuranose43DL-Arabinose
15D-glucofuranose152-Isopropylphenol44Ribonolactone
164-Hydroxysalicylic acid16Oxaluric acid46 *Glucofuranose
17 *Xylose17Glyceric acid48 *Glucopyranose
18 *Arabinofuranose18Succinic acid504-Hydroxybenzoic acid
19Xylitol19Quinoline51 *Xylose
20Vanillic acid20Syringol52Phthalic acid
21 *Open-chain glucose21Cuminic acid532-Hydroxy-Heptanoic acid
224-n-Propylphenol221,4-Butanediol54D-Arabinitol
23 *Glucopyranose232,4-Dihydroxybenzoic acid methyl ester55Isophthalic acid
25Fructofuranose242,3-Dihydroxy-acrylic acid57Terephthalic acid
26Isopropyl naphthalene25Glutaric acid60L-Fructose
29Mannitol26Pimelic acid65Glucuronic acid
31Sucrose272-Hydroxy-2-Pentaenoic acid68Open-chain glucose
28D-Glucosamine
SCSEnzymatic SCS
CategorySpeciesProportionCategorySpeciesProportion
Saccharides759.5%Saccharides1266.4%
VFAs514.4%VFAs2320.4%
Aromatics1526.1%Aromatics2013.2%
* 8 includes characteristic peaks 8, 42, 45, 47 and 49; *14 includes characteristic peaks 14 and 61; * 17 includes characteristic peaks 17 and 28; * 18 includes characteristic peaks 18 and 24; * 21 includes characteristic peaks 21 and 27; * 23 includes characteristic peaks 23 and 30; * 46 includes characteristic peaks 46, 59, 63 and 64; * 48 includes characteristic peaks 48, 56 and 66; * 51 includes characteristic peaks 51, 58, 62 and 67.
Table 5. Carbon source availability parameters.
CarbonΔC/ΔNRemove 1g N Requirement (g)AvailabilitySaccharides and VFAsCOD/N
Effective Carbon SourceTotal Carbon Source
SCS1.631.632.4766%73.9%4.4
Enzymatic SCS1.511.511.883.7%86.8%4.08
Glucose1.371.371.497.7%/3.7
Disclaimer/Publisher’s Note: The statements, opinions and data contained in all publications are solely those of the individual author(s) and contributor(s) and not of MDPI and/or the editor(s). MDPI and/or the editor(s) disclaim responsibility for any injury to people or property resulting from any ideas, methods, instructions or products referred to in the content.