Abstract
In December 2019, a novel coronavirus broke out in Wuhan City, Hubei Province, and, as the center of the coronavirus disease 2019 (COVID-19) epidemic, the economy and production throughout Hubei Province suffered huge temporary impacts. Based on the input–output and industrial pollution emissions data of 33 industrial industries in Hubei from 2010 to 2019, this article uses the non-parametric frontier analysis method to calculate the potential production losses and compliance costs caused by environmental regulations in Hubei’s industrial sector by year and industry. Research has found that the environmental technology efficiency of the industrial sector in Hubei is showing a trend of increasing year-on-year, but the overall efficiency level is still not high, and there is great room for improvement. The calculation results with and without environmental regulatory constraints indicate that, generally, production losses and compliance costs may be encountered in the industrial sector in Hubei, and there are significant differences by industry. The potential production losses and compliance costs in pollution-intensive industries are higher than those in clean production industries. On this basis, we propose relevant policy recommendations to improve the technological efficiency of Hubei’s industrial environment, in order to promote the high-quality development of Hubei’s industry in the post-epidemic era.
1. Introduction
Industry is a very important material production sector within the national economy, playing a crucial role in promoting regional economic development. Achieving sustainable industrial development generally requires at least the following basic conditions: sustainable input of production factors (i.e., capital and labor); sustainable utilization of resources and a bearable environmental capacity; an endogenous driving force of development, which is represented by the constantly increasing consumer demands of the population; and technical support that ensures the development of industry from a low level to a high level. However, large-scale industrial production inevitably brings about environmental pollution problems. Due to the typical negative external characteristics of environmental pollution, manufacturers do not voluntarily reduce their “bad” output. Therefore, government departments must formulate environmental regulation policies to force manufacturers to carry out energy-saving reductions. The impacts of energy-saving and emission-reduction behavior on economic development are extremely complex, and the impacts of different energy-saving and emission-reduction paths on the economic growth and development mode vary.
In the 21st century, the trend of heavy industry in China is once again driving rapid economic growth. The continuous increase in energy consumption and carbon emissions has put enormous pressure on China in terms of resource-use and the environment. This sector’s huge energy consumption leads directly to the production of nearly 30% of the global carbon emissions, ranking it first in the world, and China’s energy-saving and emission-reduction prospects are not optimistic. However, as the world’s largest emitter of greenhouse gases and the largest developing country, China has always adhered to the global temperature control goal of “within 2 degrees Celsius and striving for 1.5 degrees Celsius”, set out at COP27, actively advocating for the construction of a fair, reasonable, and win–win global governance system to address climate change. In this situation, studying the complex relationship between China’s industrial economy, energy use, and environment has become a focus of attention for academia and political decision-makers.
Hubei Province is located in the core area of central China, and is an important fulcrum for implementing the “Central Rise” strategy proposed by the Chinese government, holding a significant strategic position. In 2019, the added value of industries in Hubei Province above the designated size increased by 7.8%, 2.1 percentage points higher than the national average. The rate of growth in this area increased from 15th place in 2018 to 7th place, making it an important economic province in China. However, in December 2019, COVID-19 broke out in Wuhan City, Hubei Province. As the center of the epidemic, Hubei Province was most seriously affected. From January to February 2020, the whole province was closed down, and production only resumed gradually in March 2020, which had great temporary effects on the industrial development of Hubei Province. According to data from the Hubei Provincial Bureau of Statistics, in the first two months of 2020, the overall economic production in Hubei Province significantly dropped, with the added value of industries of above designated size decreasing by 46.2%. Among these, heavy industry decreased by 48.1%, and light industry decreased by 43.1%. The transportation equipment manufacturing industry and the textile industry experienced the largest declines, at 65.8% and 57.8%, respectively.
In 2022, 12 government departments in Hubei Province jointly formulated the “Action Plan for Revitalizing Industrial Economic Operation and Promoting High Quality Industrial Development” document, aiming to ensure the sustained and healthy development of Hubei’s industry after the epidemic via 13 measures. Based on the above context, this article will outline the necessary conditions for sustainable industrial development, combined with the actual situation of industrial development in Hubei, and use a dynamic behavior analysis model to evaluate the impacts of energy-saving and emission-reduction behaviors on the potential output and total factor productivity of Hubei’s industrial sector. It will then explore the environmental regulation policy system that is most suitable for the development of Hubei’s industry, and will promote the sustainable development of Hubei’s industry in the post-epidemic era, providing theoretical support and policy guidance for the construction of a “Beautiful Hubei”. This study makes contributions to the existing literature in two ways: firstly, compared with more commonly used econometric analysis methods, the non-parametric frontier analysis models used in this study can more accurately identify the impacts of environmental policies on output and efficiency, expand the depth of existing environmental regulation theory, and enrich the research methods in the existing literature. Secondly, there are few studies on the impact of the COVID-19 on the development of Hubei’s industrial economy at present, so the research results of this paper will provide a decision-making basis for the high-quality development of Hubei’s industry in the post-epidemic era; further, our topic selection is innovative.
The rest of this article is organized as follows: Section 2 addresses the relevant theories and literature; Section 3 establishes an activity analysis model, outlines the sample selection, and describes the variables; Section 4 follows with the empirical results; Section 5 provides concluding remarks and policy implications; and finally, Section 6 summarizes the full text, and outlines future prospects.
2. Literature Review
The impacts of energy-saving and emission-reduction behaviors on economic development are extremely complex, and the impacts of different energy conservation and emission reduction paths on economic growth and development mode transformation vary [1,2,3]. Many scholars have used different methods and perspectives to study the environmental efficiency of industry [4,5,6,7,8]. Unlike the traditional concept of technological efficiency, environmental efficiency is an efficiency evaluation system based on environmental technology. It is a form of technical efficiency that considers environmental pollution factors, and is often used to characterize the coordinated development of energy, the environment, and the economy in a country or region.
In the process of modern large-scale industrial production, the generation of a large number of harmful substances is inevitable (such as industrial wastewater, exhaust gas, solid waste, etc.). As unpopular and stubborn industrial by-products, their disposal necessitates the use of the scarce resources of the enterprise, affecting its normal output. The existing literature often refers to these undesirable by-products as “bad” products or undesirable outputs, while the corresponding normal output is called a “good” product or desired output [9,10]. The classic data envelopment analysis (DEA) model is based on “output maximization”. When a decision-making unit (DMU) achieves maximum output with minimal input, this DMU is most efficient. Lower amounts of a “bad” output are better. Their increase will reduce the efficiency level of the decision-making unit. When considering undesirable outputs, the most highly desired outcome is to produce more “good” products and fewer pollution emissions with minimal resource input. At this point, the production possibility set simulated by the classic DEA model ceases to be applicable, and a new output set needs to be constructed. Due to the special nature of environmental efficiency, effectively measuring undesirable outputs becomes the key to evaluating environmental efficiency.
There are currently two different approaches to measuring the impact of undesired output on the total output: one is to consider pollution control costs as an input factor, whereby reducing pollution output requires increased investment in pollution control resources; the other is to treat pollution as a “bad” product, and reducing this “bad” product involves the consumption of some resources, resulting in a decrease in “good” products [11,12]. Under the first approach, it is difficult to clarify the resource investment allocated for pollution control and the part allocated for producing “good” products, and pollution control costs are treated as an input factor. Therefore, this model does not conform to actual environmental governance behavior, and has thus been widely criticized in the research [12]. The latter approach skillfully achieves both increased output and reduced pollution, thus fully promoting sound and rapid economic development.
The main research methods used by different researchers are parametric and non-parametric methods, but non-parametric methods are more common. Färe et al. [13,14] first proposed the weak disposability of input and output to deal with pollution variables based on the logical idea that reducing “bad” output must involve the sacrifice of “good” outputs. However, the nonlinear programming solution in the empirical process is extremely cumbersome, and its scope of application is greatly limited. It was not until Chambers and Chung [15,16] proposed the idea of a directional environmental distance function that the efficiency evaluation problem of undesired outputs was effectively resolved for the first time. Since then, many scholars have conducted model optimization research from different perspectives, based on their research. Hailu and Veeman [17] treated non-desirable output variables as inputs, and Scheel [18] treated non-desirable outputs as desirable output through reciprocal transformations. Although both methods minimize the non-desirable output as much as they can, their conditions are far from those of the actual production process. Seiford and Zhu [19] found a transformation method that more effectively solves the efficiency evaluation problem using undesired output. However, the convex constraints in linear programming mean that no solution may be yielded when the return to scale is constant. Tone et al. [20] further proposed a non-radial and non-angular SBM model that involves the relaxation of input and output, which better addresses the deviation caused by the radial and angular selection of input and output. In recent years, these research methods have been widely used by scholars such as Tu (2011) [21], Chen (2013) [22], Song (2013) [23,24], Rubashkina (2015) [25], and Tu (2022) [26] to analyze various energy-saving and emission-reduction behaviors. In addition to the aforementioned studies, parameter methods are also commonly used to explore the complex relationship between energy, the environment, and the economy (3E), greatly enriching existing research on the 3E problem. For example, Tomiwa et al. [27] applied cross-sectional autoregressive distributed lag as the main model to determine the effects of country risks and renewable energy consumption on environmental quality. Tomiwa and Sami [28] found that nuclear energy and government stability positively determine environmental quality, while economic growth, financial development, and socioeconomic conditions degrade environmental quality in China. Andrew and Tomiwa [29] employed Fourier approaches to examine the environmental aspects of resource productivity, environmental-related technologies, and export intensity.
As one of China’s 12 major industrial provinces with a leading economic growth rate, promoting high-quality industrial development will be the key to the revitalization of Hubei Province after the epidemic. However, in the face of an external macroeconomic downturn, as well as internal resource and environmental pressures, the prospects for industrial development in Hubei are not positive. Unfortunately, few existing studies are dedicated to assessing the sustainable development of industry in Hubei post-epidemic. Based on this, this article uses the input output and industrial pollution emissions data of 33 industrial industries in Hubei Province from 2010 to 2019, and uses non-parametric frontier analysis methods to systematically calculate the potential production losses and compliance costs caused by environmental regulations placed on the industrial sector in Hubei Province. This provides a useful scientific basis for decision-making that will promote the high-quality development of industry in Hubei Province in the post epidemic era, and enriches the existing research on a practical level.
3. Theoretical Framework, Model and Data
3.1. Theoretical Framework
In order to yield a more intuitive understanding of the basic principle of the directional distance function, we will use the diagram below. In Figure 1, the horizontal axis represents the undesirable output b, and the vertical axis represents the desirable output y. Since point A is located within the efficient production frontier, whether the output vector maps from point A to point B or point C depends on the technical assumptions of different dispositions of the undesirable output. If the undesirable output is freely disposed of, this disposal does not require additional costs, and the distance function value βf is equal to the distance ratio of AC/Og, given that energy and environment do not constrain output in this scenario, so production at point C will be the most effective. However, in real production, reducing undesirable output cannot be achieved without cost, and the resources of manufacturers will be used to produce a “good” output. Therefore, this behavior of reducing the “bad” output is not voluntary, and must be achieved through mandatory environmental regulations. At this point, the output vector is mapped from point A to point B, and the distance function value βw is equal to AB/Og, which is the standard directional distance function (DDF) scenario described in the literature, providing an analytical model for energy-saving and emission-reduction behaviors under environmental governance.
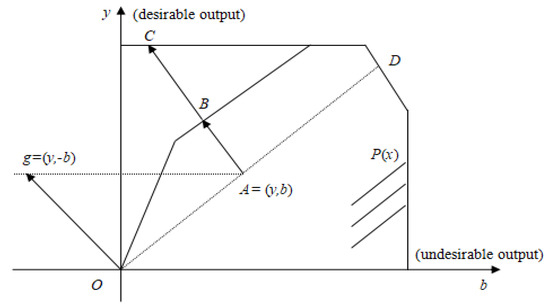
Figure 1.
The economic mechanism of the standard DDF model.
3.2. Model
Based on the standard DDF model proposed by Chambers and Chung [16], this study selected 33 two-digit industries (i = 1, 2, …, 33) in Hubei Province as the analysis object, and the research period was 10 years in total (t = 2010, 2011, …, 2019). Each industry unit has three kinds of inputs x (j = 1, 2, 3; i.e., capital, labor, and energy, respectively); one kind of desirable output y (industrial value added); and one kind of undesirable output b (industrial SO2 emission). xi, yi, and bi represent the column vectors of the i industry’s input, desirable output, and undesirable output, respectively. Then, the directional distance function of the i industry at time t can be defined as
where, in a standard case, g = (y, −b) represents the direction vector of “good” and “bad” output changes. β represents the maximum possible proportions of “good” and “bad” output with a given input level; that is, the measured directional distance function value. The directional distance function is calculated by applying a piecewise linear production technique to the neighborhood of each observation value, and solving a series of linear programming equations.
In series (2), the inequality constraints of desirable output (y), desirable output (b), and input factor (x) indicate that they are freely disposed. However, in real production, reducing the “bad” output often comes at a cost. No manufacturer will voluntarily reduce their “bad” output, and government environmental regulations must be established to force manufacturers to save energy and reduce emissions. Therefore, it is assumed that the weak disposal of undesired output is more consistent with the real production activities of the manufacturer.
From a mathematical point of view, the formulation of the equation representing the undesired output (b) in the above plan (3) imparts upon it a weak processing technical assumption, that is, a reduction in the undesired output will inevitably lead to a simultaneous reduction in the desirable output. Therefore, the difference between the DDF values of the above two plans precisely reflects the potential production losses caused by the lack of observable free disposal, i.e., (Boy, Tolley, and Pang) [30]. At this time, the impact of environmental regulation on output, that is, the cost of compliance, can be expressed as .
3.3. Description of Variables and Data
The differences in the responses of different industries to environmental regulations make it necessary to first divide the industries. Based on the different purposes and requirements of their research, different researchers put forward different classification criteria. According to the industrial classification standard of the Industrial Classification of the National Economy (GB/4754-2022), and the classification method of Shen [31] and Tu [32], the industrial sector is divided here into pollution-intensive and cleaner industries, according to their average emission intensity, as shown in Table 1.

Table 1.
Industrial classification.
In this paper, 33 industries from Hubei Province (Table 1) are selected as the basic research unit, with the gross industrial output value as the output index, the capital stock, and the number of employees; the energy consumption as the input index of factor resources; and the industrial emissions as the indicator of waste pollution. See Table 2 for descriptions of the corresponding variables and data.
Table 2.
Variables and description of data sources.
Table 3 shows the descriptive statistics of each variable. From the perspective of input of factor resources, pollution-intensive industries rank far higher than cleaner production industries in terms of capital investment and energy consumption, but the number of employees absorbed here is lower than that of cleaner production industries, and the energy consumption of pollution-intensive industries varies greatly among the different sectors, with a standard deviation of 1332.53. From the perspective of industrial output, the total industrial output value created by cleaner production industries is higher than that of pollution-intensive industries, and the industrial exhaust emissions here are far lower than those of the pollution-intensive industries, which indicates that cleaner production industries are better than pollution-intensive industries in controlling their pollution emissions and increasing their desirable output.
Table 3.
Descriptive statistics.
4. Empirical Results
According to series (2) and (3), the optimal solution to the ineffective rate under conditions of free disposal and weak disposal is calculated using the Lingo13.0 software, and the results are shown in Table 4 and Table 5. The annual calculation results in Table 4 show the following: (1) under the constraints of environmental regulations, the average environmental inefficiency rate of the whole sample industry is 0.101, and the average efficiency value reaches 0.825, which indicates that during the study period, the emission of industrial SO2 in Hubei has been reduced by 10.1%. Further, an output growth of 10.1% can still be achieved, and there is still much room for improvement in the industrial environmental efficiency of Hubei. (2) In the absence of environmental regulations, the average industrial environmental efficiency in Hubei is 0.762, which is 6.33% lower than the average efficiency with environmental regulations. Environmental regulation does cause a degree of potential loss in the industrial economy of Hubei (the average efficiency loss is 10%), but it also brings about a 6.33% improvement in environmental efficiency. (3) According to the test results for industrial heterogeneity, the average environmental efficiency of clean production industries reaches 0.827 without environmental regulation constraints, which is significantly higher than the average level of 0.694 reached by pollution-intensive industries. After the introduction of environmental regulations, the average efficiency level of the two industries improves, with the cleaner production industry reaching the high efficiency level of 0.883, while the pollution-intensive industry remains at the low level of 0.758. (4) The values of efficiency loss caused by environmental regulation in pollution-intensive industries and cleaner production industries are 12.1% and 7.5%, respectively, indicating that cleaner production industries are better than pollution-intensive industries in avoiding environmental risks.
Table 4.
Calculation results of environmental technical efficiency and potential production loss of Hubei industries by year.
Table 5.
Calculation results of potential production losses and compliance costs of industries in Hubei.
The results of calculation by industry, shown in Table 5, indicate the following: (1) in the sample period, the average potential production loss of pollution-intensive industries caused by environmental regulation is 10.3%, and that of cleaner production industries is 1.8%. The average compliance costs are CNY 16.903 billion and CNY 2.641 billion, respectively. Environmental regulation has had a significant impact on the economic output of Hubei’s industry, especially on pollution-intensive industries, the effect on which is significantly greater than on cleaner production industries. (2) Under the conditions of environmental regulations, such as those applied to the non-metal mineral product industry; the electric power, gas, and water production and supply industry; the extraction of petroleum and natural gas industry; the manufacture of paper and paper products industry (classified as pollution-intensive); the textiles industry; the wine, beverages and tea industry; the textile wearable apparel industry; and the foods industry, a higher level of environmental efficiency is achieved—above the averages of the industries within the scope of their classification. However, for the tobacco industry; the leather, fur, feather, and related industry; the electric machinery and equipment industry; the computer industry; and the communication equipment and other electronic equipment industry, these values are lower—below the average environmental efficiency. (3) It can be seen from Figure 2 that the impact of regulations on the non-metal mineral products industry; the electric power, gas, and water production and supply industry; the extraction of petroleum and natural gas industry; the textile industry; the processing of food from agricultural production industry; and the wine, beverages, and tea industry is much greater than that on other industries. Among these, the potential production losses experienced in the non-metal mineral products industry reach 41.4%, ranking first among all industries. As the compliance cost is the result of the combined effects of potential production losses and total output share, and the non-metal mineral products industry has a large output share, its potential production losses rank first among all industries, which leads directly to its compliance cost also ranking first. (4) We also found that the environmental technology efficiency of industries, such as food manufacturing and beverage services, which are clean production industries, is generally low, and the potential production losses are also high in the same industry. This may be because food and beverage services related to tourism activities require higher energy consumption, leading to higher greenhouse gas emissions [35], thus making them an important contributor to all air pollutants except PM2.5, which is easily overlooked by policy-makers.
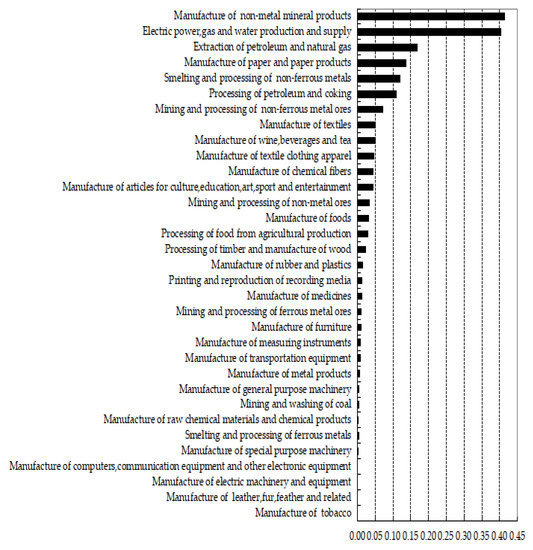
Figure 2.
Comparison of potential production losses across all of Hubei’s industry.
5. Discussions and Policy Implication
Environmental regulations have improved the overall environmental efficiency of Hubei’s industries, but the clean production industry still plays a leading role in improving industrial environmental efficiency. The environmental efficiency of pollution-intensive industries is lower than the national average, and a few traditional heavy industries with high energy consumption and emissions have begun to limit improvements in the overall environmental efficiency of the industry. Therefore, in terms of industrial structure adjustment, the provincial government needs to reconsider the optimal allocation of production factors when formulating relevant industrial policies, accelerate the development of strategic emerging industries, and restrict the development of certain high-energy consumption and emission-intensive industries. In terms of energy structure adjustment, we will develop clean coal technology through environmental technology innovation; encourage the development and utilization of clean energy, new energy, and renewable energy; and gradually reduce our dependence on primary energy such as coal.
Relying on environmental technology innovation to reduce energy intensity and improve energy productivity is the key to improving Hubei’s industrial environmental efficiency. On the one hand, we should encourage enterprises to pursue technological innovation, vigorously develop a circular economy, gradually establish a sound incentivizing mechanism for clean production, and promote the transformation of pollution-intensive industries from traditional end-treatment to clean production methods. On the other hand, we should also speed up the construction of ecological industrial parks; create a complete ecological industrial chain with small circulation among enterprises, medium circulation within the park, and social systemic circulation via the concept of the circular economy; improve the overall efficiency of the utilization of resources; and minimize waste discharge.
The results of Industry-specific testing show that there are significant differences in the responses of industries with different characteristics to environmental regulations. Formulating regulatory policies based on industry heterogeneity will be more conducive to the universally beneficial development of Hubei’s industry. Industries sensitive to environmental regulation can consider prudent and relaxed regulatory policies to reduce the negative impacts of regulation on output, and strengthen environmental supervision and law enforcement to prevent opportunism. Industries that are not sensitive to regulatory responses should adopt steadily strengthened environmental regulatory policies.
The use of energy-saving and emission-reduction technologies in high-energy-consuming industries represents the core of Hubei’s industrial green transformation, and the technical route of green industrial transformation is designed with a focus on three levels: micro, meso, and macro. At the micro level, we should encourage the development of key technologies for energy conservation and emission reduction, gradually eliminate outdated production capacities, and resolve excess production capacities. At the meso level, we should develop a circular economy with remanufacturing, and continue to promote industrial green manufacturing. We should build a regional green manufacturing system at the macro level. By establishing a system of linkage between the three levels, we can accelerate the green transformation and development of Hubei’s industry.
6. Conclusions and Outlook
Using the input–output and pollution emission data of 33 double-digit industries in Hubei, this paper constructs a DDF model, and uses the non-parametric DEA method to comprehensively calculate the potential production losses and compliance costs by year and industry. Our results show that, since 2010, the level of industrial environmental inefficiency in Hubei has undergone a downward trend year-on-year, indicating that the environmental regulation policies implemented in recent years have improved the industrial environmental efficiency to a certain extent, but the overall efficiency level is not high, and there is still much room for improvement. Environmental regulations have generally levied efficiency losses and regulation costs upon industries in Hubei, and there are significant differences between industries. The regulation costs of pollution-intensive industries are significantly higher than those of cleaner production industries.
Due to the influence of various subjective and objective factors, there are still some limitations to the research conducted in this article, and further in-depth explorations will be needed in future research. First of all, in order to limit the impact of COVID-19 on the statistical data and increase the reliability of our research conclusions, this paper has only used sample data from 2010 to 2019, and the research conclusions only represent the basic situation of Hubei’s industrial environmental efficiency during this period. It is also necessary to study the sustainable development of Hubei’s industry in the post-epidemic era from a dynamic perspective, according to China’s economic developmental trajectory. This is another issue worth studying. Secondly, most existing research focuses on the 3E problem at the macro level. Although this article extends from the macro-economic level to the meso-economic level, the integration of the material flow at the industrial technological level with the value flow at the economic level, as well as the evaluation and analysis of the micro effects, are important topics of future research. Despite these limitations, this article has made important contributions to the study of sustainable industrial development in Hubei province.
Author Contributions
Conceptualization, X.X. and H.T.; methodology, X.X.; software, H.T.; validation, L.W. and H.T.; investigation, H.T. and L.W.; resources, X.X.; data curation, H.T. and L.W.; writing—original draft preparation, H.T.; writing—review and editing, H.T. and L.W. All authors have read and agreed to the published version of the manuscript.
Funding
This research is supported by the Philosophy and Social Sciences Research Project of Education Department of Hubei Province (No. 22Y171).
Institutional Review Board Statement
Not applicable.
Informed Consent Statement
Not applicable.
Data Availability Statement
Not applicable.
Acknowledgments
We express our sincere gratitude to the participants who agreed to participate in this study.
Conflicts of Interest
The authors declare no conflict of interest.
References
- Barbera, A.; Mcconnell, V. The impact of environmental regulations on industry productivity: Direct and indirect effects. J. Environ. Econ. Manag. 1990, 18, 50–65. [Google Scholar] [CrossRef]
- Porter, M.E.; Van der Linde, C. Green and competitive: Ending the stalemate. Harv. Bus. Rev. 1995, 73, 120–134. [Google Scholar]
- Färe, R.; Grosskopf, S.; Pasurka, C. Environmental production functions and environmental directional distance functions. Energy 2007, 32, 1055–1066. [Google Scholar] [CrossRef]
- Lanoie, P.; Patty, M.; Lajeunesse, R. Environment regulation and productivity: Testing the Porter Hypothesis. J. Product. Anal. 2008, 30, 121–128. [Google Scholar] [CrossRef]
- Chen, S.Y.; Zhang, J. Empirical research on fiscal expenditure efficiency of local governments in China. Soc. Sci. China 2009, 30, 21–34. [Google Scholar]
- Tombe, T.; Winter, J. Environmental policy and misallocation: The productivity effect of intensity standards. J. Environ. Econ. Manag. 2015, 72, 137–163. [Google Scholar] [CrossRef]
- Korhonen, J.; Patari, S.; Toppinen, A.; Tuppura, A. The role of environment regulation in the future competitiveness of the pulp and paper industry: The case of the sulfur emissions directive in northern Europe. J. Clean. Prod. 2015, 108, 864–872. [Google Scholar] [CrossRef]
- Zhou, Y.; Zhu, S.; He, C. How do environmental regulations affect industrial dynamics? Evidence from China’s pollution-intensive industries. Habitat Int. 2017, 60, 10–18. [Google Scholar] [CrossRef]
- Chung, Y.; Färe, R.; Grosskops, S. Productivity and undesirable outputs: A directional distance function approach. J. Environ. Manag. 1997, 51, 229–240. [Google Scholar] [CrossRef]
- Tu, Z.G.; Cao, Y.; Liu, B.T. Can Environmental Regulations Promote Regional Industrial Transfer? Sustainability 2023, 15, 5780. [Google Scholar] [CrossRef]
- Chen, S.Y. Energy saving and emission reduction and win-win development of China’s industry: 2009–2049. Econ. Res. 2010, 3, 129–143. [Google Scholar]
- Tu, Z.G. Coordination of environment, resources and industrial growth. Econ. Res. 2008, 2, 93–105. [Google Scholar]
- Färe, R.; Grosskopf, S.; Lovell, C.; Pasurka, C. Multilateral productivity comparisons when some outputs are undesirable:A nonparametric approach. Rev. Econ. Stat. 1989, 71, 90–98. [Google Scholar] [CrossRef]
- Färe, R.; Grosskopf, S.; Lovell, C.; Yaisawarng, S. Derivation of shadow prices for undesirable output:A distance function approach. Rev. Econ. Stat. 1993, 75, 374–380. [Google Scholar] [CrossRef]
- Chambers, R.G.; Chung, Y.; Färe, R. Benefit and distance function. J. Econ. Theory 1996, 70, 407–419. [Google Scholar] [CrossRef]
- Chambers, R.G.; Chung, Y.; Färe, R. Profit, directional distance functions, and nerlovian efficiency. J. Optim. Theory Appl. 1998, 98, 351–364. [Google Scholar] [CrossRef]
- Hailu, A.; Veeman, T. Non-parametric productivity analysis with undesirable output:An application to the Canadian pulp and paper industry. Am. J. Agric. Econ. 2001, 83, 605–616. [Google Scholar] [CrossRef]
- Scheel, H. Undesirable output in efficiency valuations. Eur. J. Oper. Res. 2001, 132, 400–410. [Google Scholar] [CrossRef]
- Seiford, L.; Zhu, J. Modeling undesirable factors in efficiency evaluation. Eur. J. Oper. Res. 2002, 142, 16–20. [Google Scholar] [CrossRef]
- Tone, K.; Tsutsui, M. Applying an efficiency measure of desirable and undesirable outputs in DEA to U.S. Electr. Util. J. Cent. Cathedra 2011, 4, 236–249. [Google Scholar] [CrossRef]
- Tu, Z.G.; Liu, L.k. Evaluation of China’s industrial efficiency considering energy and environmental factors: Provincial data analysis based on SBM model. Econ. Rev. 2011, 2, 55–65. [Google Scholar]
- Chen, S.Y. What is the potential impact of a taxation system reform on carbon abatement and industrial growth in China. Econ. Syst. 2013, 37, 369–386. [Google Scholar] [CrossRef]
- Song, M.L.; Wang, S.H. Environmental regulation, technological progress and economic growth. Econ. Res. 2013, 3, 122–134. [Google Scholar]
- Song, M.L.; Wang, S.H.; Liu, Q.L. Environmental efficiency evaluation considering the maximization of desirable outputs and its application. Math. Comput. Model. 2013, 58, 1110–1116. [Google Scholar] [CrossRef]
- Rubashkina, Y.; Galeotti, M.; Verdolini, E. Environmental regulation and competitiveness: Empirical evidence on the Porter Hypothesis from European manufacturing sectors. Energy Policy 2015, 83, 288–300. [Google Scholar] [CrossRef]
- Tu, H.X.; Dai, W.; Xiao, X. Study on the environment efficiency of the Chinese cement industry based on the undesirable output DEA model. Energies 2022, 15, 3396. [Google Scholar] [CrossRef]
- Tomiwa, S.A.; Mustafa, T.K.; Mehmet, A.; Mamdouh, A.S. Role of country risks and renewable energy consumption on environmental quality: Evidence from MINT countries. J. Environ. Manag. 2023, 327, 116884. [Google Scholar]
- Tomiwa, S.A.; Sami, U. Formulating sustainable development policies for China within the framework of socioeconomic conditions and government stability. Environ. Pollut. 2023, 328, 121673. [Google Scholar]
- Andrew, A.A.; Tomiwa, S.A. The potency of resource efficiency and environmental technologies in carbon neutrality target for Finland. J. Clean. Prod. 2023, 389, 136127. [Google Scholar]
- Boy, G.A.; Tolley, G.; Pang, J. Plant level productivity, efficiency, and environmental performance of the container glass industry. Environ. Resour. Econ. 2002, 23, 29–43. [Google Scholar]
- Shen, N. Environmental efficiency, industry heterogeneity and optimal regulation intensity: Nonlinear test of panel data of China’s industrial industry. China Ind. Econ. 2012, 3, 56–68. [Google Scholar]
- Tu, H.X.; Xiao, X. Industry heterogeneity, efficiency loss and environmental regulation cost: An empirical test based on DDF panel data of China’s sub industries. J. Yunnan Univ. Financ. Econ. 2014, 1, 21–29. [Google Scholar]
- Hubei Provincial Statistics Bureau Web. Available online: http://tjj.hubei.gov.cn/tjsj/sjkscx/tjnj/qstjnj (accessed on 10 February 2023).
- National Bureau of Statistics Bureau Web. Available online: http://www.stats.gov.cn/sj/ndsj (accessed on 15 February 2023).
- Muhammad, I.; Sami, U.; Asif, R.; Cai, J.; Tomiwa, S.A. Unleashing the dynamic impact of tourism industry on energy consumption, economic output, and environmental quality in China:A way forward towards environmental sustainability. J. Clean. Prod. 2023, 387, 135778. [Google Scholar]
Disclaimer/Publisher’s Note: The statements, opinions and data contained in all publications are solely those of the individual author(s) and contributor(s) and not of MDPI and/or the editor(s). MDPI and/or the editor(s) disclaim responsibility for any injury to people or property resulting from any ideas, methods, instructions or products referred to in the content. |
© 2023 by the authors. Licensee MDPI, Basel, Switzerland. This article is an open access article distributed under the terms and conditions of the Creative Commons Attribution (CC BY) license (https://creativecommons.org/licenses/by/4.0/).