Article

A New Approach to Extracting Tourism Focus Points from Chinese Inbound Tourist Reviews after COVID-19

1
Doctoral Course in Manufacturing Engineering, Kitami Institute of Technology, Kitami 090-8507, Japan
2
Department of Computer Science, Kitami Institute of Technology, Kitami 090-8507, Japan
3
Department of Administrative Studies, Prefectural University of Kumamoto, Kumamoto 862-0920, Japan
4
Master Course in Computer Science, Kitami Institute of Technology, Kitami 090-8507, Japan
*
Author to whom correspondence should be addressed.
Current address: Kitami Institute of Technology, Koencho 165, Kitami 090-8507, Japan.
Sustainability 2023, 15(11), 8748; https://doi.org/10.3390/su15118748
Submission received: 6 April 2023 / Revised: 19 May 2023 / Accepted: 24 May 2023 / Published: 30 May 2023
(This article belongs to the Special Issue Rebuilding Sustainable Global Tourism after COVID-19)

Abstract

:
The number of inbound tourists in Japan has been increasing steadily in recent years. However, due to the COVID-19 pandemic, the number of inbound tourists decreased in 2020. This is particularly worrisome for Japan, as the number of inbound tourists is expected to reach 60 million per year by 2030. In order to help Japan’s tourism industry to recover from the pandemic, we propose a method of identifying elements that attract the attention of inbound tourists (focus points) by analyzing reviews on tourist sites. We focus on Hokkaido, a popular area in Japan for tourists from China. Our proposed method extracts high-frequency n-gram patterns from reviews written by Chinese inbound tourists, showing which aspects are mentioned most often. We then use seven types of motivational factors for tourists and principal component analysis to quantify the focus points of each tourist destination. Finally, we estimate the focus points by clustering the n-gram patterns extracted from the tourists’ reviews. The results show that our method successfully identifies the features and focus points of each tourist spot.

1. Introduction

The COVID-19 pandemic has had a profound impact on the global tourism industry. According to the World Tourism Organization [1], international tourist arrivals fell by 72% in 2020 compared to the previous year. The impact of the pandemic on the tourism industry in Asia and the Pacific has been particularly severe, with international arrivals falling by 84% in 2020 [1]. The pandemic has led to the closure of many tourism-related businesses, such as hotels, restaurants and airlines, resulting in job losses and economic hardship for many people in the tourism sector. To control the spread of the virus, many countries have implemented travel restrictions and quarantine measures, further reducing international travel. The pandemic has also accelerated the trend toward domestic tourism, with many people choosing to travel within their own countries rather than abroad. However, as vaccines become more widely available and travel restrictions are gradually lifted, the tourism industry is showing signs of returning to pre-pandemic levels of activity.
The Japanese government has launched the “Visit Japan” campaign, with the goal of reaching 40 million inbound tourists annually by 2020 and 60 million by 2030 [2]. However, due to the significant impact of the coronavirus pandemic, the number of tourists has decreased drastically. According to an announcement by the Japan National Tourism Organization, the number of inbound tourists in Japan in April 2020 had decreased by 100% compared to the same month of the previous year [3]. It has also been pointed out that the impact of the COVID-19 pandemic on the tourism industry is more severe than that of the Great East Japan Earthquake in 2011 [4].
According to the “White Paper on Tourism in Japan, 2020”, issued by the Japan Tourism Agency of the Ministry of Land, Infrastructure, Transport and Tourism, the plan is to “further enhance the attractiveness of Japan in order to revive inbound tourism after COVID-19, and to promote the recovery of the tourism industry, improve local tourism resources that attract domestic and foreign tourists, and promote the development of reception environments that utilize cutting-edge technology during the period before recovery” [5]. Therefore, it has become crucial to develop strategies to revive inbound tourism with a focus on the post-COVID-19 era.
In order to rebuild inbound tourism activities after COVID-19, it is necessary to objectively understand and utilize the points that attract foreign tourists in the future. The research question of this study is the following: What are the underlying motivations that drive tourists to visit certain destinations, and how can we use a statistical method to identify and extract the interests of tourists from online reviews that are related to these motivations?
Previous studies have used subjective approaches, such as surveys and expert evaluations, or relied solely on keyword or topic extraction techniques, which may not account for the full range of factors that affect tourists. Therefore, we propose a new statistical method to objectively capture the interests of Chinese tourists visiting Japanese tourist destinations and identify the main tourism motivations associated with them. Furthermore, since our proposed method is not language-dependent, we can apply our method to other languages and countries, making it useful for global tourism where multilingualism is involved. Moreover, by using our method to compare samples from before and after COVID-19, we can demonstrate the differences in the focus points of tourists. This means that our approach can help to prepare for the next emergency situation affecting tourism.
In this study, we propose a method for automatically extracting focus points, which include attention-grabbing aspects and related tourism motivations, from reviews written by inbound tourists about tourist spots. First, we extracted keywords from the reviews related to inbound tourism at each tourist spot. Then, we identified the most frequently occurring n-gram patterns that included the previously extracted keywords. Next, we assigned scores to the n-gram patterns based on the seven types of motivational factors that influence tourists. We then performed principal component analysis (PCA) on the scoring results and used the obtained principal component charts to determine the focus points of the tourist destinations. Finally, we applied clustering methods to the n-gram patterns to further analyze the details of the focus points. The experimental results indicate the interests of tourists. In addition, the corresponding motivations toward different tourist spots were estimated.
In this paper, we focus on tourists from China, who accounted for the majority of inbound tourism in Japan before the outbreak of the COVID-19 pandemic. In addition, we analyze reviews of popular tourist spots in Hokkaido, which is one of the top destinations for inbound tourists in Japan.
The overall structure of this paper is as follows. Section 1 introduces the main idea of this study. Section 2 discusses related works. In Section 3, we explain the details of our methods and each step of the research procedure. In Section 4, we describe the experiments and analyze the results. In Section 5, we discuss the results and verify the proposed methods. Finally, in Section 6, we draw conclusions about this study.

Contributions of This Study

This paper makes several contributions to the field of tourism research. The main contributions can be summarized as follows:
  • A novel method for identifying the focus points of tourist sites based on the analysis of reviews of tourist sites written by inbound tourists;
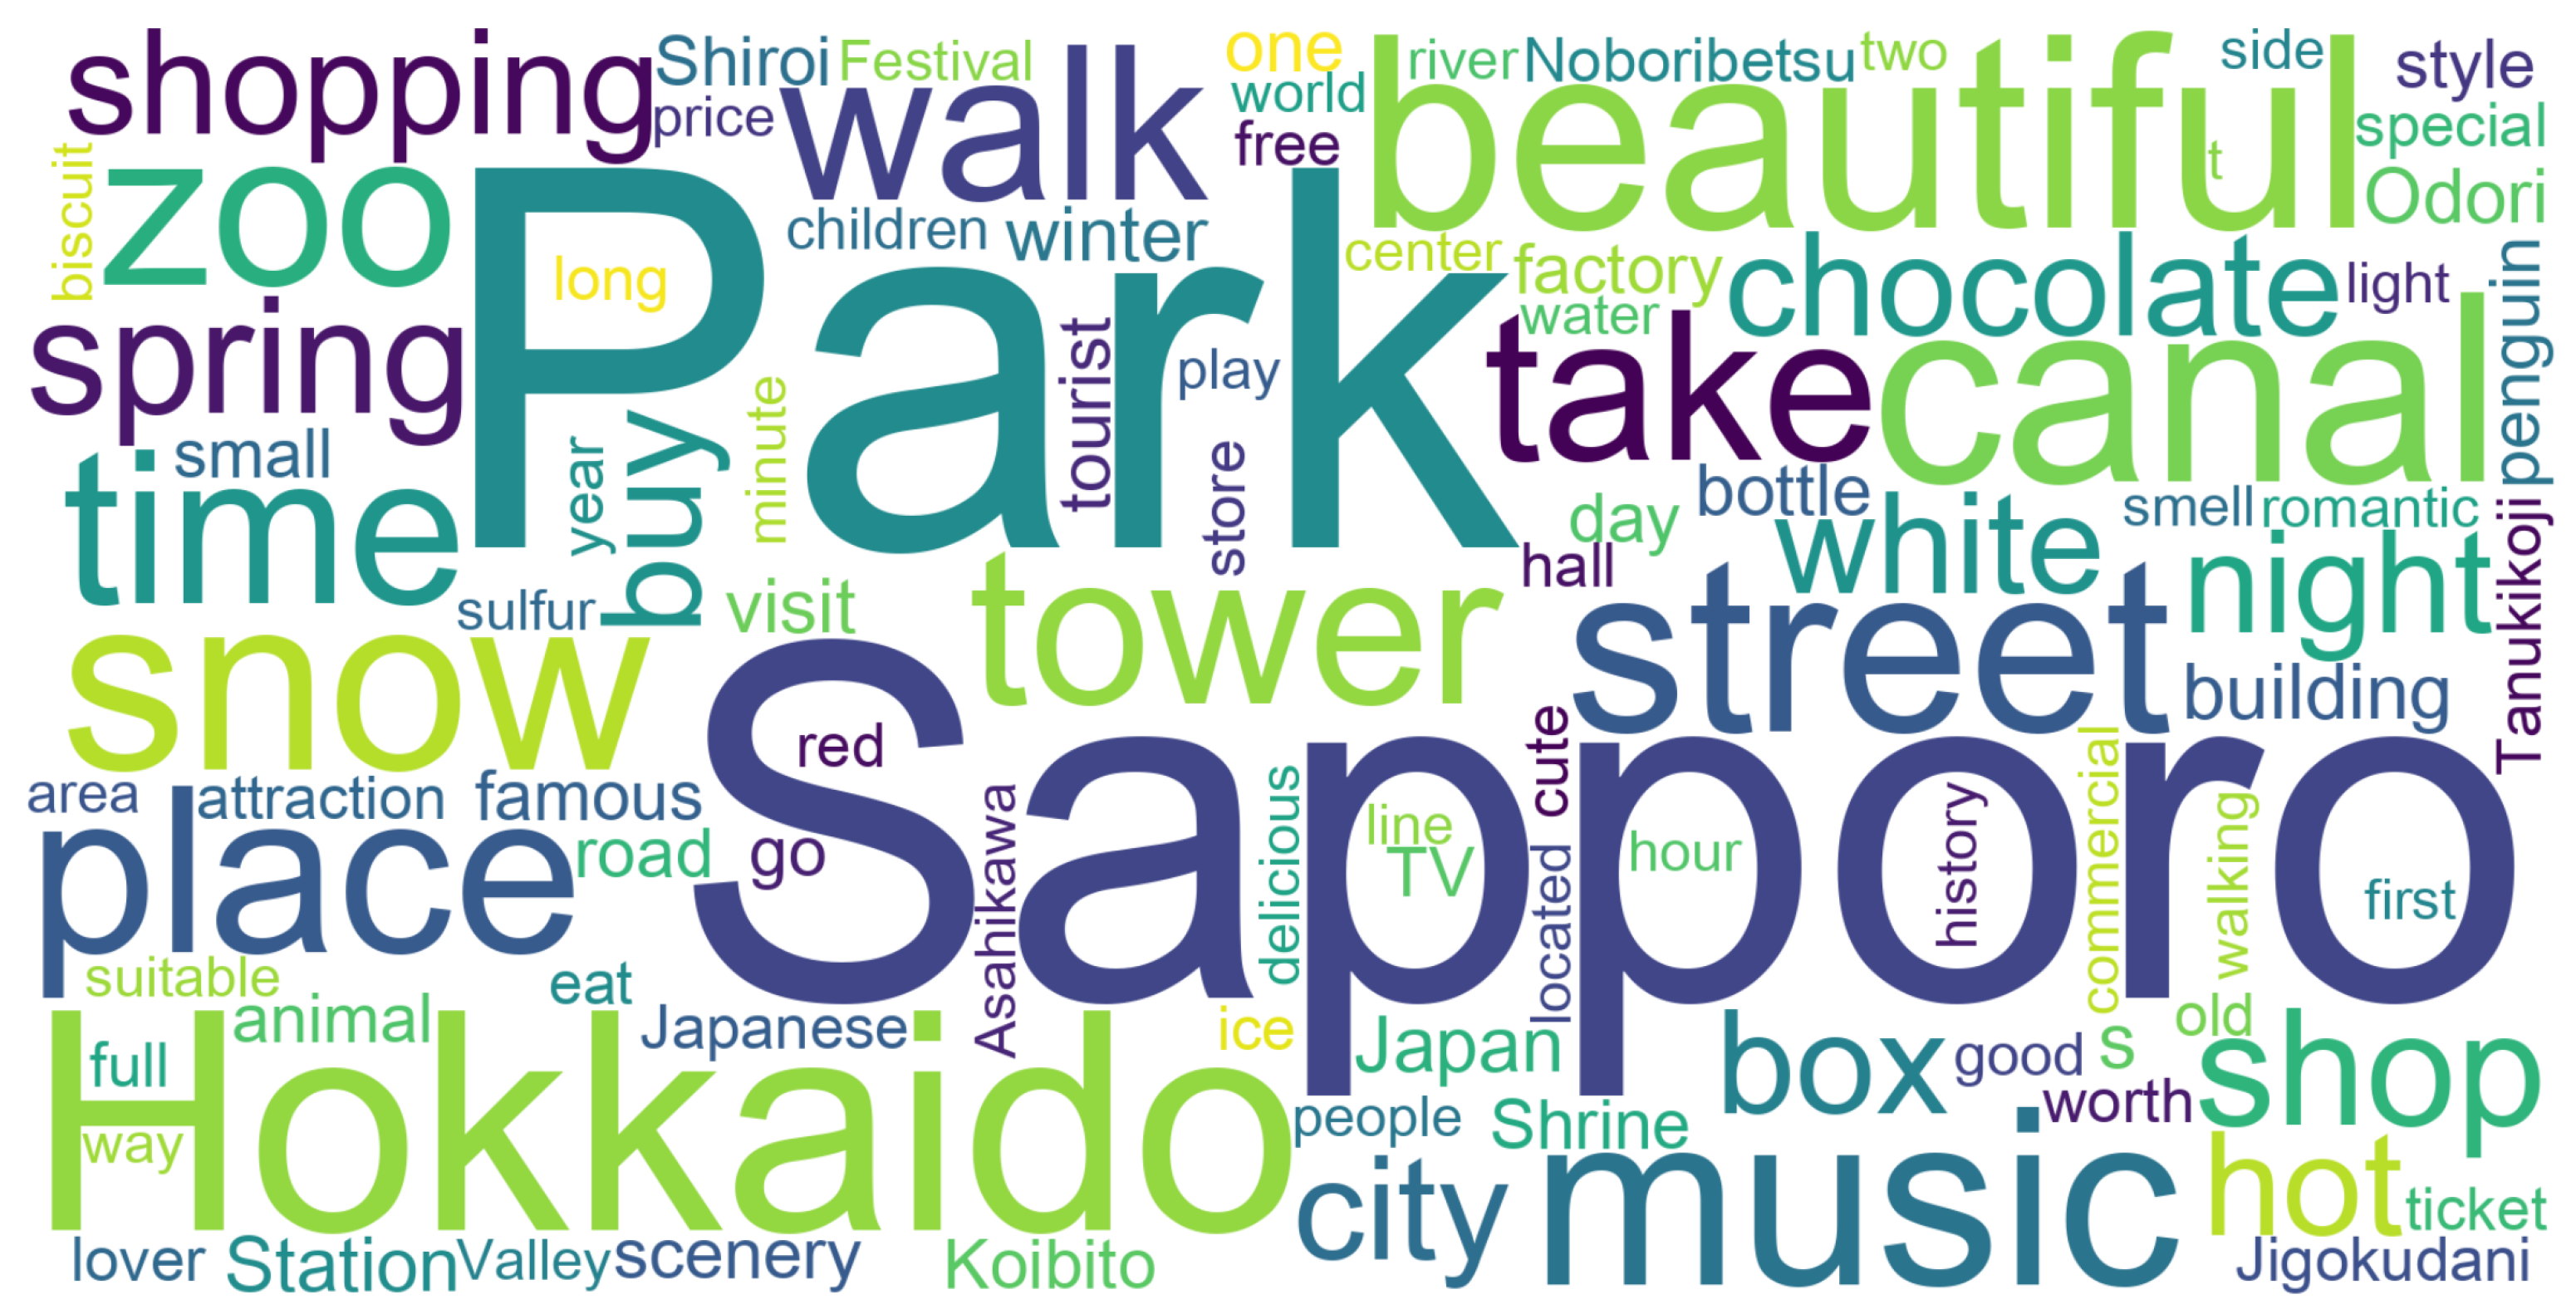
  • The application of the proposed methodology to analyze reviews of popular tourist destinations in Hokkaido, with a focus on Chinese tourists, to gain insights into which aspects of these destinations are most appealing;
  • The provision of a global approach to tourism focus point analysis and a potential solution to prepare for future tourism emergencies.
First, we propose a novel method to identify the focus points of tourist sites, which are the attention-grabbing aspects that attract inbound tourists. The method involves analyzing tourist site reviews written by inbound tourists and extracting highly frequent n-gram patterns, which are scored based on seven types of motivational factors that influence tourists. We use principal component analysis and clustering methods to further analyze the data and identify the focus points of each tourist site.
Moreover, we apply our methodology to analyze reviews of popular tourist spots in Hokkaido, with a special focus on Chinese tourists. The clustering of n-gram patterns extracted from tourist reviews allows the identification of key features and focus points of each tourist spot, which can be used to better target tourism marketing strategies and improve the tourism industry in Japan.
Since the method is not language-dependent, it can be applied to other languages and countries, allowing for a global approach to tourism. The method can also be used to compare the differences in the focus points of tourists before and after the COVID-19 pandemic, which could help to prepare for future emergencies in tourism.

2. Related Works

2.1. Tourism and COVID-19

The COVID-19 pandemic has negatively impacted the tourism and hospitality industry. There have been numerous studies discussing the state of the tourism industry and how it is coping with the pandemic.
For example, Faeni et al. [6] propose a model for increasing human capital competitiveness in the tourism industry in emerging economies, using Indonesia as an example. The authors conducted a survey of 199 tourism workers in the city of Magelang and analyzed the data using a structural equation model. The study found that social and human capital influences firm performance and that innovation moderates the influence of human and social capital on firm performance. The authors highlight the potential of creating and sharing knowledge to strengthen micro, small, and medium-sized enterprises in the tourism industry in emerging economies during and after the COVID-19 pandemic.
A study by Pramana et al. [7] analyzes the impact of the COVID-19 pandemic on Indonesia’s tourism industry by clustering provinces based on their room occupancy rates. Big data sources, including the Google Mobility Index, flight trackers, and reviews from Tripadvisor and Booking.com, are used to examine the impact on Bali and Yogyakarta. The study shows that the pandemic has impacted the tourism industry and its supporting sectors across Indonesia, but the patterns of impact vary across provinces. The authors suggest that big data sources can serve as a useful proxy for inferring the impact of the pandemic on tourism.
Zhao et al. [8] investigate the factors influencing the online reservation intention associated with tourist attractions in the COVID-19 context, based on the technology acceptance model (TAM). The study found that subjective norms had no significant effect on reservation behavior, perceived usefulness had a positive effect on tourists’ reservation intention, and perceived risk had a significant negative effect on reservation intention. Government policy was the most important factor influencing tourists’ reservation intention. The findings improve the understanding of tourists’ reservation intention and extend TAM theory and suggest that tourist attraction operators should improve tourists’ experiences and reduce perceived risks, and the government should promote the reservation system to create a good reservation atmosphere.
The pandemic has also highlighted the need for physical distancing. One solution to alleviate this situation is the use of robots to guide and serve customers. There are several research studies that focus on the use of robots to assist the tourism industry during the COVID-19 pandemic.
For example, Zeng et al. state that [9] robotics, artificial intelligence, and human–robot interactions are increasingly being used to manage the spread of the virus in various sectors. They state that the use of humanoid robots, autonomous vehicles, drones, and intelligent robots can help to reduce human contact and the potential transmission of the virus. While controversial in the past, the use of robotics and AI in the travel and tourism industry is likely to continue beyond the pandemic. According to the authors, tourism scholars should seize this opportunity to develop robotic applications that enhance tourist experiences, protect natural and cultural resources, involve citizens in tourism development decisions, and create new employment opportunities for industry workers.
Romero and Lado [10] found that customers believed that robots used in hotels could reduce the risk of contagion during the COVID-19 pandemic. They state that the use of anthropomorphic robots could increase the perceived effectiveness of COVID-19 prevention, resulting in more positive attitudes and stronger booking intention. In addition, hotels can increase the demand by promoting robots as a COVID-19 prevention measure, especially in markets heavily impacted by the pandemic. They also state that robots should be used in contexts with low social presence.
Seyitolu et al. [11] state that service robots can be useful in maintaining physical distancing, but they can also create a technological barrier between tourists and employees. They suggest that tourism and hospitality companies need to use additional technologies to promote social connection and mitigate the negative effects of physical distancing.

2.2. Travel Motivation

Travel motivation refers to the underlying reasons and factors that influence a person’s decision to travel to a particular destination or engage in travel-related activities. Understanding travel motivation is important for the tourism industry to provide a better travel experience and attract more tourists [12].
There are many studies that analyze and discuss tourists’ travel motivation. For example, Hayashi et al. [13] surveyed Japanese overseas travelers to determine their tourism motivation and identified the factors that contributed to their motivation. They performed factor analysis on the questionnaire results and confirmed seven types of motivational factors for tourists, including stimulation, cultural observation, local communication, health recovery, experiencing nature, unexpectedness, and educating oneself.
As for the motivation of Chinese tourists, Wen et al. [14] explored the relationship between Chinese cultural values and tourist motivations in Israel. Through surveys and interviews, they found seven main reasons for Chinese tourists to visit Israel, including knowledge enhancement/learning, business development, sightseeing, self-fulfillment, escape/relaxation, destination uniqueness, and adventure. In particular, business development was a significant factor. Chen et al. [15] examined the role of “face” in Chinese tourism, which has received limited research attention. Through qualitative interviews with 20 Chinese tourists, the study found that “face” influences travel behavior and destination choices, leading to the selection of high-value and prestigious destinations, luxury tourism products, and social media sharing to “gain face”.
A study by Simeon et al. [16] analyzed online reviews of cultural attractions in Naples, Italy, posted on TripAdvisor, to explore tourists’ experiences and identify their preferences. Content analysis and principal component analysis were used to identify five critical components of tourists’ experiences: wonder, authenticity, relaxation, discovery, and knowledge. The study provides practical implications for destination managers and policymakers to enhance the attractiveness of cultural attractions and provide more satisfying cultural experiences.
As this study focuses on tourist destinations in Japan, we choose to use the seven types of motivational factors proposed by Hayashi et al. [13], which also helps to compare and discuss the differences between Chinese and Japanese tourists.

2.3. Focus Points of Tourists

There are many studies that analyze the focus or image of various destinations in Japan as perceived by inbound tourists. These studies mainly use reviews posted on social media and travel websites as data sources. For example, Okubo et al. [17] analyzed the gap between the expectations and evaluations of tourist destinations from travel guidebooks and review data, and revealed the differences in the image of tourist destinations among different countries. Specifically, they extracted and compared nouns and adjectives with higher Jaccard indexes from the text data of travel guidebooks and reviewed the data of tourist destinations for five areas in Tokyo. They then performed PCA on the extracted business nouns and adjectives to analyze the image of tourist destinations by nationality. Ohkawa et al. [18] visualized the similarities and differences in the image of tourist destinations from multilingual reviews posted on the Internet, and conducted a comparative analysis. They extracted frequently occurring nouns from review texts in Japanese, English, and Chinese for 10 tourist destinations in Japan, and performed correspondence analysis of the extracted words using the K-means method. Then, they analyzed the similarities and differences in the images of tourist spots based on different languages.
There are also many studies that compare the elements of attention between domestic tourists and inbound tourists for the same tourist resources. For example, Hoshino et al. [19] collected Twitter posts related to a fireworks event in Central Tokyo and conducted topic extraction using LDA for Japanese and English tweets, respectively. Then, using the obtained results, they compared and analyzed the tourism information that Japanese and foreign tourists were interested in. In addition, they examined the problems of providing tourism information to foreign tourists and made suggestions on how to disseminate information on websites. Yasuhara et al. [20] collected Japanese and English reviews of Japanese gardens from travel websites and discussed the similarities and differences between them. They ranked the words contained in the reviews in both languages by frequency of occurrence and created a collocation network using the top 100 words. They then compared the visit experiences of Japanese and foreign visitors using the obtained collocation network and revealed their similarities, differences, and evaluation tendencies.
Currently, however, there is a lack of a comprehensive and objective methods for identifying the focus points of tourist destinations. Previous studies have relied on subjective approaches such as surveys and expert opinions, or on keyword extraction methods that may not capture the full range of factors that influence tourists. This paper proposes a novel method that combines keyword extraction, scoring based on motivational factors, and principal component analysis to identify the most attention-grabbing aspects of tourist spots as indicated by reviews written by inbound tourists. By applying this method to popular tourist spots in Hokkaido, with a special focus on Chinese tourists, the paper provides insights into which aspects of these destinations are most appealing to them.
In this study, we extracted frequent n-gram patterns for each tourist destination from online reviews written by Chinese tourists. These patterns indicate the most frequently mentioned aspects of each destination by Chinese tourists. We then quantified the tourism motivation of each spot by evaluating the extracted n-gram patterns against tourism motivation factors. We defined the combination of strong tourism motivation factors for a tourist spot by statistical thresholds as focus points. Our analysis not only focused on the most frequently mentioned keywords or topics by tourists, but also included an examination of the tourism motivation factors related to these spots. This approach helped us to better understand the needs and preferences of inbound tourists.

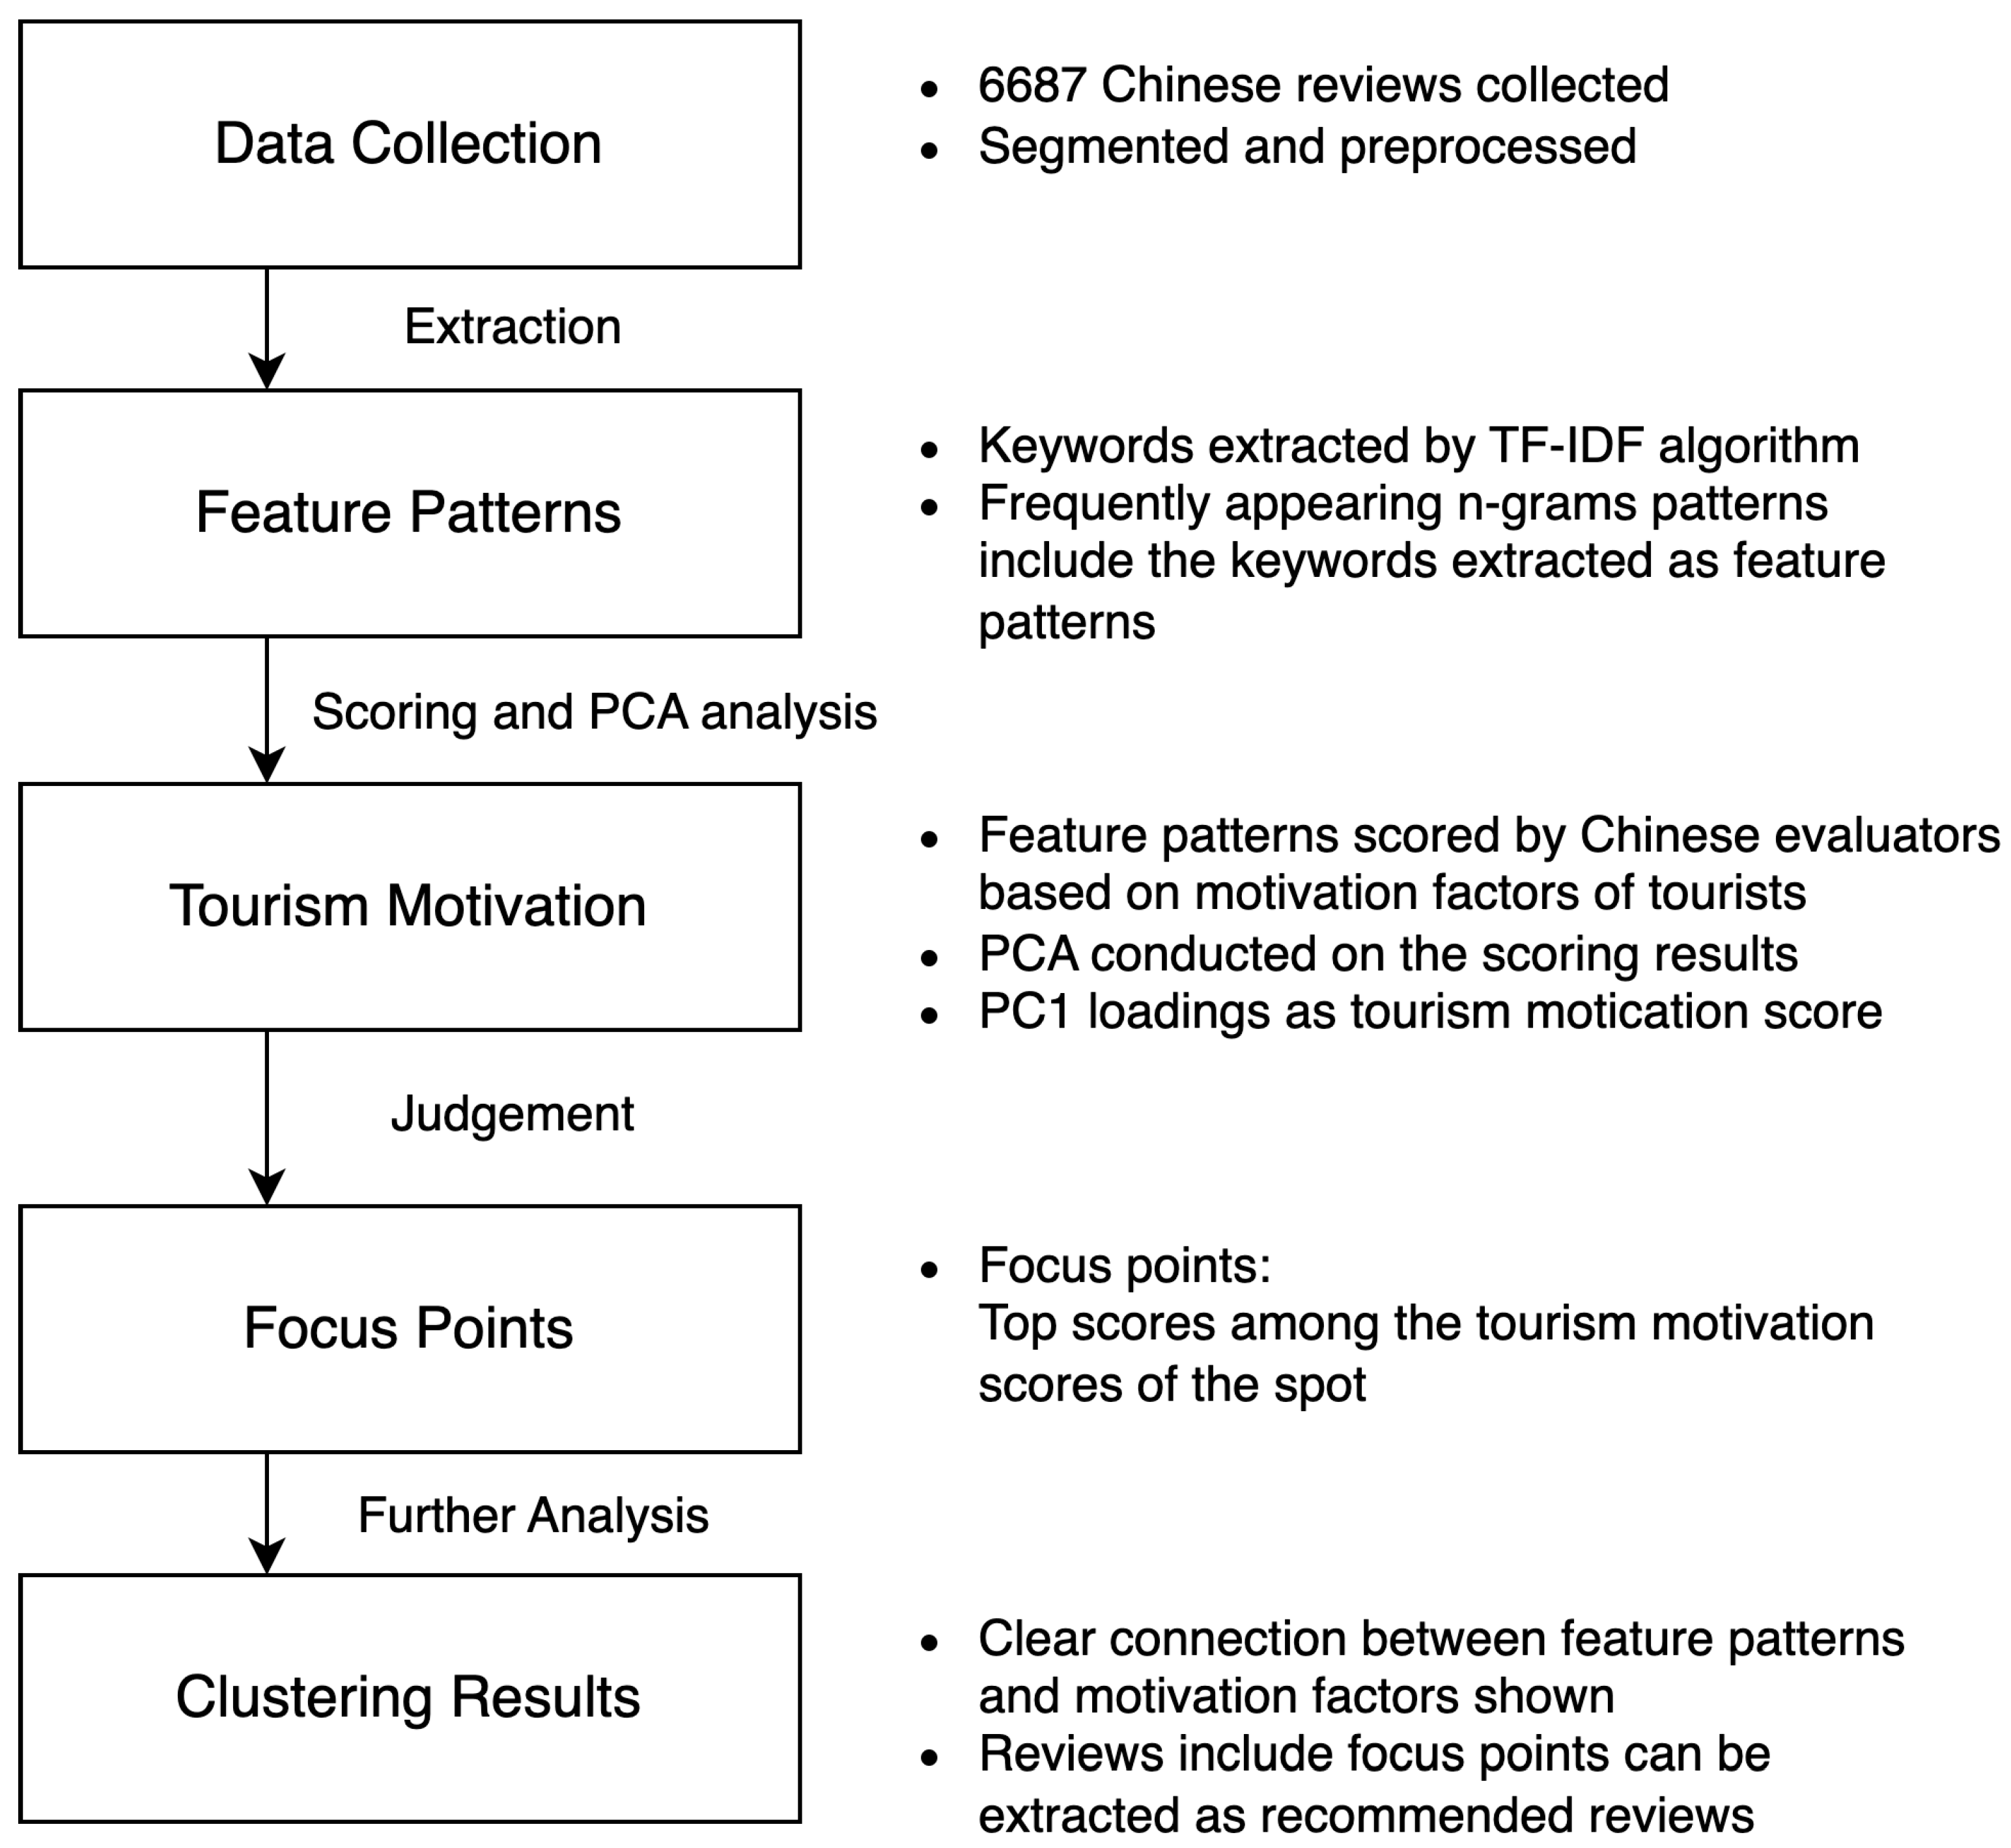
3. Materials and Methods

In this study, we propose a method that uses the reviews of tourist sites to identify and analyze the focus points of inbound tourists. First, we extracted frequent n-gram patterns (feature patterns) of each tourism site from the reviews. Next, we scored each feature pattern with seven types of tourism motivation factors and performed principal component analysis (PCA) to quantify each tourist site based on these motivation factors. High scores on the motivation factors indicated the focus points of tourists at each spot. We also clustered the feature patterns to further analyze the contents of each focus point.
The research procedure is shown in Figure 1, and each step of the procedure is explained in Section 3.1 and Section 3.5.

3.1. Data Collection

We selected spots that are popular and have a high number of reviews in Hokkaido from Ctrip (https://www.ctrip.com/, (accessed on 1 October 2020)), a well-known Chinese travel industry website. The Ctrip website provides a list of recommended tourist spots in Hokkaido, sorted by spot ratings, number of reviews, and other factors using its own algorithm. From this list, we selected ten locations with high rankings and a significant number of reviews. We collected a total of 6687 reviews from these spots by scraping the site and extracting useful information, such as content, rating scores, and dates.
As a data pre-processing step, we first checked the list of reviews for duplicates and removed them. Since the Chinese written language does not use spaces between words, text segmentation was necessary [21]. To segment the words, we used a popular Chinese segmentation tool called Jieba [22]. Since Jieba’s dictionary did not include words specific to Hokkaido spots, we manually updated the list to better suit our needs. The added words included the names of tourist spots such as ‘洞爺湖 (Lake Toya)’, ‘五稜郭 (Goryokaku)’, ‘富良野 (Furano)’. In addition, we removed the stop words [23] from the segmented texts to reduce the amount of redundant words and punctuation.

3.2. Extraction of Feature Patterns

The TF-IDF algorithm was used to extract the keywords from the reviews of each spot. Then, high-frequency n-grams containing the keywords were extracted from the reviews, and these were designated as the feature patterns of each spot.
In previous research [24], we compared TF-IDF and TextRank [25] for keyword extraction. To compare the extraction methods, we evaluated the top 10 keywords from each spot by checking how the keywords showed the distinctive features of each spot. The evaluation results showed that TF-IDF better captured the keywords of each spot. In addition, we considered a topic modeling approach using LDA [26]. However, while LDA is designed to identify underlying topics in a corpus of text, it can be difficult to interpret the topics that are generated. The topics may be highly abstract or difficult to label, making it difficult to understand the underlying themes. Therefore, TF-IDF was chosen as the keyword extraction method.
TF-IDF [27] or term frequency-inverse document frequency t f i d f is a statistical weighting factor that can be used to identify significant terms in texts. In TF-IDF, term frequency t f ( t , d ) denotes the frequency of a term t (word, token) in a document d, while inverse document frequency i d f ( t , D ) is the logarithm of the total number of documents | D | in the corpus divided by the number of documents containing the term n t . The product of term frequency and inverse document frequency t f i d f is obtained by multiplying these two measures, as shown in Equation (1). Compared to raw term frequencies, TF-IDF helps to account for the relative frequency of words across documents, as it is adjusted by the number of documents in the corpus that contain the word, while still being proportional to the frequency of the term in the document.
i d f ( t , D ) = l o g ( | D | n t )
We used Jieba’s TF-IDF implementation with its own dictionary to obtain the top n keywords from the segmented reviews of each tourist spot. We removed some common words from the keyword list, such as ‘美麗 (beautiful)’, ‘特別 (special)’, and ‘日本 (Japan)’, which appeared in more than half of the spots. The keywords for each spot were sorted in descending order based on their TF-IDF values. As an example, Table 1 shows the top 10 keywords ( n = 10 ) extracted from the reviews of Asahiyama Zoo. For the experiments, we chose n = 5 based on the pilot survey.
To check what tourists wrote about in relation to the keywords and obtain more complete information about them, we extracted n-gram patterns from the reviews.
n-gram [28] is a method used in natural language processing to represent a sequence of words in a text. It involves breaking down the text into smaller units of n consecutive words called “n-grams”. For example, in the sentence “動物園(zoo) 有(has) 企鵝(penguin) 游行(walking) 活動(event)”, the n-gram examples are as shown in Table 2. The n-gram method is widely used in various applications, such as language modeling, text classification, and information retrieval. It can help to capture important contextual information and improve the performance of these applications.
After generating the n-gram patterns from all reviews of each tourist spot and filtering for those containing each keyword about the tourist spot, we calculated the frequency of occurrence for each pattern and selected the most highly occurring n-gram patterns as the feature patterns. For example, Table 3 shows the feature patterns containing the keyword “zoo” extracted from the reviews of the Asahiyama Zoo. Here, the 3-gram patterns with a frequency of occurrence of 5 or more were identified as feature patterns based on a pilot survey for the experiments. All feature patterns containing any of the top n keywords for a tourist site were extracted to create a feature pattern set for that site.

3.3. Quantification of Tourism Motivation

Next, we used the feature pattern sets to quantify tourism motivation. The tourism motivation factors proposed by Hayashi et al. [13] (stimulation, cultural observation, local communication, health recovery, experiencing nature, unexpectedness, and educating oneself) were used for this purpose. The impression of the feature patterns was manually scored for each tourism motivational factor, and the results were quantified as tourism motivational scores of the tourism spots by using PCA.
Six Chinese-speaking evaluators were tasked with scoring the feature patterns on a five-point scale, where 5 indicated the strongest relationship and 1 indicated no relationship between the pattern and the motivation factor. Table 4 and Table 5 provide the descriptions of the Tourism Motivation Scale and the scoring criteria, respectively. For example, for the feature pattern “zoo, penguin, walking” of the Asahiyama Zoo spot, the scores could be assigned as shown in Table 6. The evaluator determined that the pattern “zoo, penguin, walking” was closely related to health recovery; moderately related to stimulation and experiencing nature; somewhat related to cultural observation, local communication, and educating oneself; and unrelated to unexpectedness.
After scoring, we performed PCA on the scoring results. In statistics and data analysis, principal component analysis (PCA) is a technique used to reduce the complexity of high-dimensional data by finding the most important variables, or principal components, that explain most of the variation in the data [29].
The first principal component is the linear combination of variables that explains the most variance in the data. It is the direction in the feature space that captures most of the variation in the data. The importance of the first component is that it represents the dominant source of variation in the data and provides a way to summarize the data along a single dimension. The weights of the first principal component represent the weights or coefficients applied to each variable in the linear combination to obtain the score of the first principal component. In other words, the weights indicate the relative importance of each variable in contributing to the first principal component [30].
The values of the first principal component weights were used as the tourism motivation scores of each site. For example, Figure 2 illustrates the tourism motivation scores of Asahiyama Zoo. The horizontal axis represents the seven tourism motivation factors, while the vertical axis represents the values of the first principal component weight. The highest tourism motivation score for Asahiyama Zoo is related to health recovery. This may indicate that visitors feel relaxed when surrounded by animals and natural scenery at the zoo.

3.4. Definition of Focus Points

We define the focus points of the destinations as the highest scores among the tourist motivation factors. For example, in Figure 2, the focus points of Asahiyama Zoo are health recovery, experiencing nature, and stimulation, which have higher scores compared to other tourist motivation factors. This indicates that when considering this site, tourists focus on aspects of the zoo that allow them to recover from daily stress, engage with nature, and experience novelty and change.
In addition, the term “top scores” here refers to those with large absolute values and is not related to whether they are negative or positive. The sign of the weight value (whether it is positive or negative) only indicates the direction of the relationship between the original variable and the principal component, but the magnitude of the weight value is what determines the strength of this relationship. When a PCA weight is negative, it indicates an inverse relationship between the original variable and the principal component or other variables that have a positive weight [31].

3.5. Feature Pattern Clustering

The PCA results show the main tourist motivational factors of the site. To clarify the specific content related to these motivational factors, we used and compared the following clustering methods to analyze the feature patterns by clustering them based on their first and second principal component scores.
  • K-Means
    K-means clustering is a popular unsupervised machine learning algorithm used to partition a given data set into K clusters, where K is a user-specified number. The algorithm works by iteratively assigning each data point to the nearest centroid, and then recalculating the centroid of each cluster based on the new assignments. The process is repeated until convergence, i.e., when the assignment of data points to clusters no longer changes [32].
  • Gaussian Mixture Model (GMM)
    GMM clustering is a probabilistic clustering method that models the distribution of the data as a mixture of Gaussian distributions. In GMM clustering, each data point is assumed to be generated from one of K Gaussian distributions, where K is the number of clusters. The parameters of the Gaussians (mean and covariance) are estimated using the Expectation–Maximization (EM) algorithm [33].
  • MeanShift
    MeanShift clustering is a non-parametric clustering method that does not assume an underlying distribution of the data. It works by iteratively shifting the data points toward the mode of their density estimate until convergence. The mode can be interpreted as the center of a cluster, and the final clusters are obtained by assigning data points to the nearest mode [34].
  • Spectral Clustering
    Spectral clustering is a powerful clustering method that uses the spectral properties of a similarity matrix to group data points into clusters. It is based on the idea that the eigenvectors and eigenvalues of a similarity matrix contain useful information about the structure of the data and can be used to transform the data into a lower-dimensional space where clusters are more easily separable [35].
The cluster results show the classified groups of feature patterns, which helps in understanding the themes of the focus points. They also reveal the relationships between feature patterns and tourist motivation factors, which helps in understanding the focus points of the spot.
In addition, we can also extract reviews that include the feature patterns representing the focus point as recommended reviews, making it easier for users to view relevant reviews more efficiently.

4. Experiments and Results

In this section, we describe the experiments conducted to evaluate the basic performance of the proposed method.

4.1. Focus Point Extraction

4.1.1. Data Set

In this experiment, we focused on 10 popular spots in Hokkaido. The data set that we collected for this experiment is summarized in Table 7.
  • Collected reviews
    We collected reviews for each spot from tourism websites, and then removed duplicate reviews, leaving us with 6687 reviews.
  • Feature Patterns
    We extracted the top 5 keywords of each spot from the reviews. Then, we extracted frequently occurring 3-gram patterns containing the keywords from the reviews as the feature patterns of each spot. The total number of feature patterns of 10 ads was 395.
  • Customer reviews
    We randomly chose 50 reviews from the review list of each spot, for a total of 500 reviews.
Table 7. Tourism spots and the numbers of reviews.
Spot NameCollected ReviewsFeature PatternsCustomer Reviews
旭山動物園 (Asahiyama Zoo)5995150
北海道庁旧本庁舎 (Former Hokkaido Govt. Office)4023950
北海道神宮 (Hokkaido Shrine)3613450
登別地獄谷 (Noboribetsu Hell Valley)6624550
大通公園 (Odori Park)7893550
小樽運河 (Otaru Canal)10605850
小樽音楽盒堂 (Otaru Music Box Hall)4733350
札幌電視塔 (Sapporo TV Tower)4332450
白色恋人公園 (Shiroi Koibito Park)10123350
狸小路商店街 (Tanukikoji Shopping Street)8964350
Total6687395500

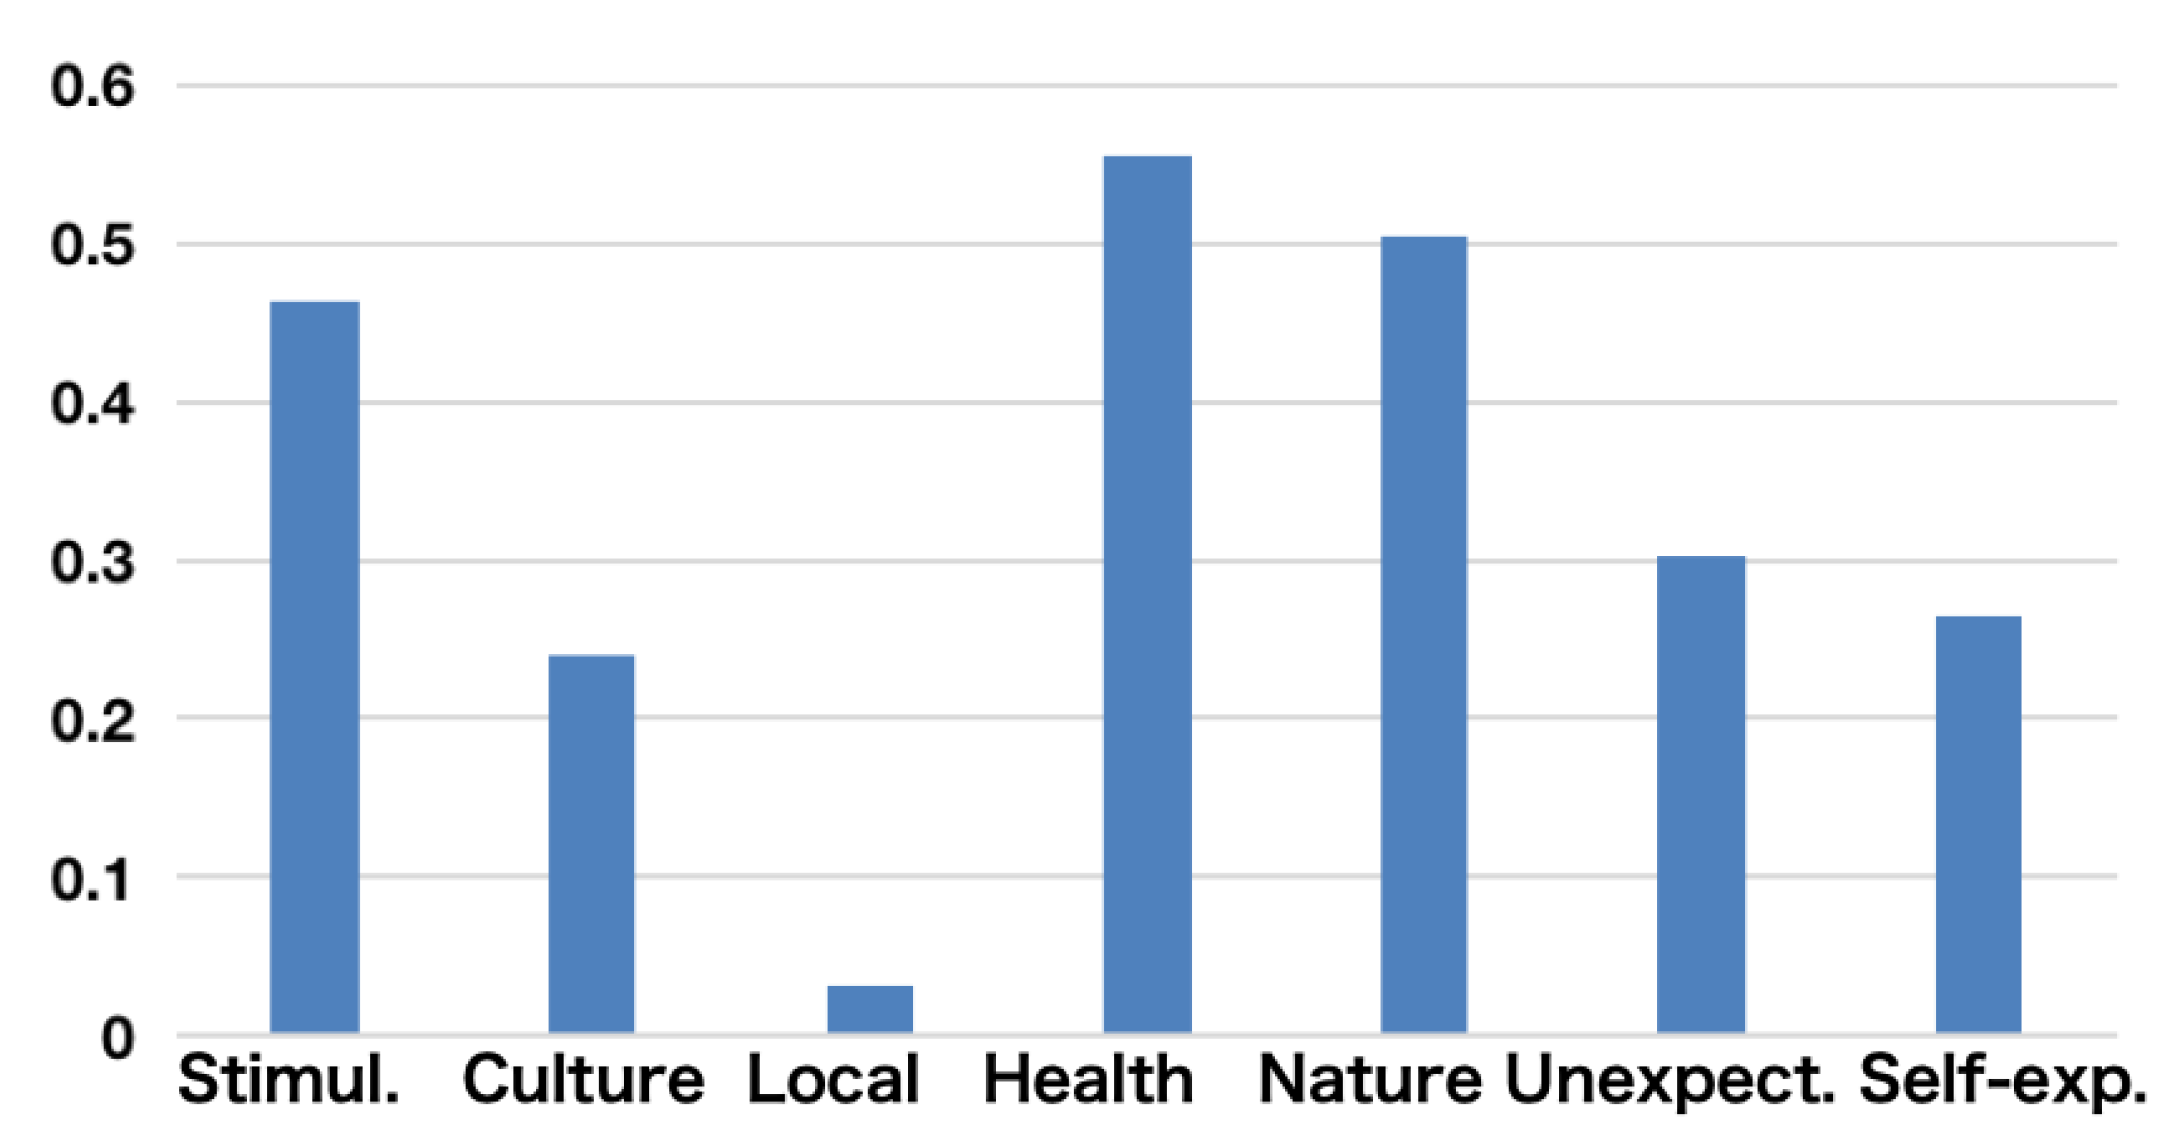
4.1.2. The Focus Points of Hokkaido

First, we applied the proposed method to all the data on the Hokkaido spots that we collected. We extracted feature patterns from all the spots and evaluated each pattern using the motivational factors of tourists by employing six Chinese-speaking university students. Then, we calculated the average scores of all the raters and performed PCA on the scores.
In addition, as a control experiment, we scored all customer reviews using the same evaluators and motivation factors, and then performed PCA.
The PCA results are shown in Figure 3. The height of the bars on the graph represents the principal component weight of each tourist motivation factor. Factors with high scores indicate the focus points, which are the main points of interest for the site. PC1, PC2, and PC3 denote the first, second, and third components of the PCA, respectively.
Since PC1 shows the total influence of the tourism motivational factors, it becomes clear that the focus points of Hokkaido for the results of the feature pattern are experiencing nature and stimulation. From PC2, we conclude that experiencing nature has the highest absolute value. Local communication has the highest absolute value on PC3, for which the contribution rate is quite low (8.43%).
For customer ratings, the focus is on experiencing nature, with stimulation being the highest (absolute value) on PC2, and cultural observation the highest (absolute value) on PC3. In this experiment, we examine the motivational factors with the highest absolute values. When the PCA weight is negative, it indicates an inverse relationship between the original variable and the principal component or other variables with a positive weight. For example, experiencing nature has a negative relationship with other motivators and principal components on PC1, suggesting that customer reviews that emphasize a connection with nature may place less emphasis on culture and other motivators.
The extracted focus point from both feature patterns and customer reviews is the same, which is experiencing nature. However, the customer reviews have a much higher score for experiencing nature compared to other tourist motivations. This is because there are many descriptions related to nature in the reviews, but, when extracting keywords and feature patterns, the context may not have been effectively considered. In addition, analyzing Hokkaido as a whole makes it difficult to see the unique features of each site. To address this, we also extracted the focus points for each tourist spot individually.
In addition, we created a word cloud using the reviews of ten Hokkaido tourist spots, as shown in Figure 4. In the word cloud, one can observe many frequently appearing words related to nature, such as “park”, “snow”, “canal”, and so on, which is consistent with our analysis.

4.1.3. Spot-Specific Focus Points

In order to find the spot-specific focus points, we evaluated the feature patterns and customer reviews of each tourist spot and conducted PCA. We took three different types of spots as an example. Figure 5 shows the first component weights of the PCA results, which represent the tourism motivation scores of the spots.
Figure 5 (feature patterns) shows that the focus points of Asahiyama Zoo are health recovery, experiencing nature, and stimulation. The focus points of Tanukikoji Shopping Street are cultural observation, local communication, and unexpectedness.
The Former Hokkaido Govt. Office has a focus point centered on cultural observation and educating oneself.
The results of customer reviews are similar to those of the feature patterns, but there is a significant difference in the case of the Former Hokkaido Government Office location. The results of customer reviews show a very high score for experiencing nature, which could be due to the large amount of content related to the natural scenery around the attraction. Our keyword and feature pattern extraction method is mainly based on the frequency of words, so it may not be able to extract the context or various expressions concerning nature effectively.
We also created a word cloud using the reviews from each location—for example, Asahiyama Zoo, which is shown in Figure 6. The word cloud shows many important words related to animals and nature, which is consistent with our focus point analysis.

4.1.4. Verification

To verify how well the feature patterns covered the features of the spot, we compared the contribution rates of the first principal component.
The contribution rate of the principal component indicates how much the principal component covers the variance of the entire data. In this study, it is assumed that a higher contribution rate explains more of the data, thus more clearly representing the characteristics of the tourist spots.
Table 8 shows the contribution rates of the first principal component for the tourist motivation scores of each spot and the average for all spots. It shows that the feature pattern has a higher contribution rate than the customer reviews. This indicates that the feature pattern represents more features of the tourist spots and, by consequence, that the extracted feature patterns are considered to be effective.

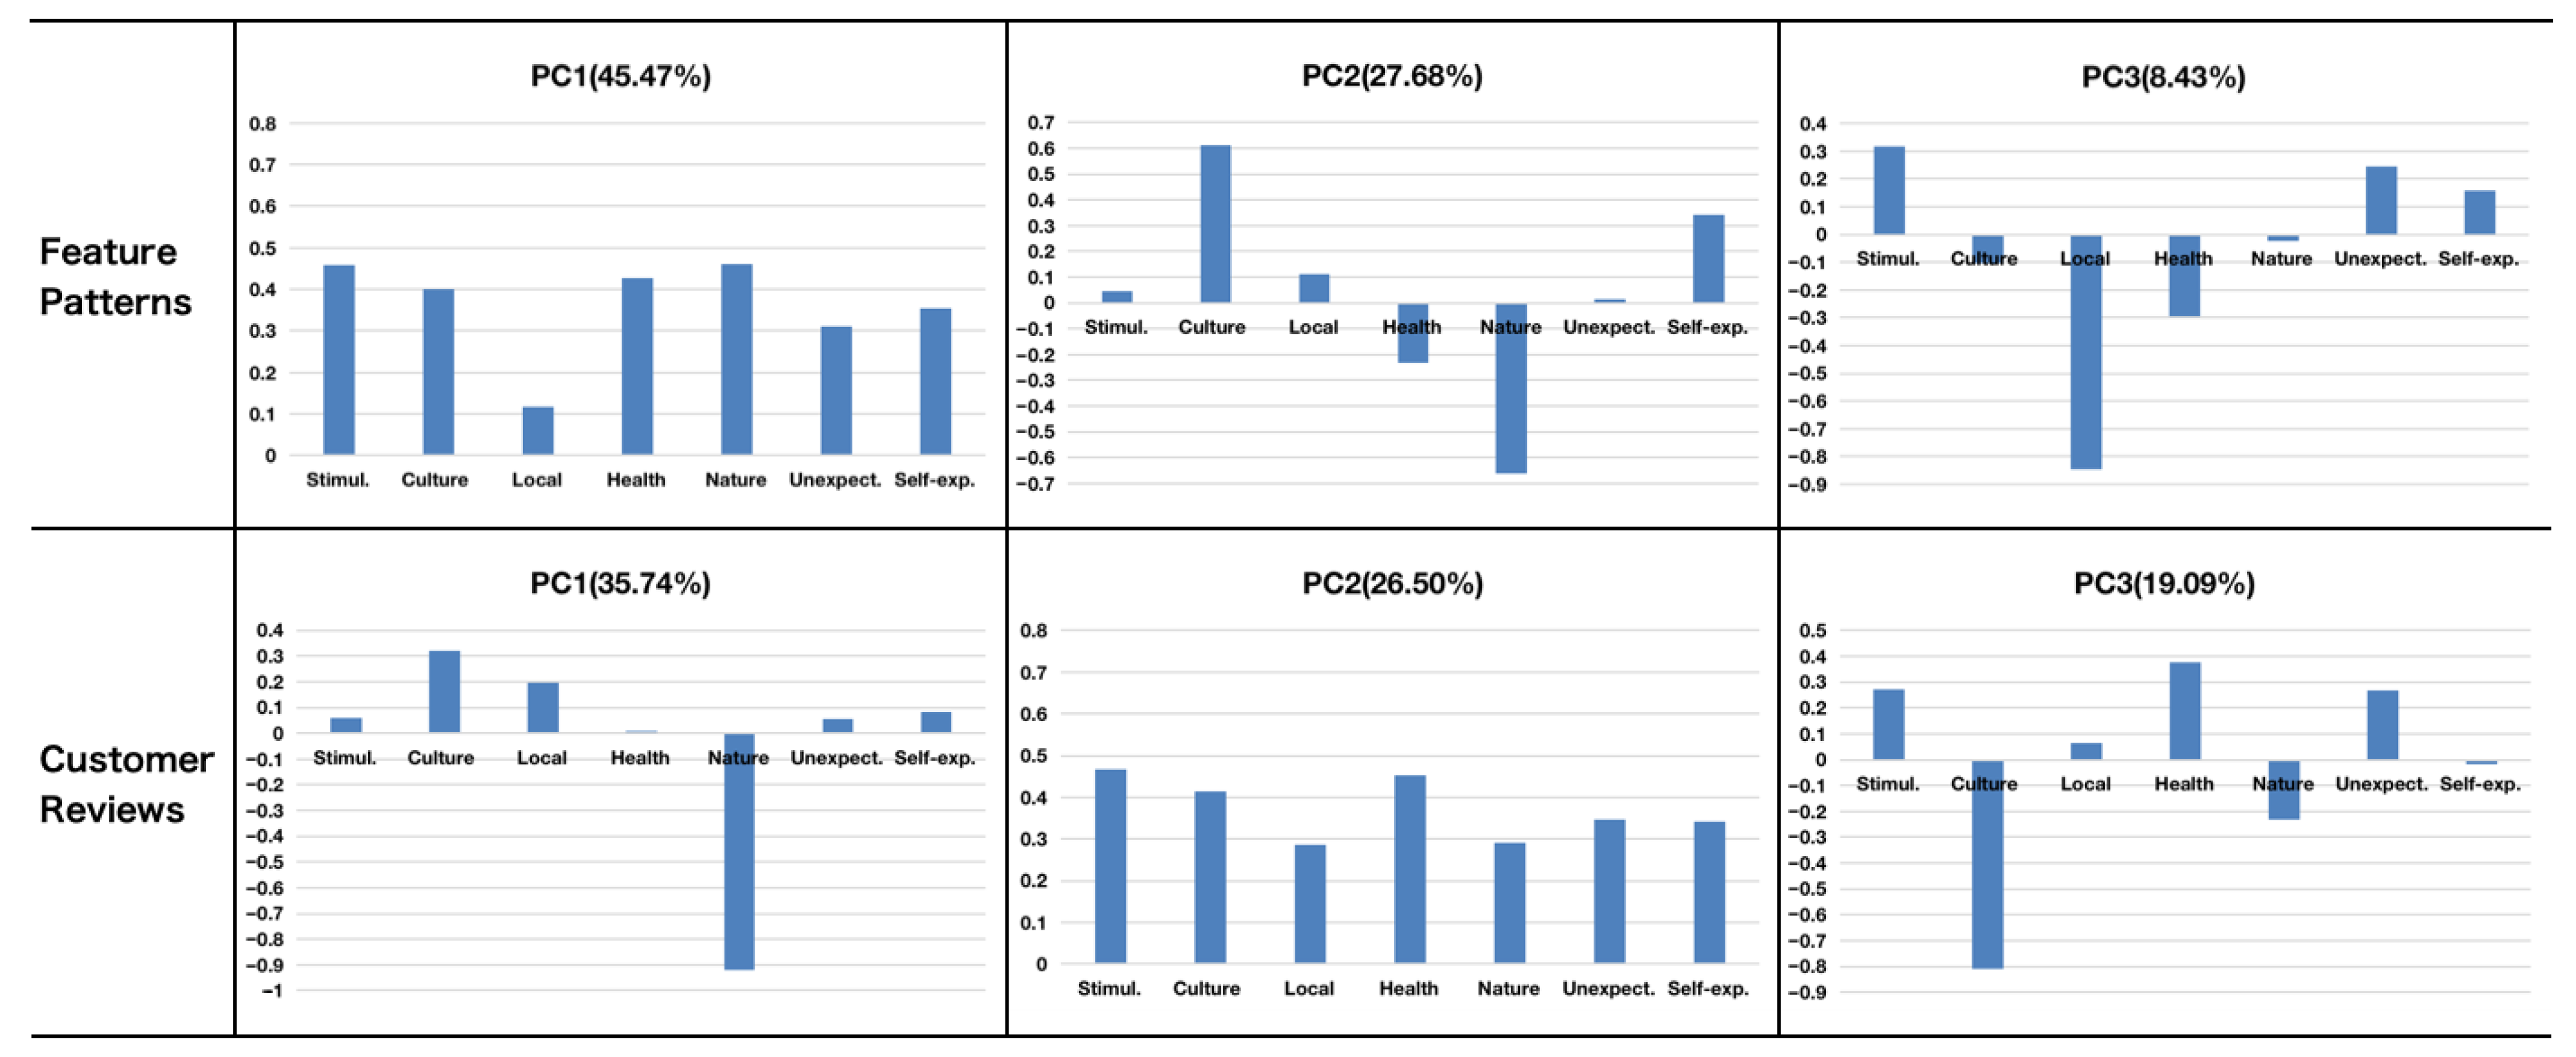
4.2. Feature Pattern Clustering

To identify specific content related to the focus points, we clustered the feature patterns based on their first and second principal component scores using clustering methods. Specifically, we used the first and second principal components as the features on which to base the clustering algorithm. We applied several clustering methods to the feature patterns of five spots and calculated the accuracy based on the rate of correctly clustered feature patterns. We did this by manually evaluating each feature pattern and considering whether it matched the assigned cluster or not. We then calculated the average accuracy over five tourism spots. Table 9 shows the results, which indicate that spectral clustering is the best method, while GMM gives the lowest accuracy in this experiment.
The discussion of the focus points and related feature patterns obtained from the spectral clustering results can be found in Section 5.2, while the extracted recommended reviews for the focus points are discussed in Section 5.3.

5. Discussion

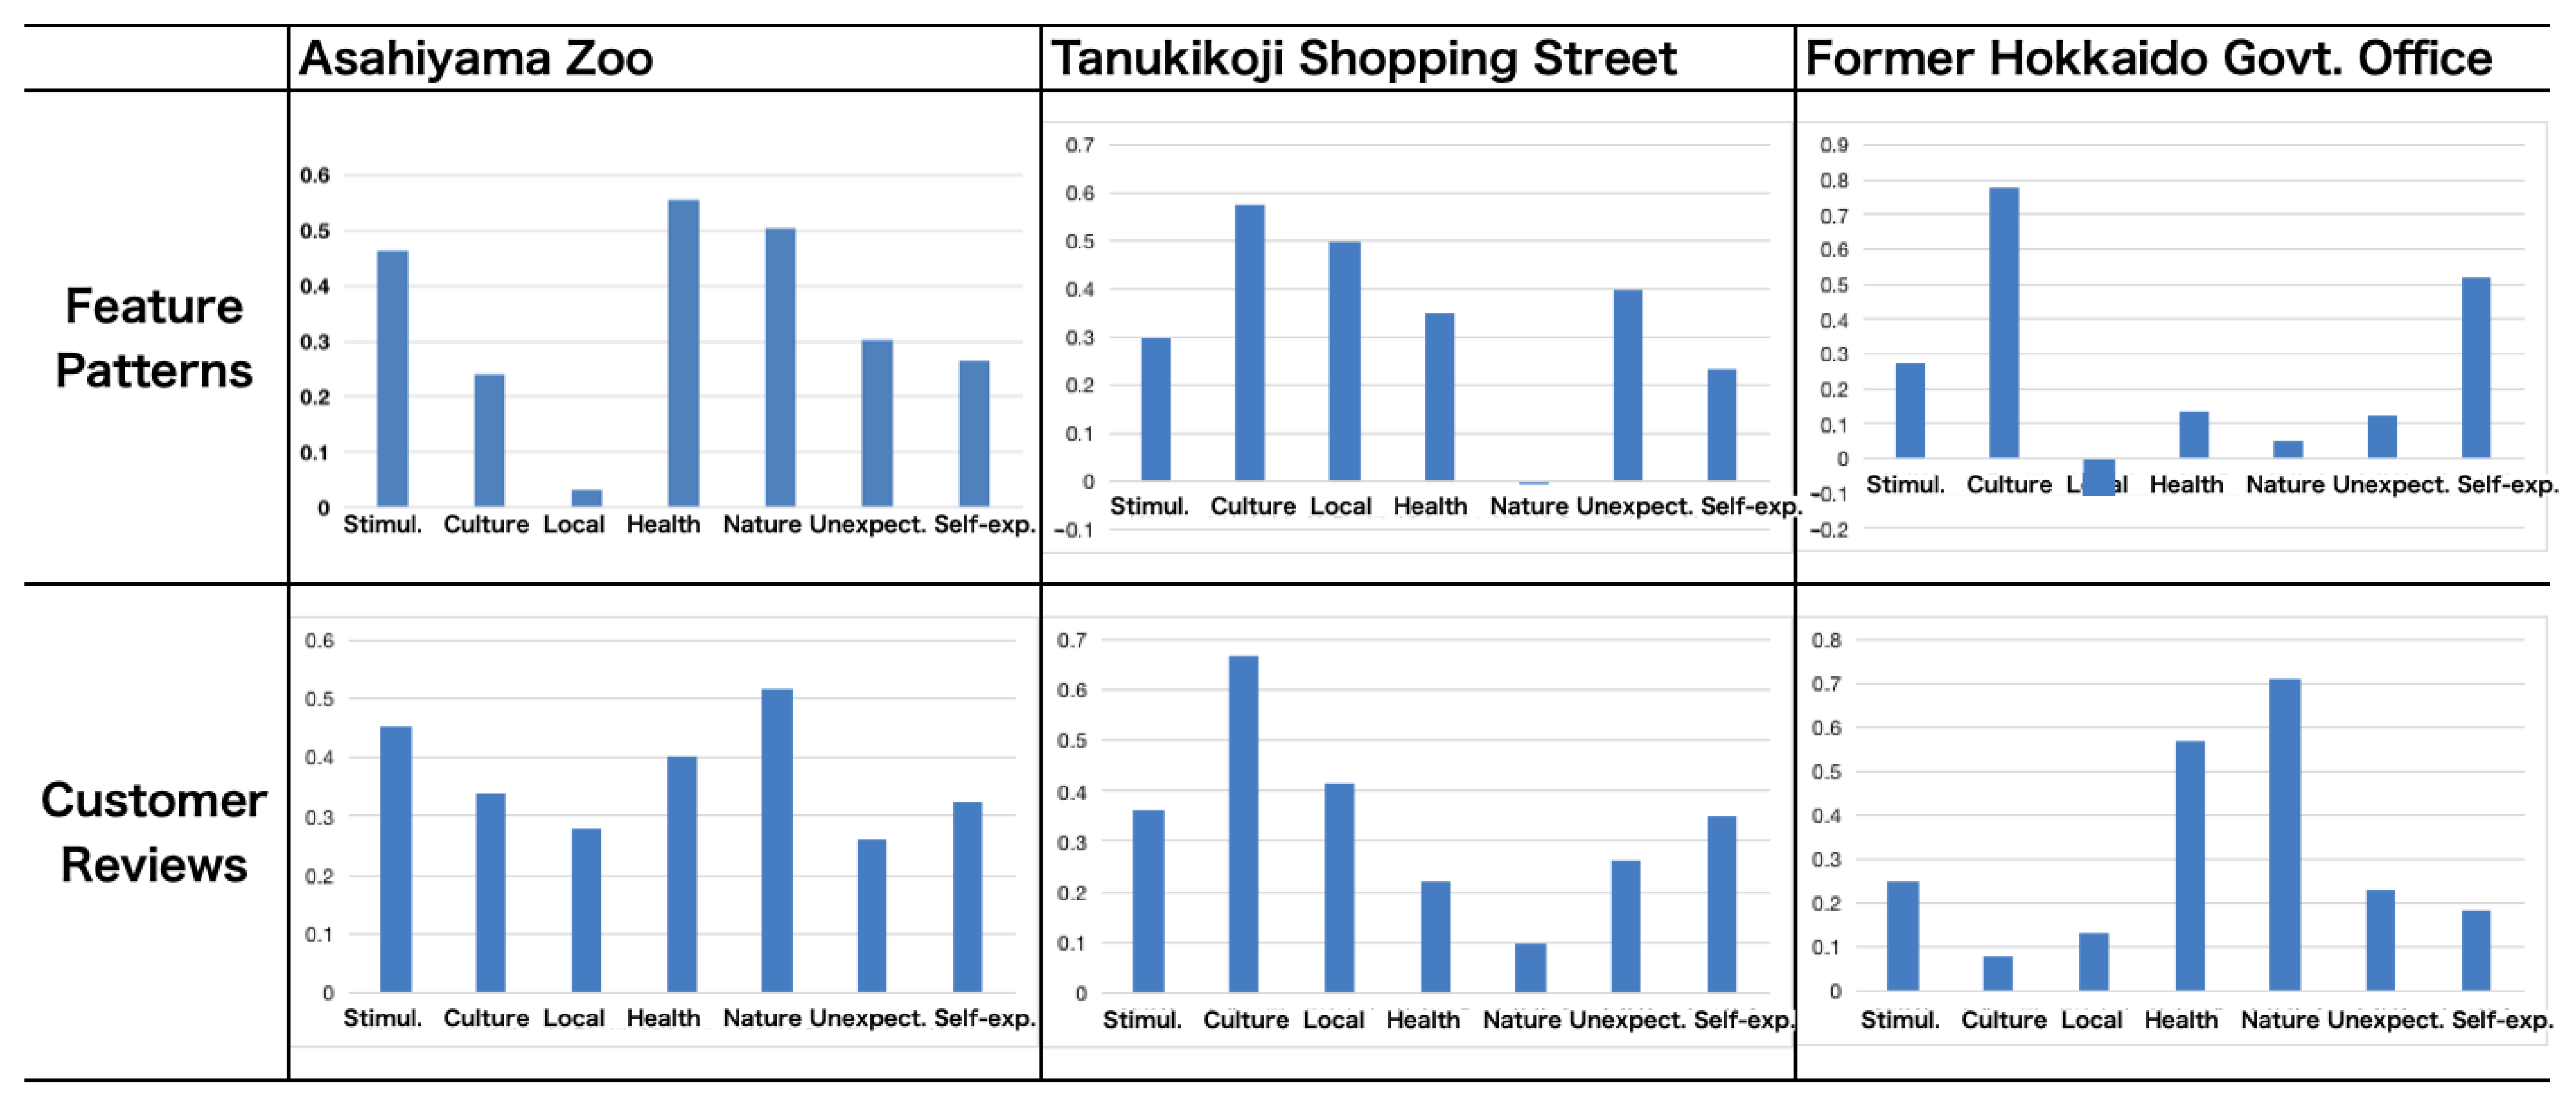
5.1. Feature Patterns

The tourist motivation scores of the feature patterns represent the characteristics and focus points of each tourist spot. We analyzed the focus points from the PCA results (Figure 5) and customer reviews (Table 10; the original Chinese text of these reviews is presented in Appendix A, Table A1). For example, health restoration, experiencing nature, and stimulation are the focus points in the case of Asahiyama Zoo. This is interpreted as tourists recognizing the healing effect on the body and mind achieved through engaging with nature and animals in the zoo. Cultural observation, local communication, and unexpectedness are the focus points of Tanukikoji Shopping Street. Tanukikoji Shopping Street is lined with a variety of shops, offering Japanese cosmetics as well as souvenirs and Japanese restaurants, while also staging live performances that sometimes take place on the street. Tourists can experience Japanese culture and meet locals and tourists from other regions.
The focus points of the Former Hokkaido Govt. Office are cultural observation and educating oneself. The Former Hokkaido Govt. Office houses archives, a museum, and an exhibition room for local specialties, where visitors can learn about Hokkaido’s history, nature, and culture. In addition, the building itself is a beautiful red brick American Neo-Baroque-style building (https://www.japan.travel/en/spot/1938/), (accessed on 1 April 2023) and it is an attractive spot to take pictures by and share them on SNS.
The knowledge of these focus points can help tourism businesses and organizations to improve their marketing strategies and develop better products and services that align with tourists’ interests. By understanding which aspects of destinations are most appealing to visitors, tourism businesses can create targeted marketing campaigns that showcase these features and attract more visitors. In addition, tourism organizations can use this information to improve the visitor experience by optimizing destinations based on the identified focus points. For example, if the focus points include food, cultural experiences, and outdoor activities, businesses can work to enhance these aspects by offering more food options, cultural events, and adventure activities. Ultimately, improving the visitor experience can lead to higher visitor satisfaction, more repeated visits, and positive word-of-mouth recommendations, which can attract yet more tourists to the destination.
The tourist motivation scores of the feature patterns and customer reviews are similar to some extent. For example, the graphs of Asahiyama Zoo for the feature pattern and customer review show that the scores for health recovery, experiencing nature, and stimulation are high, while the score for local communication is low.
However, in the case of some tourist spots, we can observe large differences. One such example is the Former Hokkaido Govt. Office, for which the graph of the feature pattern shows higher scores for cultural observation and educating oneself, while the customer review shows higher scores for health recovery and experiencing nature. Table 11 shows that the reviews describe not only the building itself and its history, but also the Odori Park next to it, the snowy landscape, and the nearby river. These contents are related to health recovery and experiencing nature, while the feature patterns were related only to buildings and history. The descriptions of nature are in the context of reviews, and the keywords related to experiencing nature (e.g., park, white snow, landscape) were not included in the top 10 keywords list that we extracted for each tourist spot. Thus, there is a possibility that the feature patterns could not demonstrate the focus points similarly to the reviews.

5.2. Clustering Result

In a comparison performed with several clustering methods on the five tourist spots, the spectral clustering method gave the best results. Here, we discuss the clustering results obtained using the spectral clustering method on the example of two tourist spots, the “Asahiyama Zoo” and the “Former Hokkaido Govt. Office”.

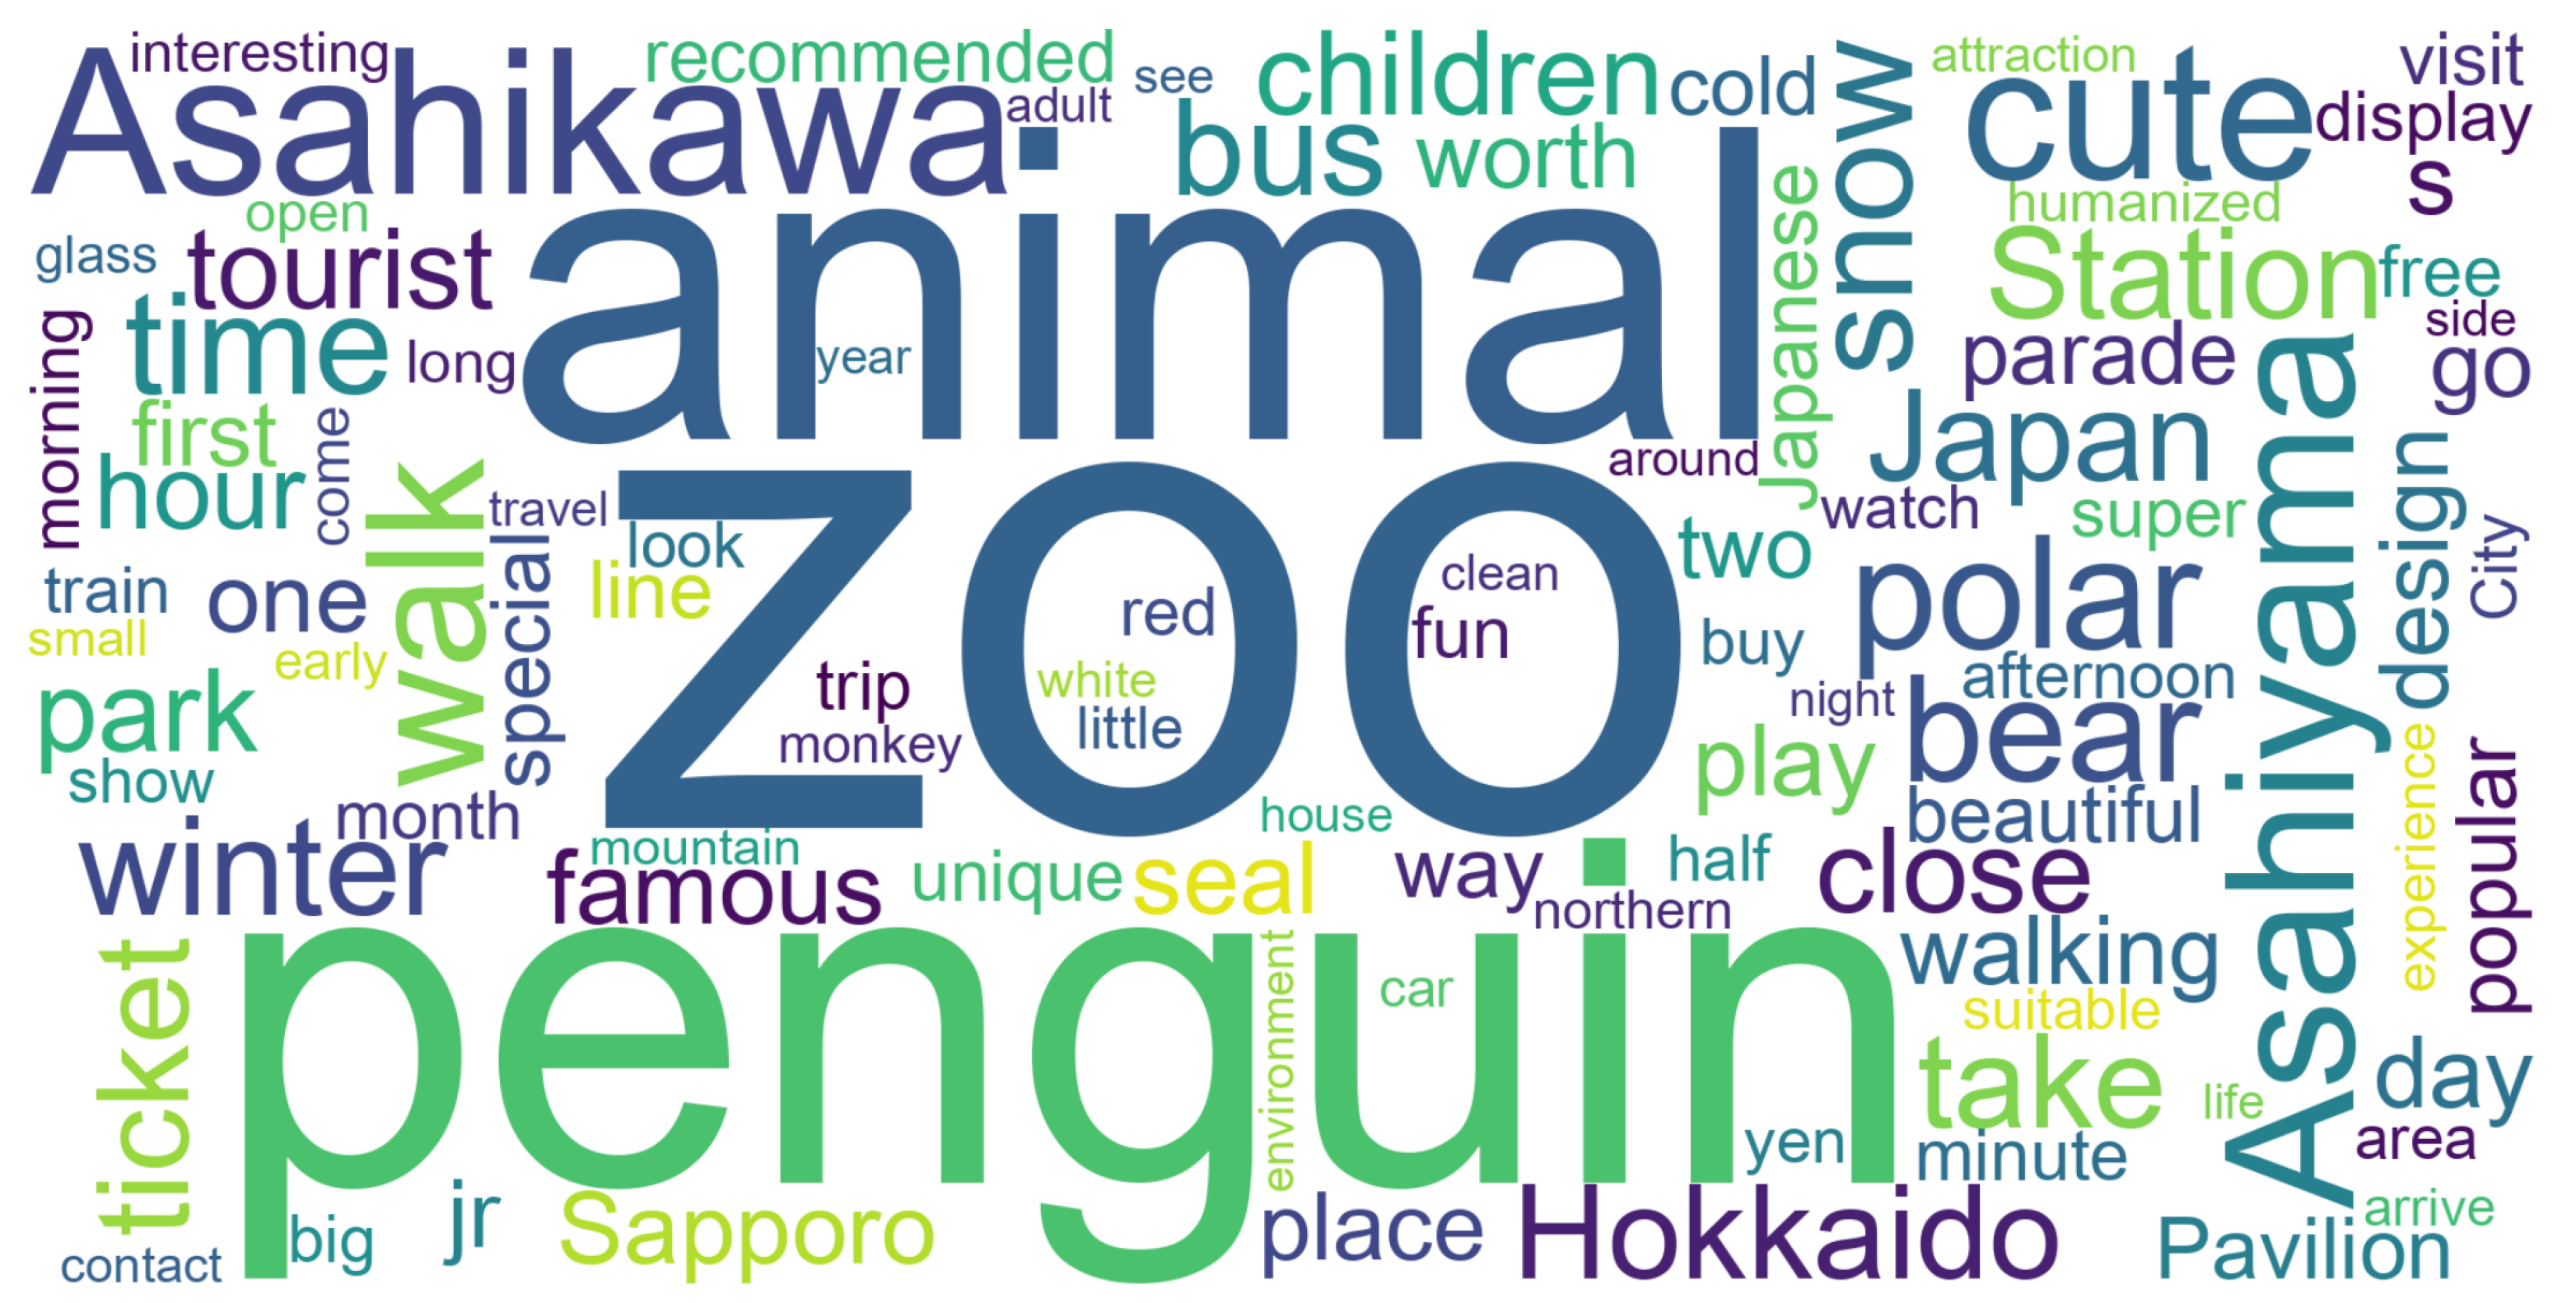
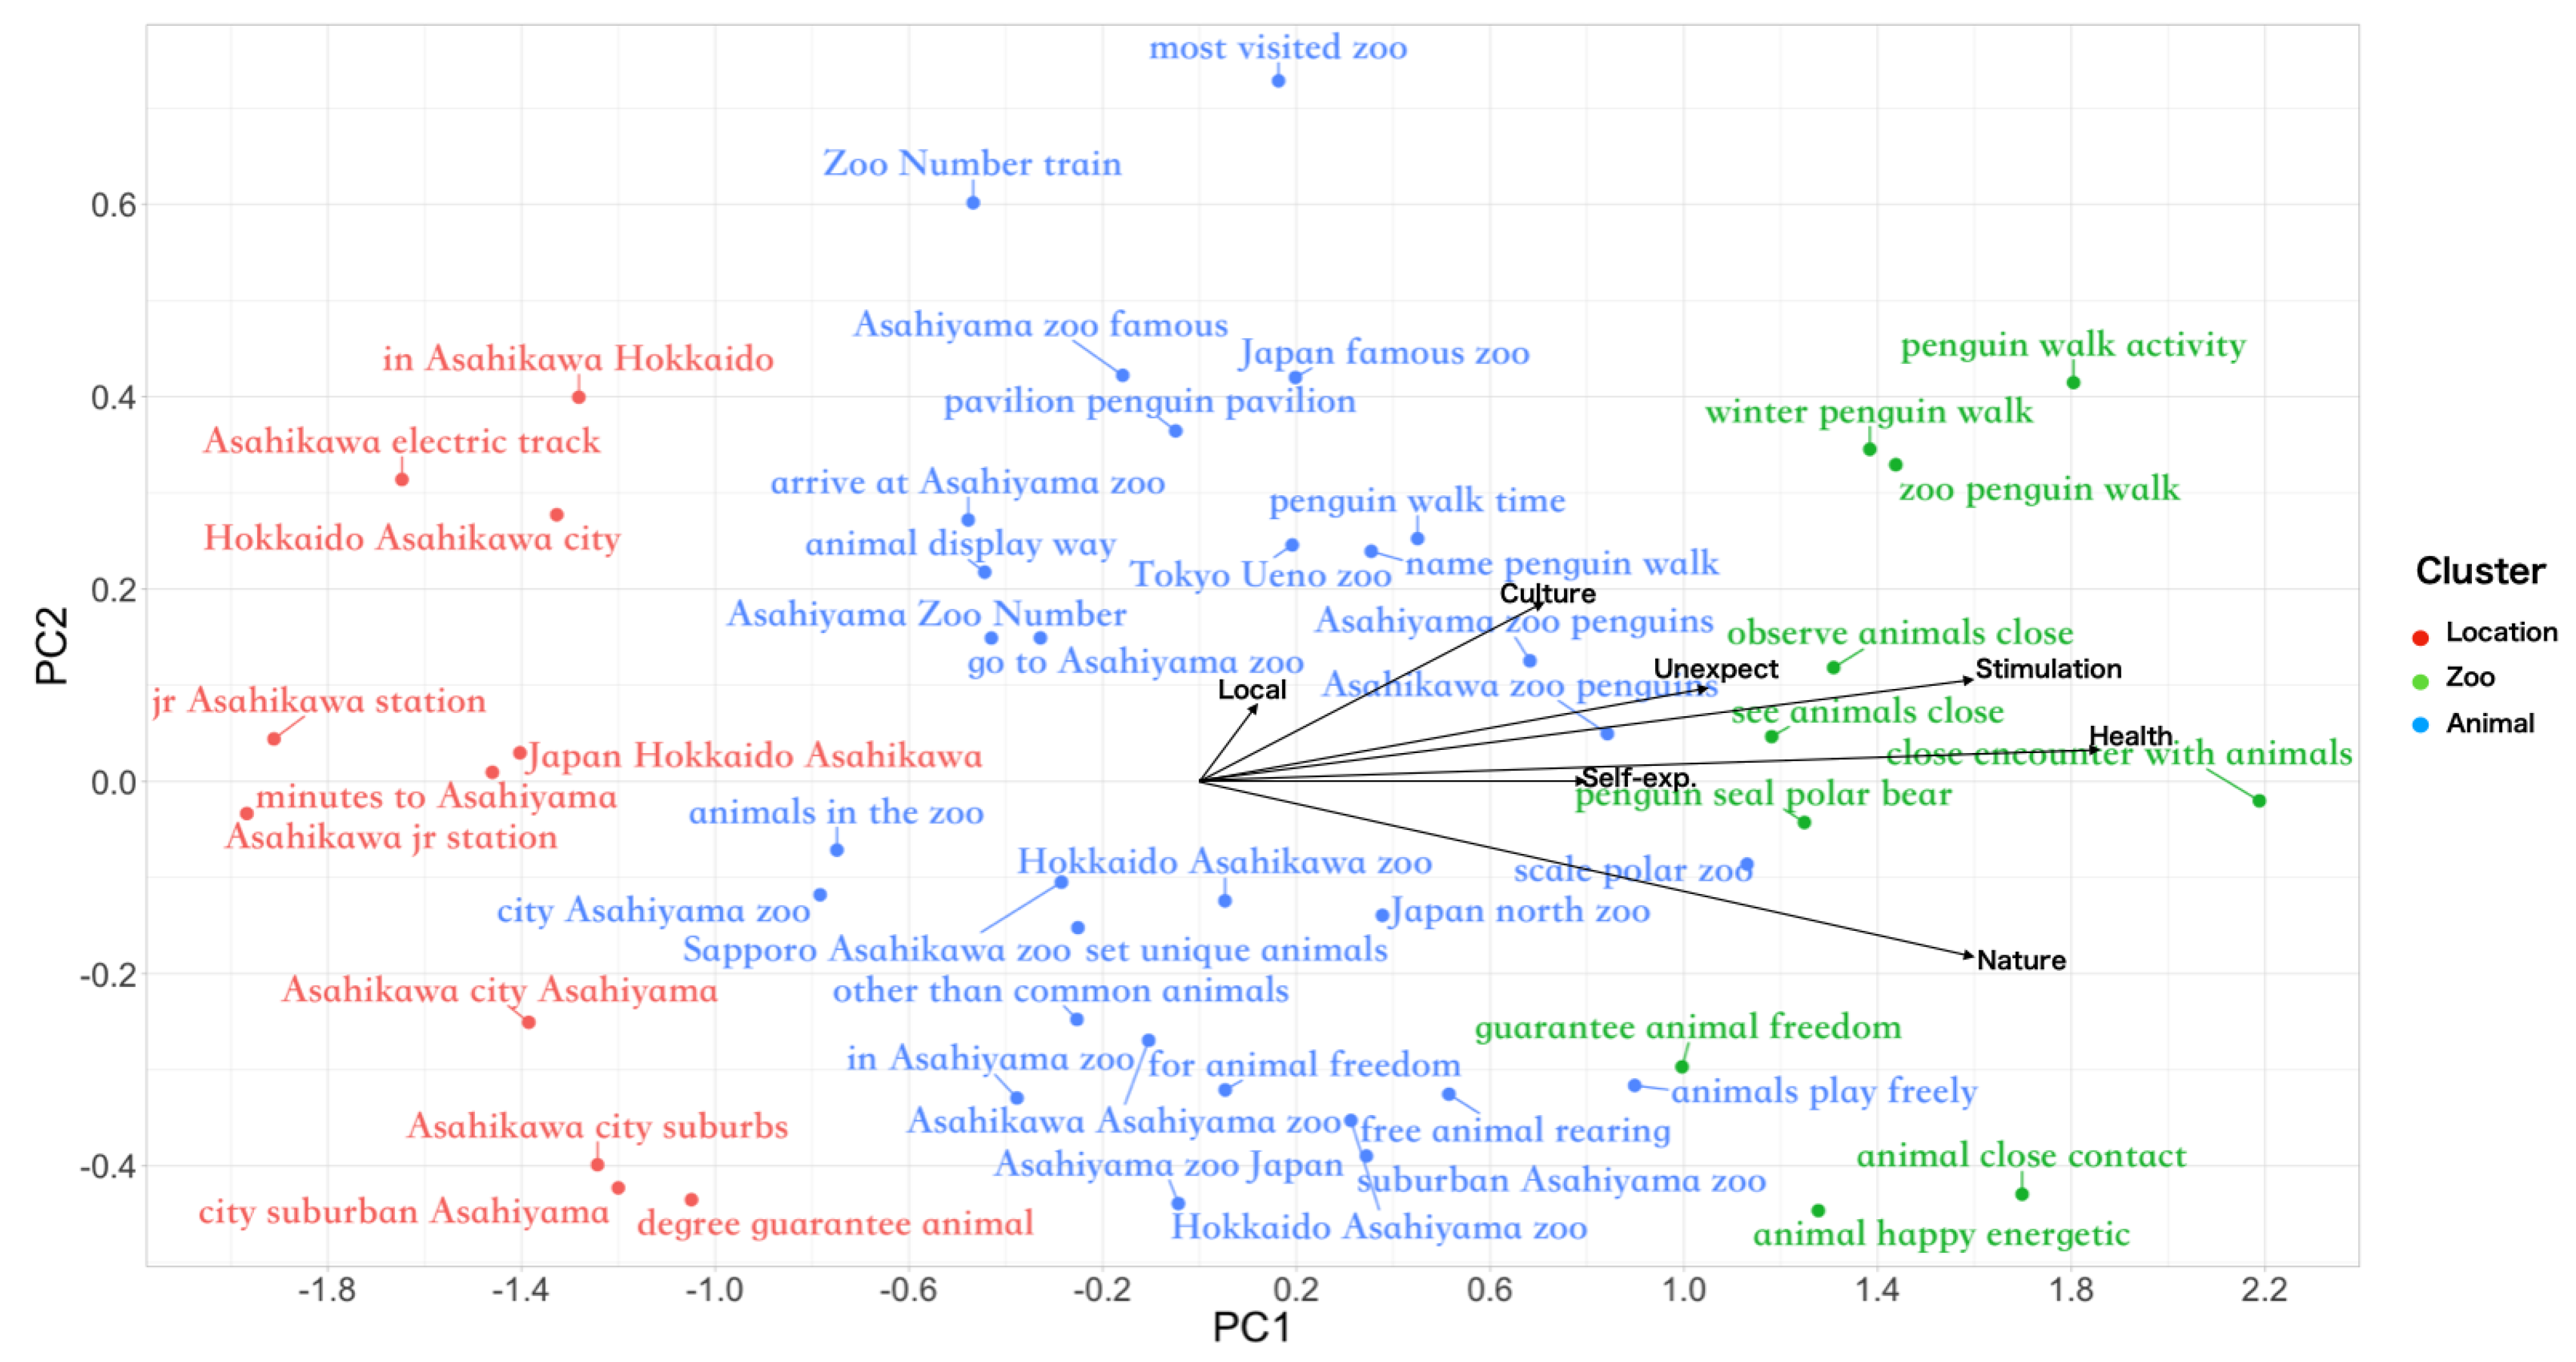
5.2.1. Asahiyama Zoo

The clustering result for the “Asahiyama Zoo” spot is shown in Figure 7. The horizontal and vertical axes represent the values of the first and second principal components of the feature patterns, respectively. The direction of the weight vectors (tourist motivations) indicates how much of the information is carried by the first principal component (x-axis) and the second principal component (y-axis). The length of the vector indicates the strength of the relationship. The clustering method formed three distinct clusters from the feature patterns, which could be interpreted as “location”, “zoo”, and “animal”. The “location” cluster contains patterns related to the location of the zoo, such as “Hokkaido, Asahikawa, city”. The “zoo” cluster mainly shows descriptive information about the zoo, such as “Japan, famous, zoo”. The “animal” cluster contains patterns about the most famous animals in the zoo, or some special activities and events related to them, such as “penguin, walk, activity”.
Moreover, the feature patterns near the tourist motivation factors point to additional factors related to the tourist motivation. In particular, the feature patterns near the focus point indicate which aspects tourists mentioned the most regarding the focus point. In Figure 7, stimulation, health recovery, and experiencing nature have a higher score compared to other motivational factors on PC1 (the x-component is longer), which can then be considered as the focus points of the spot. In addition, many feature patterns in the animal cluster are close to these focus points, as they are placed further along the x-axis. This means that the penguin walking activity, close contact with animals, and the free and energetic nature of the animals make Chinese tourists feel excited, relaxed, and connected to nature.
With this approach, we can analyze the needs of visitors based on the feature patterns around the focus points and improve the visitor experience. For Asahiyama Zoo, in addition to the penguin walk activity, the close contact with animals and the interesting design of the zoo might also be very attractive to Chinese tourists. The reason may be that zoos in China are designed differently from those in Japan.

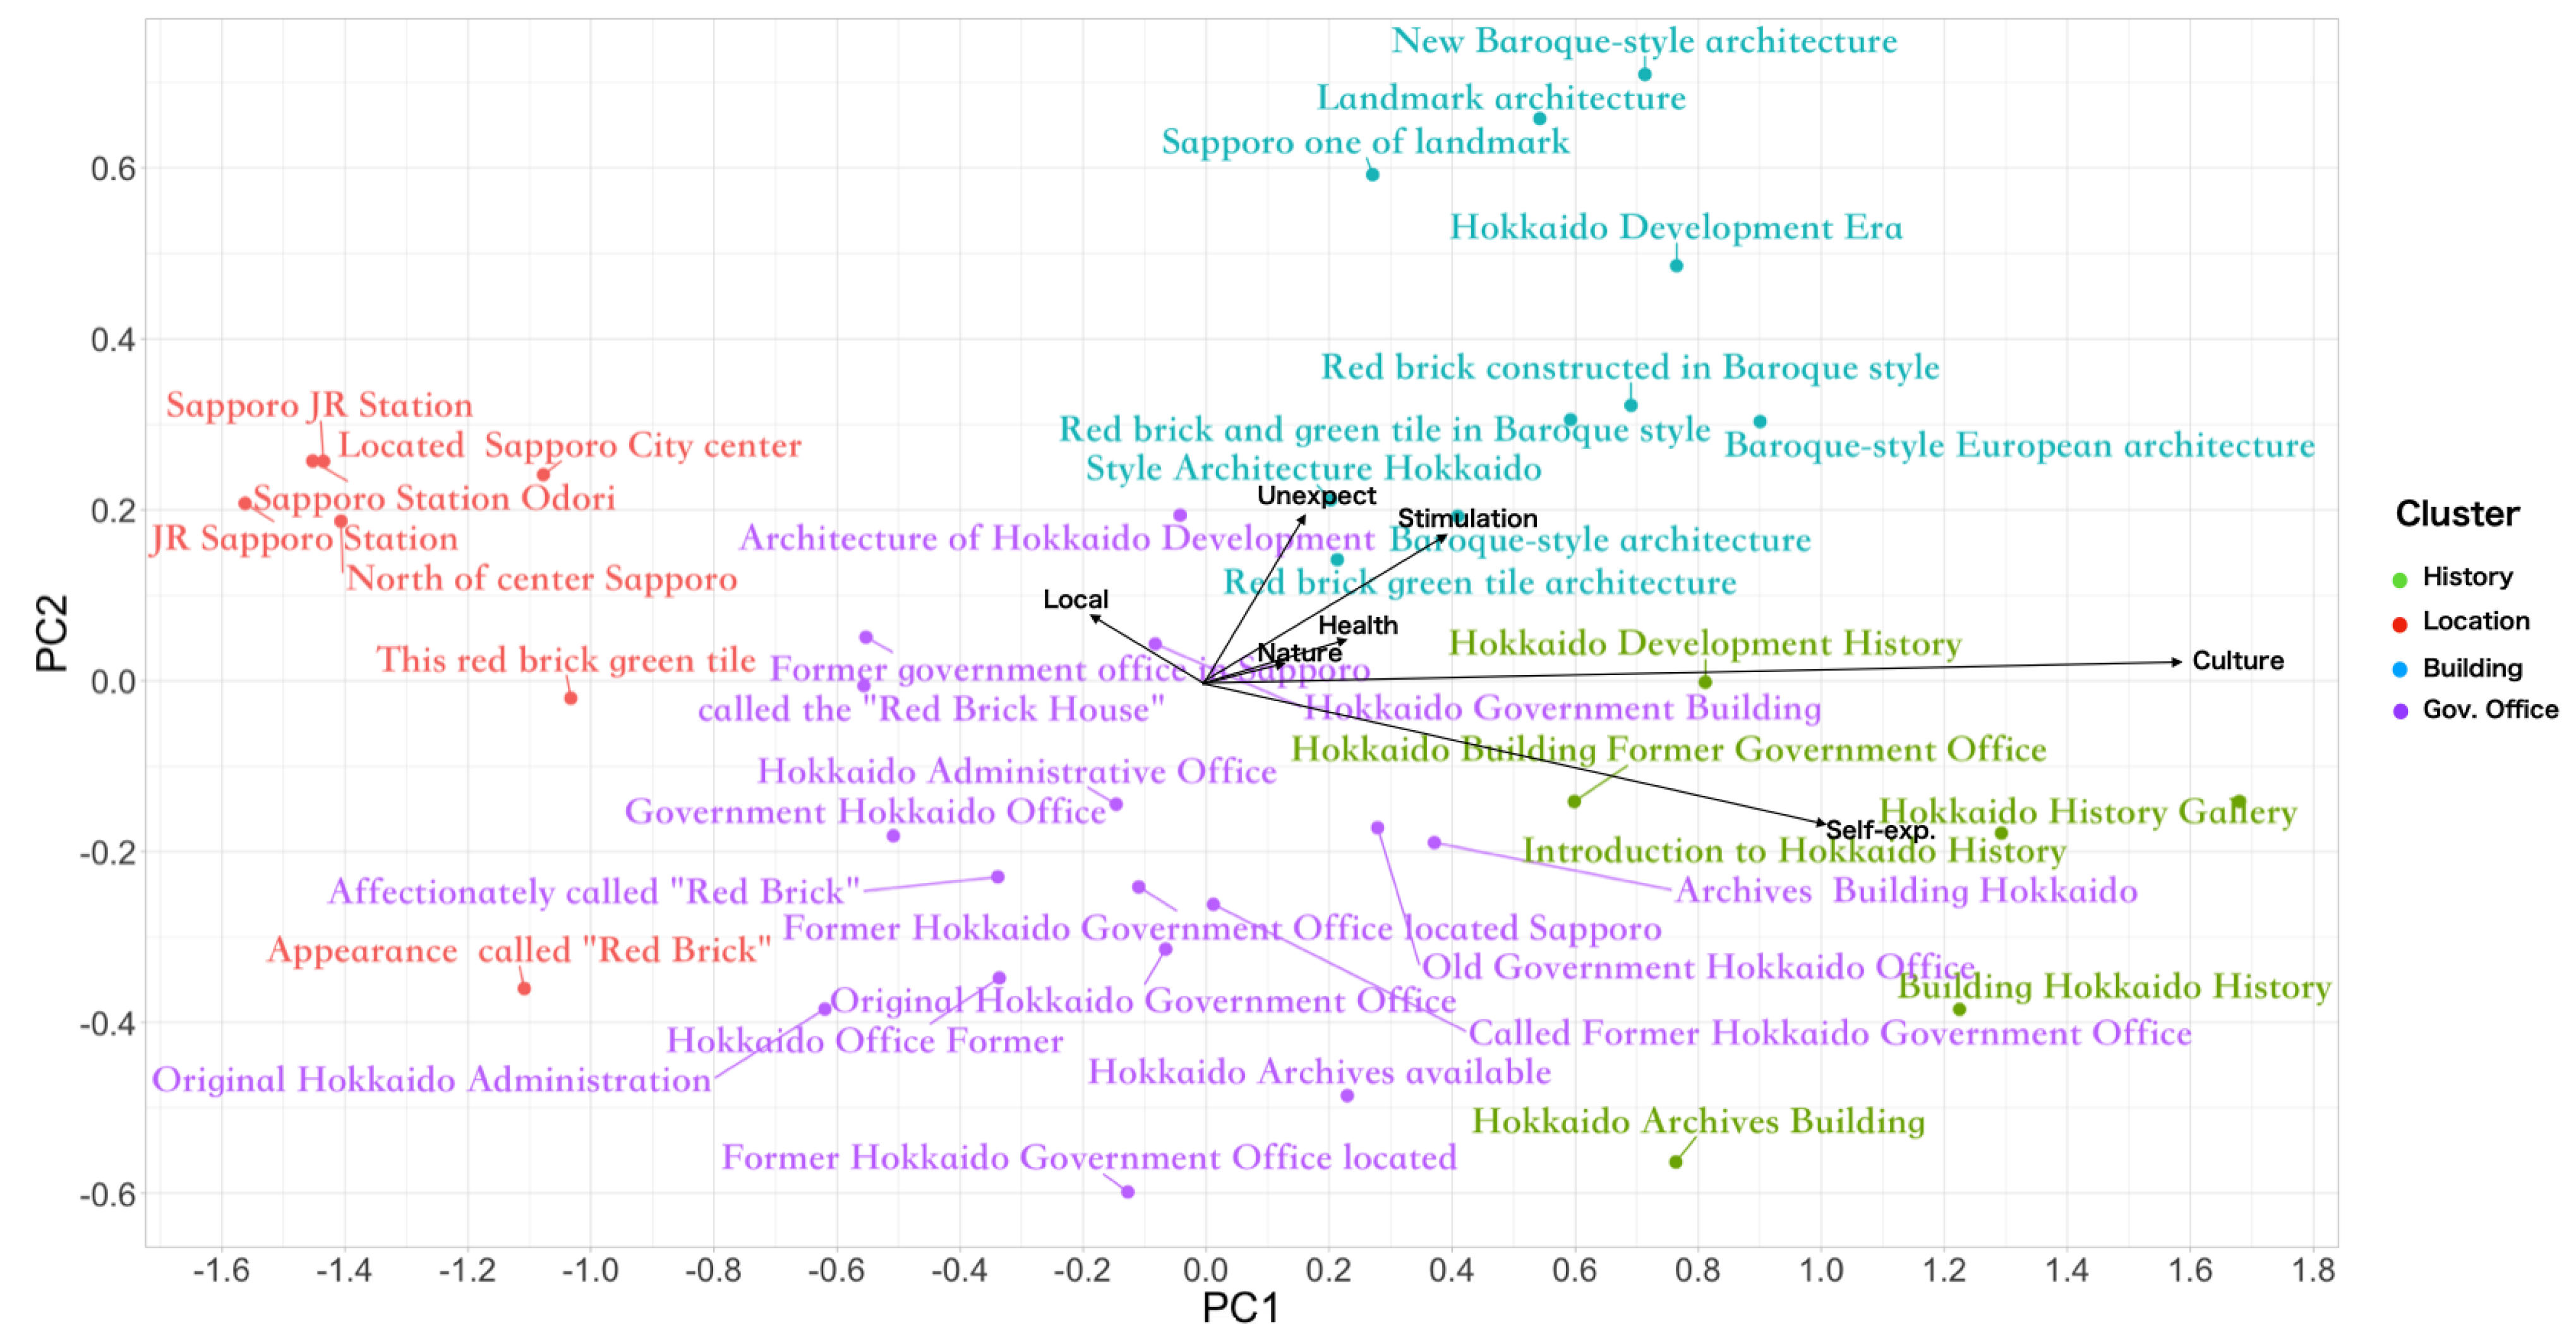
5.2.2. Former Hokkaido Govt. Office

The clustering result of the spot “Former Hokkaido Govt. Office” is shown in Figure 8. The clusters are “history”, “location”, “building”, and “gov. office”.
The focus points are cultural observation and educating oneself. The feature patterns from the “history” cluster have a higher score on PC1, which is strongly influenced by these focus points. This may indicate that Chinese tourists who visit this spot are interested in culture and history and are looking to expand their knowledge.
Additionally, the unexpectedness and stimulation factors have a higher score on PC2. Many feature patterns in the “building” cluster also have a high score on PC2, which suggests that the baroque-style building itself is so beautiful that it surprises many Chinese tourists. This is likely due to the fact that this style of building is not very common in China.
By using this method of analysis, it is possible to determine the possibility to provide Chinese tourists with more historical materials in Chinese to help them to better understand the history of Hokkaido and gain more cultural knowledge. Additionally, if the information about baroque-style buildings is emphasized more on websites or other media, it could encourage Chinese tourists to visit and take pictures.

5.3. Recommended Reviews

Based on the feature pattern clustering results, we can recommend reviews to users that contain feature patterns that are highly related to the focus points of tourist spots. This approach is more efficient than simply reading all customer reviews to find the focus points of tourist spots.
For example, in Figure 7, the focus points of Asahiyama Zoo are stimulation, health recovery, and experiencing nature, and the feature patterns that have high scores on these factors are “penguin walking activity”, “observe animal close”, “animal happy energetic”, and so on. In this way, we can automatically extract the reviews that contain these feature patterns as recommended reviews. Table 12 shows some examples of feature patterns, recommended reviews, and customer reviews. The original Chinese text of these reviews is shown in Appendix A, Table A2. We can see that compared to the customer reviews, the recommended reviews are more related to the feature patterns and contain the focus points of this tourist spot.

5.4. Implications

The implications of this research are significant for the tourism industry in Japan and beyond. By identifying the focus points of tourist destinations, tourism stakeholders can gain valuable insights into which aspects of their destinations are most appealing to inbound tourists. This knowledge can be used to improve marketing strategies by focusing promotional efforts on specific attractions, activities, or cultural experiences that resonate with tourists. By effectively highlighting and promoting these unique features, tourism stakeholders can enhance the overall visitor experience and differentiate their destination from others. This, in turn, can help to attract more tourists and drive economic growth in the tourism sector.
Furthermore, the methodology proposed in this study has the potential for broad application across different languages and countries, providing a global approach to tourism analysis. By replicating the research methodology in other contexts, researchers and tourism professionals can gain a better understanding of what motivates tourists from different regions and cultures to visit specific tourist attractions. This cross-cultural analysis can lead to the development of more tailored tourism products and services that satisfy the specific preferences and interests of different target markets. For example, by identifying the focus points of Chinese tourists visiting Hokkaido, the research results can be used to create customized tour packages, cultural experiences, or specialized services that cater specifically to this market segment.
In the context of the COVID-19 pandemic, this research also has implications regarding rebuilding and preparing for future emergencies in the tourism industry. By analyzing the differences in emphasis before and after the pandemic, tourism stakeholders can identify changes in tourist preferences and adjust their strategies accordingly. For example, if there is a shift in focus points from crowded attractions to outdoor or nature-based experiences, destinations can prioritize the development and promotion of such offerings. This adaptability and responsiveness to changing tourist preferences could be crucial in effectively managing crises and ensuring the resilience of the tourism industry in the face of unexpected challenges.
In addition, this research has implications for sustainable development in the tourism industry. By identifying the specific elements that are most attractive to Chinese tourists visiting Hokkaido, tourism stakeholders can align their efforts with sustainable tourism principles. For example, if natural landscapes and wildlife encounters are found to be major focus points, destinations can prioritize conservation efforts, implement responsible tourism practices, and engage in community-based initiatives that preserve the region’s natural beauty and biodiversity. In addition, by promoting cultural heritage and local traditions that appeal to Chinese tourists, tourism stakeholders can support the social well-being of local communities, foster cultural exchange, and generate economic benefits that contribute to the sustainable development of the region.
The social implications of our research are as follows:
  • Improved tourist experiences
    By understanding the focus points and preferences of tourists through online reviews, businesses can improve their offerings and provide more tailored and satisfying experiences for visitors. This can lead to increased satisfaction and positive word-of-mouth, benefiting both tourists and the local community.
  • Cultural exchange and understanding
    Analyzing reviews from tourists from different regions and cultures can provide a better understanding of their motivations and preferences. This can promote cultural exchange and mutual understanding between tourists and local communities, enriching the travel experience and fostering an intercultural dialogue.
  • Destination development
    Identifying areas for improvement based on online reviews can help destination managers and policymakers to develop strategies to improve the tourism infrastructure, services, and attractions. This can contribute to the sustainable development of tourist destinations and improve the overall socio-economic well-being of local communities.
The industrial implications of our research are as follows:
  • Marketing and advertising strategies
    By analyzing online reviews and understanding the focus points and preferences of tourists, businesses can tailor their marketing and advertising strategies to effectively communicate the unique features and appeal of their offerings. This can help them to attract more visitors and differentiate themselves from their competitors in the tourism industry. In addition, by analyzing online reviews and comparing the topics and themes, businesses can gain insights into areas that may need improvement. For the same type of destination, comparing the focus points of popular and unpopular spots can help to identify differences and opportunities for improvement.
  • Customer relationship management
    Understanding the topics discussed in online reviews can provide valuable insights into customer perceptions, preferences, and satisfaction levels. This information can be used to improve customer relationship management strategies, personalize interactions, and increase customer satisfaction and loyalty.
  • Industry collaboration and partnerships
    Research on online reviews and focus points can foster collaboration among industry stakeholders. Businesses, tourism boards, and other relevant organizations can work together to address common challenges, share best practices, and develop initiatives that improve the overall tourism experience in a destination or region.

5.5. Limitations of This Study

Despite the contributions of the proposed method, there are some limitations of this study that should be acknowledged. The proposed method relies on the scoring of n-gram patterns based on the seven types of motivational factors that influence tourists. The scoring process may be subjective and biased, and different raters may interpret and score the same patterns differently. This limitation can be mitigated by including multiple raters and assessing the inter-rater reliability, and by validating the scoring process with scores assigned by experts or another group of raters.
The experiment extracted feature patterns that represented the characteristics of each tourist site. However, some feature patterns were not captured solely based on the frequency of occurrence of keywords and n-gram patterns. To obtain a more complete picture, additional information extraction methods should be used to extract more comprehensive content.
We also analyzed the focus points based on the results of the first principal component and found that the average contribution rate of the first principal component for ten tourist spots was 0.62. However, this rate did not fully represent the data. In future research, we aim to analyze the second and third principal components as well in order to obtain a more comprehensive understanding of the data.
In addition, the proposed method focuses only on Chinese tourists’ evaluations of popular tourist spots in Hokkaido. Therefore, the results may not be possible to apply to other languages or tourist destinations. Future studies should replicate the proposed method with different languages and tourist destinations to provide more comprehensive insights into the foci of tourist spots.
In addition, the proposed method only considers written reviews, while some tourists may express their opinions about tourist spots through other means, such as photos or videos. Therefore, the results may not capture the full range of attention-grabbing aspects of the tourist spots.

6. Conclusions and Future Work

In this study, we propose a method for extracting and quantifying tourists’ points of interest based on the analysis of tourism reviews for the purpose of capturing and evaluating the attractiveness of tourist spots as seen by inbound tourists.
An evaluation experiment was conducted on tourist sites in Hokkaido, Japan. We confirmed that the proposed method can sufficiently capture the characteristics of tourist spots. The results of the customer reviews are different from those of the feature patterns because they include contexts other than the words contained in the patterns. The focus points can be seen most clearly when the feature patterns are used instead of a random set of customer reviews. Moreover, the recommended reviews seem to be a better choice than customer reviews if one is looking for information about a location and wishes to focus on the most important information.
We clustered the feature patterns from each spot to further clarify the specific content of the focus points. The clustered groups of feature patterns clearly sum up the information related to the focus points, which can help to improve the travel experience and attract more inbound tourists.
In the future, we plan to calculate the inter-rater agreement to validate the scoring process. We will also try to reduce the bias in the scoring process by comparing the obtained scores with those assigned by expert raters.
In addition, we will analyze the second and third principal components of focus points to gain a more comprehensive understanding of the data.
It is also necessary to improve the performance of feature pattern extraction. The feature patterns extracted in this experiment represented the characteristics of each tourist site to some extent. However, there were some feature patterns that could not be obtained only by computing the occurrence frequency of keywords and n-gram patterns. It is necessary to extract more comprehensive content by using other information extraction methods.
To extract information from other sources and platforms, we plan to apply image recognition and sentiment analysis. Analyzing images of tourist sites could provide valuable insights into the focus of the destination. For example, identifying the most frequently photographed landmarks or attractions can give an indication of what tourists find most interesting. Sentiment analysis involves using natural language processing techniques to determine the sentiment expressed in a text, whether positive, negative, or neutral. This can help to identify aspects of a tourist destination that tourists like or dislike. This method could be applied to social media posts and travel blogs, for example. In addition, analyzing social media platforms such as Instagram or Twitter can provide a wealth of information about tourist behavior and preferences. For example, analyzing hashtags related to a particular destination can help to identify the most popular tourist spots or activities.
The next step is to expand the range of tourist destinations to be evaluated. The proposed method of identifying the focus points of tourist spots has the potential to be applied to a wider range of languages and tourist destinations beyond the scope of the current study. While this study focused on reviews written in Chinese and popular tourist spots in Hokkaido, the methodology can be adapted to analyze reviews written in other languages and for tourist spots in other regions or countries.
In the sample obtained in the course of this research, there were multiple tourist spots that focused on experiencing nature, which is a common denominator of tourist attractions in Hokkaido. The method can be extended to analyze different types of tourist spots beyond the scope of this study, such as cultural sites or historical landmarks. The method could also be applied to different types of reviews, such as social media posts, travel blogs, or online forums.
In addition, we plan to compare the elements of interest and the image of destinations for each tourist site based on the reviews of Japanese and Chinese tourists. Extending the application of the proposed method to a wider range of languages, destinations, and types of reviews and tourist spots could provide a more comprehensive understanding of which aspects of tourist destinations are most appealing to inbound tourists around the world.

Author Contributions

Conceptualization, Z.L. and F.M.; methodology, Z.L. and F.M.; software, Z.L., J.E. and S.T.; validation, Z.L. and F.M.; formal analysis, Z.L.; investigation, Z.L.; data curation, Z.L. and J.E.; writing—original draft preparation, Z.L.; writing—review and editing, Z.L.; visualization, Z.L.; supervision, F.M. and M.P. All authors have read and agreed to the published version of the manuscript.

Funding

This research received no external funding.

Institutional Review Board Statement

Not applicable.

Informed Consent Statement

Not applicable.

Data Availability Statement

The data analyzed during this study are available on request from the corresponding author.

Conflicts of Interest

The authors declare no conflict of interest.

Appendix A

Table A1. Examples of the customer reviews.
Spot NameCustomer Reviews
旭山動物園
  • 冬天的旭山動物園最人氣的活動應該就是企鵝散步了。胖胖的國王企鵝一扭一搖的走在雪地上,還可以看的到企鵝寶寶“獼猴桃”,更好玩兒。企鵝散步的時間是上午11點和下午2點,個人建議是上午動物園開門之後,就先去看企鵝散步比較好。除此以外,旭山動物園的另一個人氣王就要數小熊貓了。萌萌的樣子,實在是可愛。旭山動物園每天都會有不同的動物餵食的活動,可以看到北極熊、小熊貓、海豹等等吃飯的樣子。每一次看到小動物們可愛的樣子,就覺得時間過的特別快,也會忘記生活中煩心的事情。所以說,逛動物園是一種特別治愈心情的事情。
  • 很喜歡去旭山動物園看冬天的企鵝散步。搖搖擺擺的,憨態可掬!看他們走路,在雪地裡扭扭擺擺,真的是開心到什麼煩惱都可以忘記。大家冬天去旅遊的話記得去北海道的旭山動物園逛逛呀,每天上午11點和下午2點半各有一次企鵝的散步活動,記得去看哦!人還蠻多的,記得早點兒去佔位置啊!
狸小路商店街
  • 來日本如果想買日本特色商品,比如藥妝或日本土特產,來狸小路就對了,可以至少逛上一天
  • 我並非第一次見到類似的場景了。這幾天只要走過狸小路總會看到一組這樣的年輕人,有男孩有女孩,有日本人有歐美人,演奏著各種樂器,唱著動感或是優美的歌。不是乞討賣唱,只是出於對音樂的喜愛和年輕的活力。他們的同伴和朋友或直接在他們面前席地而坐安靜聆聽,或在邊上踩著步伐打著節拍跟著哼唱。走過的路人看到了,不論愛不愛音樂,都會被這樣一幅年輕的畫面所感染,駐足觀看。
北海道庁旧本庁舎
  • 是一個政府機構,但是紅色的外表看著還挺漂亮的,個人還是非常的喜歡,特別像福爾摩斯電影裡面的一些建築物,拍照特別好看,特別是下雪的時候。
  • 北海道廳的舊址,歐式建築,入場免費,裡面可以了解北海道開發的歷史,裡面有中文的介紹冊。門口有紀念章蓋。
Table A2. Examples of feature patterns, recommended reviews, and customer reviews.
Feature PatternsRecommended ReviewsCustomer Reviews
企鵝散歩活動記不清有多久沒有去過動物園了,偶爾去一回,看到這些小可愛也會如小盆友一樣興奮。動物園裡除了招牌企鵝們,也有不少動物不可錯過,有北極熊、麋鹿、老虎,狼,還有這個與雪融為一体的雪梟。最不能錯過的就是毎日2場的企鵝散歩活動,超萌
  • 小動物們太可愛了,超萌,有機會還來。
  • 這裡最大的特點就是人性化的設計,最大程度保證了動物能處在相對自由的飼養状態中,並通過巧妙的展示讓遊客零距離観察動物,冬天動物園會推出企鵝大遊行的特色活動,遊客毎天有兩次機會跟隨在萌萌的企鵝隊伍身後四處行走。
  • 帶兒童去北海道旭川必打卡景點,很人性化的動物園,各類動物很多,孩子玩了很開心。
動物快樂充滿活力在這裡可以看到海豹、北極熊、企鵝等寒冷地區的動物。不過真正讓人印象深刻的是動物園主張呈現動物的生活原貌,讓遊客看到動物們快樂、充滿活力的模樣。
近距離観察動物動物都可以直接圍觀的,從上層,底層,直接直視都是可以全方位去了解動物的屬性。真的很近距離,除了猴子以及老虎類的有圍欄,基本都是可以近距離観察動物。値得一來!

References

  1. International Tourism and COVID-19. Available online: https://www.unwto.org/tourism-data/global-and-regional-tourism-performance (accessed on 1 May 2023).
  2. White Paper on Land, Infrastructure, Transport and Tourism in Japan. 2020. Available online: https://www.mlit.go.jp/hakusyo/mlit/r01/hakusho/r02/pdf/np101200.pdf (accessed on 1 January 2022).
  3. Number of Foreign Visitors to Japan, Estimated Values for December 2020 and Whole Year 2020. Available online: https://www.jnto.go.jp/jpn/news/press_releases/pdf/210120_monthly.pdf (accessed on 1 January 2021).
  4. The COVID-19 Pandemic Impact on Japanese Inbound Tourism. Available online: https://www.wakayama-u.ac.jp/ctr/news/2020101400019/ (accessed on 28 March 2023).
  5. White Paper on Tourism in Japan. 2020. Available online: https://www.mlit.go.jp/kankocho/en/siryou/content/001375676.pdf (accessed on 1 January 2022).
  6. Faeni, D.P.; Puspitaningtyas Faeni, R.; Alden Riyadh, H.; Yuliansyah, Y. The COVID-19 pandemic impact on the global tourism industry SMEs: A human capital development perspective. Rev. Int. Bus. Strategy 2023, 33, 317–327. [Google Scholar] [CrossRef]
  7. Pramana, S.; Paramartha, D.Y.; Ermawan, G.Y.; Deli, N.F.; Srimulyani, W. Impact of COVID-19 pandemic on tourism in Indonesia. Curr. Issues Tour. 2022, 25, 2422–2442. [Google Scholar] [CrossRef]
  8. Zhao, Y.; Wang, H.; Guo, Z.; Huang, M.; Pan, Y.; Guo, Y. Online reservation intention of tourist attractions in the COVID-19 context: An extended technology acceptance model. Sustainability 2022, 14, 10395. [Google Scholar] [CrossRef]
  9. Zeng, Z.; Chen, P.J.; Lew, A.A. From high-touch to high-tech: COVID-19 drives robotics adoption. Tour. Geogr. 2020, 22, 724–734. [Google Scholar] [CrossRef]
  10. Romero, J.; Lado, N. Service robots and COVID-19: Exploring perceptions of prevention efficacy at hotels in generation Z. Int. J. Contemp. Hosp. Manag. 2021, 33, 4057–4078. [Google Scholar] [CrossRef]
  11. Seyitoğlu, F.; Ivanov, S. Service robots as a tool for physical distancing in tourism. Curr. Issues Tour. 2020, 24, 1631–1634. [Google Scholar] [CrossRef]
  12. Hsu, C.; Huang, S. Travel motivation: A critical review of the concept’s development. In Tourism Management: Analysis, Behaviour and Strategy; CABI Publishing: Wallingford, UK, 2007; pp. 14–27. [Google Scholar] [CrossRef]
  13. Hayashi, Y.; Fujihara, T. Sightseeing motives of Japanese overseas tourists as a function of destination, tour type and age. Jpn. J. Exp. Soc. Psychol. 2008, 48, 17–31. [Google Scholar] [CrossRef]
  14. Wen, J.; Huang, S.S.; Ying, T. Relationships between Chinese cultural values and tourist motivations: A study of Chinese tourists visiting Israel. J. Destin. Mark. Manag. 2019, 14, 100367. [Google Scholar] [CrossRef]
  15. Chen, L.H.; Loverio, J.P.; Mei-jung, S.W.; Naipeng, T.B.; Shen, C.C. The role of face (mien-tzu) in Chinese tourists’ destination choice and behaviors. J. Hosp. Tour. Manag. 2021, 48, 500–508. [Google Scholar] [CrossRef]
  16. Simeon, M.I.; Buonincontri, P.; Cinquegrani, F.; Martone, A. Exploring tourists’ cultural experiences in Naples through online reviews. J. Hosp. Tour. Technol. 2017, 8, 220–238. [Google Scholar] [CrossRef]
  17. Ohkubo, R.; Muromachi, Y. A study of destination image of foreign tourists to Japan by analyzing travel guidebook and review site. J. City Plan. Inst. Jpn. 2014, 49, 573–578. [Google Scholar] [CrossRef]
  18. Ohkawa, S. A Cross-Language Comparison of Tourist Image Using Text Mining. Jpn. Soc. Inf. Manag. 2019, 39, 85–94. [Google Scholar] [CrossRef]
  19. Hoshino, Y.; Shibata, K.; Ishii, E.; Otomo, T.; Yamada, K. Extracting information from Twitter to create tourist information for foreigners [Gaikokujinmuke kanko joho sakusei no tame no Twitter kara no joho chushutsu]. In Proceedings of the 16th National Conference of Tourism Information Society (2019), Sanin, Japan, 29–30 June 2019; pp. 7–8. (In Japanese). [Google Scholar]
  20. Yasuhara, A.; Liu, M. A Study of the Differences between Japanese and Foreigners’ Tour Experiences of Hamarikyu Gardens by Analyzing Review Site. Pap. Environ. Inf. Sci. 2021, 35, 227–232. [Google Scholar]
  21. Emerson, T. Segmenting Chinese in Unicode. In Proceedings of the 16th International Unicode Conference, Amsterdam, The Netherlands, 27–30 March 2000. [Google Scholar]
  22. “Jieba” Chinese Text Segmentation. Available online: https://github.com/fxsjy/jieba (accessed on 28 March 2023).
  23. Chinese Stopword List. Available online: https://blog.csdn.net/shijiebei2009/article/details/39696571 (accessed on 28 March 2023).
  24. Liu, Z.; Masui, F.; Ptaszynski, M. Supporting Inbound Tourism in Hokkaido: Keyword Extraction and Focus Point Analysis from Spot Reviews. In Proceedings of the 2021 International Workshop on Modern Science and Technology, Kitami, Japan, 29 September 2021; The International Center of National University Corporation Kitami Institute of Technology: Kitami, Japan, 2021; Volume 2021, pp. 151–156. [Google Scholar]
  25. Mihalcea, R.; Tarau, P. TextRank: Bringing Order into Texts. In Proceedings of the EMNLP-04 and the 2004 Conference on Empirical Methods in Natural Language Processing, Barcelona, Spain, 25–26 July 2004. [Google Scholar]
  26. Blei, D.M.; Ng, A.Y.; Jordan, M.I. Latent dirichlet allocation. J. Mach. Learn. Res. 2003, 3, 993–1022. [Google Scholar]
  27. Manning, C.D.; Raghavan, P.; Schütze, H. Introduction to Information Retrieval; Cambridge University Press: Cambridge, UK, 2008. [Google Scholar] [CrossRef]
  28. Jurafsky, D.; Martin, J. Speech and Language Processing: An Introduction to Natural Language Processing, Computational Linguistics, and Speech Recognition; Prentice Hall: Upper Saddle River, NJ, USA, 2000; Volume 2, Chapter 4. [Google Scholar]
  29. Abdi, H.; Williams, L.J. Principal component analysis. WIREs Comput. Stat. 2010, 2, 433–459. [Google Scholar] [CrossRef]
  30. James, G.; Witten, D.; Hastie, T.; Tibshirani, R. An Introduction to Statistical Learning; Springer: New York, NY, USA, 2013; Chapter 12. [Google Scholar]
  31. Jolliffe, I. Principal Component Analysis. In Wiley StatsRef: Statistics Reference Online; John Wiley & Sons, Ltd.: Hoboken, NJ, USA, 2014. [Google Scholar] [CrossRef]
  32. Chakraborty, A.; Faujdar, N.; Punhani, A.; Saraswat, S. Comparative Study of K-Means Clustering Using Iris Data Set for Various Distances. In Proceedings of the 2020 10th International Conference on Cloud Computing, Data Science & Engineering (Confluence), Noida, India, 29–31 January 2020; pp. 332–335. [Google Scholar] [CrossRef]
  33. Bishop, C.M. Pattern Recognition and Machine Learning (Information Science and Statistics), 1st ed.; Springer: Berlin/Heidelberg, Germany, 2007. [Google Scholar]
  34. Comaniciu, D.; Meer, P. A Robust Approach Toward Feature Space Analysis. IEEE Trans. Pattern Anal. Mach. Intell. 2002, 24, 603–619. [Google Scholar] [CrossRef]
  35. Ng, A.Y.; Jordan, M.I.; Weiss, Y. On Spectral Clustering: Analysis and an algorithm. In Advances in Neural Information Processing Systems 14; MIT Press: Montreal, QC, Canada, 2001; pp. 849–856. [Google Scholar]
Figure 1. Flowchart of the proposed method.
Sustainability 15 08748 g001
Figure 2. Example of tourism motivation score (Asahiyama Zoo).
Sustainability 15 08748 g002
Figure 3. The tourism motivation scores of Hokkaido.
Sustainability 15 08748 g003
Figure 4. Word cloud of the reviews of Hokkaido.
Sustainability 15 08748 g004
Figure 5. The tourism motivation scores of the spots.
Sustainability 15 08748 g005
Figure 6. Word cloud of the reviews of Asahiyama Zoo.
Sustainability 15 08748 g006
Figure 7. Spectral clustering result for “Asahiyama Zoo”.
Sustainability 15 08748 g007
Figure 8. Spectral clustering result for “Former Hokkaido Govt. Office”.
Sustainability 15 08748 g008
Table 1. Top 10 keywords used to describe Asahiyama Zoo.
No.KeywordEnglishTF-IDF Value
1動物園zoo0.5025
2企鵝penguin0.3924
3旭川Asahikawa0.2666
4動物animal0.1827
5旭山Asahiyama0.1719
6北極熊polar bear0.1090
7散步walk0.0986
8可愛cute0.0900
9北海道Hokkaido0.0773
10遊客tourist0.0550
Table 2. n-gram examples.
n Sizen-gram Pattern ListEnglish Translation
1動物園, 有, 企鵝, 游行, 活動zoo, has, penguin, walking, event
2動物園有, 有企鵝, 企鵝游行, 游行活動zoo has, has penguin, penguin walking, walking event
3動物園有企鵝, 有企鵝游行, 企鵝游行活動zoo has penguin, has penguin walking, penguin walking event
Table 3. Feature patterns containing the keyword “zoo”.
No.Feature PatternsEnglishFrequency
1日本北端動物園Japan north zoo15
2旭山動物園日本Asahiyama zoo Japan12
3北海道旭山動物園Hokkaido Asahiyama zoo10
4東京都上野動物園Tokyo Ueno zoo10
5旭川動物園企鵝Asahikawa zoo penguin8
6動物園里動物animals in the zoo7
7到達旭山動物園arrive at Asahiyama zoo7
8日本有名動物園famous zoo in Japan7
9参観人数最多動物園the most visited zoo6
10前往旭山動物園go to Asahiyama zoo6
Table 4. Explanation of Tourist Motivation Scale.
The Tourism Motivation ScaleExplanation
Stimulation (Stimul.)Experiencing novelty and change
Cultural observation (Culture)Interest in the culture of the visited area
Local communication (Local)Communication with local people while traveling
Health recovery (Health)Recovery from daily fatigue and stress
Experiencing nature (Nature)Getting into direct contact with nature
Unexpectedness (Unexpect.)Surprising, unexpected experiences
educating oneself (Self-exp.)Improvements/changes in your inner self
Table 5. The scoring criteria.
Degree of JudgementScore
Strongly related5
Closely related4
Moderately related3
Somewhat related2
Unrelated1
Table 6. Examples of scoring.
Feature PatternStimul.CultureLocalHealthNatureUnexpect.Self-Exp.
Zoo Penguin Walking3224312
Table 8. The contribution rates of the first principal component.
Spot NameFeature PatternCustomer Review
旭山動物園 (Asahiyama Zoo)0.790.69
北海道庁旧本庁舎 (Former Hokkaido Govt. Office)0.730.46
北海道神宮 (Hokkaido Shrine)0.550.45
登別地獄谷 (Noboribetsu Hell Valley)0.620.32
大通公園 (Odori Park)0.750.44
小樽運河 (Otaru Canal)0.490.59
小樽音楽盒堂 (Otaru Music Box Hall)0.560.43
札幌電視塔 (Sapporo TV Tower)0.600.41
白色恋人公園 (Shiroi Koibito Park)0.470.39
狸小路商店街 (Tanukikoji Shopping Street)0.620.60
Average0.620.48
Table 9. The accuracy of different clustering methods.
Spot NameGMMMean ShiftK-MeansSpectral Clustering
旭山動物園 (Asahiyama Zoo)0.940.920.940.96
北海道庁旧本庁舎 (Former Hokkaido Govt. Office)0.610.710.840.74
北海道神宮 (Hokkaido Shrine)0.550.850.971.00
白色恋人公園 (Shiroi Koibito Park)0.480.660.870.93
狸小路商店街 (Tanukikoji Shopping Street)0.41-0.740.97
Average0.590.780.870.92
Table 10. Examples of the customer reviews.
Spot NameCustomer Reviews
Asahiyama Zoo
  • The most popular activity at Asahiyama Zoo in winter is the penguin walk. Chubby king penguins wiggle and sway on the snow, and you get to observe the baby penguins, known as “kiwis”, which adds even more fun to the experience. The penguin walk takes place at 11 a.m. and 2 p.m., so I recommend going to see the penguins first thing in the morning, after the zoo opens. Another popular attraction at Asahiyama Zoo is the red panda enclosure. They are so cute and cuddly. Every day there are different animal feeding events at Asahiyama Zoo, where you can see polar bears, red pandas, seals and more animals eating. Every time you see the cute little animals, you feel that time goes by especially fast and you forget about the things that bother you in life. That’s why visiting the zoo is so healing.
  • I love to go to Asahiyama Zoo to see the penguins walking in winter. They are so cute and wiggly! Watching them walk and wiggle in the snow really makes you happy and you can forget all your worries. Remember to go to Hokkaido’s Asahiyama Zoo if you’re traveling in winter. There’s a penguin walk every day at 11 a.m. and 2:30 p.m.! It’s quite crowded, so remember to go early and take your place!
Tanukikoji Shopping Street
  • If you come to Japan to buy Japanese specialties, such as cosmetics or Japanese souvenirs, you can spend at least a day shopping on Tanukikoji Shopping Street.
  • This is not the first time I have seen a scene like this. These days as long as walking through the path always see a group of such young people, boys and girls, Japanese and Europeans and Americans, playing various musical instruments, singing in harmony or beautiful songs. Not peddling and singing, just out of love for music and youthful energy. Their companions and friends are directly in front of them sitting on the ground quietly listening, or on the side of the pace of the beat to hum along. Passers-by, whether they love music or not, will be infected by such a youthful picture, and stop to watch.
Former Hokkaido Govt. Office
  • It is a government agency, but the red brick exterior looks quite beautiful, and I personally still like it very much, like some of the buildings inside the Sherlock Holmes movies, and it is very nice to take pictures, especially when it is snowing.
  • The former site of the Hokkaido Office is a European-style building, and admission is free. Inside, you can learn about the history of Hokkaido’s development, and there is an introduction booklet in Chinese. There is a commemorative stamp at the entrance.
Table 11. Examples of customer reviews and feature patterns for the Former Hokkaido Govt. Office.
Customer ReviewFeature Pattern
…I went to Odori Park and played in the snow,
then I walked to the Former Hokkaido Govt.
Office… I was taking photos in front of the red
office building, and together with the snowy
scenery, it gives a very exotic feeling. There was a
river nearby, but it was too cold to go around it…
Hokkaido, documents, museums
documents, museum, Hokkaido
introduction, Hokkaido, history
Hokkaido, development, history
red bricks, green tiles, baroque
Hokkaido, government, building
Hokkaido, reclamation, period
style, architecture, Hokkaido
This, red brick, green tile
Hokkaido, building, former office
Table 12. Examples of feature patterns, recommended reviews, and customer reviews.
Feature PatternsRecommended ReviewsCustomer Reviews
penguin walk activityI can’t remember how long it’s been since I’ve been to the zoo, but once in a while, I get as excited as a little kid to see these little cuties. Apart from the signature penguins, the zoo also has a number of animals not to be missed, including polar bears, mooses, tigers, wolves, and a snow owl that blends in with the snow. Not to be missed are the two daily penguin walk activities, which are super cute!
  • The small animals are so cute and adorable, I would love to come back again if I have the chance.
  • Asahiyama Zoo’s best feature is its humane design, which maximizes the animals’ ability to be kept in a relatively free-range environment. Through clever displays, visitors can observe the animals up close. In the winter, the zoo features a special event called the Penguin Parade, where visitors have two opportunities each day to follow the cute penguins as they walk around.
  • A must-visit spot in Asahikawa, Hokkaido for families with children. The animal zoo is very user-friendly and has a wide variety of animals. My child had a great time playing there.
animal happy energeticSeals, polar bears, penguins, and other animals from colder regions can be seen here. But what is really impressive is that the zoo promotes presenting the animals as they are, allowing visitors to see the animals as happy and energetic as they are.
observe animal closeThe animals can be viewed directly, from the top, the bottom and directly in front of you, so you can get to enjoy their appearance from all sides. It’s really close up, except for the monkeys and tigers, which have enclosures, so you can basically observe the animals up close. It’s worth a visit!
Disclaimer/Publisher’s Note: The statements, opinions and data contained in all publications are solely those of the individual author(s) and contributor(s) and not of MDPI and/or the editor(s). MDPI and/or the editor(s) disclaim responsibility for any injury to people or property resulting from any ideas, methods, instructions or products referred to in the content.

