Article

Criteria Clustering and Supplier Segmentation Based on Sustainable Shared Value Using BWM and PROMETHEE

1
Faculty of International Business, Normandy University, 76600 Le Havre, France
2
Department of Industrial Management, Tarbiat Modares University, Tehran 14115111, Iran
*
Author to whom correspondence should be addressed.
Sustainability 2023, 15(11), 8670; https://doi.org/10.3390/su15118670
Submission received: 6 March 2023 / Revised: 22 May 2023 / Accepted: 23 May 2023 / Published: 26 May 2023
(This article belongs to the Special Issue Smart Cities, Eco-Cities, Green Transport and Sustainability)

Abstract

:
With the advent of healthy visions, two of the trends that have become extremely important in the supply chain in recent decades are corporate social responsibility (CSR) and sustainability, which have affected the activities of buyers and suppliers. The next trend that is emerging is the vision of creating shared value (CSV), which wants to move the supply chain toward solving social problems in a completely strategic way. This research intends to develop a step-by-step framework for evaluating and segmenting suppliers based on CSV criteria in the supply chain. In the first stage, the criteria for creating sustainable shared value (CSSV) are obtained through existing activities in the field of CSR. The obtained criteria are then divided into two categories, strategic and critical, and then the weight of each criterion is obtained using the best–worst method (BWM). In the next step, based on the Kraljic model, the suppliers are divided into four clusters using the preference ranking organization method for enrichment evaluation (PROMETHEE) technique. This framework helps the buyer to conclude and select purchasing decisions and relationships with suppliers through the lenses of CSV and sustainability.

1. Introduction

Considering the high competition because of the increasing number of suppliers and disruptive factors [1,2] such as market demand for high-quality produced materials, and as a result, customers’ more diverse choices, the importance of high-quality raw materials and suppliers’ high performance as an organization is increasing [3,4]. In other words, buying a strategic role is important in a company’s supply chain management and is considered the most important competitive advantage for any company [5,6]. Therefore, formulating suitable interactive strategies with suppliers is of high importance [7]. Moreover, in recent years, with the expansion of food and pharmacy exchanges, the cold supply chain has received much attention [8]. These trends are expected to continue to increase based on Figure 1, and even COVID-19 and its new variants (or strains) will not be able to prevent them from spreading.
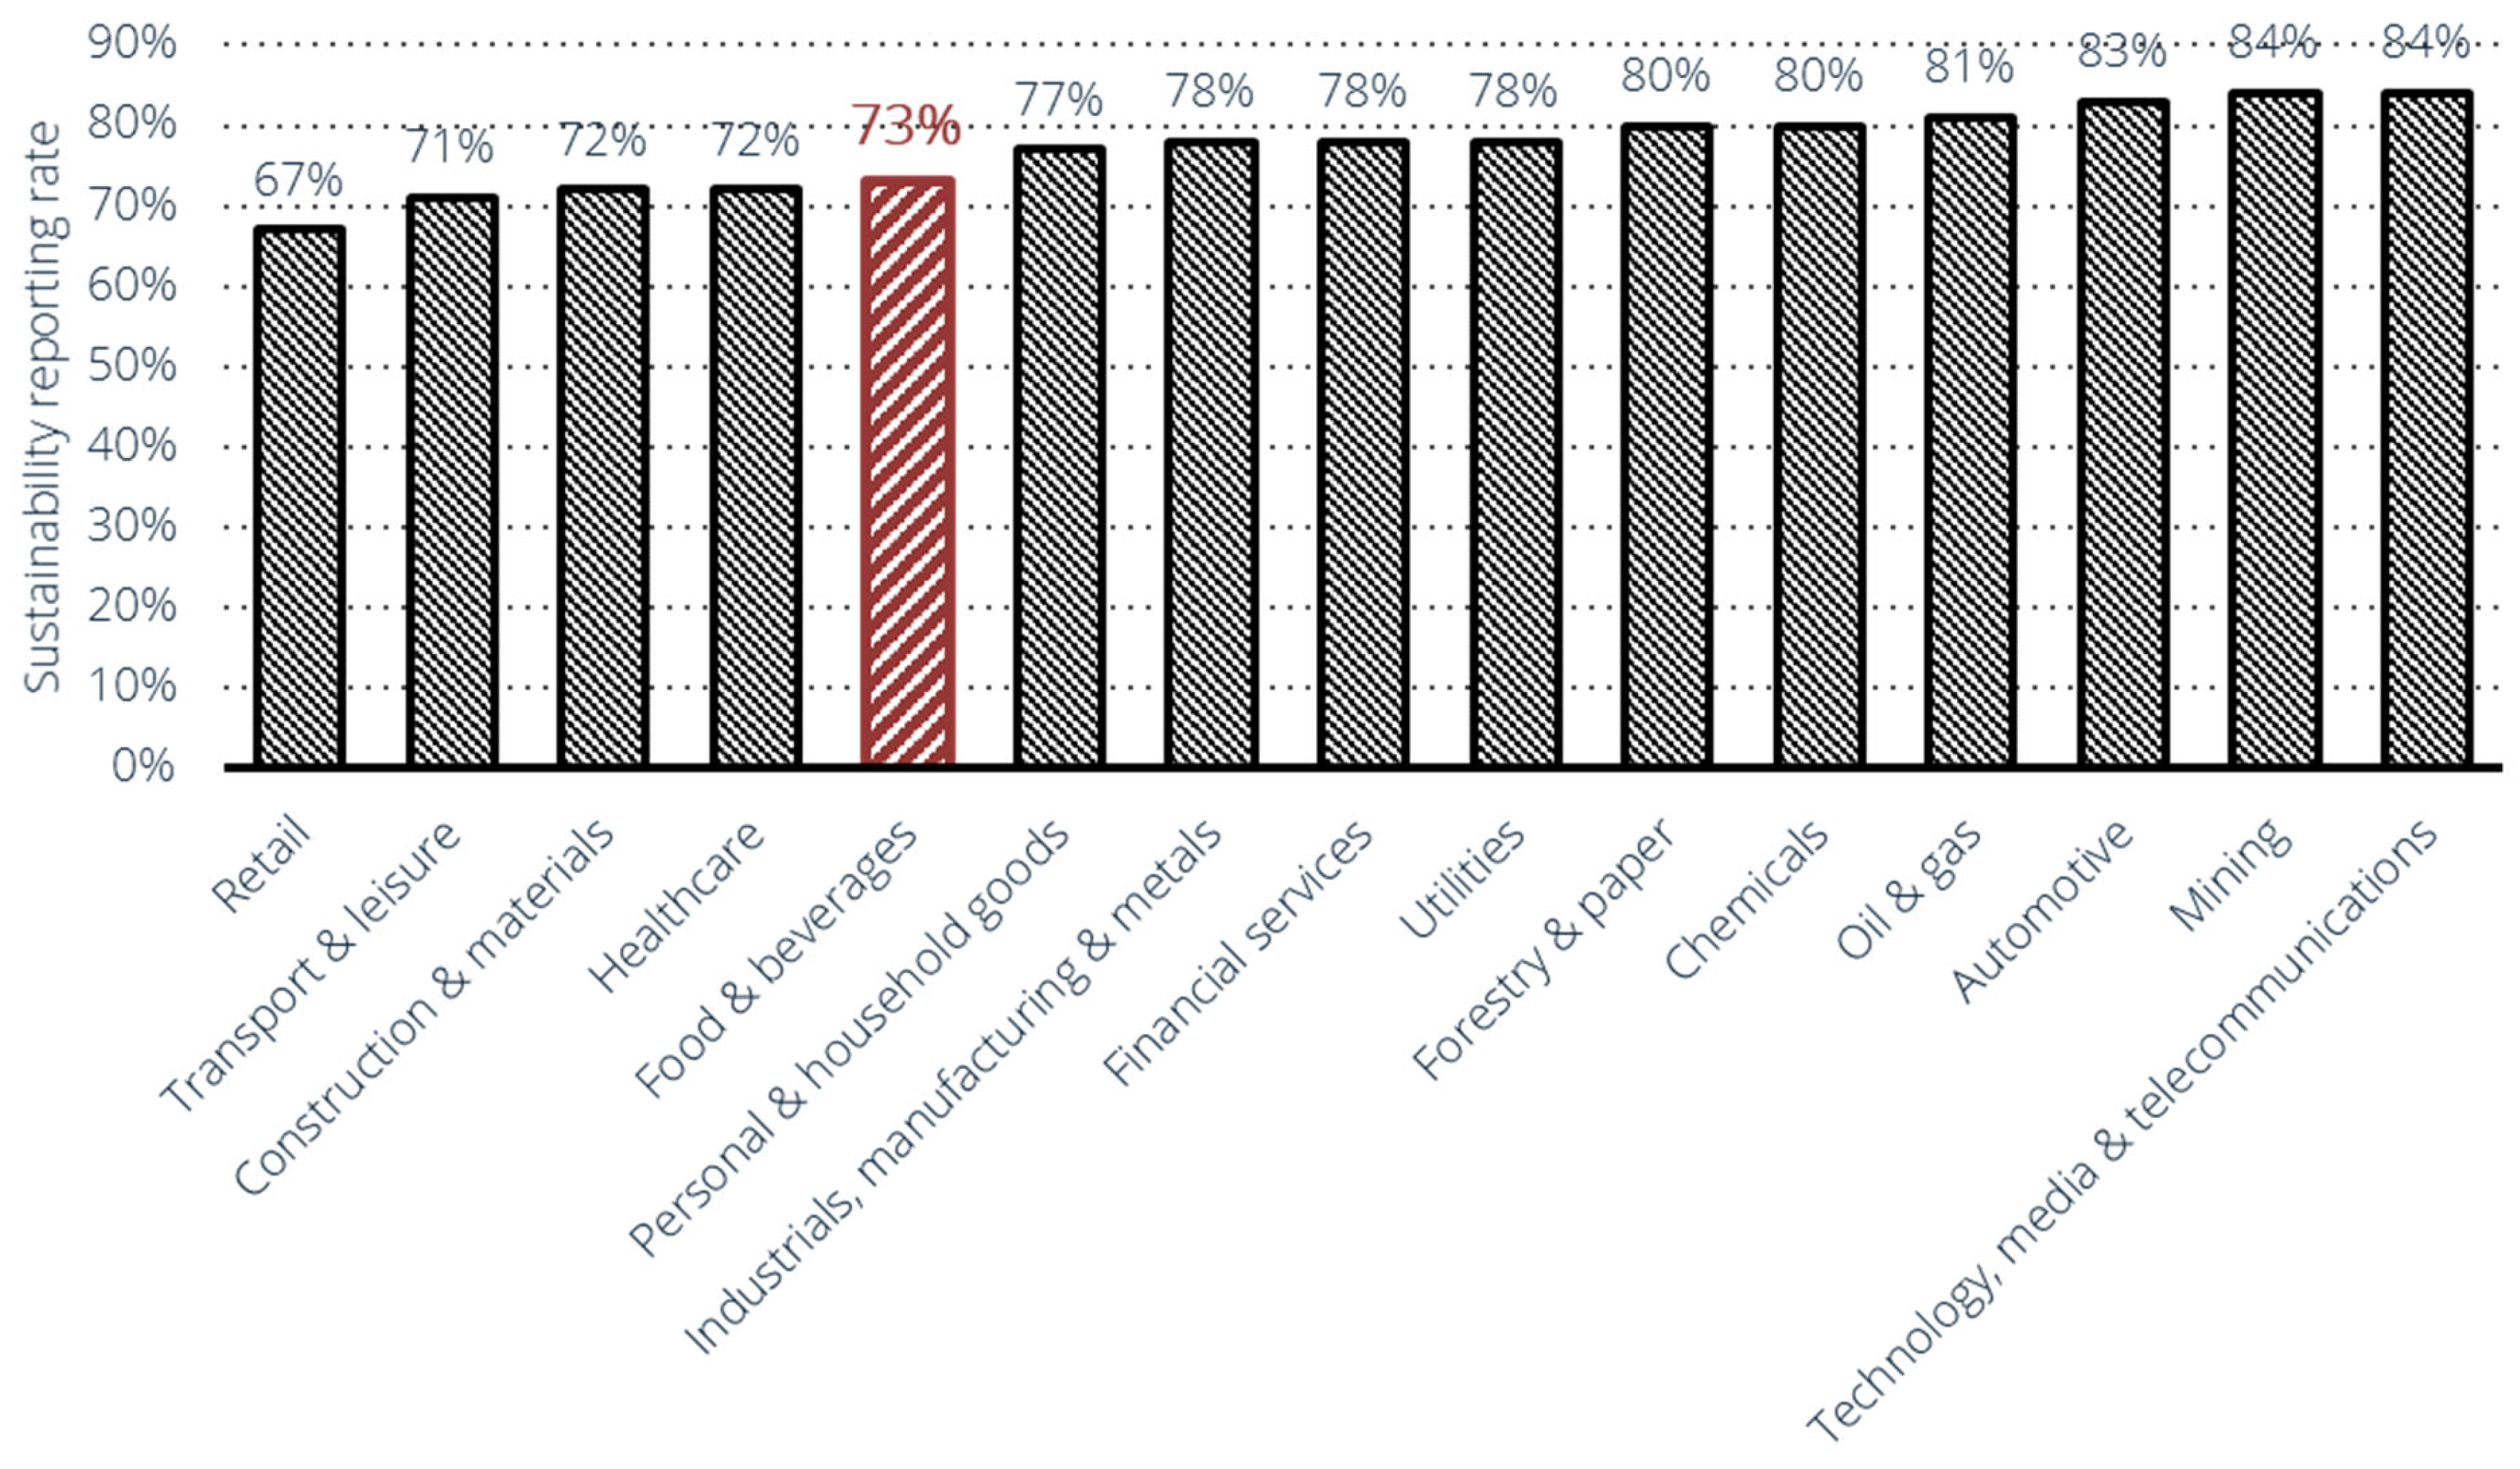
Moreover, any company has to improve its performance by considering organizational and commercial sustainability to compete in this challenging environment, which shows the importance of the relationship between supplier and producer [9,10]. In this regard, statistics show that the food industry is significantly concerned with the issue of sustainability. Figure 2 shows the extent to which companies pay attention to sustainability reports based on the type of industry in 2020, in which the food industry is also among the top 10. Due to the problems that have arisen since the COVID-19 pandemic, not only has attention been paid to the issue of sustainability but it is thought that this will become more apparent in the food industry [11].
Selecting a suitable supplier is one of the most important activities of any organization, especially in the food industry. Selecting suppliers in this industry also is very challenging because it requires evaluating multiple aspects and criteria [3]. Evaluation criteria have to be more comprehensive to evaluate suppliers comprehensibly and completely, so it is not enough to use only general criteria such as price, product, and service quality, as different criteria related to an organization’s internal and external factors must be considered. These criteria may be useful in preparing suitable interactive strategies for organizational growth and achievement [3,12,13].
Thus, supplier selection and evaluation problems have been solved using multiple-criteria decision-making (MCDM) methods [14]. MCDM is a suitable method to evaluate supplier quantitative features with difficult and ambiguous mathematical and quantitative definitions, and the combination of these variables results in complex quantitative variables for which it is suitable [15]. In addition, MCDM techniques are used to segregate complex problems into smaller parts [16]. As a result, after analysis, all the parts will be combined and they will represent a complete image of the problem [17,18]. Furthermore, this approach is also useful in cases where the supplier evaluation criteria are naturally conflicting with each other [15].
The present study aims to present a framework to evaluate suppliers and prepare suitable strategies with any groups of factory suppliers (in the case of the food industry in Iran, with an emphasis on the meat sector). Considering that there are many suppliers in this kind of factory and different ranges of quantitative and qualitative criteria to evaluate these suppliers, the MCDM technique has been used to identify, evaluate and prepare interactive strategies with suppliers. Therefore, the BWM method has been used for the criteria weighting. The final criterion is the result of collecting different criteria from the related literature on supplier evaluation and consultation with target factory experts to achieve a total consensus about the suitable criteria.
After achieving the total score for each supplier, the suppliers have been clustered using the method of Segura and Maroto [3]. This clustering method is a developed form of Kraljic’s purchasing model [19]. Finally, the suppliers in each cluster are ranked using the PROMETHEE method and the most important criteria influential in placing each suppler in each cluster are identified using a powerful feature of the PROMETHEE software that is the geometrical analysis for interactive decision aid (GAIA) visual analysis. The result is to achieve a new approach to diagnosing key criteria (using a GAIA visual analysis). Proportional to the features of each cluster, these criteria may be useful in achieving an interactive strategy so that it may transfer suppliers from one cluster to another and the interactive strategy between two parties may change.
In what follows, the related literature will be considered and the proposed methodology will be briefly discussed, which is demonstrative of using a compensatory multi-criteria approach. In the next step, the research results will be presented, and finally, the conclusions and recommendations are discussed.

2. Research Background

There are many factors that have expanded our view of supply chain management and demonstrated the importance of supply chain management [20] for the organization’s adaptability to target market conditions and guarantee the achievement of that organization in competition with its counterparts. These factors may guarantee the high number of suppliers, competitive atmosphere between suppliers and producers, and issues related to the technology growth speed and the short life-cycle of products [21,22,23]. Since suppliers provide organizations with different services, and considering that they are active in their product innovation and even if environmental and ethical issues occur, they are faced with a wide range of variables that have made old methods of evaluating and selecting and working with suppliers more complicated [9,24,25].
Nowadays, we need deeper and more participatory relationships, and also we need to use methods that make supplier relationship management more practical and more simple and facilitate selecting the best strategic interactive approach with them [26,27]. All of these factors are demonstrative of suppliers’ important differences and, as a result, highlight the need to prepare diverse strategies to interact with them. It is critical to select a supplier to make strategic cooperative relationships, because doing so develops the supply chain and increases the efficiency and effectiveness of organizations [7,28]. Strategically selecting a supplier is an MCDM problem that must be able to make value for both parties [21,29,30]. Therefore, a more efficient approach is necessary for supplier management and one of the most effective ways to solve this problem was through dividing suppliers [9,31,32].
Producer clustering aims to make some parts with different manageable strategies and reduce some strategies that a supplier needs to develop [33]. Supplier division improves the position of a purchasing company in the target market [9]. Therefore, conducting studies concerning evaluating competence, selection, and clustering, suppliers’ performance, permanent supervision and control are among the fundamental activities that must be applied in the supply chain management of any company [3,29], some of which will be mentioned in the following.
A study, for the first time, introduced the BWM to evaluate and cluster suppliers, and according to this method, the suppliers were clustered and evaluated based on two capability and tendency criteria [31,32,34]. In this regard, a study was conducted by [35] on a supplier selection framework in the agricultural industry. For this purpose, the BWM along with the Vlse Kriterijumska Optimizacija I Kompromisno Resenje (VIKOR) method were employed. Another study investigated suitable evaluation tendencies to cluster and evaluate suppliers using Kraljic’s purchasing model [19] in Indian factories [36]. Different management levels were used to interview experts and the outcome was 26 criteria to cluster suppliers [36]. Another study investigated criteria related to supplier evaluation and selection in two groups, one group related to product evaluation indices and another one was among indices related to supplier evaluation, each of which included two clusters of critical criteria and strategic criteria [3].
Another study classified the suppliers of a company using a mix of two supplier clustering methods [37]. The first method was a purchasing portfolio matrix (PPM), including the two dimensions of profit impact and supply risk, and the second method recommended a new approach to clustering suppliers, which was called a supplier potential matrix (SPM), which evaluated suppliers based on supplier capabilities and supplier willingness [37]. A group of researchers developed a model to classify suppliers inside the purchase instructions and market trends of a small Italian company. The model was applied to identify critical supply chains, finally aiming at reducing the lead time, and the profit impact and supply risk were two clusters of criteria used to evaluate and cluster suppliers using the PPM and Kraljic matrix in this study [38].
In another study, researchers focused on criteria such as reducing product costs and competitiveness improvement. They also focused on production programming based on real operational capacity. The other consideration was the flexible adaptation of the market and workforce efficiency in relation to many petrochemical products and economically valuable products to evaluate suppliers and cluster them in an oil company. They used a model of MCDM, including the supply chain operation reference (SCOR), analytic hierarchy process (AHP) and data envelopment analysis (DEA) to evaluate and select optimal suppliers in the oil industry [39].
In order to evaluate and select the suppliers of an active company in the field of carbon fiber composite materials production and development, researchers used some criteria to attract the trust of the factory to receive high-quality materials from suppliers. These criteria were quality, cost, delivery time, and service. In order to facilitate supplier management and prevent unnecessary factory investigations from public suppliers and reduce human, material and financial resource wastes, the suppliers were classified into the three groups of the main suppliers, most important suppliers and public suppliers [40].
Another study evaluated and selected suppliers to select a sustainable and resilient supplier in a palm oil production factory in Malaysia using public, sustainable and resilient criteria. In addition, this study used an ultra-synthetic model consisting of the fuzzy-decision-making trial and evaluation laboratory (F-DEMATEL), fuzzy best–worst method (FBWM), fuzzy analytical network process (FANP), and fuzzy inference system (FIS) to apply the capabilities of these methods simultaneously in an efficient method [41,42,43].
Another study suggested a new decision-making framework in the field of participatory innovation. The model helped the producers of new energy vehicles (NEVs) promote or improve their performance and cooperate with other producers, and it focused on ability and tendency–risk criteria to evaluate suppliers and the VIKOR method was used to classify suppliers [44].
Critical criteria mainly investigate the market, while strategic criteria focus on internal organizational operations. Table 1 shows the criteria used in studies conducted from 2007 to 2021.
The most famous and the most useful clustering method is the Kraljic purchasing portfolio model introduced in [19], and so many researchers have developed and expanded it [57]. This systematic approach suggests two dimensions of risk and profit impact to classify suppliers.
Four parts are made using these two dimensions, and strategies to manage these parts are represented differently. This purchasing matrix has attracted the attention of so many researchers and companies due to its usefulness and flexibility [57]. An evaluation method is needed to cluster suppliers so as to evaluate suppliers with high numbers and different types of quantitative and qualitative variables and to help us prepare interactive strategies with suppliers, so multi-attribute decision-making (MADM) methods are our solution. Considering the previous studies about clustering, the most important MADM methods are as follows.
The first group is a method such as the BWM, ANP, or AHP aiming at criteria weighting, sub-criteria, and co-ranking options. The second group includes methods aiming at ranking research options. There are methods such as the PROMETHEE, technique for order of preference by similarity to ideal solution (TOPSIS), VIKOR, and elimination and choice expressing reality (ELECTERE) methods in this group. The second group is also known as auxiliary methods because they are not used alone and are used as an auxiliary or combination of the methods in the first group. These methods need criteria weights to rank research options, and these weights can be provided by the respondent and be calculated by the first group methods and then used as inputs [3].
As mentioned before, this study aims at clustering suppliers using the model developed by Segura and Maroto [3], and after selecting suitable criteria extracted from the study by Govindan and Dhingra Darbari [9], as weighted by the BWM, this selection was due to the less pairwise comparison method and achieved a more compatible pairwise comparison with higher confidence than methods such as the AHP and, on the other hand, due to the quantitative and qualitative criteria and high number of suppliers in this study [34]. Then, the suppliers have been classified and better interactive strategies for organizations selected by identifying key and influential criteria (positive or negative) and suitable interactive strategies with suppliers using a new approach to diagnosing key criteria. The PROMETHEE method has simple and understandable calculations compared with other MCDM methods. The most important difference between the PROMETHEE and other MCMD methods is its internal relationships during the decision-making stages. In addition, this method can well solve the problems of decision-making problems such as options evaluation using contradictory criteria [58]. Therefore, the visual PROMETHEE method and its specific and ignored capabilities (to evaluate suppliers), namely the GAIA visual analysis, have been used to detect these criteria. Consequently, the PROMETHEE was used in this study to diagnose these criteria in each group of suppliers. As you will see, the specific capabilities of this approach lead to its practical effectiveness in diagnosing effective and ineffective criteria in each of these supplier clusters considering the specific features of the PROMETHEE visual software.

3. Models and Materials

As mentioned before, this study aimed to present a model for clustering and adopting suitable strategies with suppliers from each cluster. Thus, suitable criteria extraction for the organization under investigation was prioritized. For more accurate investigation and analysis, criteria including the evaluation of the supplier himself and his product were considered. Such criteria were gathered from previous studies, and Table 1 shows the result of this investigation and how much the indices were used by different researchers is shown based on the frequency. Additionally, Figure 3 shows the interviews with the organization’s experts under investigation in the form of focus groups. Moreover, these criteria have been classified based on their nature into groups of critical and strategic criteria for the product and supplier himself. Then, these criteria were weighted with the opinion of the organizational manager and two involved experts in the system using the BWM.
After weighting, questionnaires based on a nine-degree Saaty scale were distributed among the organization’s experts to score suppliers based on criteria related to the supplier and designed product. After scoring each supplier and their clusters, the PROMETHEE visual software was used to extract features specific to the suppliers from each cluster. Figure 3 shows the methodology of this study. This study is considered quantitative in type and applied in purpose. The methodology is based on content and is of a descriptive type so that a suitable database is provided for managers using the analyses of each cluster of suppliers to decide about suppliers.

PROMETHEE

Visual PROMETHEE software is one of the multi-criteria decision-making software aiming at ranking options (suppliers). According to this evaluation, some criteria show the type of index, preference function, the threshold of indifference, and the threshold of preference. In order to increase the efficiency of the PROMETHEE method, a GAIA was used. It is very important to inform decision-makers about the effects of indices and the weights of indices on the final results in multi-criteria decision-making problems. The GAIA-specific modeling method provides the possibility for such analyses. The PROMETHEE as well as GAIA graphic methods have perfect display power and can show existing conflicts among different options well, and also, this method enjoys good flexibility and can cover all quantitative and qualitative data, which makes it possible to identify criteria influential on the ranking (criteria with more weight are more influential on the ranking) (for more information, see [59,60]).
The PROMETHEE method is a multi-criterion ranking method that needs data from the table of options evaluation and criteria weights for problems. The preference structure in this method is based on a pairwise comparison between options (products/suppliers), as Equations (1)–(3) show. The S 1 option preference is a function of the evaluations difference between two options compared with the S 2 option, and that real number is between zero and one. The decision-maker creates a preference function for each criterion, which is possible to be minimized and maximized.
p j S 1 , S 2 = F j d j S 1 , S 2
d j S 1 , S 2 = g j S 1 g j S 2
0 p j S 1 , S 2 1
The ( S 1 ) option degree of preference concerning another option ( S h ) is calculated using cumulative preference indices, as follows:
π S i , S h = j = 1 k p j S i , S h w j
π S h , S i = j = 1 k p j S h , S i w j
In order to rank the options, this method applies positive and negative current ranking. The difference between the positive and negative currents is the ranking pure current that Equations (6)–(8) show. This study completely explains the PROMETHEE method [59].
φ + S i = 1 n 1 x A π ( S i , x )
φ S i = 1 n 1 x A π ( x , S i )
φ S i = φ + S i φ S i
It has been mentioned that according to Figure 4, this study has divided and evaluated criteria. All the measures related to suppliers in each part have been extracted in this model. These measures are the output of the study by [9], and Table 2 shows effective measures in the field of social responsibility by suppliers.
Although the above measures have been accurately investigated, they have overlapped with each other in many aspects. In addition, as writers have mentioned, these measures are about social responsibility, although these investigations aim at classifying product and supplier variables based on the approach of Segura and Maroto [3], and also the basis of criteria screening is creating common and sustainable values. Therefore, after discussion and investigation in group sessions, the experts were asked to transform the measures from the above table into related and general criteria that overlapped less each other, and from another aspect, are demonstrative of common and sustainable value creation.
After discussion in group sessions, 38 measures were transformed into 12 criteria investigated in this study, and on the other hand, these criteria were among the main activities of suppliers and were demonstrative of common value creation. Moreover, it is possible to classify criteria based on sustainability indices. As Figure 4 shows, the shareholders’ and suppliers’ lines demonstrate economic profits in sustainability indices. The lines out of society, employees, and customers in the social part relate to sustainability. Thus, it is not possible to classify the indices specifically, although it is obvious that each index is representative of one or more than one dimension of freedom. Figure 4 shows how the indices, measures, and classifications related to them are linked to each other.
One of the considerable points of this figure is the color of the ultimate criteria margin. Criteria with a red margin and dotted line relate to critical criteria, which means that they are important criteria mainly from a society and environmental point of view. Other criteria are related to company landscapes and strategies, which are shown with a green margin and extended line. This critical and strategic classification is based on the model by Segura and Maroto [3].
Three involved experts weighted and scored the criteria after extracting evaluation criteria in the first step to achieve weights related to the criteria using the BWM. The experts confirmed the face validity and content validity of the questionnaire, and the rate of incompatibility was less than 0.1; therefore, the validity and reliability of the questionnaire and the pairwise comparison were accepted to be used for extracting the criteria weights.

4. Results

The case study was one of the protein production companies in the north of Iran, which is among the best industrial units in the field of protein and dairy in Iran in most rankings. In addition, this unit has been selected as the best unit of the Ministry of Health, Iranian Nutrition Society, and Food Industry Congress. This factory has no evaluation system to manage suppliers, including so many different products with suitable techniques and by portfolio method. The suppliers were evaluated based on data from two years ago and interviews with the related experts.
In order to specify suppliers that are strategically important for an organization, they have been filtered three times in multiple conditions (multi-product/multi-supplier), including: (I) at least two years of activity with organization, (II) those suppliers were considered that work as a company or factory and not as a retailer, and also had production, research, and development parts, and (III) selecting suppliers who at least produce two products that the company needs. According to these conditions, finally, 68 suppliers with 31 products were selected for investigation.
The experts were industry engineers in the production, programming, depositary, maintenance, repair, and inventory control parts. Since each of these experts has more accurate information about some suppliers, the scores of the suppliers were scored by an expert familiar with them. Moreover, these experts had at least four years of experience in that position and were completely familiar with the production process and organizational processes and factory suppliers.
After studying the evaluation criteria in previous studies and consulting with the experts from the related organization, now it is time to weight the criteria. The criteria were weighted using a developed software based on Excel by three experts, and Table 3 shows the weights.
As can be seen, the highest score belongs to the critical criteria group, criterion C1. For the strategic criteria, criterion C8 has been allocated the highest weight to itself.

4.1. Supplier Segmentation

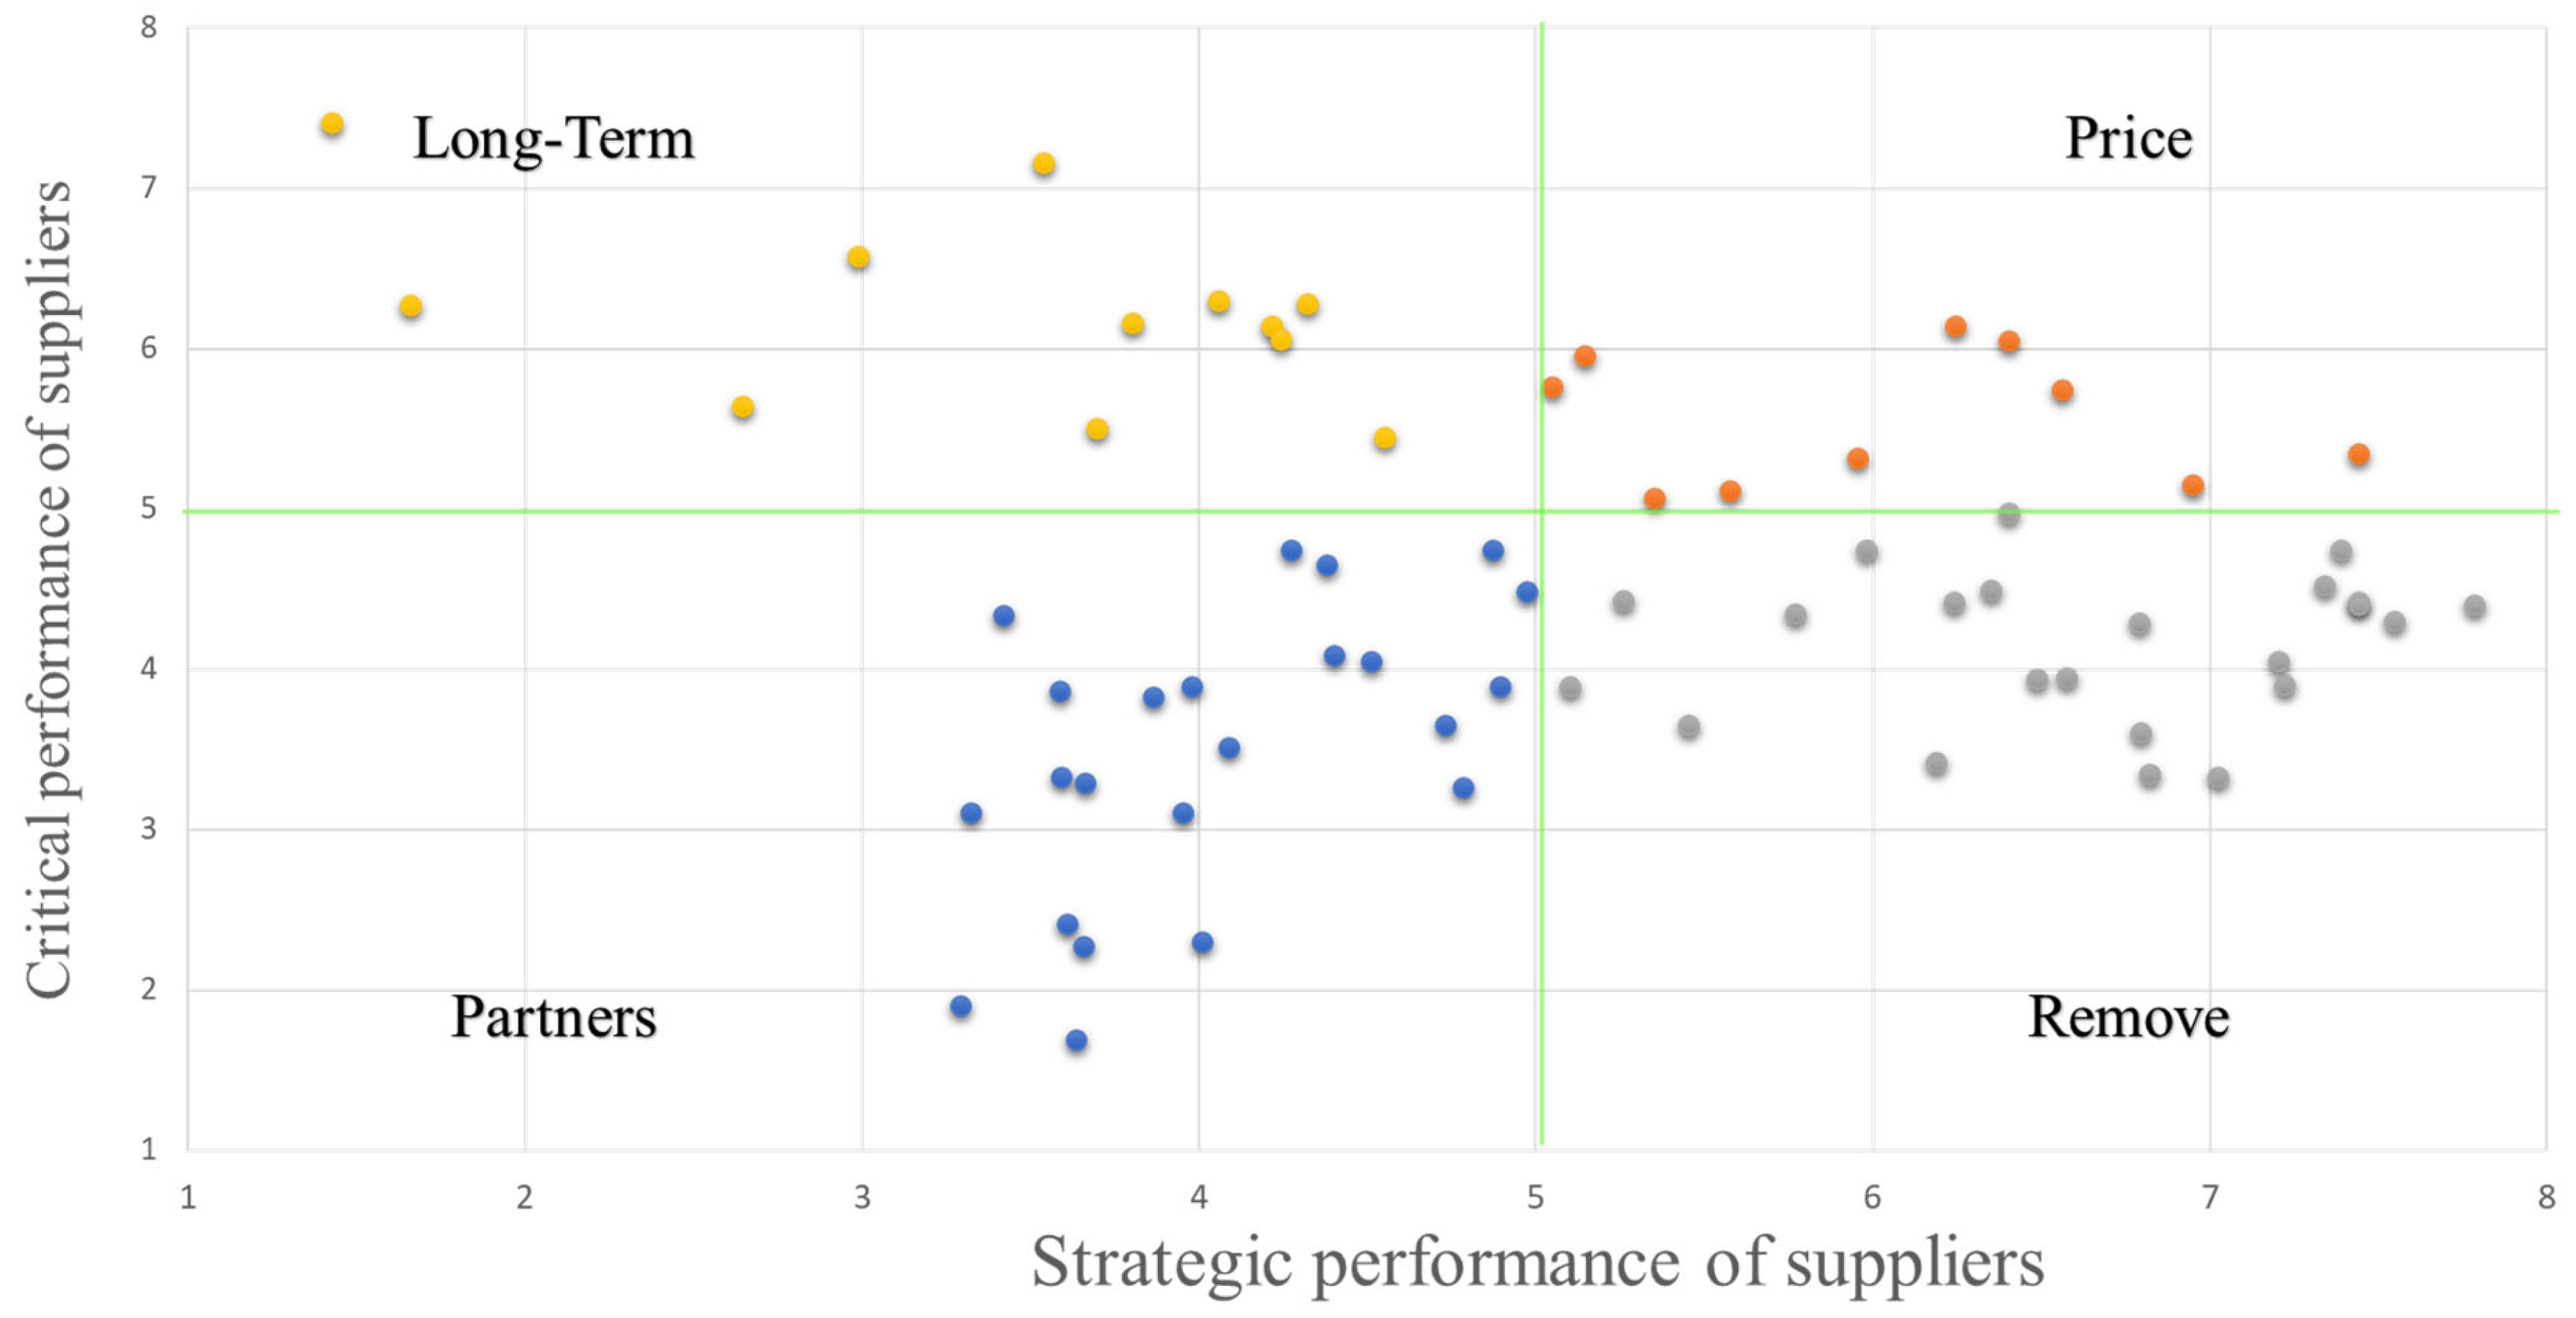
After weighting the criteria via questionnaires prepared to weight the criteria, the scores of the suppliers’ critical and strategic performance have been collected, and then, these suppliers were clustered using Segura and Maroto’s [3] clustering method, which is a developed form of the Kraljic clustering model, to determine the strategies suitable with each cluster of suppliers. Figure 5 shows the result of this clustering.
In Figure 5, the diagram has been divided into four clusters, five scores, and two dimensions, and it demonstrates the better performance of the higher scores. The suppliers from each cluster are shown in different colors.

4.2. Analyzing the Properties of Each Cluster Using Visual PROMETHEE

The suppliers from each cluster have been separately entered into the visual PROMETHEE software in this clustering and the criteria weighted using the BWM pairwise comparisons questionnaire. After entering the scores related to the 12 criteria and the related weights, and since the qualitative criteria turned into qualitative ones in the experts’ scoring for facilitation, the threshold of indifference (Q) has not been considered, so the function is V shaped and the preference function (P) has resulted from the difference between the maximum value and minimum value.
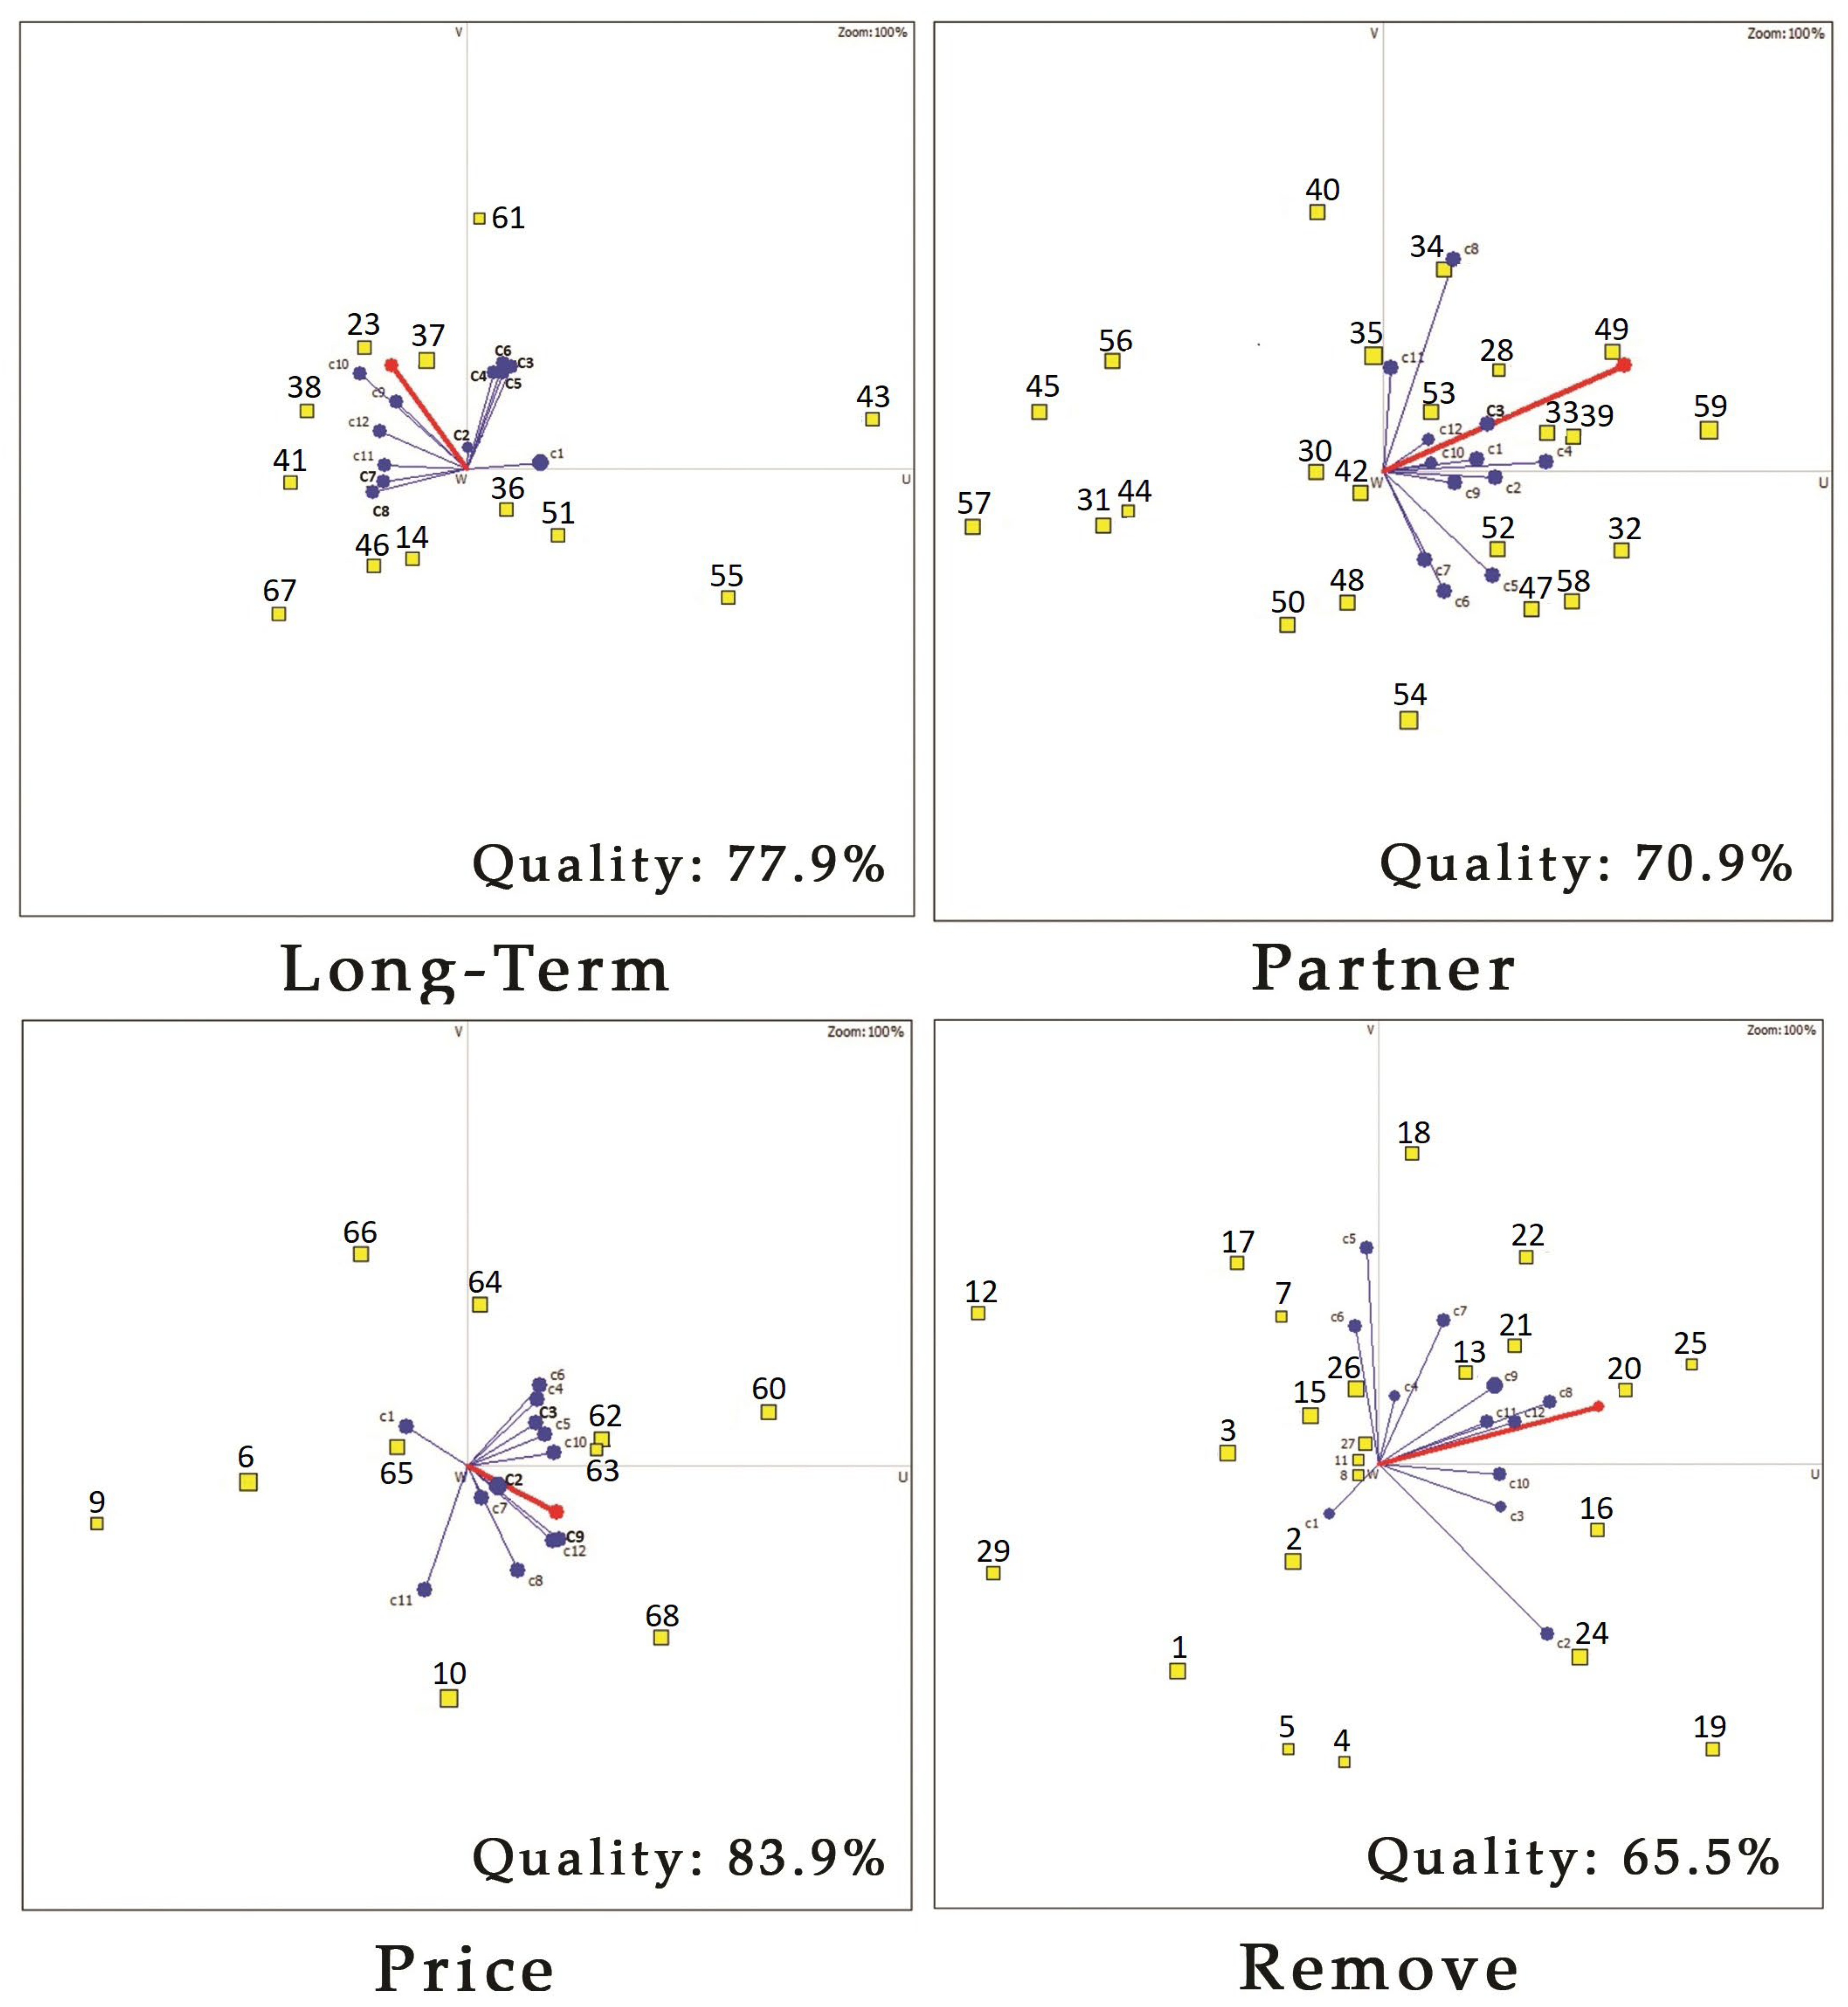
In order to analyze the characteristics of the suppliers’ in each cluster, the output of this software, PROMETHEE GAIA, has been used. One of the headings of this option is visual PROMETHEE GAIA, which specifies similarities between supplier groups. Figure 6 shows the output of this heading, with yellow squares showing the suppliers and the blue vectors showing the supplier evaluation criteria, and the red vectors are decision vectors. The analyses through this instrument are: (I) the closer the vectors related to the criteria are and the less directional difference they have, the more similar preferences they have, but if they are in two opposite directions, it shows conflicting criteria; (II) the lengths of the criteria axes are also important, in fact, the longer a criterion is than another criterion, the more important is that criterion than the other criteria, and this difference is not merely related to the high weight of that criterion; and (III) the more directional differences that exist between the axes related to criteria and the axes related to decision making (red and thick), the less effect that criterion has on the ranking, and as a result, it has not been influential on placing that supplier in that cluster.
In addition, in order to show the confidence capability of this decision making, there are five number diagrams at the bottom of the right side, and the more these numbers approximate to 70% or higher in the 3D axis V, U, and W (U is the first main component, including the possible value of information; V is the second component of this diagram, which is demonstrative of the maximum value of information; moreover, the possible values of information may be in axis U and perpendicular on this axis), the more reliable the results are [59].
Another option under this heading used in this study is the PROMETHEE table used to rank suppliers. Table 4 shows that the ranking related to each cluster was separately performed using the visual PROMETHEE software.
Then, the suppliers from each cluster were analyzed considering the above table. As three effective and three ineffective (or with less effect) criteria have to be identified in each cluster after consultation with the experts, six criteria have been selected considering the approximation of the evaluation criteria to the decision criteria (red and thick) and the approximation to suppliers with a high score for each cluster. These criteria are as follows:
The suppliers from the removal cluster: Three criteria with high effectiveness to put suppliers with high scores in this cluster are C12, C8, and C11, and the criteria with very low effectiveness that have not influenced the ranking of suppliers in this cluster include C1, C6, and C5.
The suppliers from the partnership cluster: The suppliers have also been influenced by three criteria, such as C3, C12, and C10, while the C11, C6, and C7 criteria have had the least effect in placing suppliers in this cluster.
The suppliers from the market price cluster: The number of suppliers that have selected a market price strategy is not more than 10, which has the least number of suppliers among the other clusters. This limited number of suppliers has been influenced by the scores for the C2, C9 and C12 criteria, and the three C6, C11, and C1 criteria are not good criteria for evaluating suppliers in this cluster.
The suppliers from the long-term cluster: The considerable point about the suppliers in this cluster is that there are three important and influential criteria for the members of this cluster, including C12, C10, and C9, two of which are common market price clusters namely C12 and C9, and there are three criteria with less importance in this cluster, including C7, C8, and C1.
Since the confidence capability of all three clusters is above 65%, these results are reliable enough.

5. Discussion

The measures obtained in a study by [61] related to the social responsibilities of suppliers classified into 12 criteria and into 2 critical and strategic groups using the model by [3]. These 12 criteria have been extracted from measures that demonstrate the common value creation in supply networks, and the concerns of sustainability have to be considered. The weights of these criteria were achieved using the BWM, and then each of these supplier clusters were analyzed using PROMETHEE GAIA. The result of this analysis was determining the features specific to each cluster, and these features help us better understand the suppliers from each cluster and take suitable measures with the suppliers from each cluster.
In order to know how these analyses help the decision-makers of the target factory, Figure 7 shows the evaluation results for the meat products factory. As mentioned before, the opinion of the decision-makers in relation to suppliers was that three effective and three less effective criteria have to be selected for each cluster to expand the interactive strategy with suppliers based on them. As well as identifying the features of the suppliers from each cluster with a lower number of criteria, it is possible to specify the weak and strong points of suppliers using the criteria resulting from each cluster and to achieve a better and more constructive relationship focusing on them so that this displaces the suppliers in four clusters.
Evaluating the suppliers of this organization using Figure 7 makes it possible to identify strategies to face suppliers, analyze the reason for placing suppliers in each dimension of this matrix and suggest better recommendations considering the features of each dimension of this matrix for better cooperation with suppliers. In relation to the criteria in green, it shows that the stronger the supplier is in these criteria or the better performance he has, he may be ranked higher in that cluster, while the criteria in red show that these criteria are not important to evaluate suppliers from that cluster from the point of view of the decision-makers of that organization.
Then, six states of supplier transfer from these clusters have been investigated. For example, if suppliers are in the removal part, this group of suppliers has to be removed and replaced with another supplier or both parties will try to take measures to transfer these suppliers to a noncritical part and facilitate cooperation with this cluster. Focusing on the mentioned criteria may facilitate cooperating with this cluster of suppliers.
In the first state, in order to displace this group of suppliers (removal cluster) into the partnership cluster, the important criteria are C3 and C10, the ineffective criteria are C7 and C11, two mentioned criteria have been in similar clusters, and there was no need to change the performance of suppliers from removal cluster in these criteria. In the second state, if it is going to transfer removal suppliers to the market price cluster, performance improvement is recommended in criteria C2, and C9, while C11 is the criterion that is ineffective in this transfer to the target cluster. The rest of the criteria do not need to change the performance of suppliers. In the third state, if it is going to transfer the removal cluster suppliers to the long-term contract cluster, it is necessary to improve performance in criteria C9 and C10, while criteria C7 and C8 are ineffective in the process of supplier transfer to this cluster.
In the fourth state, if it is going to transfer the partnership cluster suppliers to the longer-term contract cluster, the C9 criterion performance improvement is focused on, while criteria C1 and C8 are ineffective in this transfer. In the fifth state, to transfer the partnership cluster suppliers to the market price clusters, the C2 and C9 criteria are focused on and criterion C1 is ineffective. In the sixth state, in order to displace suppliers between the two price and long-term contract clusters, criterion C2 is important and effective, while criteria C6 and C11 are ineffective in transferring to the price cluster, criterion C10 is important, and criteria C7 and C8 are ineffective criteria to transfer the price cluster suppliers to the long-term cluster.

6. Limitations and Research Implications

One limitation is that the effectiveness of the proposed method may depend on the quality and availability of sustainability data for suppliers. If such data are limited or unreliable, it may be difficult to segment suppliers accurately based on their sustainability performance. Additionally, the use of two different decision-making techniques may introduce complexity and potentially reduce the transparency of the results, making it harder to understand the basis for the supplier segmentation.
Another limitation is that the proposed method needs to consider broader systemic issues related to sustainable value creation, such as the impact of supplier segmentation on more comprehensive supply chain dynamics and the potential for unintended consequences. Future research could explore the implications of the proposed method more holistically, taking into account both environmental and social factors and their impacts on the overall sustainability performance of the supply chain.
Overall, the proposed method has potential as a tool for sustainable supplier segmentation, although it is essential to consider its limitations and broader research implications carefully. By addressing these issues, it may be possible to further refine and improve the method for more effective and sustainable supply chain management. Although it is complete in terms of the concept and theory, shared value is a topic that needs to be addressed in the operational and computational space. It is recommended that future researchers pay more attention to the identification and quantification of shared value measures throughout the supply chain. One of the most critical issues is correctly measuring and calculating the shared value created during the value and supply chains.

7. Conclusions

The current study aimed at clustering suppliers and analyzing each cluster of suppliers to recognize the criteria specific to each cluster that place each supplier in that cluster. In conclusion, this paper developed a framework for evaluating and preparing suitable strategies with groups of factory suppliers, with a particular focus on the meat sector of the food industry in Iran. The study utilized compensatory MCDM approaches, incorporating the best–worst method (BWM) for criteria weighting and Segura and Maroto’s (2017) [3] clustering method for grouping suppliers based on their scores. The study also utilized the PROMETHEE method for ranking suppliers within each cluster and identifying the key criteria that influenced the supplier placement.
There were some reasons to choose these methods among the vast number of MADM ranking and weighting approaches. First, the PROMETHEE was chosen as the preferred MCDM method for evaluating and ranking suppliers in the context of sustainable shared value creation based on several factors. The PROMETHEE can handle multiple criteria, enabling a structured approach to evaluate and compare suppliers. It provides a robust framework for modeling decision-maker preferences and allows for the consideration of the interactions between criteria. Additionally, it offers visual tools, such as the GAIA analysis, that aid in understanding and interpreting the results. Although other MCDM methods exist, the PROMETHEE’s combination of features align well with the research objectives, making it a suitable choice for this context.
Second, the BWM was chosen as the preferred weighting method for this research due to its comparative nature, simplicity, consideration of both importance and non-importance, provision of weighting scores, and ability to incorporate multiple decision-makers’ opinions. These factors make the BWM well-suited for evaluating criteria in supplier evaluation and segmentation for sustainable shared value creation. Its straightforward approach allows decision-makers to accurately assess the relative importance of criteria, resulting in clear rankings and prioritization. Moreover, the BWM’s ability to accommodate multiple perspectives enhances the robustness and inclusivity of the weighting process. Overall, the BWM offers a reliable and practical approach for weighting criteria in this research context.
Ultimately, this study found that the use of the MADM approach was effective in identifying and evaluating suppliers based on a range of quantitative and qualitative criteria. The clustering method provided a useful way of grouping suppliers based on their scores, while the PROMETHEE method allowed for the identification of the most important criteria for supplier placement. The considerable point is that all the criteria have been selected after considering the common value creation and sustainability, making it possible to interact and sustain strategies between the suppliers and purchasing company by focusing on specific criteria and reducing social pressures on the company.

Author Contributions

Methodology, M.K. and M.R.; Software, M.K.; Validation, A.T.; Formal analysis, A.F. and M.R.; Writing—original draft, A.F., M.K. and M.R.; Writing—review & editing, A.T., A.F., M.K. and M.R.; Supervision, A.T. All authors have read and agreed to the published version of the manuscript.

Funding

This research received no external funding.

Institutional Review Board Statement

Not applicable.

Informed Consent Statement

Not applicable.

Data Availability Statement

Not applicable.

Conflicts of Interest

The authors declare no conflict of interest.

References

  1. Taghipour, A.; Ramezani, M.; Khazaei, M.; Roohparvar, V.; Hassannayebi, E. Smart Transportation Behavior through the COVID-19 Pandemic: A Ride-Hailing System in Iran. Sustainability 2023, 15, 4178. [Google Scholar] [CrossRef]
  2. Merimi, M.; Taghipour, A. Accelerating the digitalization of the supply chain: An empirical research about COVID-19 crisis. In Digitalization of Decentralized Supply Chains During Global Crises; IGI Global: Pennsylvania, PA, USA, 2021; pp. 1–24. [Google Scholar]
  3. Segura, M.; Maroto, C. A multiple criteria supplier segmentation using outranking and value function methods. Expert Syst. Appl. 2017, 69, 87–100. [Google Scholar] [CrossRef]
  4. Mahfod, J.; Canel-Depitre, B.; Taghipour, A. Quality Function Deployment-ELECTRE in Supplier Evaluation. J. Adv. Manag. Sci. 2019, 7, 131–135. [Google Scholar] [CrossRef]
  5. Dutta, P.; Jaikumar, B.; Arora, M.S. Applications of data envelopment analysis in supplier selection between 2000 and 2020: A literature review. Ann. Oper. Res. 2021, 315, 1399–1454. [Google Scholar] [CrossRef]
  6. Loivet, W.; Taghipour, A.; Kang, D.S. The Rise of Green Supply Chain Management: Between Complexity and Necessity. J. Econ. Bus. Manag. 2020, 8, 1–7. [Google Scholar] [CrossRef]
  7. Xu, H.; Chen, L.; Li, Q.; Yang, J. A Multi-Attribute Decision Method under Uncertainty Environment Conditions—The Green Supplier Evaluation Perspective. Int. J. Environ. Res. Public Health 2021, 18, 344. [Google Scholar] [CrossRef]
  8. Joshi, R.; Banwet, D.; Shankar, R. A Delphi-AHP-TOPSIS based benchmarking framework for performance improvement of a cold chain. Expert Syst. Appl. 2011, 38, 10170–10182. [Google Scholar] [CrossRef]
  9. Govindan, K.; Dhingra Darbari, J.; Kaul, A.; Jha, P. Structural model for analysis of key performance indicators for sustainable manufacturer–supplier collaboration: A grey-decision-making trial and evaluation laboratory-based approach. Bus. Strategy Environ. 2021, 30, 1702–1722. [Google Scholar] [CrossRef]
  10. Vosooghidizaji, M.; Taghipour, A.; Canel-Depitre, B. Coordinating corporate social responsibility in a two-level supply chain under bilateral information asymmetry. J. Clean. Prod. 2022, 364, 132627. [Google Scholar] [CrossRef]
  11. Mosallanezhad, B.; Chouhan, V.K.; Paydar, M.M.; Hajiaghaei-Keshteli, M. Disaster relief supply chain design for personal protection equipment during the COVID-19 pandemic. Appl. Soft Comput. 2021, 112, 107809. [Google Scholar] [CrossRef]
  12. Taghipour, A.; Merimi, M. Digital Transformation of Supply Chains during Crisis: COVID-19. In Proceedings of the 11th Annual International Conference on Industrial Engineering and Operations Management, Singapore, 7–11 March 2021; pp. 7493–7501. [Google Scholar]
  13. Taghipour, A.; Glaa, B.; Zoghlami, N. Network coordination with minimum risk of information sharing. In Proceedings of the 2014 International Conference on Advanced Logistics and Transport (ICALT), Hammamet, Tunisia, 1–3 May 2014; pp. 184–188. [Google Scholar]
  14. Liu, L.; Song, W.; Liu, Y. Leveraging digital capabilities toward a circular economy: Reinforcing sustainable supply chain management with Industry 4.0 technologies. Comput. Ind. Eng. 2023, 178, 109113. [Google Scholar] [CrossRef]
  15. Wang, C.-N.; Tsai, H.-T.; Ho, T.-P.; Nguyen, V.-T.; Huang, Y.-F. Multi-Criteria Decision Making (MCDM) Model for Supplier Evaluation and Selection for Oil Production Projects in Vietnam. Processes 2020, 8, 134. [Google Scholar] [CrossRef]
  16. Ehsanifar, M.; Dekamini, F.; Spulbar, C.; Birau, R.; Khazaei, M.; Bărbăcioru, I.C. A Sustainable Pattern of Waste Management and Energy Efficiency in Smart Homes Using the Internet of Things (IoT). Sustainability 2023, 15, 5081. [Google Scholar] [CrossRef]
  17. Tavana, M.; Yazdani, M.; Di Caprio, D. An application of an integrated ANP–QFD framework for sustainable supplier selection. Int. J. Logist. Res. Appl. 2017, 20, 254–275. [Google Scholar] [CrossRef]
  18. Hosseini, S.M.; Paydar, M.M.; Hajiaghaei-Keshteli, M. Recovery solutions for ecotourism centers during the Covid-19 pandemic: Utilizing Fuzzy DEMATEL and Fuzzy VIKOR methods. Expert Syst. Appl. 2021, 185, 115594. [Google Scholar] [CrossRef]
  19. Caniëls, M.; Gelderman, C.J. Purchasing strategies in the Kraljic matrix—A power and dependence perspective. J. Purch. Supply Manag. 2005, 11, 141–155. [Google Scholar] [CrossRef]
  20. Srhir, S.; Jaegler, A.; Montoya-Torres, J.R. Uncovering Industry 4.0 technology attributes in sustainable supply chain 4.0: A systematic literature review. Bus. Strategy Environ. 2023. [Google Scholar] [CrossRef]
  21. Zhang, J.; Yang, D.; Li, Q.; Lev, B.; Ma, Y. Research on Sustainable Supplier Selection Based on the Rough DEMATEL and FVIKOR Methods. Sustainability 2021, 13, 88. [Google Scholar] [CrossRef]
  22. Taghipour, A.; Murat, S.; Huang, P. E-supply chain management: A review. Int. J. e-Educ. e-Bus. e-Manag. e-Learn. 2021, 11, 51–61. [Google Scholar] [CrossRef]
  23. Taghipour, A.; Abed, M.; Zoghlami, N. Design for remanufacturing respecting reverse logistics processes: A review. In Proceedings of the 2015 4th International Conference on Advanced Logistics and Transport (ICALT), Valenciennes, France, 20–22 May 2015; pp. 299–304. [Google Scholar]
  24. Taghipour, A.; Rouyendegh, B.D.; Ünal, A.; Piya, S. Selection of Suppliers for Speech Recognition Products in IT Projects by Combining Techniques with an Integrated Fuzzy MCDM. Sustainability 2022, 14, 1777. [Google Scholar] [CrossRef]
  25. Taghipour, A.; Frayret, J.-M. Supply Chain Coordination Planning: A Review; Work paper; École Polytechnique de Montréal: Montreal, QC, Canada, 2011. [Google Scholar]
  26. Reshad, A.I.; Biswas, T.; Agarwal, R.; Paul, S.K.; Azeem, A. Evaluating barriers and strategies to sustainable supply chain risk management in the context of an emerging economy. Bus. Strat. Environ. 2023. [Google Scholar] [CrossRef]
  27. Garjan, H.S.; Paydar, M.M.; Divsalar, A. A sustainable supply chain for a wellness tourism center considering discount and quality of service. Expert Syst. Appl. 2023, 211, 118682. [Google Scholar] [CrossRef]
  28. Taghipour, A.; Khazaei, M.; Azar, A.; Ghatari, A.R.; Hajiaghaei-Keshteli, M.; Ramezani, M. Creating Shared Value and Strategic Corporate Social Responsibility through Outsourcing within Supply Chain Management. Sustainability 2022, 14, 1940. [Google Scholar] [CrossRef]
  29. Nayeri, M.D.; Khazaei, M.; Abdolahbeigi, D. The drivers of success in new-service development: Rough set theory approach. Int. J. Serv. Oper. Manag. 2022, 43, 421. [Google Scholar] [CrossRef]
  30. Khazaei, M.; Ramezani, M.; Padash, A.; DeTombe, D. Creating shared value to redesigning IT-service products using SYRCS; Diagnosing and tackling complex problems. Inf. Syst. e-Bus. Manag. 2021, 19, 957–992. [Google Scholar] [CrossRef]
  31. Ramezani, M.; Azar, A.; Khazaei, M. Gap analysis through a hybrid method: Critical systems heuristics and best worst method. In Advances in Best-Worst Method: Proceedings of the Second International Workshop on Best-Worst Method (BWM2021); Springer: Berlin/Heidelberg, Germany, 2022; pp. 272–286. [Google Scholar]
  32. Khazaei, M.; Ramezani, M.; Padash, A.; DeTombe, D. The quantification role of BWM in problem structuring methods: SYRCS methodology. In Advances in Best-Worst Method: Proceedings of the Second International Workshop on Best-Worst Method (BWM2021); Springer: Berlin/Heidelberg, Germany, 2022; pp. 252–271. [Google Scholar]
  33. Vidal, N.G.; Spetic, W.; Croom, S.; Marshall, D. Supply chain stakeholder pressure for the adoption of sustainable supply chain practices: Examining the roles of entrepreneurial and sustainability orientations. Supply Chain Manag. Int. J. 2022, 28, 598–618. [Google Scholar] [CrossRef]
  34. Rezaei, J. Best-worst multi-criteria decision-making method. Omega 2015, 53, 49–57. [Google Scholar] [CrossRef]
  35. Cheraghalipour, A.; Paydar, M.M.; Hajiaghaei-Keshteli, M. Applying a hybrid BWM-VIKOR approach to supplier selection: A case study in the Iranian agricultural implements industry. Int. J. Appl. Decis. Sci. 2018, 11, 274–301. [Google Scholar] [CrossRef]
  36. Hudnurkar, M.; Rathod, U.; Jakhar, S.K. Multi-criteria decision framework for supplier classification in collaborative supply chains: Buyer’s perspective. Int. J. Product. Perform. Manag. 2016, 65, 622–640. [Google Scholar] [CrossRef]
  37. Rezaei, J.; Lajimi, H.F. Segmenting supplies and suppliers: Bringing together the purchasing portfolio matrix and the supplier potential matrix. Int. J. Logist. Res. Appl. 2019, 22, 419–436. [Google Scholar] [CrossRef]
  38. Bianchini, A.; Benci, A.; Pellegrini, M.; Rossi, J. Supply chain redesign for lead-time reduction through Kraljic purchasing portfolio and AHP integration. Benchmarking Int. J. 2019, 26, 1194–1209. [Google Scholar] [CrossRef]
  39. Wang, G.; Jiang, Z.; Li, Z.; Liu, W. Supplier selection and order splitting in multiple-sourcing inventory systems. Front. Mech. Eng. China 2008, 3, 23–27. [Google Scholar] [CrossRef]
  40. Su, T.; Zhan, F. Supplier Selection and Evaluation System of Delphi Method and Analytic Hierarchy Process. IOP Conf. Ser. Mater. Sci. Eng. 2020, 768, 052107. [Google Scholar] [CrossRef]
  41. Fallahpour, A.; Nayeri, S.; Sheikhalishahi, M.; Wong, K.Y.; Tian, G.; Fathollahi-Fard, A.M. A hyper-hybrid fuzzy decision-making framework for the sustainable-resilient supplier selection problem: A case study of Malaysian Palm oil industry. Environ. Sci. Pollut. Res. 2021, 1–21. [Google Scholar] [CrossRef]
  42. Mirhosseini, S.S.; Ramezani, M.; Khazaei, M.; Azar, A. Exploring and analysing the risks and challenges of implementing ERP systems: Critical system thinking. Int. J. Inf. Syst. Change Manag. 2021, 12, 234–258. [Google Scholar] [CrossRef]
  43. Khazaei, M.; Dekamini, F.; Ehsanifar, M.; Spulbar, C.; Birau, R.; Ninulescu, P.V. shortcomings and challenges of creating shared value in management science: A critical review. Res. Sci. Today 2022, 24, 119. [Google Scholar] [CrossRef]
  44. Liu, G.; Fan, S.; Tu, Y.; Wang, G. Innovative Supplier Selection from Collaboration Perspective with a Hybrid MCDM Model: A Case Study Based on NEVs Manufacturer. Symmetry 2021, 13, 143. [Google Scholar] [CrossRef]
  45. Rezaei, J.; Wang, J.; Tavasszy, L. Linking supplier development to supplier segmentation using Best Worst Method. Expert Syst. Appl. 2015, 42, 9152–9164. [Google Scholar] [CrossRef]
  46. Ho, W.; Xu, X.; Dey, P.K. Multi-criteria decision making approaches for supplier evaluation and selection: A literature review. Eur. J. Oper. Res. 2010, 202, 16–24. [Google Scholar] [CrossRef]
  47. Demirtas, E.A.; Üstün, Ö. An integrated multiobjective decision making process for supplier selection and order allocation. Omega 2008, 36, 76–90. [Google Scholar] [CrossRef]
  48. Lee, A.H.; Chen, W.-C.; Chang, C.-J. A fuzzy AHP and BSC approach for evaluating performance of IT department in the manufacturing industry in Taiwan. Expert Syst. Appl. 2008, 34, 96–107. [Google Scholar] [CrossRef]
  49. Ha, S.H.; Krishnan, R. A hybrid approach to supplier selection for the maintenance of a competitive supply chain. Expert Syst. Appl. 2008, 34, 1303–1311. [Google Scholar] [CrossRef]
  50. Cakir, O.; Canbolat, M.S. A web-based decision support system for multi-criteria inventory classification using fuzzy AHP methodology. Expert Syst. Appl. 2008, 35, 1367–1378. [Google Scholar] [CrossRef]
  51. Yu, J.-R.; Tsai, C.-C. A decision framework for supplier rating and purchase allocation: A case in the semiconductor industry. Comput. Ind. Eng. 2008, 55, 634–646. [Google Scholar] [CrossRef]
  52. Levary, R.R. Using the analytic hierarchy process to rank foreign suppliers based on supply risks. Comput. Ind. Eng. 2008, 55, 535–542. [Google Scholar] [CrossRef]
  53. Kokangul, A.; Susuz, Z. Integrated analytical hierarch process and mathematical programming to supplier selection problem with quantity discount. Appl. Math. Model. 2009, 33, 1417–1429. [Google Scholar] [CrossRef]
  54. Gencer, C.; Gürpinar, D. Analytic network process in supplier selection: A case study in an electronic firm. Appl. Math. Model. 2007, 31, 2475–2486. [Google Scholar] [CrossRef]
  55. Jharkharia, S.; Shankar, R. Selection of logistics service provider: An analytic network process (ANP) approach. Omega 2007, 35, 274–289. [Google Scholar] [CrossRef]
  56. Wu, M. An alternative agent approach for managing materials purchasing. In Proceedings of the 2007 International Conference on Wireless Communications, Networking and Mobile Computing, Shanghai, China, 21–25 September 2007; pp. 6418–6420. [Google Scholar]
  57. Isik, S.; Vayvay, O. Selection of Strategic Suppliers for Partnership: A Model with Two Stages Approach. Int. J. Ind. Manuf. Eng. 2018, 12, 327–333. [Google Scholar]
  58. Abdullah, L.; Chan, W.; Afshari, A. Application of PROMETHEE method for green supplier selection: A comparative result based on preference functions. J. Ind. Eng. Int. 2019, 15, 271–285. [Google Scholar] [CrossRef]
  59. Brans, J.-P.; De Smet, Y. PROMETHEE methods. In Multiple Criteria Decision Analysis; Springer: Berlin/Heidelberg, Germany, 2016; pp. 187–219. [Google Scholar]
  60. Karande, P.; Chakraborty, S. Application of PROMETHEE-GAIA method for non-traditional machining processes selection. Manag. Sci. Lett. 2012, 2, 2049–2060. [Google Scholar] [CrossRef]
  61. Govindan, K.; Shankar, M.; Kannan, D. Supplier selection based on corporate social responsibility practices. Int. J. Prod. Econ. 2018, 200, 353–379. [Google Scholar] [CrossRef]
  62. Porter, M.E.; Kramer, M.R. Creating shared value. In Managing Sustainable Business; Springer: Berlin/Heidelberg, Germany, 2019; pp. 323–346. [Google Scholar]
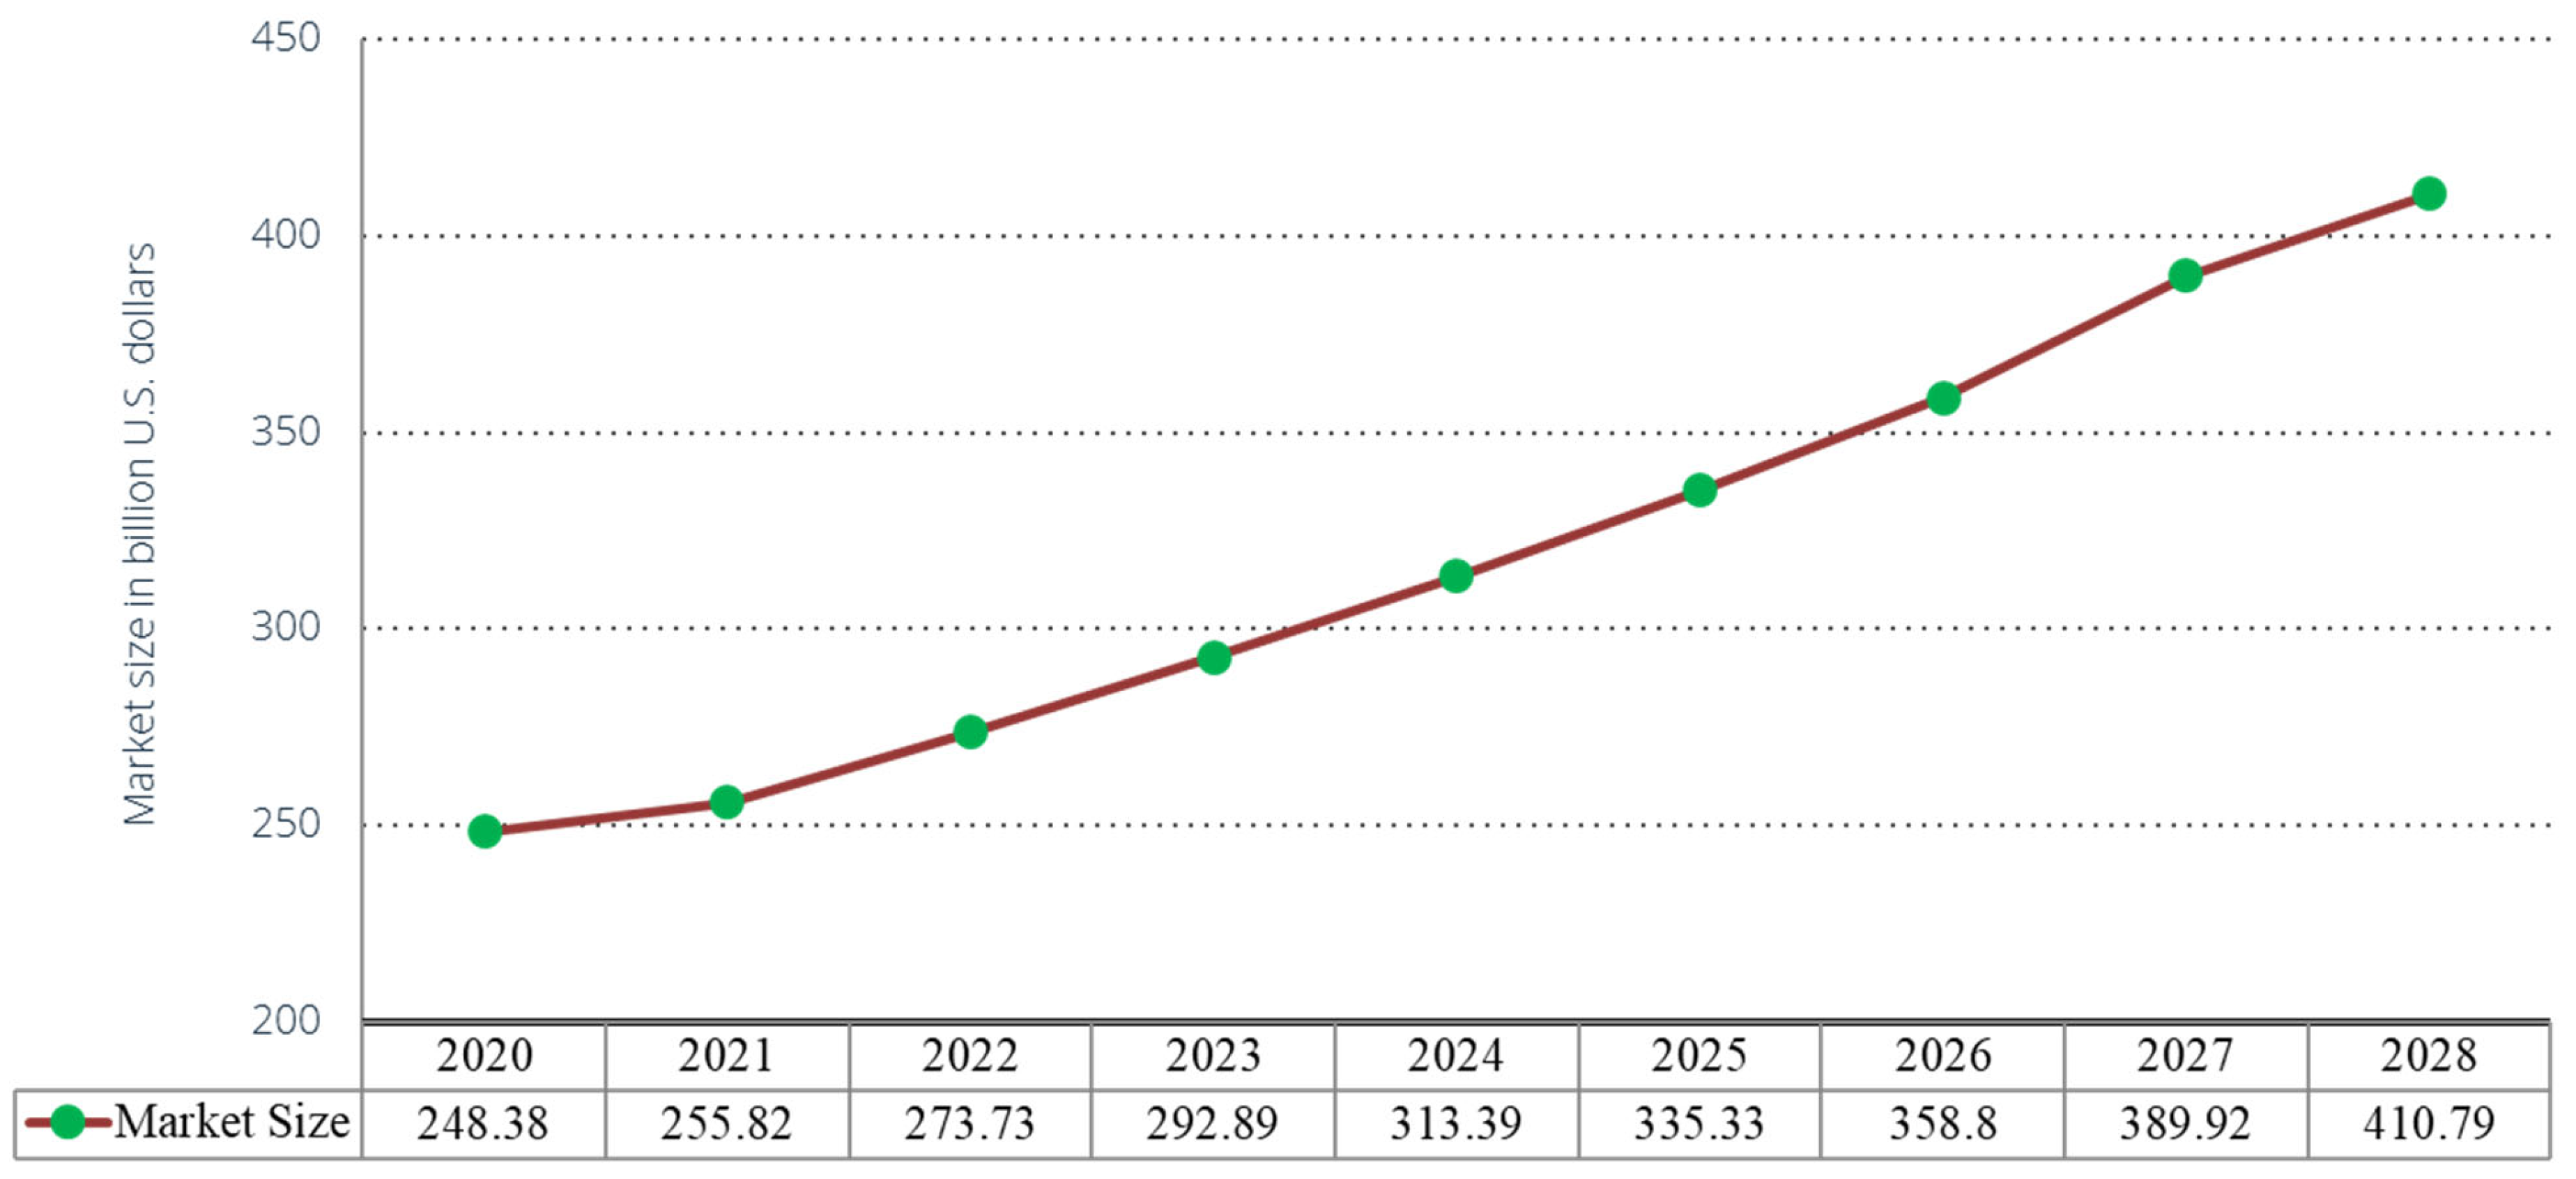
Figure 1. Cold supply chain global market size from 2020 to 2028 (Source: Verified Market Research).
Sustainability 15 08670 g001
Figure 2. Sustainability reporting rate by industry sector (Source: KPMG).
Sustainability 15 08670 g002
Figure 3. Executive stages of the research.
Sustainability 15 08670 g003
Figure 4. Product and supplier evaluation criteria based on the research by Govindan and Shankar [61] and classification based on the creation of sustainable shared value by [62].
Sustainability 15 08670 g004
Figure 5. Supplier clustering using Segura and Maroto’s method [3].
Sustainability 15 08670 g005
Figure 6. GAIA visual PROMETHEE outputs for each cluster.
Sustainability 15 08670 g006
Figure 7. Criteria effective (green) and ineffective or low impact (red) for each cluster.
Sustainability 15 08670 g007
Table 1. Criteria used to evaluate suppliers over the past 14 years.
The Amount of Returned ShipmentsPurchased Lot SizeNumber of SuppliersFactor Stopping Factory ProductionResearch and DevelopmentDesire of the Supplier in the Availability of the ProductAnnual Customer DemandTrust and Two-Way CommunicationCapability and Services of the Supplier CompanyMarket RiskRisk of the Supplier CountryQuality of Communication with the SellerActivities, Plans and Business PlansLogistics ActivitySafety and Environmental IssuesEthical StandardsReliabilityCompany ProfileServicesDelivery timeQualityPriceCriteria
Clusters
×× ×× ×× ×××××× ××××××[9]
××× × ×× ××××× ×× ×××[41]
× × × ×××××××× ××××[40]
× × × ×××× ×××[15]
××× ×××××× ×[38]
× ××× × ×[37]
× × × × [3]
× ××× ×× ×× ××× ×××[36]
× ×× × ×[45]
××× × ×××[46]
× × ×××× ××[47]
×××× × ××××× ×× ××[47]
× ×××× × ×[48]
× ××× ×× ××[49]
× × ×× ×[50]
× × × ×××× ×××[51]
× × ×× [52]
××× × ×[39]
× ×× × ×× ××[53]
×× × ×× × ×× [54]
× ×× ××××××××[55]
× × × ×× [56]
Table 2. CSR practices and their codes according to Govindan and Shankar [61].
S. NoCategoryPractices
SC1SocietyGenerous financial donations
SC2 Innovative giving
SC3 Support for education and job training programs
SC4 Direct involvement in community projects and affairs
SC5 Campaigning for environmental and social change
SC6 Disclosure of environmental and social performance
E1EnvironmentEnvironmental policies, organization, and management
E2 Materials policy of reduction, reuse, and recycling
E3 Monitoring and taking responsibility for releases to the environment
E4 Waste management
E5 Energy conservation
E6 Effective emergency response
E7 Product stewardship
E8 Environmental requirements for suppliers
EM1EmployeesFair remuneration
EM2 Effective communication
EM3 Learning and development opportunities
EM4 A healthy and safe work environment
EM5 Equal employment opportunities
EM6 Job security
EM7 Competent leadership
EM8 Community spirit
C1CustomersValue for money
C2 Truthful promotion
C3 Leadership in research and development
C4 Minimal packaging
C5 Rapid and respectful responses to customer comments/concerns
S1SuppliersDevelop and maintain long-term purchasing relationships
S2 Pay fair prices and settle bills according to terms agreed upon
S3 Encouragement to provide innovative suggestions
S4 Assist suppliers to improve their environmental/social performance
S5 Utilize local suppliers
S6 Inclusion of environmental/social criteria in the supplier selection
SH1ShareholdersGood rate of long-term return for shareholders
SH2 Disseminate comprehensive and clear information
SH3 Encourage staff ownership of shares
SH4 Develop and build relationships with shareholders
SH5 Clear dividend policy and payment of appropriate dividends
Table 3. Final weights of supplier evaluation criteria.
Criteria
Categories
CodeCriteriaWeights
CriticalC1Performance Transparency17.50
C2Social Empowerment10.00
C3Environmentally Friendly Products5.00
C4Environmentally Friendly Activities10.00
C5Resources Empowerment and Prosperity5.00
C6Fair Sourcing2.50
StrategicC7Innovation Attention7.30
C8Cost Effectiveness18.25
C9Sustainable Research and Development (R&D)4.38
C10Long-Term Relationship Potentiality10.95
C11Energy and Material Efficiency7.30
C12Openness and Communication1.82
Weights Summation100
Table 4. Ranking of suppliers from each cluster.
RankSupplierPhiRankSupplierPhiRankSupplierPhiRankSupplierPhi
1610.14678510.01081680.1574766−0.0731
2380.1324946−0.07402620.1421864−0.1186
3230.09641043−0.08573600.128296−0.1398
4410.08671136−0.23004630.1111109−0.1849
5370.08021255−0.26135100.0446
6140.0630 665−0.0669
7670.0349LONG-TERM766−0.0731PRICE
RankSupplierPhiRankSupplierPhiRankSupplierPhiRankSupplierPhi
1590.31511342−0.00461190.1996137−0.0288
2490.29161430−0.00962250.1996142−0.0530
3320.20331540−0.02653210.15211524−0.0590
4580.16941654−0.06364180.1421164−0.0624
5330.16831748−0.09935160.14081726−0.0728
6340.16741850−0.17396220.13621815−0.0737
7390.16341956−0.1813780.07331917−0.0787
8280.11392044−0.24888130.0543203−0.1652
9530.11382131−0.25129200.05192112−0.1749
10350.02272245−0.322310270.0403221−0.2269
11470.01892357−0.36761150.03472329−0.2550
12520.0009PARTNERS12110.0257REMOVE
Disclaimer/Publisher’s Note: The statements, opinions and data contained in all publications are solely those of the individual author(s) and contributor(s) and not of MDPI and/or the editor(s). MDPI and/or the editor(s) disclaim responsibility for any injury to people or property resulting from any ideas, methods, instructions or products referred to in the content.