Article

Research on Shared Logistics Decision Based on Evolutionary Game and Income Distribution

School of Modern Post, Beijing University of Posts and Telecommunications, Haidian District, Beijing 100876, China
*
Author to whom correspondence should be addressed.
Sustainability 2023, 15(11), 8621; https://doi.org/10.3390/su15118621
Submission received: 24 April 2023 / Revised: 15 May 2023 / Accepted: 23 May 2023 / Published: 25 May 2023
(This article belongs to the Section Sustainable Transportation)

Abstract

:
As a green, efficient, and feasible solution, logistics resource sharing has received increasing attention in urban last-mile delivery. Instability in cooperation and unequal income distribution are significant constraints to logistics resource sharing. In this paper, we investigate the logistics resource sharing decision-making process among express delivery companies. First, according to the characteristics of the express delivery companies, symmetric and asymmetric game models based on evolutionary game theory are proposed, respectively. We examine the express delivery company’s choice of strategy and the major determinants of collaboration. Then, we examine the income distribution problem for subjects sharing logistics resources and propose an improved Raiffa solution that takes enterprise scale into account. Finally, certain management insights are offered for the express delivery companies to support the realization of logistics resource sharing. The results show that the evolution direction of the model is influenced by the initial state, enterprise scale, income distribution coefficient, and default penalty coefficient. Furthermore, the improved Raiffa solution takes into account the asymmetry of resource contribution of participating subjects and is more reasonable.

1. Introduction

In recent years, the express delivery industry has developed rapidly, with constant increases in business volume and intensifying competition. To meet the needs of consumers, enterprises must invest a lot of manpower and material resources into building their delivery networks, particularly in urban terminal distributions. Research shows that the ‘last mile’ is the most expensive, least efficient, and most polluting part of the whole logistics process, accounting for around 13% to 75% of total logistics costs [1,2]. This not only results in increased expenses for companies but also wastes valuable social resources. Hence, resource sharing as a feasible and trustworthy solution has gained broad attention among scholars [3]. Several scholars have explored the application effect of logistics resource sharing [4,5,6], which proves that logistics cooperation can help small- and medium-sized companies to improve operational efficiency and to reduce logistics costs. Gansterer et al. [7] indicated that horizontal collaboration among carriers could result in cost savings of up to 40%. In particular, last-mile deliveries that are characterized by high competition could profit from horizontal collaborations.
In urban last-mile delivery, logistics services are primarily provided by express delivery companies, which are located at the same level in the logistics chain. Sharing logistics resources enables express delivery companies to achieve economies of scale and intensive distribution, leading to reduced costs and enhanced distribution efficiency. The decision-making process for logistics sharing of express delivery companies is a long-term dynamic game process. The successful implementation of logistics sharing is affected by various factors, such as enterprise scale, cooperation risks, and income distribution [8,9]. Express delivery companies adjust their own strategies based on internal and external conditions. Therefore, in order to ensure the long-term stability of logistics resource sharing, it is of great significance to explore the internal mechanism of cooperation and to analyze the impact of different factors on cooperation stability. Moreover, enterprises prioritize their own interests. In addition to obtaining additional income, finding a fair and appropriate income distribution plan is essential for ensuring the stable implementation of logistics sharing.
To promote logistics resource sharing among express delivery companies, this paper investigates their competitive and cooperative mechanisms, as well as income allocation issues. On the one hand, evolutionary game theory is employed to examine the impact of different factors on the decision-making process of express delivery companies, thereby providing an analysis of the strategic choices they make. On the other hand, combining the conclusions obtained from the evolutionary game model, a reasonable and fair income distribution model is constructed. The research results of this paper will be beneficial for the smooth implementation of logistics resource sharing and provide actionable guidance for enterprises and governments.
The remainder of this paper is organized as follows: Section 2 provides a review of the relevant literature and delineates the research contributions of this paper. Section 3 constructs the evolutionary game model for logistics resource sharing and performs stability analysis and sensitivity analysis on the model. In Section 4, the model is simulated based on a case to further investigate the effects of various factors on enterprise decisions. Section 5 proposes a new income distribution model and performs calculations on the case. Finally, Section 6 presents the research conclusions. The framework of the paper is shown in Figure 1.

2. Literature Review

In the 1970s, Maynard Smith and Price [10] and Taylor and Jonker [11] proposed the Evolutionarily Stable Strategy and the Replicating Dynamic Equation, respectively, which have constituted the core concepts of evolutionary games. Evolutionary games have been widely used in a range of problems, such as financial markets [12], government regulation [13], cooperative research and development [14], corporate alliances [15], etc. In recent years, as resource sharing plays a significant part of improving logistics efficiency and reducing logistics costs, more and more scholars have used evolutionary game theory to study decision-making in logistics cooperation. Wang et al. [16] investigated the evolutionary game of the co-opetition relationship between regional logistics nodes. They proposed a symmetric and an asymmetric game model according to the state and level of logistics nodes, respectively. Zhang et al. [17] studied the evolutionary game problem of e-commerce enterprises and courier enterprises, explored the equilibrium strategies of both parties under public supervision, elucidated the influence of relevant parameters on strategy selection, and made suggestions for the cooperation and development of courier enterprises and e-commerce. Regarding the last-mile delivery problem, Zhou et al. [18] considered the cooperation between logistics service providers (LSPs) and property service companies (PSCs), and established a trilateral evolutionary game model between PSCs, LSPs, and customers to analyze the strategic choices and to explore the influencing factors on the tripartite strategy. Li et al. [19] constructed an evolutionary game model to explore the dynamic selection process of enterprise information sharing strategies in logistics service supply chains with functional logistics service providers (FLSPs) and logistics service integrators (LSIs) as research objects. Some scholars have also focused on the role of the government in logistics cooperation. Wang et al. [20] built a trilateral evolutionary game model to study the behavior of the government, manufacturing firms, and logistics firms in logistics cooperation. Han and Yang [21] investigated how the government plays a role in inducing joint distribution alliances to bring green and low-carbon demands into profit distribution. By establishing the “government–member enterprise A–member enterprise B” tripartite evolutionary game model, the strategic evolution process of the three parties, the factors affecting profit distribution, and the stability of the alliance were explored. In addition, the outsourcing decision problem of cold chain logistics is also a hot research issue. Xing et al. [22] applied evolutionary game theory to study the behavioral strategies of cold goods manufacturers and logistics service providers, and considered the effects of corporate contract constraints and government policy subsidies on the evolutionary outcomes. Based on this, Xing et al. [23] investigated the evolutionary game problem of cold chain logistics companies and the government. The cold chain logistics companies (CCLCs) can share their logistics information with the government to provide cold chain transparency, traceability, and brokenness proofs to avoid cold chain breaks that can lead to safety problems. Liu and Wang [24] constructed an evolutionary game model for logistics outsourcing considering fresh-keeping efforts to study the cooperative decisions of logistics and fresh enterprises.
Income distribution is another key issue affecting resource sharing of logistics companies. There have been many studies on the income distribution of alliances, primarily focusing on the fairness of income distribution. Lozano et al. [25] used the cooperative game to study the profit distribution of logistics enterprises in horizontal cooperation. Lu et al. [26] developed an improved income distribution model for the logistics service supply chain that considers the fairness preference of LSIs and FLSPs. The impacts of inequity aversion and the number of inequity averse members on income distribution are discussed separately. Kimms and I. Kozeletskyi [27] used the Core method to study the benefit distribution problem of horizontal cooperation of delivery firms, solved the function eigenvalues of the TSP problem (Traveling Salesman Problem), and obtained the minimum core element using the improved Core method to reduce the computational effort. In addition, many scholars used the Shapley value method and the Raiffa solution to solve the profit distribution problem of the logistics alliance. Wang et al. [28] established an improved Shapley value model based on cooperative game theory to obtain the optimal profit distribution scheme and sequential coalitions, respectively, in a two-echelon logistics joint distribution network. Li et al. [29] studied the profit distribution problem of urban joint distribution alliances by incorporating four criteria (enterprise operation, customer satisfaction, environmental sustainability, and information technology) into the improved Shapley value model. Song et al. [30] constructed a fuzzy DEA-based efficiency metric model. Based on this, they proposed an improved Shapley value model to equitably allocate cooperative profits. Kou et al. [31] investigated multimodal transportation for last-mile distribution in rural areas, constructed a Shapley value model, and studied the marginal contribution of various distribution modes in multimodal transportation. Moreover, Zhou et al. [32] concluded that the Raiffa solution is the most appropriate for cost allocation in urban joint distribution. Jiao et al. [33] introduced the “Z factor” to measure the market position of firms, which is used to modify the Raiffa solution.
Reviewing the existing research results, there is still a lack of research on the mutual relationships and benefit allocation among express delivery companies. Literature reviews from evolutionary game indicate that prior research has mainly focused on resource sharing between enterprises at different logistics levels, such as supply chain enterprises and logistics enterprises (logistics outsourcing problem), functional logistics service providers (FLSPs) and logistics service integrators (LSIs), or logistics service providers (LSPs) and property service companies (PSCs). Currently, there is little research on cooperation and competition between enterprises in the same logistics chain level (horizontal cooperation). Individual differences among enterprises affecting logistics sharing decisions have also been overlooked. Although some literature examines the scale of cooperative enterprises, there is no comparative analysis of symmetric and asymmetric express delivery alliances to discuss the role of influencing factors under these two conditions. Income distribution also faces similar problems. Classical income distribution methods mainly emphasize the fairness of the alliance as a whole and ignore individual differences among enterprises. To address this issue, some literature has improved classical profit distribution models based on specific scenarios by introducing relevant parameters. Therefore, this paper focuses on horizontal cooperation among express delivery companies in urban delivery. We investigate the evolutionary game and income distribution problems of express delivery companies considering the impact of enterprise scale on logistics sharing.
The main contributions of this paper are as follows: (1) According to the characteristics of express delivery companies, we construct symmetric and asymmetric evolutionary game models to study the decision-making process of logistics resource sharing in express delivery companies. (2) Based on model solving and simulation, we discuss the effects of factors, such as enterprise scale, income distribution coefficient, and penalty for default, on logistics resource sharing and propose management insights to promote long-term stable cooperation among express delivery companies. (3) We propose an improved income distribution model based on the Raiffa solution by introducing a comprehensive enterprise strength coefficient.

3. Evolutionary Game Model of Logistics Sharing

3.1. Problem Description and Assumptions

In recent years, the demand for last-mile delivery has been increasing, and market competition has intensified. Driven by the need to reduce operating costs and improve service efficiency, express delivery companies are willing to share logistics resources and achieve joint distribution. However, there are differences in resource strength and service levels among the express delivery companies, and there are risks of default in cooperation. These risks have all affected the stability of system cooperation. Express delivery companies will adjust their decisions on the premise of maximizing their own interests.
In the context of logistics resource sharing, express delivery companies have two strategic choices: cooperation or competition. Cooperation means that express delivery companies share logistics resources for joint distribution. In addition, we divide express delivery companies into two types according to their scale: Type I and Type II. Type I includes the larger express delivery companies with a higher market share and resource level; Type II includes the smaller ones with a lower market share and resource level.
In order to effectively promote the cooperation of express delivery companies and achieve the system Pareto optimum, we construct evolutionary game models for express delivery companies to share logistics resources. The effects of express delivery company scale, logistics resource sharing risk, and logistics resource sharing benefit on the corporate strategy are investigated. Then, the convergence path of the system under different conditions is analyzed to provide guidance for the long-term stable cooperation of courier enterprises.
The game satisfies the following basic assumptions: (1) The game subject has finite rationality; (2) The game subject has learning ability; (3) The game process has long-term dynamics.
The player set includes an express delivery company A and an express delivery company B. The strategy space of the two companies is (cooperation, competition). The symbols of the variables involved in the model are explained in Table 1.

3.2. Symmetric Evolutionary Game Model of Logistics Sharing

When express delivery companies of comparable scale carry out logistics resource sharing, the participating subjects of the game come from one type of group; they all belong to Type I or they all belong to Type II. Assume that when the logistics resource sharing is carried out by express delivery companies of comparable scale, the income distribution coefficient is the same, r a = r b = r = 1/2. At this time, there is no difference in the activities of the game subjects in the evolutionary game process, which belongs to the symmetric evolutionary game. Express delivery companies have two strategic choices: cooperation or competition. Assume that the proportion of express delivery companies choosing the cooperative strategy in the initial state of the express delivery company group is x 0 x 1 , and the proportion of those choosing the competitive strategy is 1 − x.
Based on the above assumptions, the symmetric evolutionary game payoff matrix of express delivery companies is shown in Table 2.
The expected payoff of express delivery companies A and B adopting the competition strategy is:
U 1 = x r W I + 1 x R I + e I
The expected payoff of express delivery companies A and B adopting the competition strategy is:
U 2 = x R e I + 1 x R
The average expected payoff of express delivery companies A and B is:
U ¯ = x U 1 + 1 x U 2
Therefore, the replication dynamic equation of the system is as follows.
d x d t = x U 1 U ¯ = x 1 x r W R x I + e I

3.2.1. Stability Analysis

Let d x d t = 0 . Then, three singularities can be gained: x 1 = 0 , x 2 = 1 , x 3 = I e I r W R , which implies that the game system has at most three stable solutions.
(1)
When I e I < r W R , we can obtain x 3 = I e I r W R 0 , 1 , d x 2 d t 2 x = x 1 < 0 , d x 2 d t 2 x = x 2 < 0 , d x 2 d t 2 x = x 3 > 0 . According to the stability of the differential equation, x 1 and x 2 are stable points of the system, and x 3 is the saddle point. The changing trend of express delivery company dynamic evolution is shown in Figure 2a.
At this point, the game outcome of the system depends on the initial state. If the initial value of x is between ( x 1 , x 3 ) at the beginning of the game, the system will eventually stabilize at x 1 , and the express delivery company will tend to adopt a competitive strategy. If the initial value of x is between ( x 3 , x 2 ) at the beginning of the game, the system will eventually stabilize at x 2 , and the express delivery company will eventually adopt a cooperative strategy to achieve joint distribution.
(2)
When I e I > r W R or r W R < 0 , we can obtain x 3 = I e I r W R 0 , 1 , which means that x 3 is out of the picture. In this case, d x 2 d t 2 x = x 1 * < 0 , d x 2 d t 2 x = x 2 * > 0 . There is only a stable point x 1 = 0 , which means that express delivery companies will adopt a competitive strategy. Therefore, logistics resource sharing between express delivery companies cannot be achieved. The changing trend of express delivery company dynamic evolution is shown in Figure 2b.
(3)
When I e I = r W R , we can obtain x 3 = x 2 = 1 . At this point, x 3 and x 2 coincide, and the change trend of the system is the same as that of the case (2), with only one stable point, x 1 = 0. Express delivery companies will eventually choose the competitive strategy; the system cannot achieve cooperation.
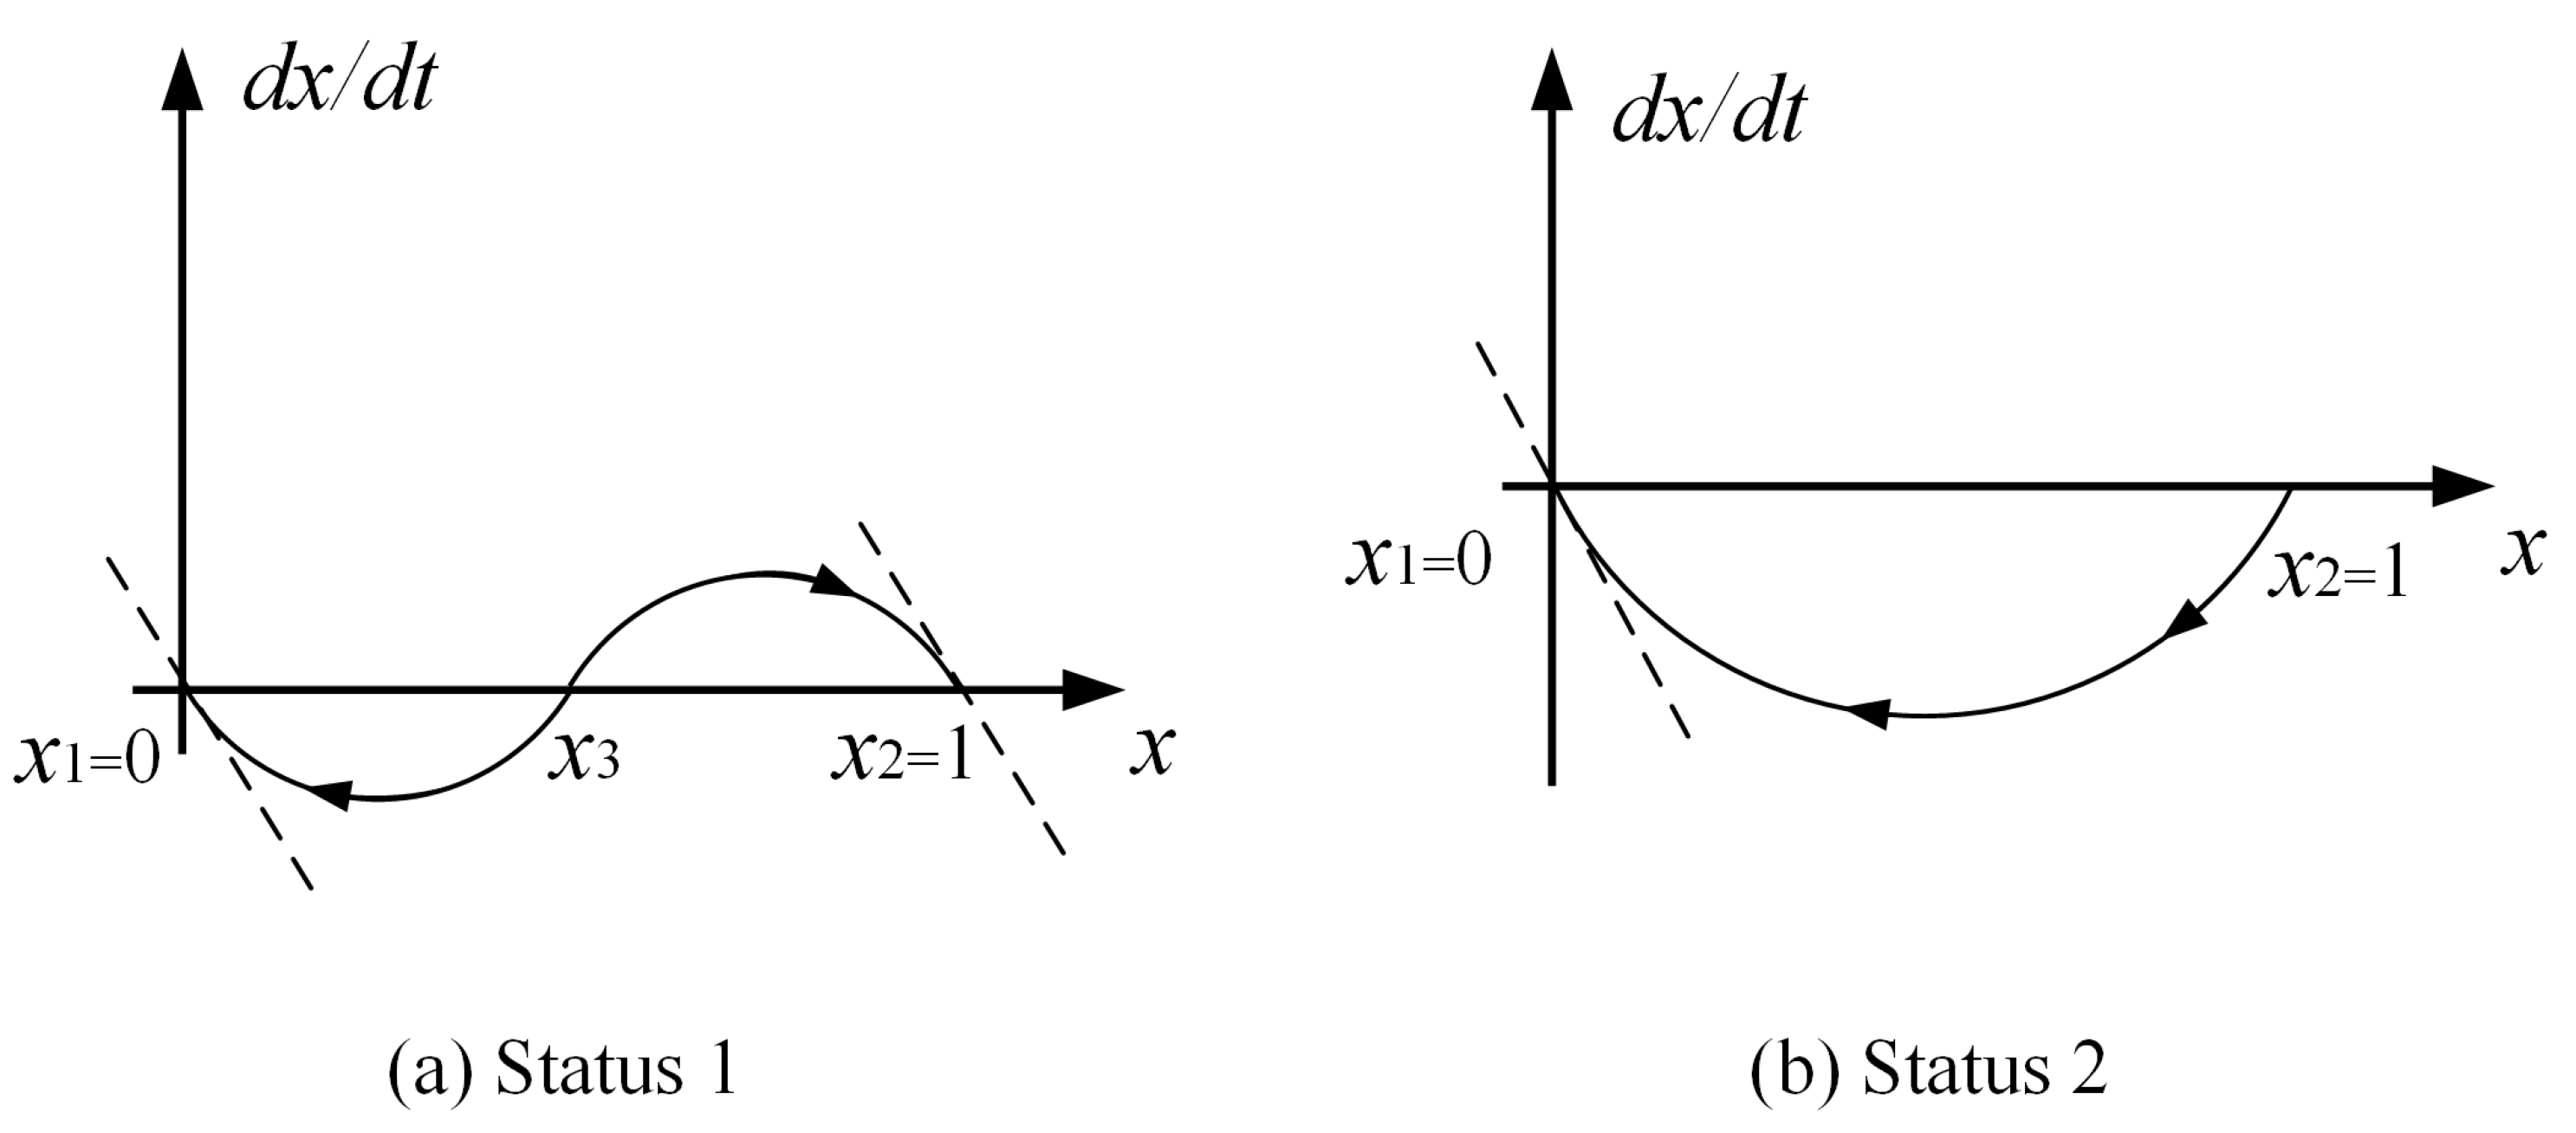
Figure 2. Changing trends of express delivery company dynamic evolution in the symmetrical evolutionary game.
Sustainability 15 08621 g002

3.2.2. Sensitivity Analysis

I e I < r W R is equivalent to r W I > R e I , which means that the express delivery companies can gain extra profit in the sharing of logistics resources. Under this condition, express delivery companies have the possibility to choose cooperation strategies. At this point, the evolution result of the system depends on x 3 = I e I r W R x 3 0 , 1 ,     r = 1 / 2 . When x 3 is smaller, the greater the probability of the express delivery companies to cooperate.
Next, we will discuss the effect of each variable on the evolutionary outcome based on x 3 . First, we solve for the partial derivatives of x 3 with respect to each parameter, and then we discuss the effect of each parameter on x 3 to find countermeasures to improve the probability of cooperation. The partial derivatives of x 3 with respect to each parameter are shown below.
d d I I e I r W R = 1 e r W R > 0
d d R I e I r W R = I 1 e r W R 2 > 0
d d r I e I r W R = W I e 1 r W R 2 < 0
d d W I e I r W R = r I e 1 r W R 2 < 0
d d e I e I r W R = I r W R < 0
(1)
The impact of I
According to Equation (5), it can be seen that x 3 is a monotonically increasing function of I . With other conditions unchanged, as the input cost increases, the larger x 3 is. Express delivery companies will be more likely to choose a competitive strategy, and the probability of the system reaching cooperation becomes smaller.
(2)
The impact of R
According to Equation (6), it can be seen that x 3 is a monotonically increasing function of R . With other conditions unchanged, as the profit from independent operation increases, the larger x 3 is. Therefore, express delivery companies will be more likely to choose a competitive strategy, and the probability of the system reaching cooperation becomes smaller.
(3)
The impact of r
According to Equation (7), it can be seen that x 3 is a monotonically decreasing function of r . With other conditions unchanged, as the income distribution coefficient increases, the smaller x 3 is. Therefore, express delivery companies will be more likely to choose a cooperation strategy, and the probability of the system reaching cooperation becomes larger.
(4)
The impact of W
According to Equation (8), it can be seen that x 3 is a monotonically decreasing function of r . When other factors are fixed, as the joint distribution income increases, the smaller x 3 is. Therefore, express delivery companies will be more likely to choose a cooperation strategy, and the probability of the system reaching cooperation becomes larger.
(5)
The impact of e
According to Equation (9), it can be seen that x 3 is a monotonically decreasing function of e . When other factors are fixed, as the default penalty coefficient increases, the smaller x 3 is. Therefore, express delivery companies will be more likely to choose a cooperation strategy, and the probability of the system reaching cooperation becomes larger.

3.3. Asymmetric Evolutionary Game Model of Logistics Sharing

When express delivery companies with different enterprise scales share logistics resources, the participating subjects of the game belong to different types, and the evolutionary game process will appear differently. It is assumed that express delivery company A belongs to larger enterprises (Type I) with a higher market share and resource level; express delivery company B belongs to smaller enterprises (Type II) with a lower market share and resource level. Both have two strategic choices: cooperation or competition. Among them, the proportion of express delivery companies that choose cooperation in the initial state of the Type I group is x 0 x 1 , and the proportion choosing competition is 1 x ; the proportion of express delivery companies that choose cooperation in the initial state of the Type II group is y 0 y 1 , and the proportion choosing competition is 1 y .
Based on the above assumptions, the asymmetric evolutionary game payoff matrix between express delivery company A and express delivery company B is shown in Table 3.
According to the payoff matrix, the expected payoffs of enterprise A adopting the cooperative strategy and the competitive strategy are described as follows, respectively.
U a 1 = y r a W I a + 1 y R a I a + e I b
U a 2 = y R a e I a + 1 y R a
The average expected payoff of enterprise A is:
U ¯ a = x U a 1 + 1 x U a 2
Thus, the replication dynamic equation for enterprise A is as follows.
F x = d x d t = x U a 1 U ¯ a = x 1 x r a W e I b R a + e I a y I a + e I b
Likewise, the replication dynamic equation of enterprise B is:
F y = d y d t = y U b 1 U ¯ b = y 1 y r b W e I a R b + e I b x I b + e I a
Therefore, the available replication dynamic equations are as follows.
F x = d x d t = x 1 x r a W e I b R a + e I a y I a + e I b F y = d y d t = y 1 y r b W e I a R b + e I b x I b + e I a
Then, to simplify the formula, let:
M a = r a W e I b R a + e I a ,     N a = I a e I b
M b = r b W e I a R b + e I b ,   N b = I b e I a
Substituting in Equation (15), we can obtain the simplified formula.
F x = d x d t = x 1 x M a y N a F y = d y d t = y 1 y M b x N b

3.3.1. Stability Analysis

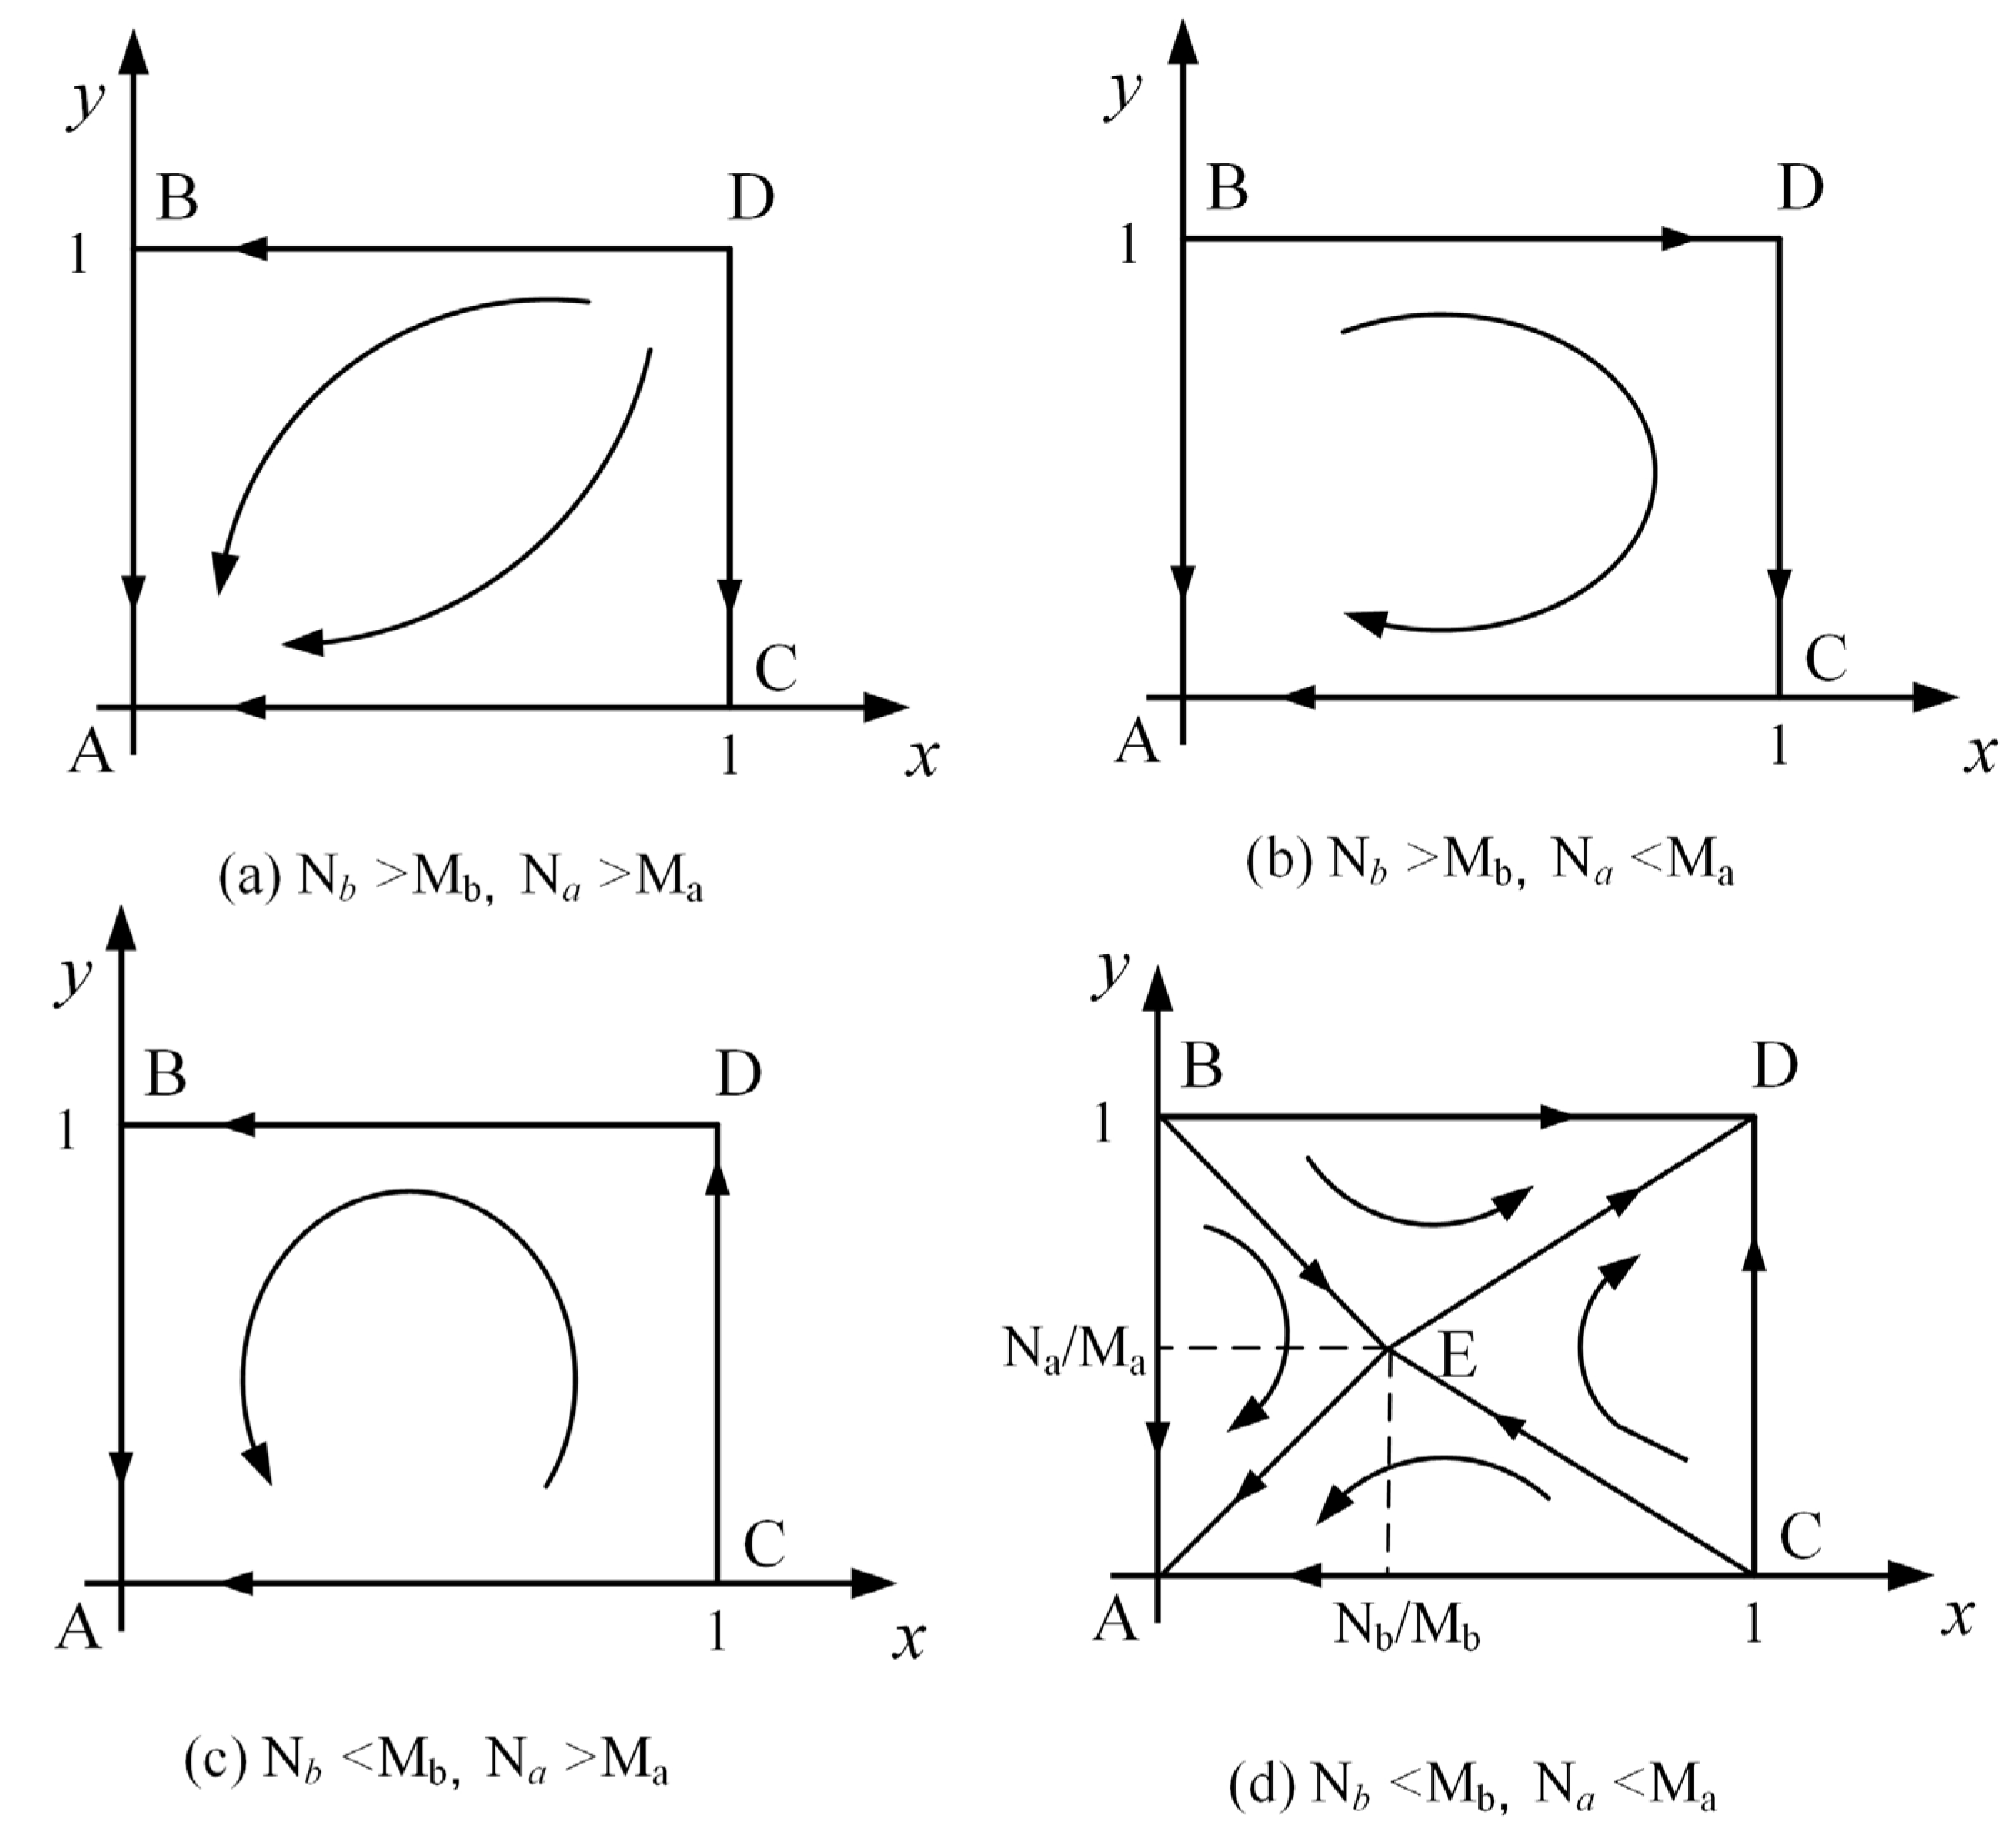
Let F x = 0 , F y = 0 , and then five singularities can be gained: A(0,0), B(0,1), C(1,0), D(1,1), and E( N b M b , N a M a ).
The Jacobian matrix of the system is:
J = F x x F x y F y x F y y = 1 2 x M a y N a x 1 x M a y 1 y M b 1 2 y M b x N b
The determinant of the Jacobian matrix is:
det J = 1 2 x M a y N a 1 2 y M b x N b x 1 x M a y 1 y M b
The trace of the Jacobian matrix is:
t r J = 1 2 x M a y N a + 1 2 y M b x N b
According to the characteristics of the Evolutionarily Stable Strategy (ESS), there are det J > 0 ,     t r J < 0 . Thus, we can use the Jacobian matrix to judge the stability of the system. Table 4 describes the local stability of the system.
When at least one of the conditions N b > M b and N a > M a is true, the point E( N b M b , N a M a ) will locate outside of the plane φ = x , y | 0 x 1 ; 0 y 1 . There are only four equilibrium points in the system, and A(0,0) is the ESS of the evolutionary game. In this case, at least one of the players satisfies R e I > r W I , which means that the enterprise cannot make profits in resource sharing. Thus, the relationship between express delivery companies will end up with competition, and the sharing of logistics resources cannot be reached. The changing trend of express delivery company dynamic evolution is shown in Figure 3a–c.
When N b < M b , N a < M a , there are five equilibrium points in the system. A(0,0) and D(1,1) are the ESS of the system. At this point, both players of the game satisfy R e I < r W I , which means enterprises can obtain extra profits in resource sharing. Whether the parties choose cooperation or competition depends on the initial state of the evolutionary game system. When the initial state (x, y) is in the quadrilateral ABEC, the system converges to A(0,0), and both parties will choose competition. When the initial state (x, y) is in the quadrilateral BDCE, the system converges to D(1,1), and the evolution results in cooperation to achieve logistics resource sharing. The changing trend of express delivery company dynamic evolution is shown in Figure 3d.

3.3.2. Sensitivity Analysis

According to the above evolutionary game, it can be seen that the result of the evolutionary game of logistics resource sharing among express delivery companies may be complete cooperation or competition. When N b < M b , N a < M a , as shown in Figure 3d, the final convergence depends on the area of quadrilateral ABEC and quadrilateral DBEC. When the area of quadrilateral ABEC is smaller, the greater the probability of the express delivery companies to cooperate. The area of the quadrilateral ABEC is denoted as S, which can be calculated as follows:
S = S Δ A E C + S Δ A B E = 1 2 I b e I a r b W e I a R b + e I b + I a e I b r a W e I b R a + e I a
Next, we will discuss the effect of each parameter on the evolutionary results based on the area function. The partial derivatives of the area function with respect to each parameter are shown below.
d S d R a = I a e I b 2 W r a + e I a e I b   R a 2 > 0
d S d R b = I b e I a 2 W r b + e I b e I a R b 2 > 0
d S d r a = W ( I b e I a ) 2 W ( 1 r a ) + e I b e I a R b 2 W I a e I b 2 W r a + e I a e I b R a 2
d S d r b = W I a e I b 2 W ( 1 r b ) + e I a e I b R a 2 W ( I b e I a ) 2 W r b + e I b e I a R b 2
d d r a d S d r a = I b e I a W 2 W 1 r a + e I b   e I a R b 3 + I a e I b W 2 W r a + e I a e I b R a 3 > 0
d d r b d S d r b = I a e I b W 2 W 1 r b + e I a e I b R a 3 + I b e I a W 2 W r b + e I b e I a R b 3 > 0
d S d W = r a I a e I b 2 W r a + e I a e I b R a 2 r b I b e I a 2 W r b + e I b e I a R b 2 < 0  
d S d e = I a 2 + I b W r a R a I a 2 W r a + e I a E I b R a 2 I b 2 + I a W r b R b I b 2 W r b + e I b e I a R b 2 > I a I a e I b 2 W r a + e I a E I b R a 2 I b I b e I a 2 W r b + e I b e I a R b 2 > 0  
(1)
The impact of R a , R b
According to Equations (21) and (22), it can be seen that S is a monotonically increasing function of R a and R b . As the profit from independent operation increases, the larger S is. Therefore, the probability of system evolution to a (competition, competition) strategy becomes larger, and the express delivery companies will eventually choose to operate independently.
(2)
The impact of r a , r b
According to Equations (23)–(26), it can be seen that the influence of r a and r b on S is non-monotonic, but d s 2 d r a 2 > 0 . Therefore, when d S d r a = 0, S has a minimum value. This means that the system has the greatest probability of evolving to a (cooperative, collaborative) strategy. Thus, there is an optimal ratio of income to make cooperation smooth.
(3)
The impact of W
According to Equation (27), it can be seen that S is a monotonically decreasing function of W . As the joint distribution income increases, the smaller S is. Therefore, the probability of system evolution to a (cooperation, cooperation) strategy becomes larger, and the express delivery companies will eventually choose to join distribution.
(4)
The impact of e
According to Equation (28), it can be seen that S is a monotonically decreasing function of e . As the default penalty coefficient increases, the smaller S is. Therefore, the probability of system evolution to a (cooperation, cooperation) strategy becomes larger, and the express delivery companies will eventually choose to join distribution.

4. Simulation of Evolutionary Game of Logistics Sharing

4.1. A Case Study

In order to show the rationality and effectiveness of the proposed models, we test our models by analyzing the logistics system of Dongpo District, Meishan City (within Chinese territory). We choose five representative express delivery companies as the research objects, including Zto, YTO, Yunda, Best, and Sto. They adopt the franchise model, where franchisees and a small number of direct-owned stores carry out the ‘last-mile delivery’ in urban areas. Thanks to this business model, it is easier to carry out logistics sharing and joint distribution with such express delivery companies.
(1)
Input cost of joint distribution
In terminal distribution, express delivery companies can share logistics resources, such as delivery vehicles, express personnel, courier outlets, funds, etc. Through field investigation, we obtained the resource information of these five enterprises, and then we could calculate the input cost. The results are shown in Table 5, and the calculation formula is:
Input costs = Number of courier outlets × 50 + Number of vehicles × 0.9 + Number of delivery personnel × 6 × 12 + Number of service personnel × 4 × 12
① The cost of the courier outlet mainly includes rent, construction costs, and other daily operating costs. According to the survey, the average annual cost of express outlets is CNY 50,000.
② Urban delivery vehicles are mainly electric vans, and the average market price is CNY 4500. Depreciation is calculated through a straight-line depreciation method without considering the net salvage value. Assuming that the useful life is 5 years, the annual depreciation expense is CNY 900.
③ Courier personnel mainly include delivery personnel and service personnel. Usually, each vehicle is equipped with one deliveryman, and their average salary is CNY 6000 per month. Each courier outlet is equipped with one to three service personnel; calculated according to the average of two people, their average monthly salary is CNY 4000.
④ In addition to the investment in fixed assets, companies may also share funds. In the simulation, the cash investment part is ignored in order to simplify the problem.
⑤ This paper adopts the RMB unit for monetary measurement. Exchange rates change in real time. In 2023, CNY   1 USD   0.14 EUR   0.13 .
Table 5. Input costs (in 1000 CNY).
EnterpriseCourier OutletsDelivery VehiclesDelivery PersonnelService PersonnelInput Costs
Zto167070327439.0
YTO136060266272.0
Yunda268080529628.0
Best205555406929.5
Sto144040284960.0
(2)
The profit from independent operation
Relevant data are available from the 2019 financial reports of these express delivery companies. According to the data released by the State Post Bureau of China, the total volume of domestic express delivery reached CNY 63,522.91 million in 2019, of which CNY 1791.049 million were completed in Sichuan. We can calculate the share of express business volume in Sichuan Province as 2.82%. In addition, according to the data of China’s Sichuan Bureau of Statistics, Dongpo District accounts for about 1% of Sichuan’s population. Therefore, we can estimate the profit of these express delivery companies in Dongpo District. The calculation results are shown in Table 6, and the calculation formula is as follows:
Profit from independent operation in Dongpo District of enterprise = (Express revenue − Express costs) × 2.82% × 1%
(3)
Clustering analysis
The input cost demonstrates the level of resources owned by the express delivery companies, and the independent operation profit demonstrates the market share of the express delivery companies. Therefore, express delivery companies can be classified according to these two indicators. We use the K-means algorithm for the clustering analysis of the enterprises. We adopt SPSS 26 for the simulation. The clustering results and cluster centers are shown in Table 7, where category 1 represents the larger enterprises in the region and category 2 represents the smaller ones.

4.2. Simulation Study

Combining the case data and the numerical simulation, MATLAB R2019a is used to simulate the evolutionary game model of logistics resource sharing. In the program setting, we chose the ode45 instruction and played the game 50 times. The simulation results and analysis are as follows.
(1)
The impact of enterprise scale on cooperation
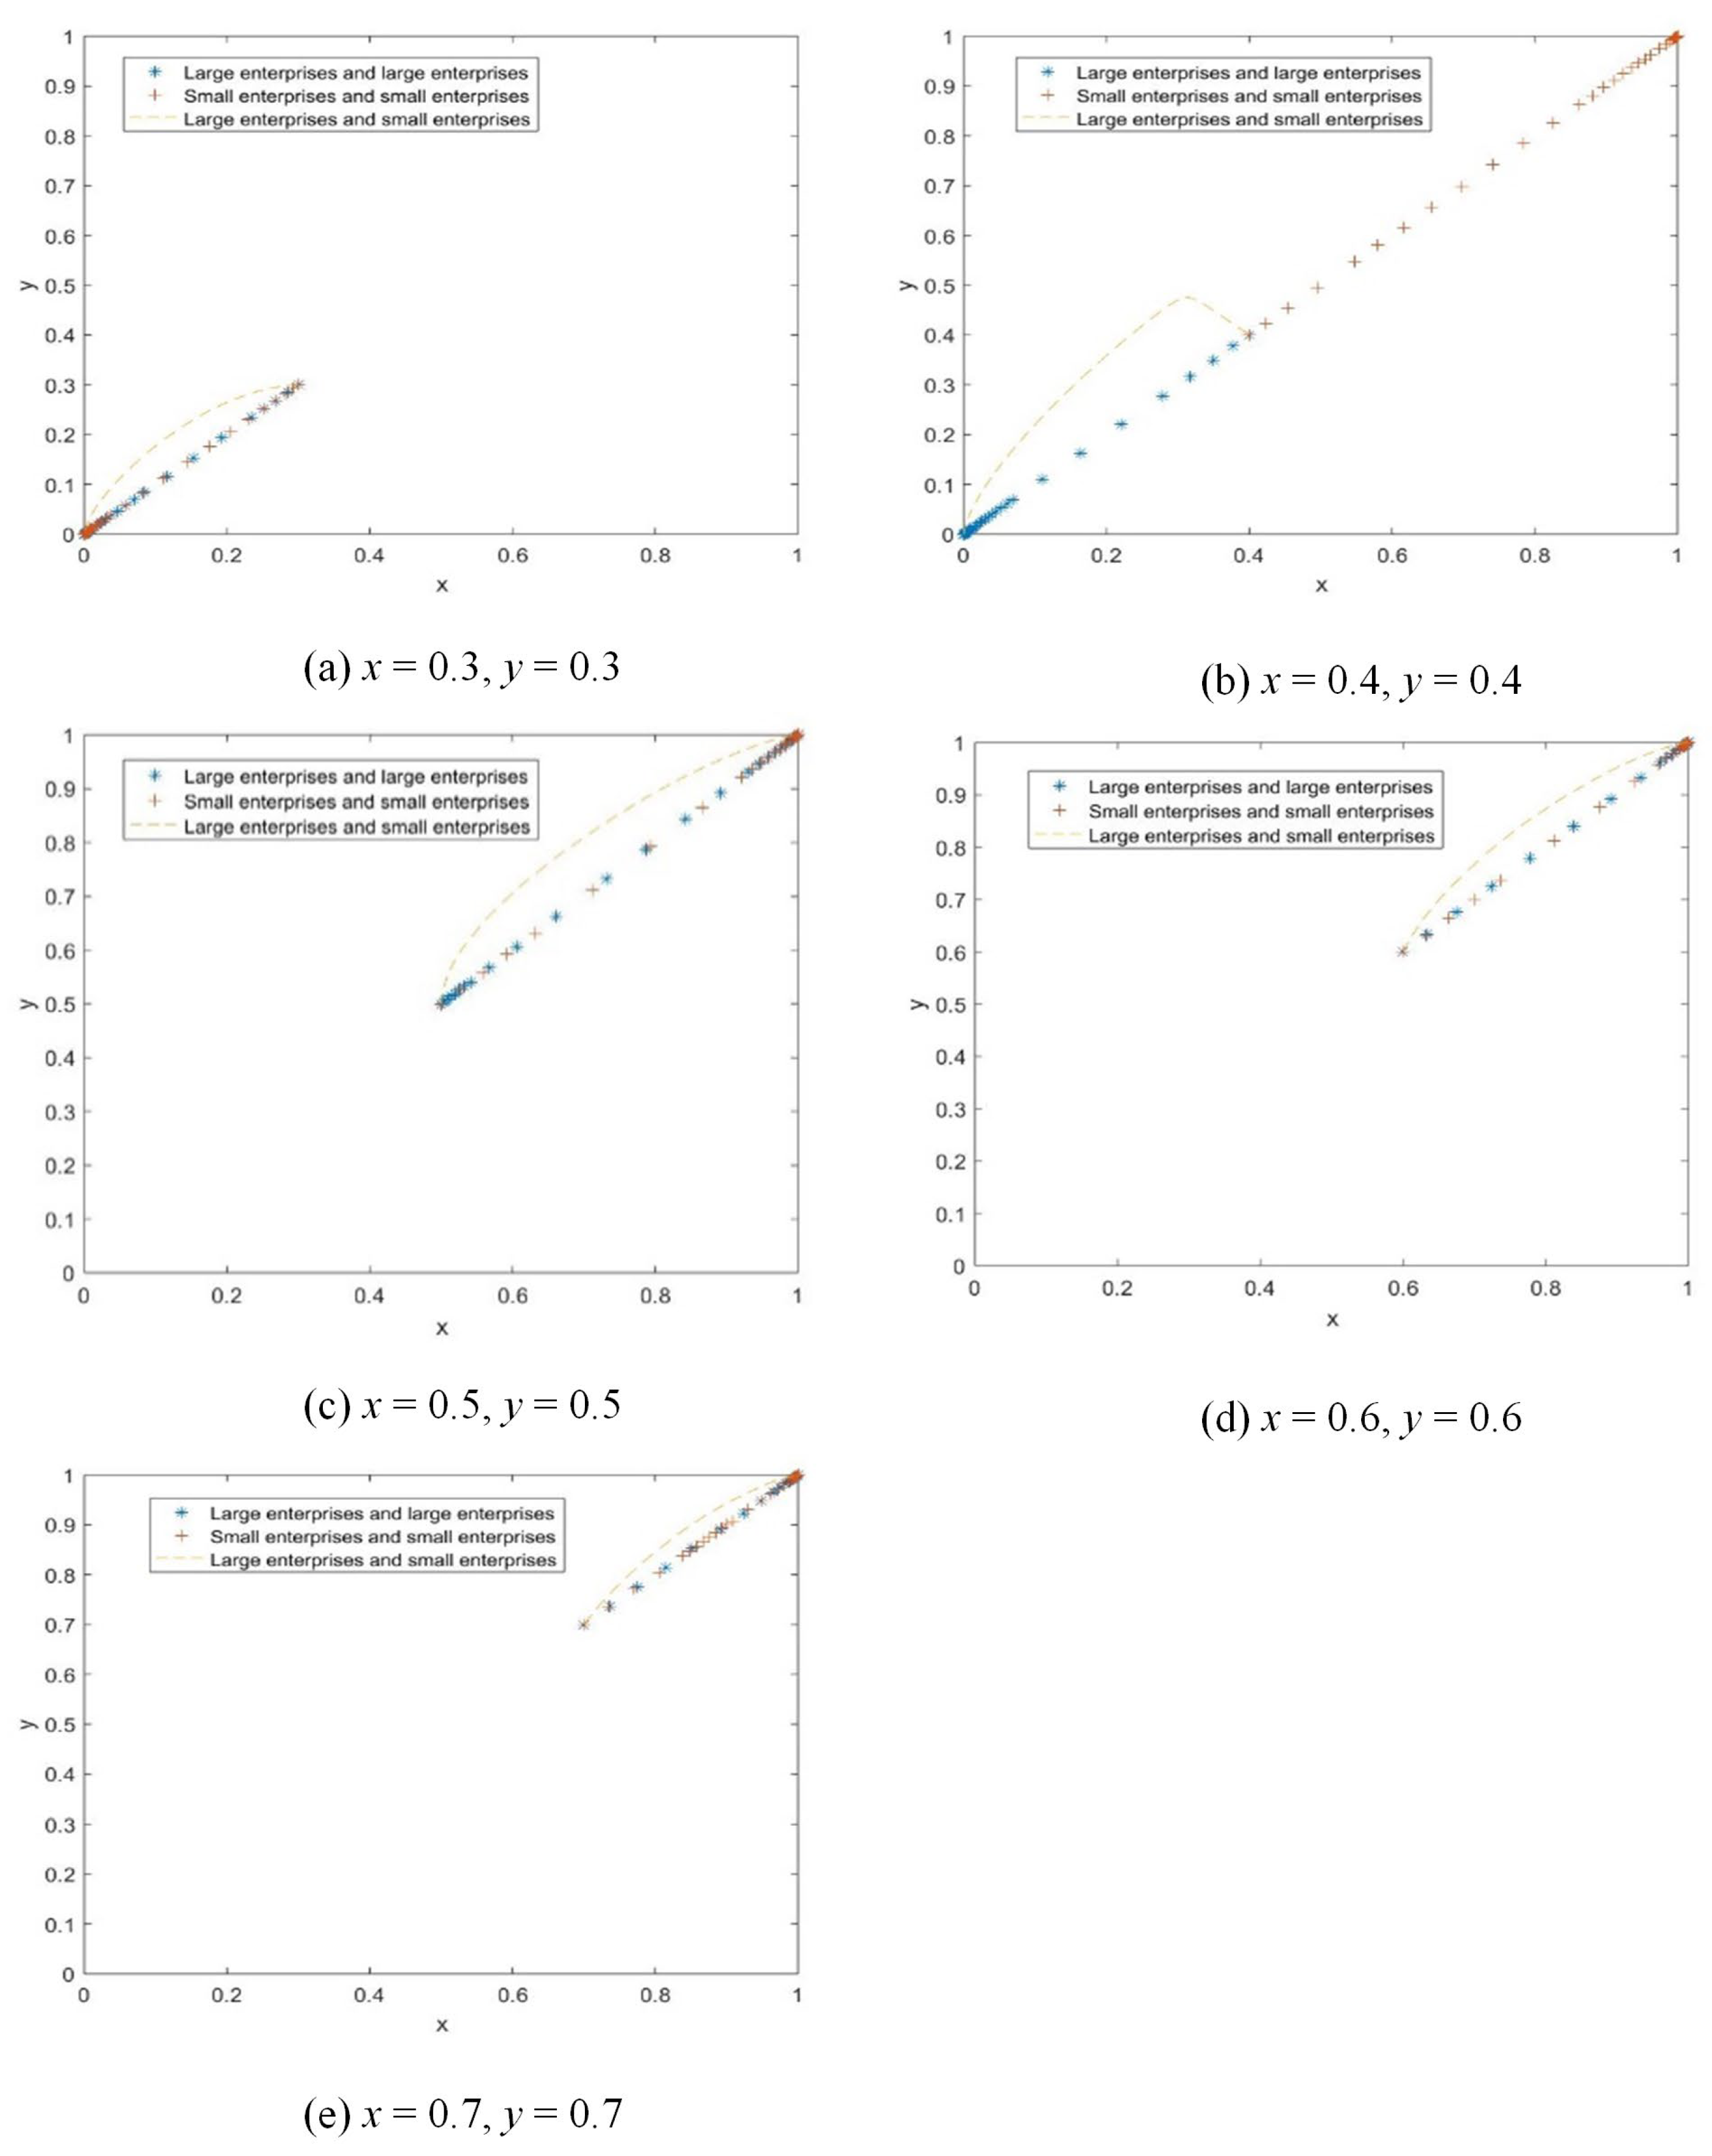
First, we fix the parameters of independent operation profit, income distribution coefficient, and default penalty coefficient, and then we study the evolution trends of large and large enterprises, small and small enterprises, and large and small enterprises. Table 8 describes the specific parameter settings. The model is discussed in five cases: ①   x = 0.3 , y = 0.3 ;     x = 0.4 , y = 0.4 ;     x = 0.5 , y = 0.5 ;     x = 0.6 , y = 0.6 ;   x = 0.7 , y = 0.7 .
Figure 4 is the simulation result. The evolutionary results show that the initial state of the company has an important influence on the game outcome. In general, the system can achieve cooperation only when the initial cooperation intention of the company is greater than 0.5. Comparing their convergence speeds, the simulation results show the trend as follows: large enterprise and large enterprise > small enterprise and small enterprise > large enterprise and small enterprise. Therefore, logistics resource sharing between companies of the same size was achieved more quickly than between companies of different sizes. Furthermore, compared to between smaller companies, logistics resource sharing can be more quickly stabilized between larger companies.
(2)
The impact of joint distribution income on cooperation
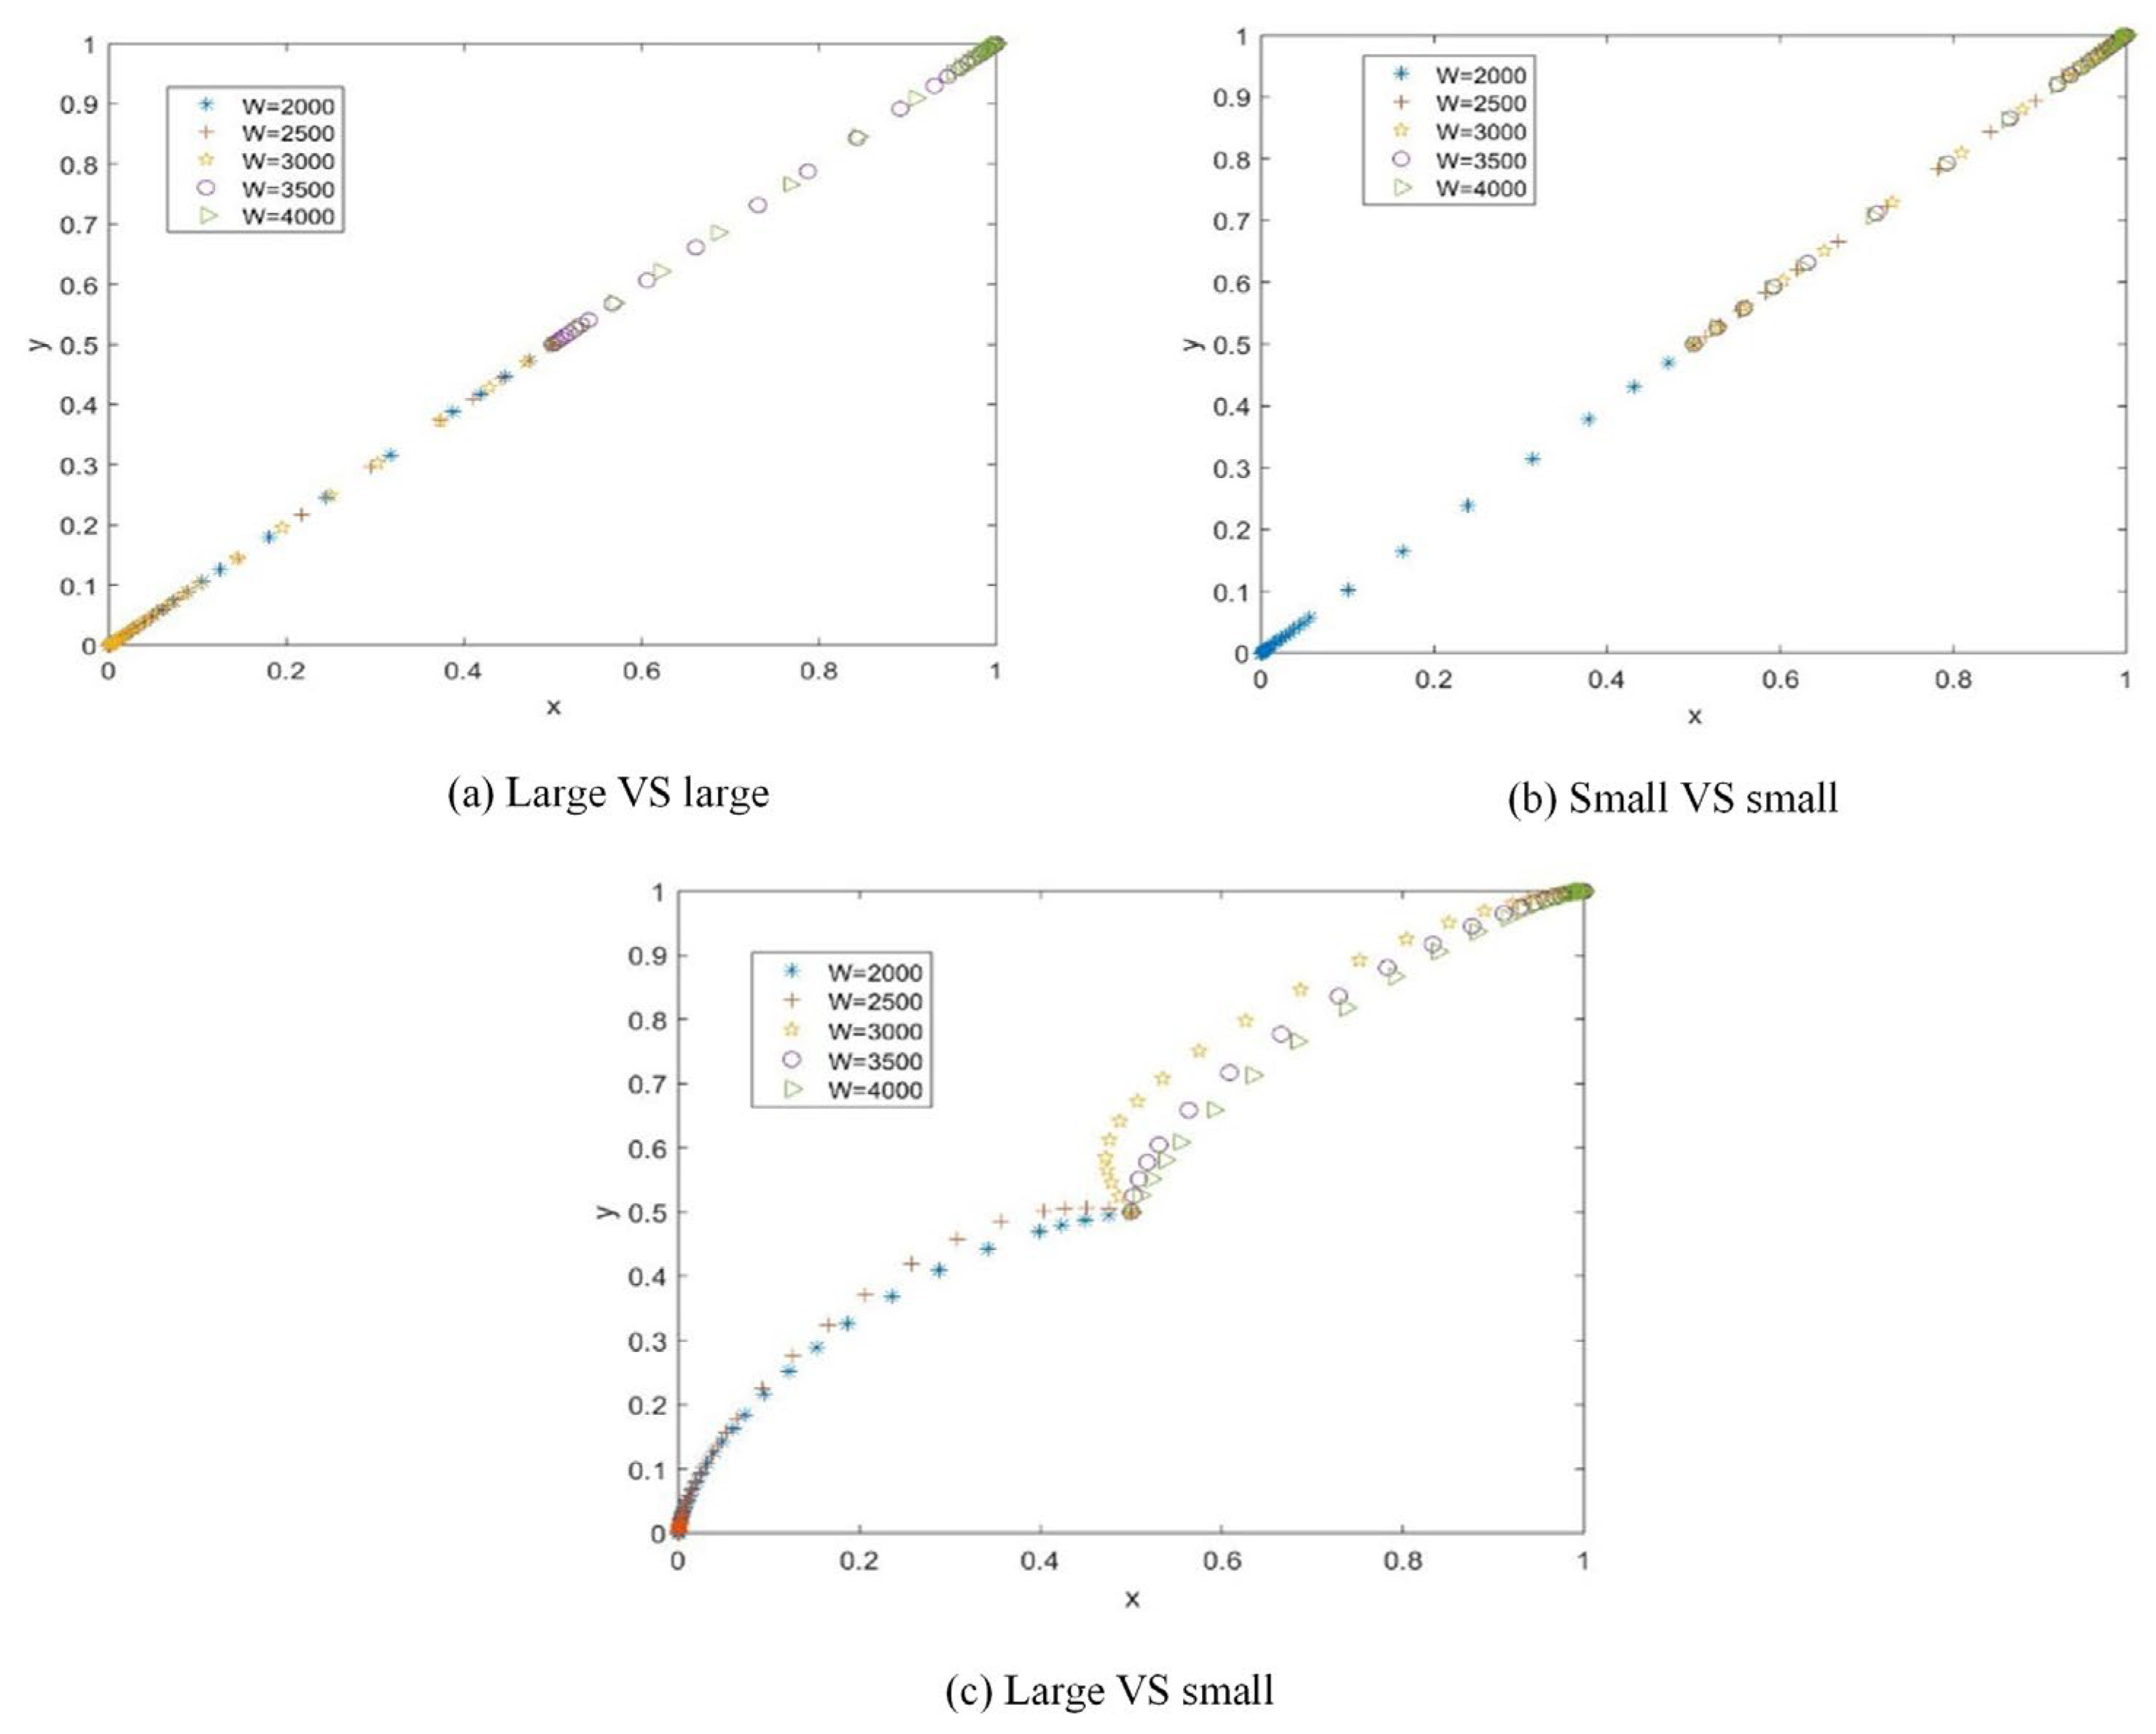
Similarly, we fix the parameters of input cost, independent operation profit, income distribution coefficient, and default penalty coefficient, and then we study the influence of joint distribution income on cooperation. The simulation is carried out when the initial state x = 0.5 , y = 0.5 . According to the enterprise scale, the model is discussed in three cases: ① cooperation between large enterprises and large enterprises; ② cooperation between small enterprises and small enterprises; and ③ large enterprises cooperate with small enterprises. Assume that the joint distribution income ( W ) varies between 2000 and 4000. Figure 5 is the simulation result.
In terms of convergence speed, the system reaches stability faster as the joint distribution income increases. In addition, when the sharing of logistics resources occurs between companies of different sizes, the evolutionary path inclines to the smaller company. This indicates that small companies will have a stronger willingness to cooperate than large companies when joint distribution incomes are certain.
(3)
The impact of income distribution coefficient on cooperation
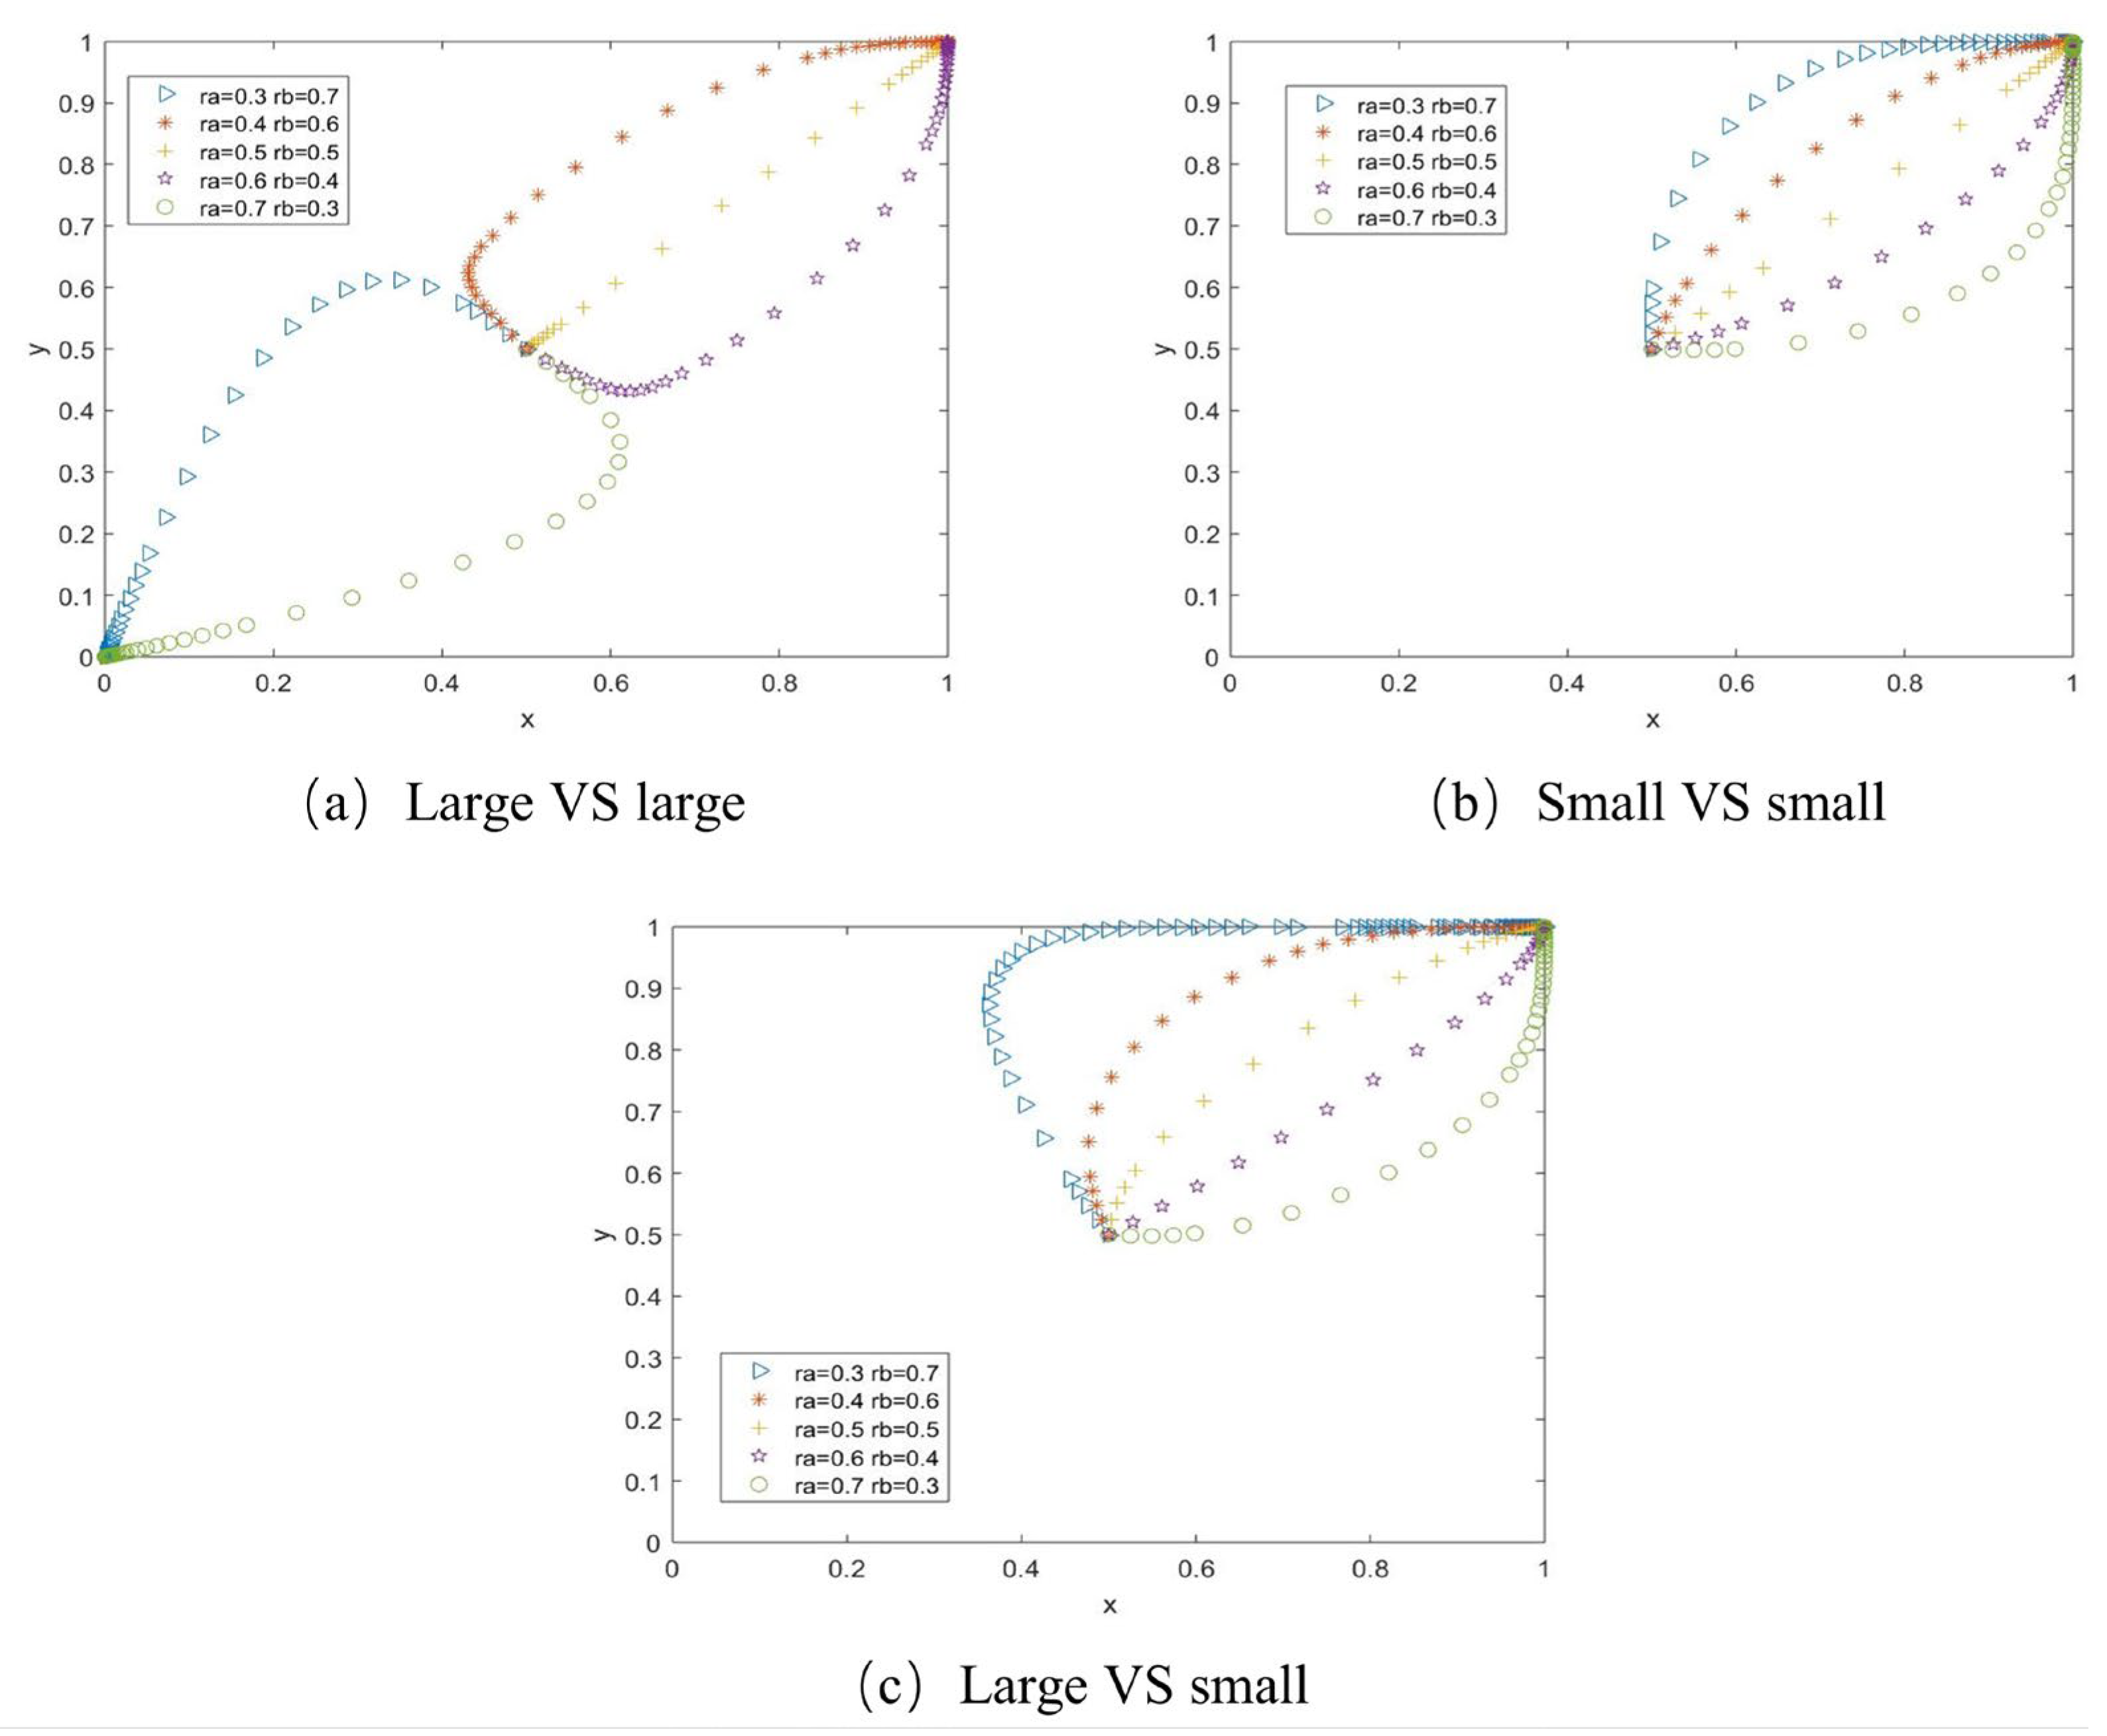
We fix the parameters of input cost, independent operation profit, joint distribution income, and default penalty coefficient. The simulation is carried out when the initial state x = 0.5, y = 0.5. It is also discussed in three cases. Then, we study the evolution results under different income distribution coefficients: ①   r a = 0.3 ,   r b = 0.7 ; ②   r a = 0.4 ,   r b = 0.6 ; ③ r a = 0.5 ,   r b = 0.5 ; ④   r a = 0.6 ,   r b = 0.4 ; and ⑤ r a = 0.7 ,   r b = 0.3 . Figure 6 is the simulation result.
When enterprises of the same scale play games, the evolutionary path of the system shows a symmetrical trend. In this case, when r a = r b = 0.5 , the system reaches stability at the fastest rate. Therefore, it is the optimal income distribution coefficient of the system. When the income distribution coefficient is different, the enterprise with more income has stronger cooperation willingness. If the difference is not big, the enterprise with lower income can also accept this result, and the system finally reaches cooperation. Otherwise, cooperation will break down. Moreover, small companies are more willing to cooperate than large ones. The logistics industry has significant characteristics of scale economics, and small companies have less competitive advantages in the market, so they are more inclined to cooperate. Therefore, they are less sensitive to the income distribution coefficient and are willing to accept lower income distribution.
When cooperation occurs between enterprises of different scales, large companies expect more benefits in the joint distribution. Under the same income distribution coefficient, such as r a = 0.3 , r b = 0.7 and r a = 0.7 , r b = 0.3 , the cooperative intention of large enterprises is lower than that of small enterprises. When r a = 0.6 , r b = 0.4 , and r a = 0.5 , r b = 0.5 , the evolution speed is relatively the fastest, but the evolution path is slightly inclined to the x-axis and y-axis, respectively. Therefore, the optimal evolution path is between these two paths. We can know that the larger the enterprise scale, the larger its optimal income distribution coefficient, and the two are positively correlated. Therefore, the logistics alliance needs to consider the enterprise scale when making income allocations.
(4)
The impact of default penalty coefficient on cooperation
Similarly, we first fix the parameters of input cost, independent operation profit, joint distribution income, and income distribution coefficient. Considering that the impact of default penalty coefficient on the cooperation between enterprises of same scales is similar, only two cases need to be studied: the cooperation between large enterprises and the cooperation between large enterprises and small enterprises. Then, we study the evolution results under different default penalty coefficients: ①   e = 0 ; ②   e = 0 .05; ③   e = 0.1 ; ④ e = 0.15 ; and ⑤ e = 0.2 .
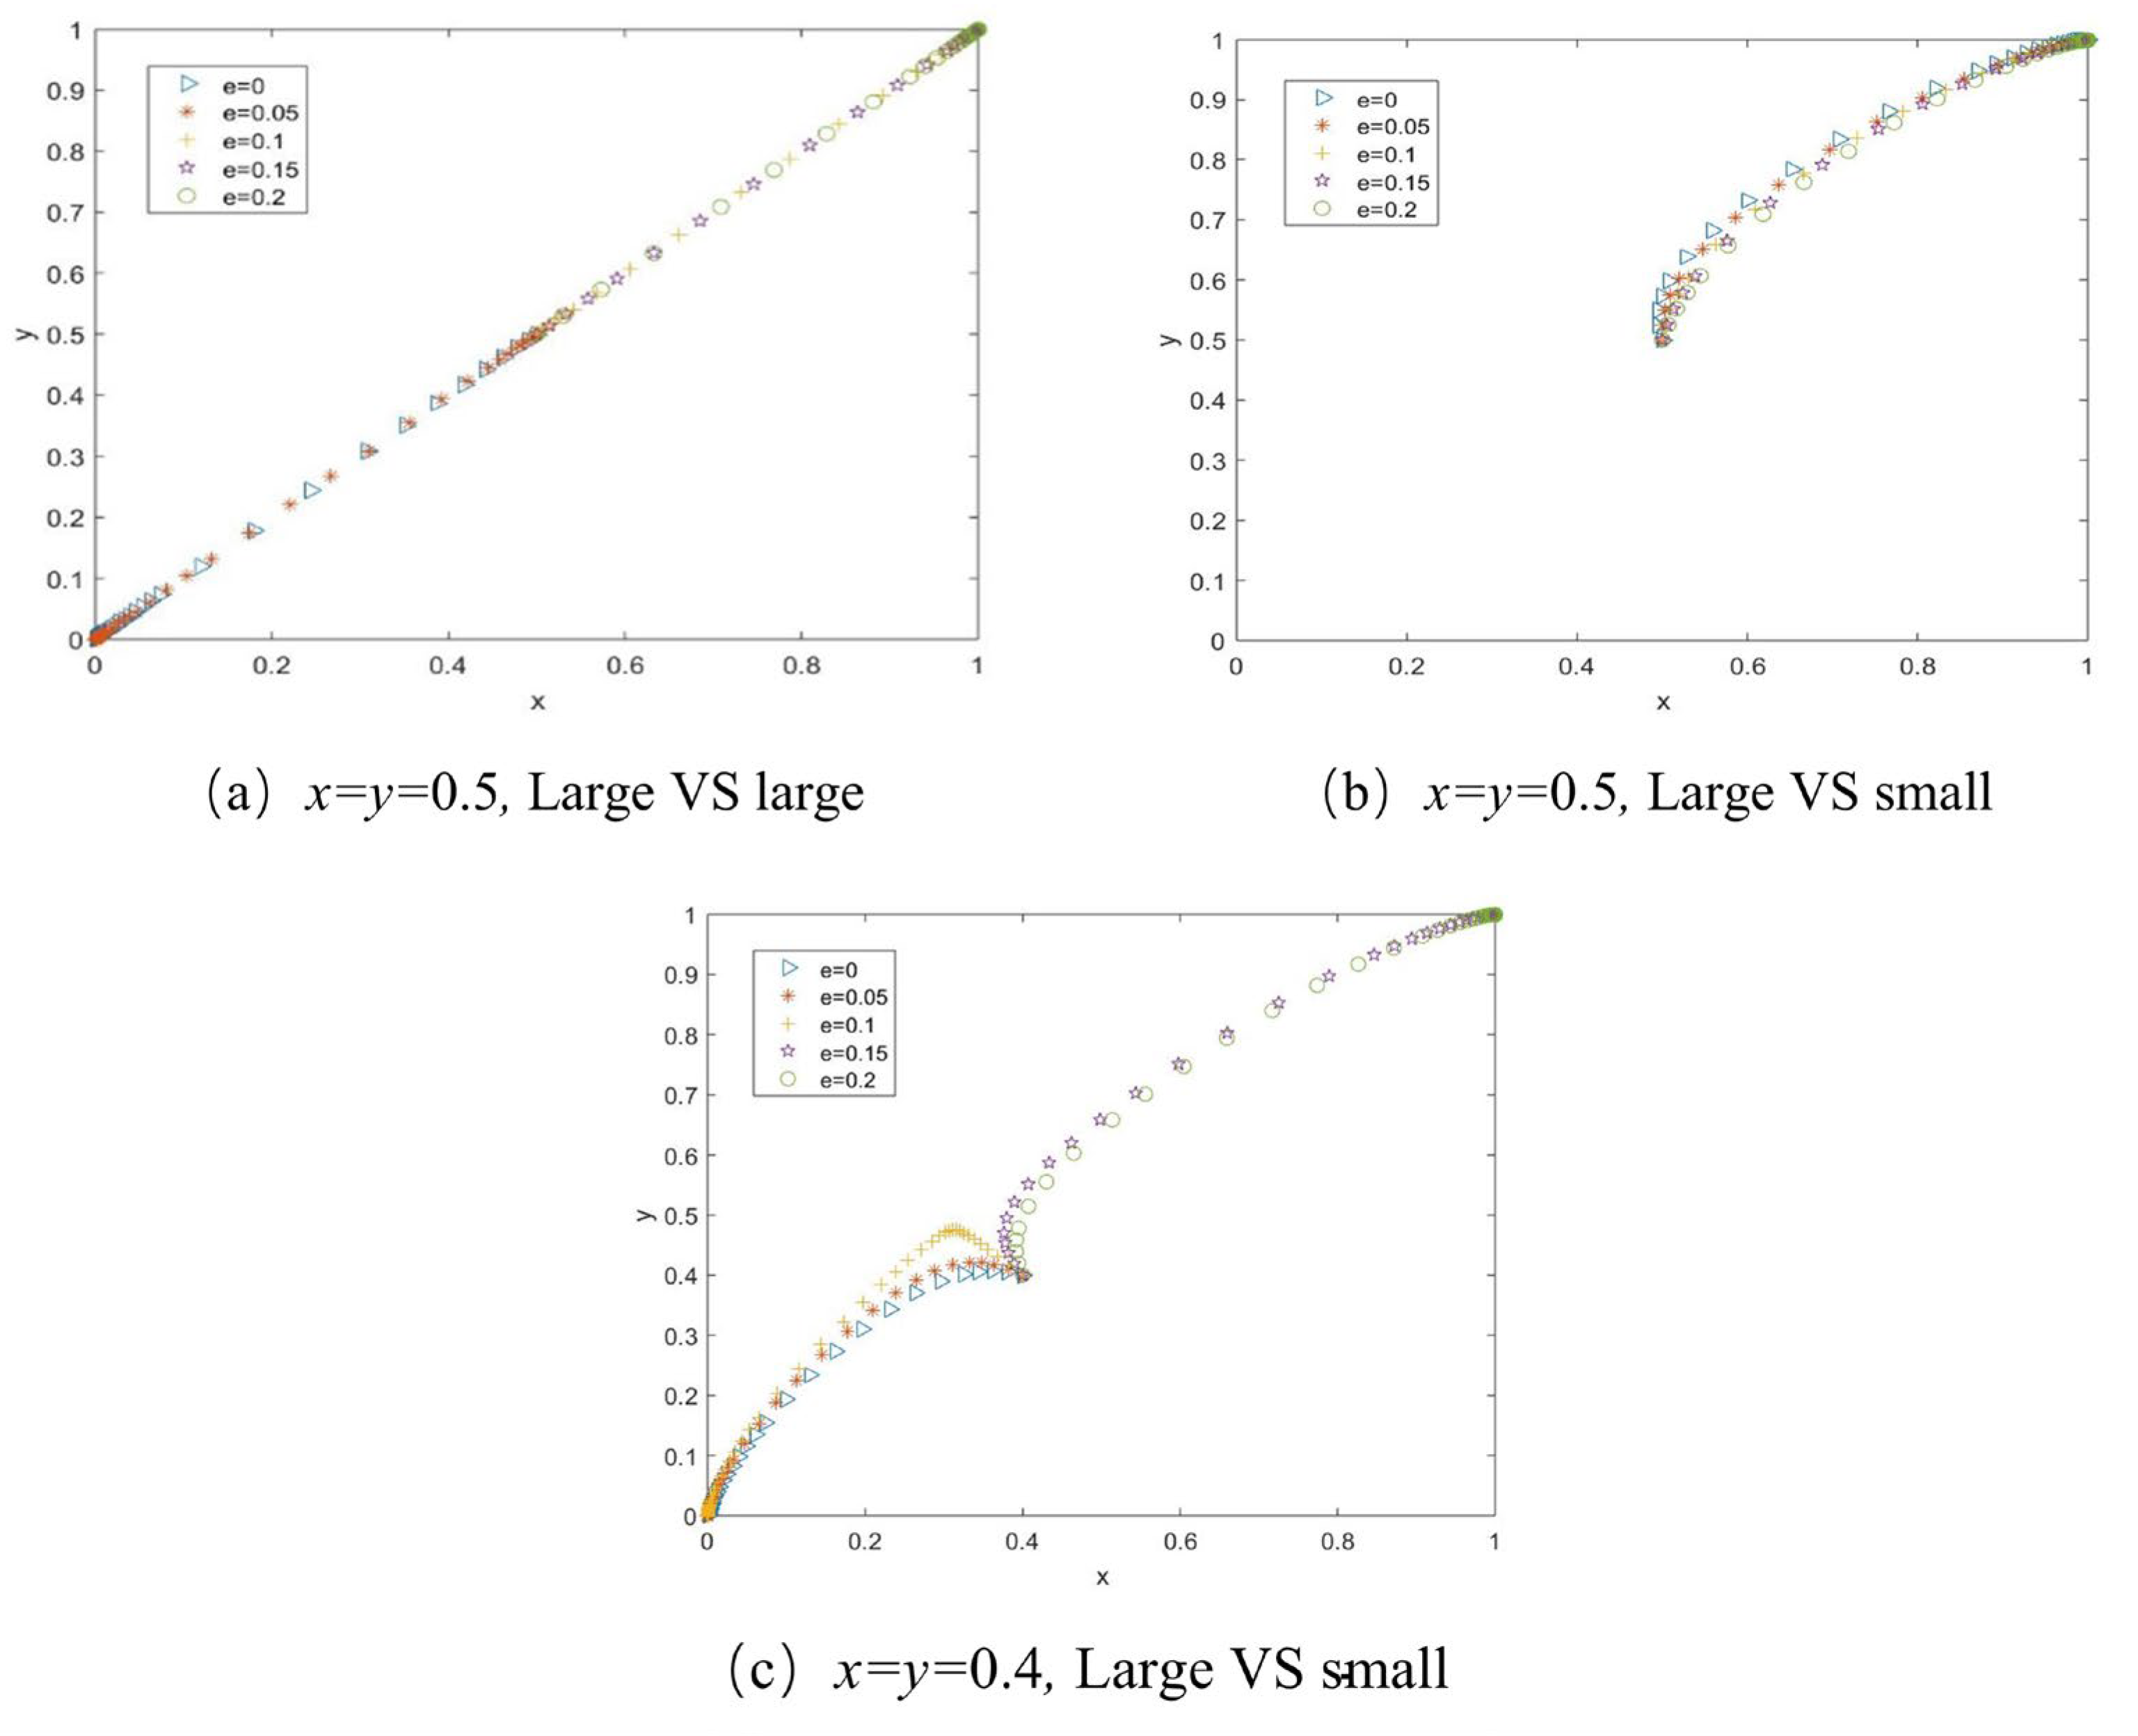
Assume that the initial state is x = y = 0.5 . Figure 7 is the simulation result. When the game is played between large enterprises, the enterprise strategy will shift from competition to cooperation as the default penalty coefficient increases. When the game occurs between enterprises of different sizes, the joint distribution income in this case may be large enough. Regardless of the value of the default penalty coefficient, the system can achieve cooperation. However, with the increase of the default penalty coefficient, the system can reach cooperation more quickly. Strangely, when the game occurs between enterprises of the same size, as the default penalty coefficient becomes larger, the slower the evolution speed at first. It then gradually accelerates to achieve stability. We speculate that when firms of the same size engage in logistics resource sharing, both parties tend to assume that the other will not default under constant external conditions. Therefore, the increase of the default penalty coefficient will lead to an increase in enterprise cost, which will affect cooperation in the early stage. With the deepening of cooperation, the default penalty coefficient becomes a positive factor, and the system tends to stabilize faster.
Moreover, we study the relationship between the default penalty coefficient and the initial cooperation state. When the initial state is x = y = 0.4 , the simulation results of enterprises of different sizes are shown in Figure 7c. Compared with Figure 7b, when the initial cooperation intention is low, enterprises will choose competition. However, as the penalty coefficient increases, the enterprise’s strategy will shift from competition to cooperation, ultimately achieving resource sharing. As such, we can know that the default penalty coefficient as an external factor can effectively improve the trust of cooperation.

5. Research on Income Distribution of Logistics Sharing

Each company is an entity of interest, and its core goal is to obtain maximum profitability. Therefore, establishing an income allocation scheme that meets the interests of multiple parties is the basis for long-term and stable logistics resource sharing. According to the results of the evolutionary game, there exists an optimal income distribution coefficient that maximizes the probability of system cooperation. Furthermore, the optimal income distribution coefficient of enterprises is positively correlated with their scale. Therefore, we investigate the income allocation scheme of logistics resource sharing.
There have been many research results on the income allocation problem of alliances. The classical income allocation models mainly include the Nash bargaining solution, the Core method, the Shapley value method, and the Raiffa solution. Among them, the Nash bargaining solution is limited by the bargaining power of coalition participants, and the final result may not be consistent with collective rationality. The Core method requires high quality and quantity of data, which is not applicable to this model. The Shapley value method and the Raiffa solution consider the fairness of the coalition as a whole when conducting income distribution but ignore the individual differences of members. Moreover, the Shapley value method needs to know the income of all sub-alliances, which will be cumbersome for complex alliance calculation.
Therefore, we decide to improve the Raiffa solution by considering the scale differences of enterprises. We construct an income distribution model that introduces the comprehensive strength coefficient of enterprises.

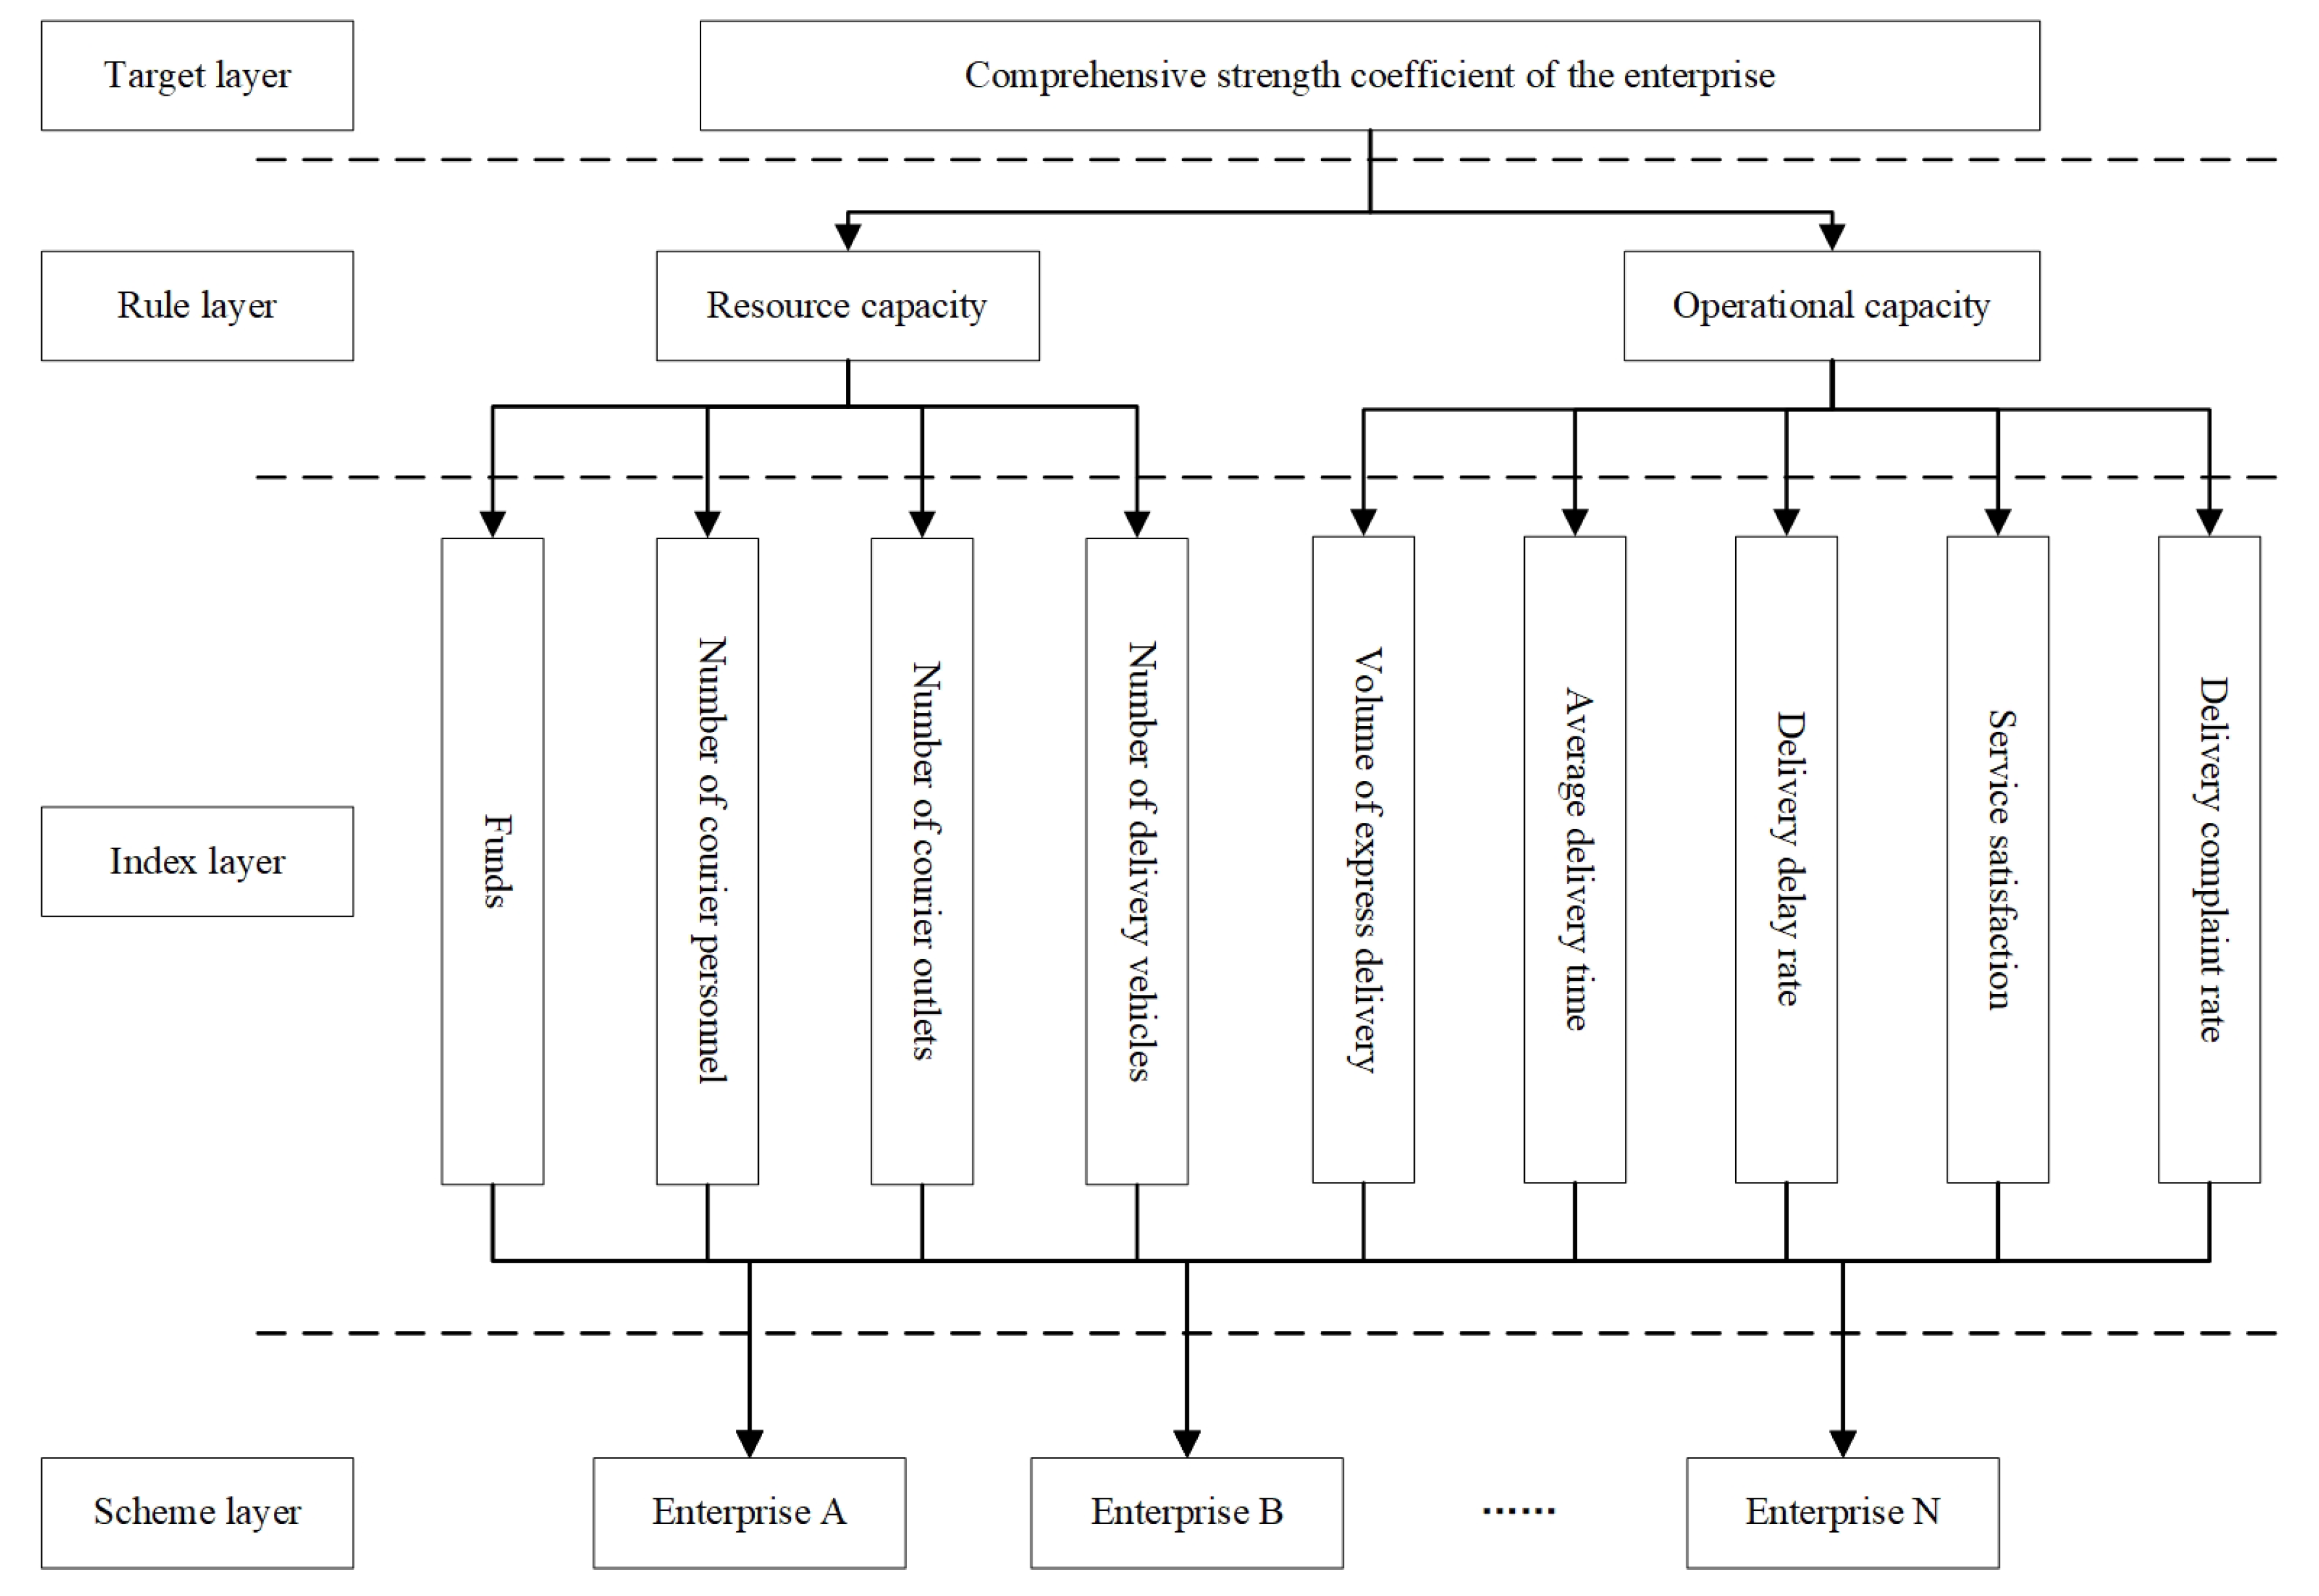
5.1. Comprehensive Strength Coefficient

Differences in enterprise scale are mainly reflected in resource levels and market shares. Among them, the market share of an enterprise reflects the operational capability. Therefore, we introduce the comprehensive strength coefficient to measure the impact of enterprise scale on income distribution. According to the game model and the actual situation, we evaluate the comprehensive strength coefficient from two dimensions: resource capacity and operational capacity. Resource capacity refers to the logistics resources that enterprises can share, and the evaluation index includes funds, courier personnel, courier outlet, and delivery vehicles. Operational capability refers to the operation and management capability of express delivery companies, and the evaluation indexes include volume of express delivery, average delivery time, delivery delay rate, service satisfaction, and delivery complaint rate. We use the Analytic Hierarchy Process (AHP) to construct an evaluation system for the comprehensive strength coefficient of the enterprise. The evaluation system is shown in Figure 8.
Then, we use the expert scoring method to define the index weights. Eleven experts and scholars in the field of logistics were invited to compare the importance of various indicators according to the nine-point score method. Then, we constructed an expert judgment matrix based on the survey results, used the square root method to calculate the index weight, and checked the consistency of the judgment matrix. When CR < 0.1, it is considered that the judgment matrix has satisfactory consistency and the data can be used. A total of five experts’ judgment matrices passed the test.
Finally, the data of the above five experts who passed the consistency test were processed to form the group decision results. We assigned equal weights to each expert and calculated the geometric weighted average of the expert weights. Thus, the weight values of each index in the evaluation system of the comprehensive strength coefficient of the enterprise are derived. The results are shown in Table 9.

5.2. Income Distribution Model

The calculation steps of the income distribution model with the comprehensive strength coefficient of the enterprise are as follows:
(1)
Use the Raiffa solution to calculate the initial income distribution. x i represents the initial income of the joint distribution for enterprise i . v N is the joint distribution income of all enterprises (there are n enterprises). b i represents the joint distribution income of the sub-alliance, excluding express enterprise i .
x i = v N n 2 n 3 2 n 1 1 n i = 1 n b i b i
(2)
Determine the weight of evaluation indexes and express delivery enterprises, respectively. Firstly, the weight θ j of each evaluation index for the target task is determined by using the analytic hierarchy process (AHP). Secondly, according to the actual situation of the enterprise, confirm the weight (proportion) B i j of the evaluation index for the enterprise. It should be noted that the indexes are divided into the qualitative index and quantitative index, efficiency index, and cost index. Therefore, it is necessary to consider the classification of indicators when calculating them.
(3)
Calculate the comprehensive strength coefficient of the enterprise. Using θ j and B i j , the comprehensive strength coefficient of the enterprise can be calculated and recorded as δ i . Among them, n refers to the number of enterprises participating in logistics resource sharing, and m refers to the number of evaluation indicators.
δ i = j = 1 m B i j θ j ,     i = 1 n δ i = 1
(4)
Calculate the income adjustment coefficient of the enterprise. Record it as Δ i , and the calculation formula is as follows.
Δ i = δ i 1 n ,     i = 1 n Δ i = 0
When Δ i > 0 , it indicates that the comprehensive strength of the enterprise is greater than the average of the enterprises participating in resource sharing, and compensation for its income distribution is required. When Δ i < 0 , the situation is reversed.
(5)
Calculate the final income distribution of the enterprise. The influence adjustment coefficient ε is added, which represents the influence degree of the enterprise’s comprehensive strength on the income distribution. Furthermore, ε is determined by the enterprises participating in the logistics resource sharing.
x i = x i + ε Δ i v N ,     ε 0 ,   1

5.3. A Case Study

This section continues to use Dongpo District of Meishan City, Sichuan Province as the research case. Based on the analysis of evolutionary game models, it can be concluded that enterprises with similar scales are more likely to achieve cooperation, and small enterprises are more likely to cooperate in logistics resource sharing. Therefore, according to the results of the cluster analysis in Section 4.1, we select YTO, Best, and STO for the case study. These three companies are relatively small in scale within the region, making them more likely to successfully implement logistics resource sharing. Assume that these three companies share logistics resources and conduct joint distribution in Dongpo District. We study the income distribution of the logistics alliance they built.
Assume that the income of these three companies for independent operation or joint delivery are shown in Table 10. Among them, the income of independent operation is calculated according to their 2019 financial report.
(1)
Use the Raiffa solution to calculate the initial income distribution
v N = 60 , 000 ;   n = 3 ;
When only Best and STO for joint distribution, their income b 1 = 25 , 000 ;
When only YTO and STO for joint distribution, their income b 2 = 35 , 000 ;
When only Best and YTO for joint distribution, their income b 3 = 30 , 000 .
Therefore, the initial income distribution of YTO, Best, and STO is:
x 1 = 60 , 000 3 3 4 1 3 30 , 000 + 35 , 000 + 25 , 000 25 , 000 = 16 , 250
x 2 = 60 , 000 3 3 4 1 3 30 , 000 + 35 , 000 + 25 , 000 35 , 000 = 23 , 750
x 3 = 60 , 000 3 3 4 1 3 30 , 000 + 35 , 000 + 25 , 000 30 , 000 = 20 , 000
(2)
Determine the weight of evaluation indexes and express delivery enterprises.
First, we classify the indicators. In this model, the secondary indicators are all quantitative indicators. Among them, delivery complaint rate, average delivery time, and delivery delay rate are cost indicators, and the rest are efficiency indicators.
The weight of quantitative indicators can be calculated by the proportion of enterprises in alliance resources. Among them, the number of courier outlets, courier personnel, and delivery vehicles refers to the survey results (Table 4). The delivery complaint rate refers to the “2019 Monthly Report on Post Consumer Complaints” issued by the China Post Bureau. The volume of express delivery refers to the company’s 2019 financial report. In addition, it is assumed that the enterprises contribute the same amount of funds when they cooperate. The calculation formula for the express delivery volume of enterprises in Dongpo District is:
The Express delivery volume of enterprises in Dongpo District = 2019 China express delivery volume × 2.82% × 1%
Next, it is difficult to find direct data on average delivery complaint rate, average delivery time, and delivery delay rate. Therefore, the expert scoring method is used to determine the index weight. According to the “2019 Express Service Satisfaction Survey and Time Limit Punctuality Test Report” issued by the Post Bureau, we can know the rankings of these three companies’ relevant indicators and then estimate their weights. Specifically, for cost indicators, the larger the value, the smaller the indicator weight.
The indicators were processed separately to obtain the weights of each enterprise under the evaluation indicators. The results are shown in Table 11.
(3)
Calculate the comprehensive strength coefficient of the enterprise
Combined with Table 8 and Table 10, we can obtain the index weights in the evaluation system for the comprehensive strength coefficient of the enterprise. We use Formula (30) to calculate the comprehensive strength coefficient of the enterprise.
YTO: δ 1 = j = 1 9 B 1 j θ j = 0.285
Best: δ 2 = j = 1 9 B 2 j θ j = 0.425
STO: δ 3 = j = 1 9 B 3 j θ j = 0.290
There are: δ 1 + δ 2 + δ 3 = 1
(4)
Calculate the income adjustment coefficient of the enterprise
In this case, a total of three companies participated in logistics sharing of urban terminal distribution. Therefore, the average comprehensive strength coefficient of the logistics alliance is 1/3.
YTO: Δ 1 = δ 1 1 3 = 0.285 1 3 = 0.048
Best: Δ 2 = δ 2 1 3 = 0.425 1 3 = 0.092
STO: Δ 3 = δ 3 1 3 = 0.290 1 3 = 0.044
There are: Δ 1 + Δ 2 + Δ 3 = 0
(5)
Calculate the final income distribution of the enterprise
Assume the adjustment coefficient is 0.5. According to Equation (32), we can calculate the final income distribution of the enterprises.
YTO: x 1 = x 1 + ε Δ 1 v N = 16 , 250 + 0.5 × 0.048 × 60 , 000 = 14 , 810
Best: x 2 = x 2 + ε Δ 2 v N = 23 , 750 + 0.5 × 0.092 × 60 , 000 = 26 , 510
STO: x 3 = x 3 + ε Δ 3 v N = 20 , 000 + 0.5 × 0.044 × 60 , 000 = 18 , 680
According to the calculation results, we can know that in the alliance, STO and YTO have low contribution to the express alliance and need to reduce their income distribution. In the logistics alliance, the strength of Best is higher than the average level, so it needs to increase its income distribution.

6. Conclusions

This study provides insight into the dynamic evolution of logistics sharing decisions among express delivery companies. We focus on the horizontal cooperation of express delivery companies in last-mile delivery, considering the influence of enterprise scale, income distribution coefficient, and default penalty coefficient. A symmetric evolutionary game model and an asymmetric evolutionary game model of logistics resource sharing are constructed, and the influence of each factor on the evolutionary outcome is studied. Then, a simulation study of the actual case is conducted to verify the validity of the model. Secondly, this paper optimizes the Raiffa model according to the conclusions obtained from the evolutionary model to consider the influence of enterprise scale on income distribution. Furthermore, we propose an income distribution method that introduces an enterprise’s comprehensive strength coefficient. Moreover, we obtain some managerial insights for the stakeholders regarding the last-mile logistics resource sharing, such as the government and express delivery companies. The main conclusions and recommendations are as follows:
(1)
The initial cooperation intention of the enterprise will affect the game results. Cooperation is easy to achieve only when enterprises have a relatively obvious tendency to cooperate. Therefore, the realization of joint distribution requires the government and society to guide enterprises to participate in resource sharing from several aspects and to enhance their cooperation awareness.
(2)
Smaller express delivery companies are more willing to participate in logistics sharing and joint distribution. The logistics industry is characterized by significant economies of scale. Therefore, shared logistics resources are highly attractive to small enterprises. In practice, resource sharing alliances can be established among smaller enterprises. For large enterprises, it is necessary to take measures to increase their sense of cooperation.
(3)
Cooperation between express delivery companies of similar scales is more likely to be achieved. If the difference in the scales of the enterprises is too large, it will increase the difficulty of unified management of the express alliance, causing unbalanced growth of the income of the alliance enterprises, which will lead to various non-cooperative behaviors and affect the effectiveness of cooperation. Therefore, it is recommended that logistics resources be shared among enterprises of a similar scale. When the scales of enterprises in the alliance are uneven, it is necessary to anticipate the above problems and to develop rules to avoid them.
(4)
The scale of the enterprise should be considered when the logistics alliance makes income allocation. The optimal income distribution coefficient of an enterprise is positively related to its scale. The difference between enterprises’ scales implies that the enterprises contribute differently to joint distribution.
(5)
Establishing a suitable penalty mechanism for breach of contract is conducive to promoting the sharing of logistics resources among enterprises. Penalties for breach of contract can improve participants’ trust in cooperation and reduce risks. When establishing a logistics alliance, the normal operation of cooperation can be ensured by formulating an appropriate penalty mechanism for breach of contract.
For future research, we consider the following possible directions for improvement. First, the logistics sharing decisions of courier enterprises may be influenced by various practical conditions. In addition to the considerations incorporated in the current model, the degree of interdependence of enterprises, the risk preferences of enterprises, and other factors may have an impact. Second, some third parties may play important roles in the horizontal cooperation of courier enterprises. For example, the government can promote cooperation by formulating appropriate policies. The current model does not consider the role of third parties. Third, this paper proposes a new income distribution method by introducing the comprehensive enterprise strength coefficient. AHP and an expert scoring method are used to evaluate the comprehensive strength coefficients of enterprises. However, the expert scoring method is highly subjective and dependent on the scenario, which may affect the fairness of income distribution. In the future, this subjectivity can be eliminated by expanding the amount of data or exploring other methods.

Author Contributions

Conceptualization, Z.C. and J.K.; methodology, Z.C. and J.K.; validation, Z.C. and J.K.; formal analysis, Z.C.; investigation, Z.C.; resources, J.K.; writing—original draft preparation, Z.C. and J.K.; writing—review and editing, Z.C. and J.K.; supervision, J.K.; project administration, J.K. and Z.C.; funding acquisition, J.K. All authors have read and agreed to the published version of the manuscript.

Funding

This research was funded by the Humanities and Social Science Youth foundation of Ministry of Education of China, grant number 20YJC630054.

Institutional Review Board Statement

Not applicable.

Informed Consent Statement

Not applicable.

Data Availability Statement

Not applicable.

Conflicts of Interest

The authors declare no conflict of interest.

References

  1. Aized, T.; Srai, J.S. Hierarchical modelling of Last Mile logistic distribution system. Int. J. Adv. Manuf. Technol. 2013, 70, 1053–1061. [Google Scholar] [CrossRef]
  2. Counsell, C.; Dennis, M.; McDowall, M. Predicting functional outcome in acute stroke: Comparison of a simple six variable model with other predictive systems and informal clinical prediction. J. Neurol. Neurosurg. Psychiatry 2004, 75, 401–405. [Google Scholar] [CrossRef] [PubMed]
  3. Neghabadi, P.D.; Samuel, K.E.; Espinouse, M.-L. Systematic literature review on city logistics: Overview, classification and analysis. Int. J. Prod. Res. 2018, 57, 865–887. [Google Scholar] [CrossRef]
  4. Rivera, L.; Sheffi, Y.; Knoppen, D. Logistics clusters: The impact of further agglomeration, training and firm size on collaboration and value added services. Int. J. Prod. Econ. 2016, 179, 285–294. [Google Scholar] [CrossRef]
  5. Wang, X.; Kopfer, H. Collaborative transportation planning of less-than-truckload freight. OR Spectr. 2013, 36, 357–380. [Google Scholar] [CrossRef]
  6. Yao, X.; Cheng, Y.; Song, M. Assessment of collaboration in city logistics: From the aspects of profit and CO2 emissions. Int. J. Logist. Res. Appl. 2018, 22, 576–591. [Google Scholar] [CrossRef]
  7. Gansterer, M.; Hartl, R.F.; Wieser, S. Assignment constraints in shared transportation services. Ann. Oper. Res. 2020, 305, 513–539. [Google Scholar] [CrossRef]
  8. Daudi, M.; Hauge, J.B.; Thoben, K.-D. Behavioral factors influencing partner trust in logistics collaboration: A review. Logist. Res. 2016, 9, 1–11. [Google Scholar] [CrossRef]
  9. Rodrigues, V.S.; Harris, I.; Mason, R. Horizontal logistics collaboration for enhanced supply chain performance: An international retail perspective. Supply Chain Manag. Int. J. 2015, 20, 631–647. [Google Scholar] [CrossRef]
  10. Smith, J.M.; Price, G.R. The Logic of Animal Conflict. Nature 1973, 246, 15–18. [Google Scholar] [CrossRef]
  11. Taylor, P.D.; Jonker, L.B. Evolutionary stable strategies and game dynamics. Math. Biosci. 1978, 40, 145–156. [Google Scholar] [CrossRef]
  12. Arifovic, J.; Jiang, J.H.; Xu, Y. Experimental evidence of bank runs as pure coordination failures. J. Econ. Dyn. Control. 2013, 37, 2446–2465. [Google Scholar] [CrossRef]
  13. Hosseini-Motlagh, S.-M.; Johari, M.; Zirakpourdehkordi, R. Grain production management to reduce global warming potential under financial constraints and time value of money using evolutionary game theory. Int. J. Prod. Res. 2020, 59, 5108–5129. [Google Scholar] [CrossRef]
  14. Barari, S.; Agarwal, G.; Zhang, W.; Mahanty, B.; Tiwari, M. A decision framework for the analysis of green supply chain contracts: An evolutionary game approach. Expert Syst. Appl. 2012, 39, 2965–2976. [Google Scholar] [CrossRef]
  15. Sofitra, M.; Takahashi, K.; Morikawa, K. The coevolution of interconnected relationship strategies in supply networks. Int. J. Prod. Res. 2014, 53, 6919–6936. [Google Scholar] [CrossRef]
  16. Wang, D.; Lang, M.; Sun, Y. Evolutionary Game Analysis of Co-opetition Relationship between Regional Logistics Nodes. J. Appl. Res. Technol. 2014, 12, 251–260. [Google Scholar] [CrossRef]
  17. Zhang, X.; Zhou, G.; Cao, J.; Wu, A. Evolving strategies of e-commerce and express delivery enterprises with public supervision. Res. Transp. Econ. 2020, 80, 100810. [Google Scholar] [CrossRef]
  18. Zhou, L.; Chen, Y.; Jing, Y.; Jiang, Y. Evolutionary Game Analysis on Last Mile Delivery Resource Integration—Exploring the Behavioral Strategies between Logistics Service Providers, Property Service Companies and Customers. Sustainability 2021, 13, 12240. [Google Scholar] [CrossRef]
  19. Li, G.; Zhang, Q.; Bai, Z.; Sabeeh, P. Research on Logistics Service Supply Chain Information Sharing Mechanism in the Belt and Road Initiative. IEEE Access 2020, 8, 189684–189701. [Google Scholar] [CrossRef]
  20. Wang, H.; Chen, L.; Liu, J. An evolutionary game theory analysis linking manufacturing, logistics, and the government in low-carbon development. J. Oper. Res. Soc. 2021, 73, 1014–1032. [Google Scholar] [CrossRef]
  21. Han, R.; Yang, M. Profit distribution and stability analysis of joint distribution alliance based on tripartite evolutionary game theory under the background of green and low carbon. Environ. Sci. Pollut. Res. 2022, 29, 59633–59652. [Google Scholar] [CrossRef] [PubMed]
  22. Xing, X.-H.; Hu, Z.-H.; Wang, S.-W.; Luo, W.-P. An Evolutionary Game Model to Study Manufacturers and Logistics Companies’ Behavior Strategies for Information Transparency in Cold Chains. Math. Probl. Eng. 2020, 2020, 7989386. [Google Scholar] [CrossRef]
  23. Xing, X.-H.; Hu, Z.-H.; Luo, W.-P. Using evolutionary game theory to study governments and logistics companies’ strategies for avoiding broken cold chains. Ann. Oper. Res. 2020. [Google Scholar] [CrossRef]
  24. Liu, P.; Wang, S. Logistics Outsourcing of Fresh Enterprises Considering Fresh-Keeping Efforts Based on Evolutionary Game Analysis. IEEE Access 2021, 9, 25659–25670. [Google Scholar] [CrossRef]
  25. Lozano, S.; Moreno, P.; Adenso-Díaz, B.; Algaba, E. Cooperative game theory approach to allocating benefits of horizontal cooperation. Eur. J. Oper. Res. 2013, 229, 444–452. [Google Scholar] [CrossRef]
  26. Lu, F.; Wang, L.; Bi, H.; Du, Z.; Wang, S. An Improved Revenue Distribution Model for Logistics Service Supply Chain Considering Fairness Preference. Sustainability 2021, 13, 6711. [Google Scholar] [CrossRef]
  27. Kimms, A.; Kozeletskyi, I. Core-based cost allocation in the cooperative traveling salesman problem. Eur. J. Oper. Res. 2016, 248, 910–916. [Google Scholar] [CrossRef]
  28. Wang, Y.; Ma, X.; Liu, M.; Gong, K.; Liu, Y.; Xu, M.; Wang, Y. Cooperation and profit allocation in two-echelon logistics joint distribution network optimization. Appl. Soft Comput. 2017, 56, 143–157. [Google Scholar] [CrossRef]
  29. Li, L.; Wang, X.; Lin, Y.; Zhou, F.; Chen, S. Cooperative game-based profit allocation for joint distribution alliance under online shopping environment. Asia Pac. J. Mark. Logist. 2019, 31, 302–326. [Google Scholar] [CrossRef]
  30. Song, J.; Ma, X.; Chen, R. A Profit Distribution Model of Reverse Logistics Based on Fuzzy DEA Efficiency—Modified Shapley Value. Sustainability 2021, 13, 7354. [Google Scholar] [CrossRef]
  31. Kou, X.; Zhang, Y.; Long, D.; Liu, X.; Qie, L. An Investigation of Multimodal Transport for Last Mile Delivery in Rural Areas. Sustainability 2022, 14, 1291. [Google Scholar] [CrossRef]
  32. Zhou, H.Y.; Zhou, X.G.; Yang, M.K.; Fan, J.J. A Cost Amortization Model for Urban Joint Distribution Based on Raiffa Solution. Logist. Technol. 2017, 36, 104–132. [Google Scholar]
  33. Jiao, Z.L.; Ma, J.Y.; Liu, B.L. Cooperative Revenue Distribution of Manufacturing Logistics Provided by Express Companies: Analysis by Corrected Raiffa Solution Model. J. Bus. Econ. 2020, 40, 18–27. [Google Scholar]
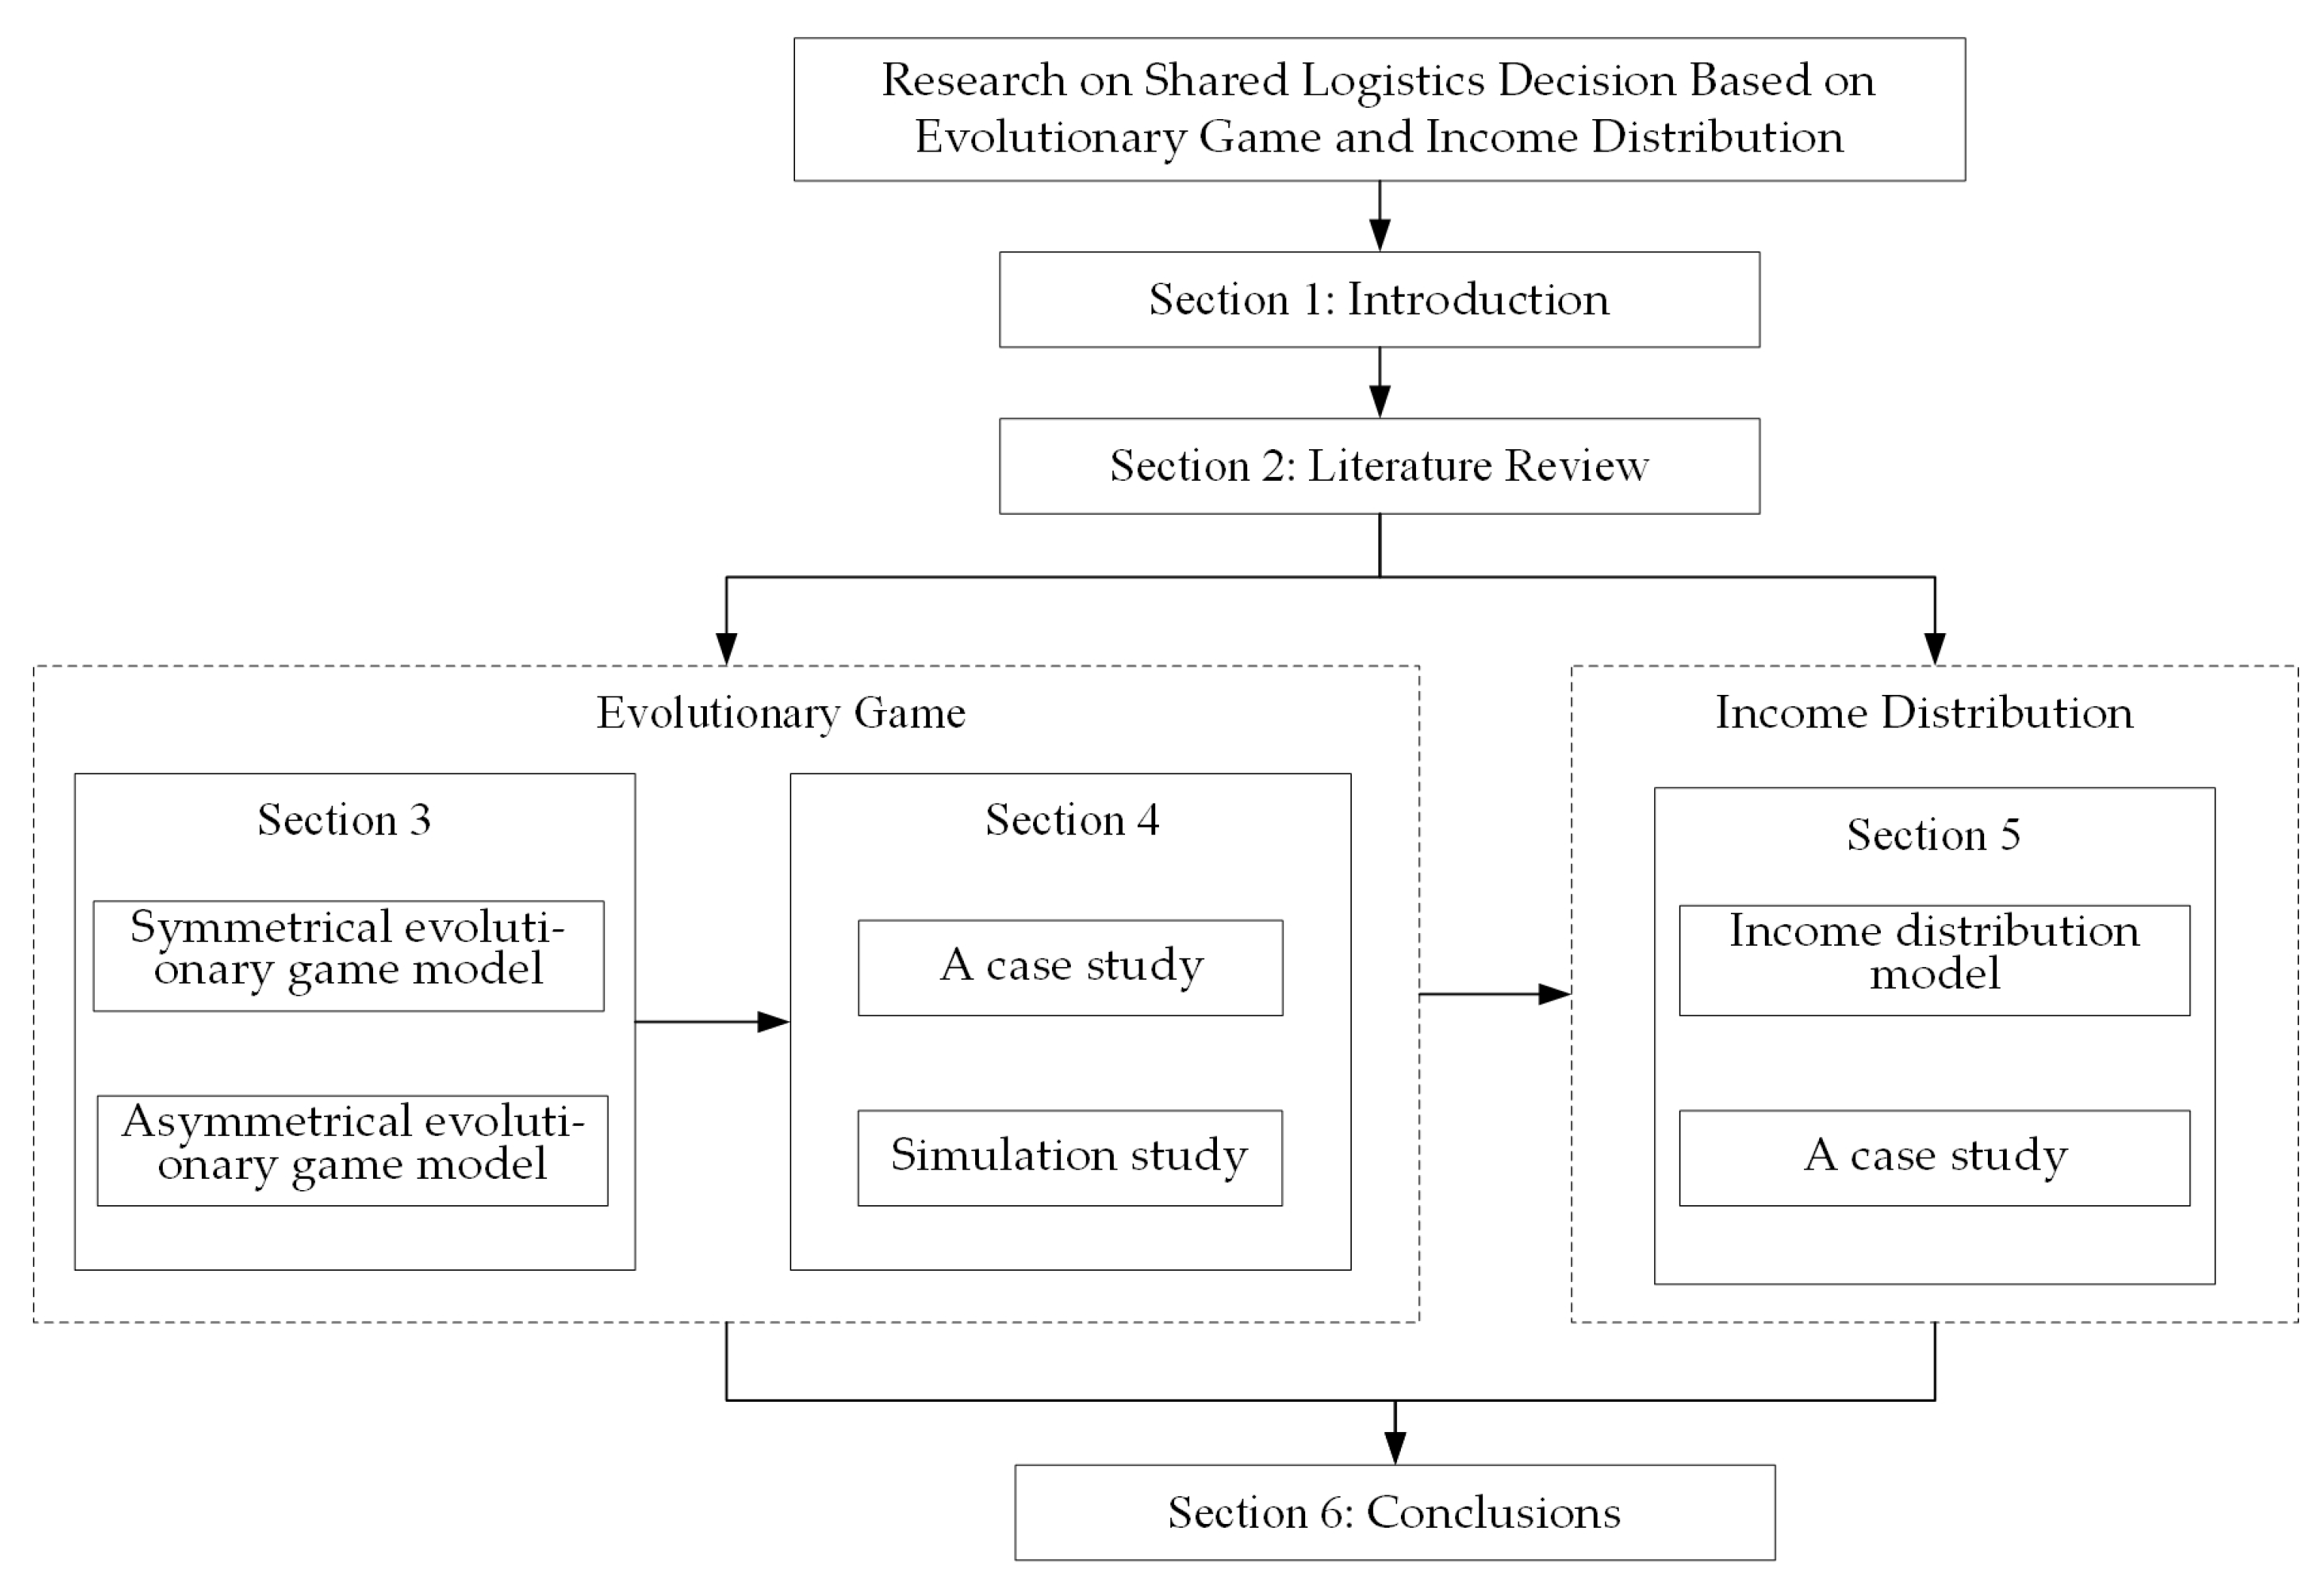
Figure 1. The framework of the paper.
Sustainability 15 08621 g001
Figure 3. Changing trends of express delivery company dynamic evolution in the asymmetrical evolutionary game.
Sustainability 15 08621 g003
Figure 4. The simulation results when the enterprise strength changes.
Sustainability 15 08621 g004
Figure 5. The simulation results when the joint distribution income changes.
Sustainability 15 08621 g005
Figure 6. The simulation results when the profit distribution coefficient changes.
Sustainability 15 08621 g006
Figure 7. The simulation results when the default penalty coefficient changes.
Sustainability 15 08621 g007
Figure 8. Evaluation system of enterprise comprehensive strength coefficient.
Sustainability 15 08621 g008
Table 1. Variable selection and description.
VariableDescription
I i i = a , b When choosing cooperation, the input cost of joint distribution for player i
R i i = a , b When choosing competition, the profit of player i operating independently
r i i = a , b When choosing cooperation, the income distribution coefficient of joint distribution for player i ,   0 < r i < 1
W When choosing cooperation, the income of joint distribution for player i
e When choosing competition, the penalty coefficient of player i   default ,   0   <   e <   1 ,   e I b     <   I a ,   e I a   <   I b .
Table 2. The payoff matrix of symmetrical evolutionary games.
Player B
x1−x
CooperationCompetition
Player AxCooperation r W I , r W I R I + e I , R e I
1−xCompetition R e I , R I + e I R , R
Table 3. The payoff matrix of asymmetrical evolutionary games.
Player B
y1−y
CooperationCompetition
Player AxCooperation r a W I a , r b W I b R a I a + e I b , R b e I b
1−xCompetition R a e I a , R b I b + e I a R a , R b
Table 4. Local stability analysis of the evolutionary game.
Conditions N b > M b , N a > M a N b > M b , N a < M a
Pointdet(J)tr(J)Stabilitydet(J)tr(J)Stability
(0,0)+ESS+ESS
(0,1) saddle point++unstable
(1,0) saddle point saddle point
(1,1)++unstable saddle point
( N b M b , N a M a )
Conditions N b < M b , N a > M a N b < M b , N a < M a
Pointdet(J)tr(J)Stabilitydet(J)tr(J)Stability
(0,0)+ESS+ESS
(0,1) saddle point++unstable
(1,0)++unstable++unstable
(1,1) saddle point+ESS
( N b M b , N a M a ) 0saddle point
Table 6. Independent operation profit (in 1000 CNY).
CompanyExpress RevenueExpress CostsExpress ProfitProfit in Dongpo
Zto19,606,21011,575,3818,030,8292264.7
YTO27,412,47124,107,6253,304,846932.0
Yunda31,964,13128,336,4343,627,6971023.0
Best21,807,59820,779,9921,027,606289.8
Sto22,942,60320,563,5522,379,051670.9
Table 7. The clustering results and clustering centers of the companies (in 1000 CNY).
CompanyClustering CategoryInput CostsIndependent Operation Profit
Zto17439.02264.7
YTO26272.0932.0
Yunda19628.01023.0
Best26929.5289.8
Sto24960.0670.9
category 1 center8533.51643.9
category 2 center6053.8630.9
Table 8. The parameter settings when the enterprise strength changes.
Game Subject r a r b e W I a I b R a R b
Large enterprises and large enterprises0.50.50.135,0008533.58533.51643.91643.9
Small enterprises and small enterprises35,0006053.86053.8630.9630.9
Large enterprises and small enterprises35,0008533.56053.81643.9630.9
Table 9. Index weights of comprehensive strength coefficient.
ElementsWeight Value
Rule layerResource capacity0.4500
Operational capacity0.5500
Index layerFunds0.2017
Number of courier personnel0.0610
Number of courier outlets0.1385
Number of delivery vehicles0.0488
Volume of express delivery0.1410
Average delivery time0.0614
Delivery delay rate0.0874
Service satisfaction0.1245
Delivery complaint rate0.1357
Table 10. Income of different distribution situations (in 1000 CNY).
EnterpriseIncome
YTO7730.3
Best6149.7
STO6469.8
YTO, Best30,000
YTO, STO35,000
Best, STO25,000
YTO, Best, STO60,000
Table 11. The weight of each index of the enterprise.
The Evaluation IndexYTOBestSTO
Resource capacityFunds0.330.340.33
Number of courier personnel0.350.380.27
Number of courier outlets0.280.420.30
Number of delivery vehicles0.390.350.26
Operational capacityVolume of express delivery0.380.310.31
Average delivery time0.150.760.09
Delivery delay rate0.140.620.24
Service satisfaction0.160.540.30
Order complaint rate0.330.340.33
Disclaimer/Publisher’s Note: The statements, opinions and data contained in all publications are solely those of the individual author(s) and contributor(s) and not of MDPI and/or the editor(s). MDPI and/or the editor(s) disclaim responsibility for any injury to people or property resulting from any ideas, methods, instructions or products referred to in the content.