Article

The Identification of Intersection Entrance Accidents Based on Autoencoder

Department of Transportation and Vehicle Engineering, Shandong University of Technology, Zibo 255000, China
*
Authors to whom correspondence should be addressed.
Sustainability 2023, 15(11), 8533; https://doi.org/10.3390/su15118533
Submission received: 26 March 2023 / Revised: 5 May 2023 / Accepted: 6 May 2023 / Published: 24 May 2023

Abstract

:
Traffic collisions are one of the leading causes of traffic congestion. In the case of urban intersections, traffic accidents can even result in widespread traffic paralysis. To solve this problem, we developed an autoencoder-based model for identifying intersection entrance accidents by analyzing the characteristics of traffic volume. The model uses the standard deviation of the intersection entrance lanes’ traffic volume as an input parameter and identifies intersection entrance accidents by comparing predicted data to actual measured data. In this paper, the detection rate and average detection time are chosen to evaluate the effectiveness of algorithms. The detection rate of the autoencoder model reaches 94.33%, 95.47%, and 81.64% during the morning peak, evening peak, and daylight off-peak periods, respectively. Compared to the support vector machine and the random forest, autoencoder has better performance. It is evident that the research presented in this paper can effectively enhance the detection effect and has a shorter detection time of intersection entrance accidents.

1. Introduction

The European Commission has proposed the Sustainable Urban Mobility Plan (SUMP), a strategic document designed to meet the demand for mobility whilst ensuring adequate quality of life for residents [1]. The objective of the SUMP is to improve urban quality of life by ensuring a safe, reliable, integrated, multi-modal, effective, and environment-friendly transport system [2]. If the idea of sustainable urban mobility is to be delivered, it must take account new techniques (ITS: Intelligent Transportation Systems) to solve traffic problems [3].
Traffic accidents waste a large amount of human and material resources and are considered a fundamental challenge to sustainable transportation [4]. Traffic accidents usually cause road congestion. According to reports, in some countries, the impact of congestion on welfare can reach up to 2% of national GDP [5], which is a concern among urban residents regarding transportation quality [6]. The 2011 European Commission White Paper pointed out that congestion will continue to bring a huge burden to society, and the cost of congestion is expected to increase by about 50% annually, reaching nearly $220 billion by 2050. Accurately and quickly identifying traffic accidents can reduce the number of stops for surrounding vehicles, which can help reduce traffic emissions. This is of great significance for sustainable development goals.
In a word, quickly identifying and handling traffic accidents is beneficial for alleviating congestion and promoting sustainable transportation development.
Traffic accidents can easily lead to traffic congestion, especially at urban intersections [7]. The intersection is a vital component of the urban transportation network. Here, vehicles frequently collide and traffic conflicts are common. Thus, it is a place where traffic accidents frequently occur [8]. According to global statistics, approximately 60% of urban road traffic accidents occur at intersections and nearby locations [9]. There were 163 traffic accidents in Zhangdian, Zibo, China on 1 December 2022. Furthermore, the proportion of traffic accidents at intersections has reached 61.35%. It can be found that more than half of traffic accidents occur at intersections. It is easy for such accidents to cause urban road network congestion and economic losses if they are not dealt with immediately.
Currently, in order to identify traffic accidents in a timely manner, traffic management departments rely primarily on manual detection. Manual detection technology has the benefits of convenience, economy, and directness; however, eyewitnesses are required at the time of the event, and its location is difficult to locate accurately. Event information must be recorded by specialized personnel, whose workload and intensity are substantial.
Researchers have studied automatic accident-detection technology to address this issue. It can identify accidents quickly and accurately without human involvement [10]. Therefore, it is preferable to respond quickly to an accident and minimize the resulting damage [11]. Until now, accident recognition methods can be divided into two categories: those based on image recognition and those based on traffic flow characteristic parameters.
The image-recognition-based method primarily tracks moving vehicles from video images [12]. To detect the vehicle, the Gaussian mixture model [13] and Mask R-CNN [14] were used to extract the foreground and background from the video. Otherwise, collisions are detected by the dispersion in the vehicles’ motion fields during impact [15]. It was proposed to use the Markov random field (MRF) algorithm [16] to identify traffic accidents in intersection traffic images. In order to overcome the limitations of single-camera detection, camera and radar detection data were integrated [17]. With the rapid development of computer vision, trajectory-based recognition methods have been developed [18]. For road intersections, a CCTV video-track-anomaly recognition method was proposed [19].
However, because a vehicle’s trajectory is not easily changed after entering the intersection approach, this method is less explanatory of intersection entrance accidents. In addition, these methods are restricted not only by lighting conditions and external weather, but also by equipment coverage. Consequently, accident identification is insufficiently exhaustive. The method based on the variation characteristics of traffic parameters originated from the California algorithm. The California algorithm identifies accidents based on the relative difference between upstream and downstream occupancy [20]. A number of improvements were made to the original California algorithm by later scholars, who also proposed ten additional algorithms. This type of algorithm can solve most accident identification issues involving continuous flow but finds it challenging to deal with the time series. In recent years, as machine learning [7] and deep learning [21] have continued to advance, researchers have investigated accident identification models with a higher detection rate. Widely employed classification models include logistic regression, support vector machine, decision trees, and neural networks. A hybrid model using logistic regression with a wavelet-based feature extraction [22] was developed to detect traffic incidents. Other machine-learning-based methods, such as decision trees [23], backpropagation neural network [24], stochastic gradient boosting [25], nearest neighbor model [26], and extreme machine learning [27], were also applied for the detection of traffic incidents. Support vector machine and probabilistic neural network were compared in order to detect accidents on Chicago’s Eisenhower expressway [28].
Due to its high detection accuracy and short detection time, the method based on the variation characteristics of traffic parameters is widely used in the accident identification of continuous-flow highways [29] and urban expressways. Using machine learning and deep learning algorithms, this method identifies accidents by primarily analyzing traffic volume, density, and speed data. However, urban intersection traffic flow is discontinuous. The relationship between traffic volume, density, and speed does not apply to intermittent flow. Consequently, this paper studies the pattern of traffic volume at the intersection’s entrance using data collected by the E-Police, reveals the accident’s impact mechanism, and establishes the accident identification model of the entrance through in-depth learning. This paper primarily addresses the following three issues:
  • How to obtain traffic volume data from the E-Police? What’s the impact of intersection entrance accidents on the traffic volume?
  • Based on the data detected by the E-Police, how can the autoencoder be used to identify accidents at intersection entrances?
  • Compared to other algorithms, what effect does this paper’s model have on accident identification?

2. Traffic Data Collection

2.1. Intersection Entrance Accidents

The accident studied in this paper is an accident that occurred within the widening and gradual widening sections of the intersection entrance. Its diagram is shown in Figure 1.
The main causes of intersection entrance accidents are as follows: (a) the driver misjudges the safe stopping sight distance of the vehicle, resulting in a rear-end collision; (b) the vehicle is scratched due to lane change or congestion; (c) the illegal opening of a commercial or non-commercial entrance at the entrance of the intersection leads to vehicle collision; and (d) the vehicle stops and starts repeatedly, resulting in vehicle performance degradation.

2.2. E-Police

With the rapid development of computer technology, the intelligence level of traffic-information-collection technology is constantly improving. The E-Police are widely deployed at urban intersections because of their wide coverage and large amounts of information [30]. They focus on the stop line and are used to capture all-day traffic violations, such as red-light-running behavior and illegal lane-changing behavior. At the same time, it can record the license plate number, passing time, driving direction, driving lane number, and other information of passing vehicles. The installation location of the E-Police is shown in Figure 2. At present, the passing information collected by the E-Police are uniformly stored in the network video recorder (NVR), which is the storage and forwarding part of the network video monitoring system and can be used to watch, browse, playback, manage, and store multiple network cameras. According to statistics, the passing data samples stored in the NVR can reach about 95% of the actual data, which can provide sufficient data support for this study.
The data recorded by the E-Police includes two forms: text and video. In the process of this research, this paper mainly analyzes text data and verifies the accuracy of text data by comparing video data. The information used in this paper mainly includes the license plate number, acquisition location, lane number, driving direction, and acquisition time in the text data. Data examples are shown in Table 1.

2.3. The Traffic Volume Characteristic

In the process of practical application, E-Police equipment can collect vehicle information from 1–3 lanes. The collection range of E-Police is shown in Figure 3. It can identify the lane of the vehicle according to the lane range delimitation standard. Based on E-Police equipment, this paper extracts flow information in different directions and lanes at 5-minute intervals. As shown in Table 2, traffic information is extracted from the intersection of Nanjing Rd and Renmin Rd based on E-Police equipment.
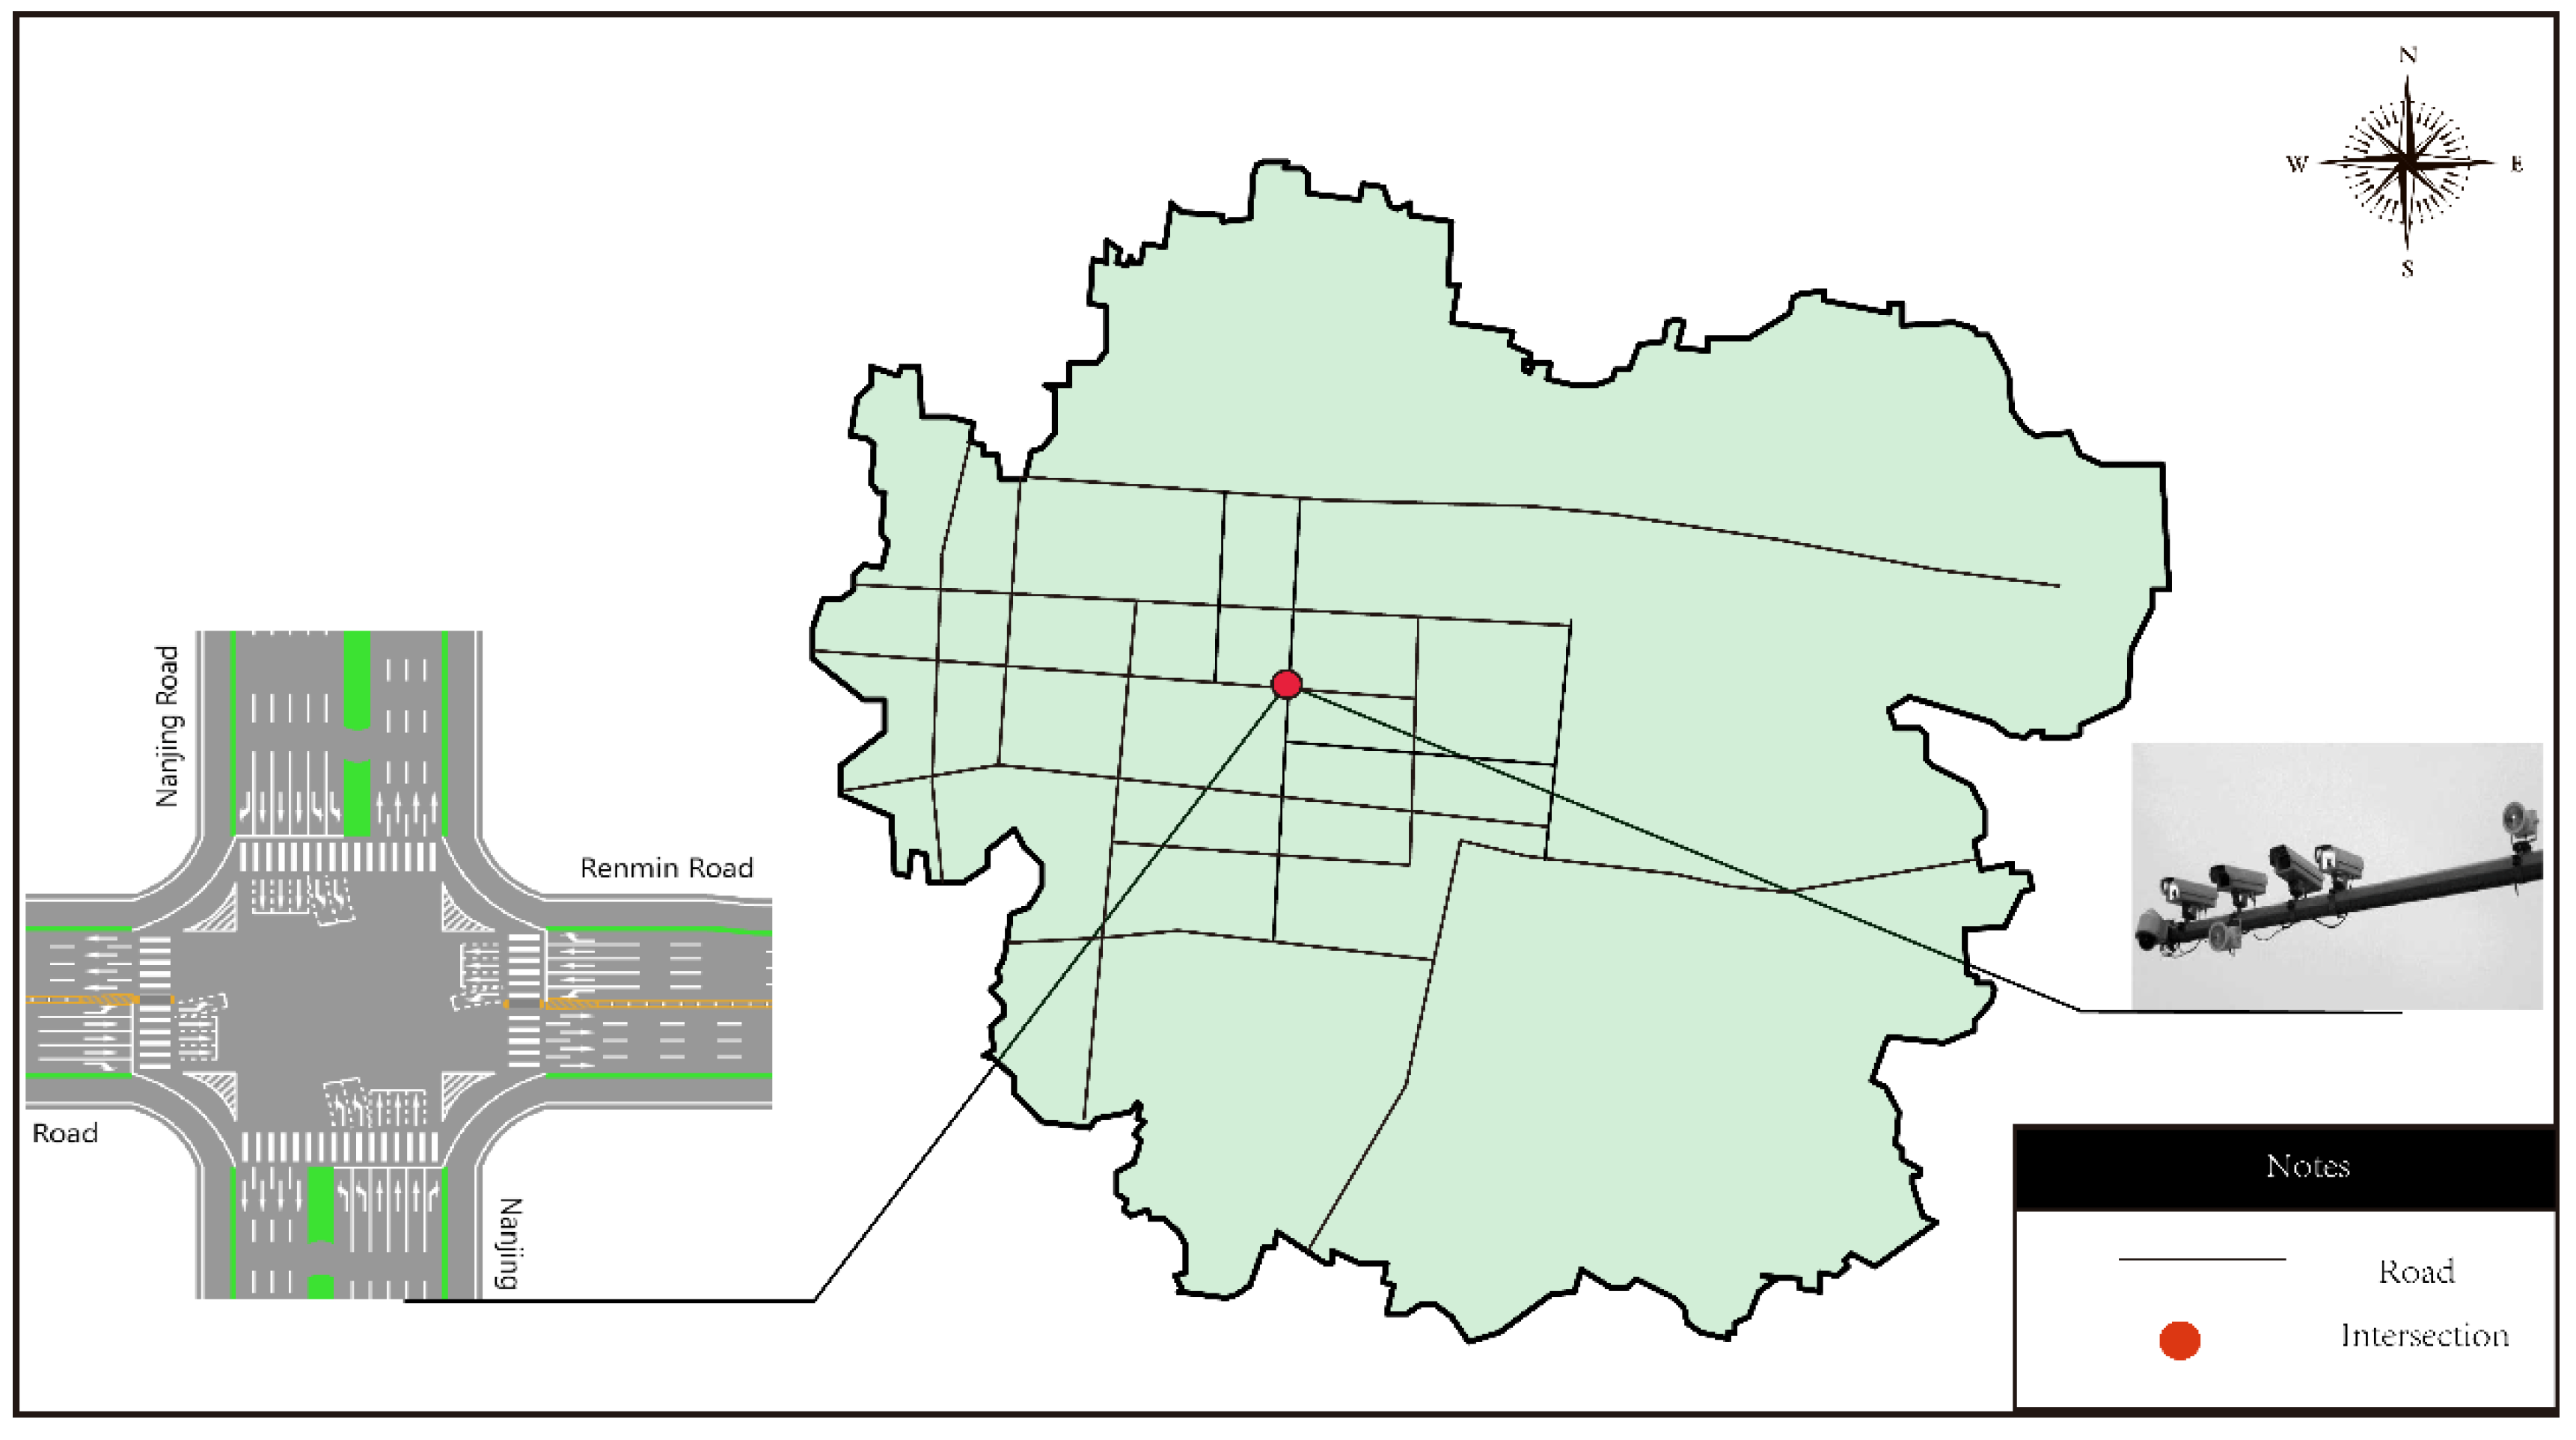
According to the traffic-volume-extraction method based on E-Police data, we analyzed the traffic volume of the accident days and non-accident days of the intersection in the central urban area of Zibo, China. In addition, the geographical location and geometry of the intersection are shown in Figure 4. There are no large hospitals, shopping malls, or other places around the intersection that attract large passenger flow. Therefore, its traffic volume variation characteristics are stable and suitable for analyzing traffic volume characteristics.
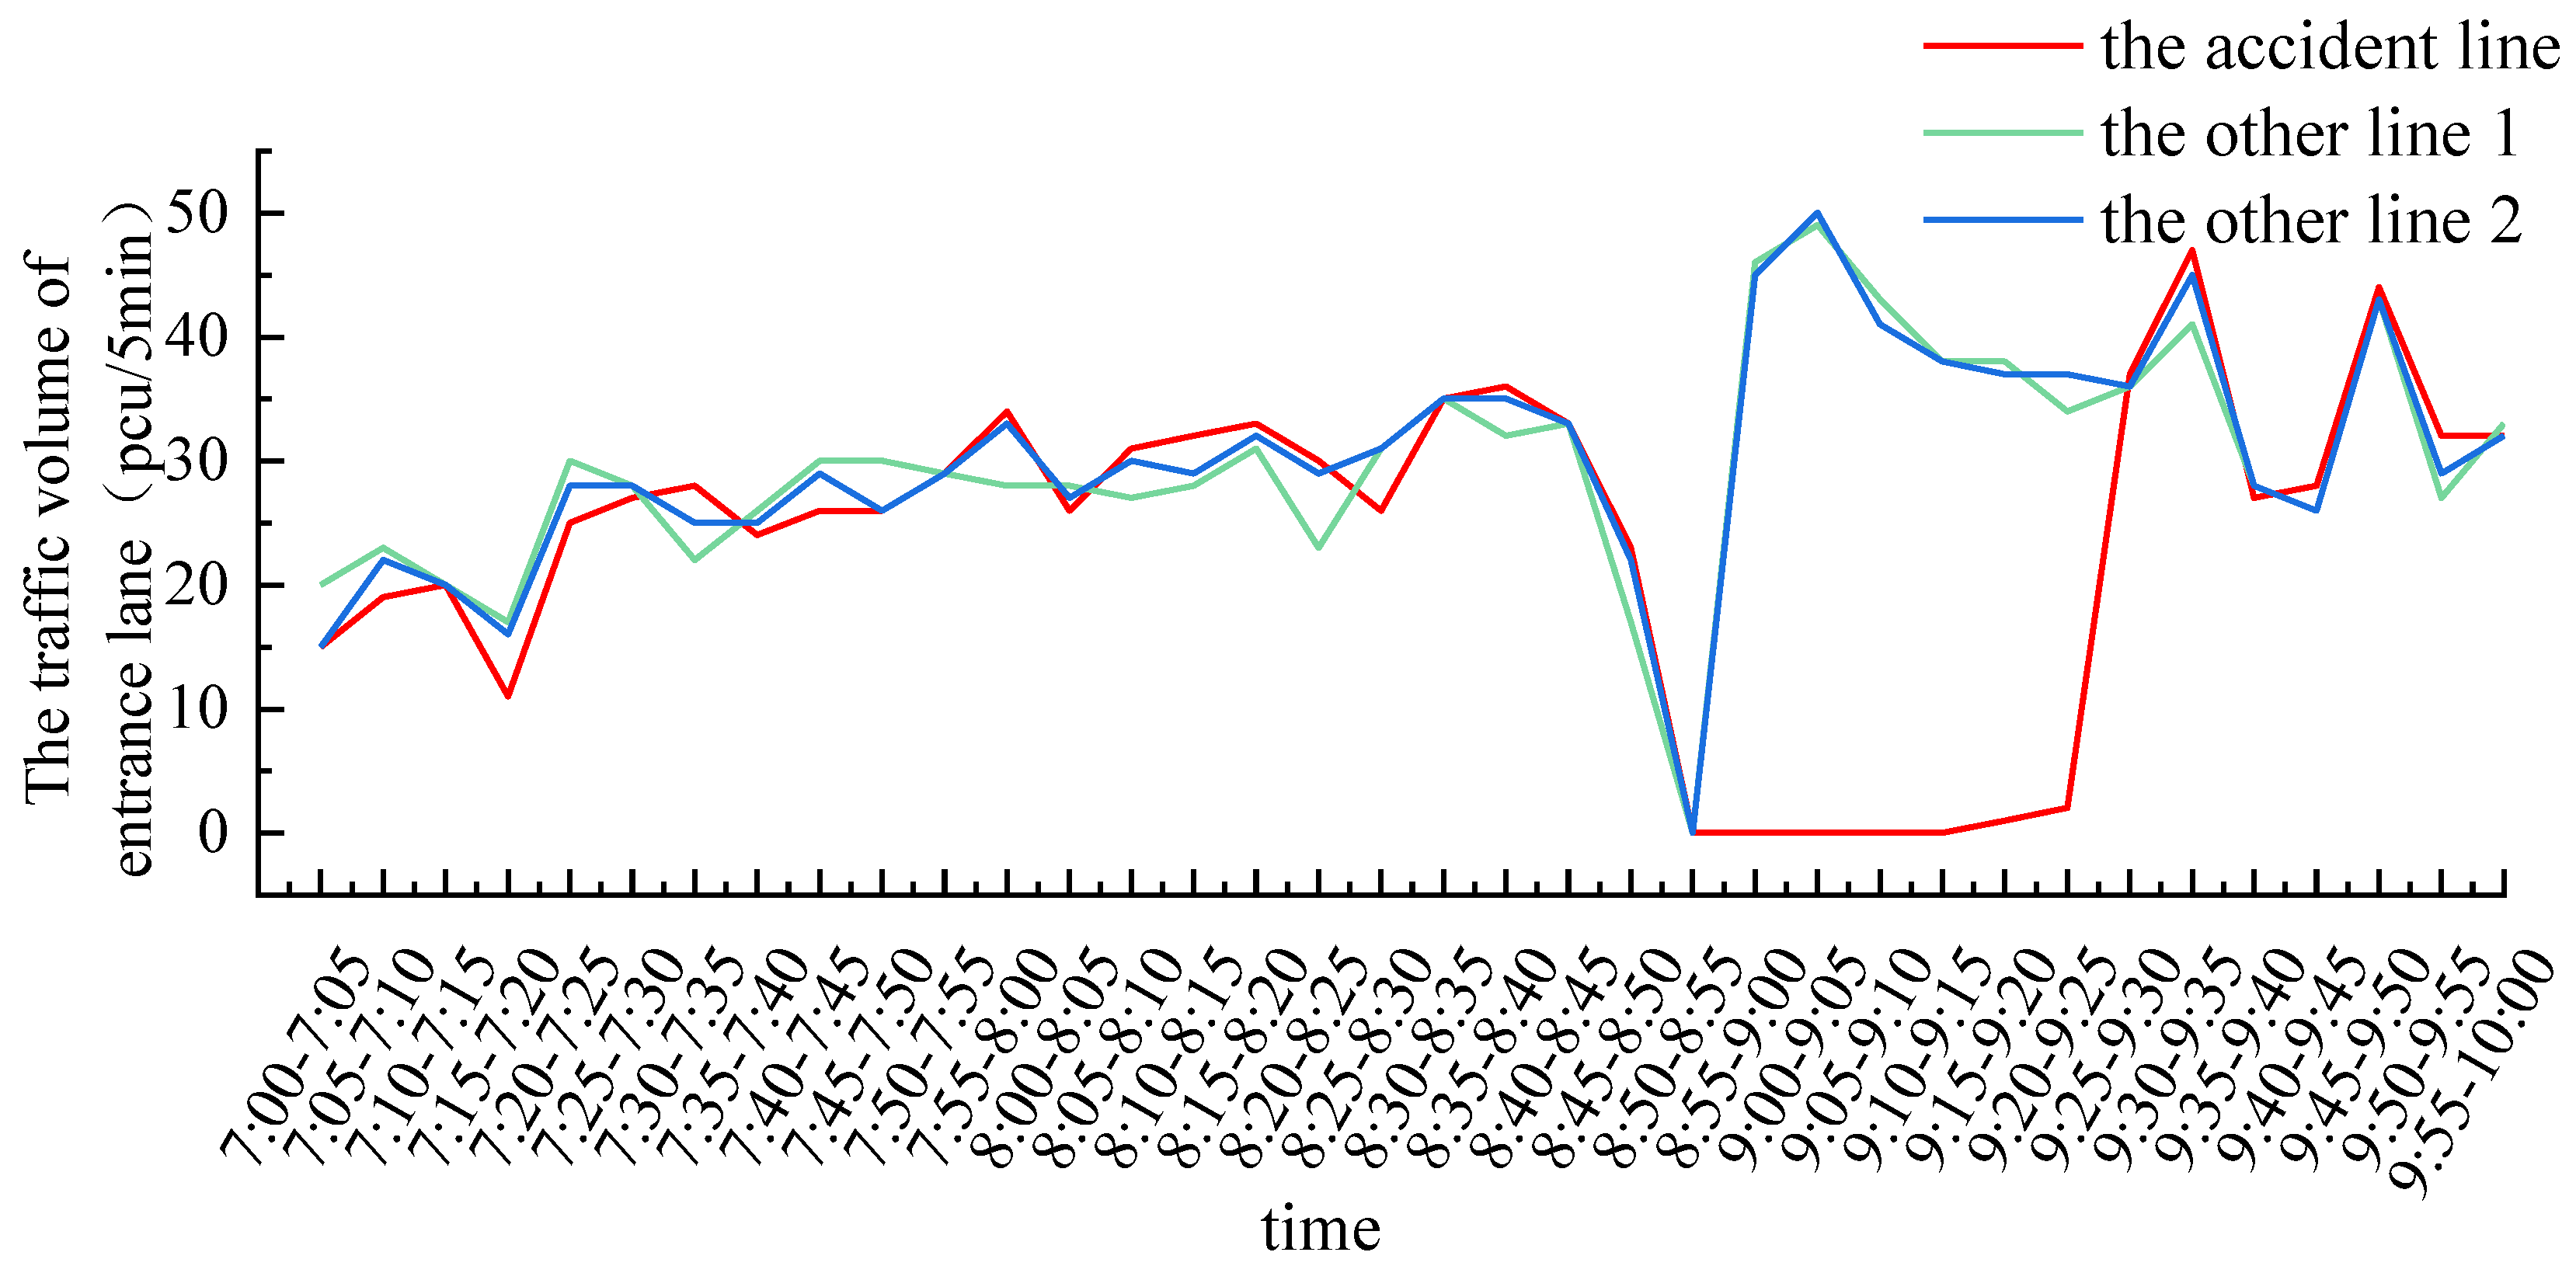
Figure 5 demonstrates that there are three lanes in a lane group at the entrance to the intersection. The traffic volume of the blocked lane within the duration of the accident is 0. However, to share the traffic pressure of the blocked lane, the traffic volume in other lanes increased to about 60%.
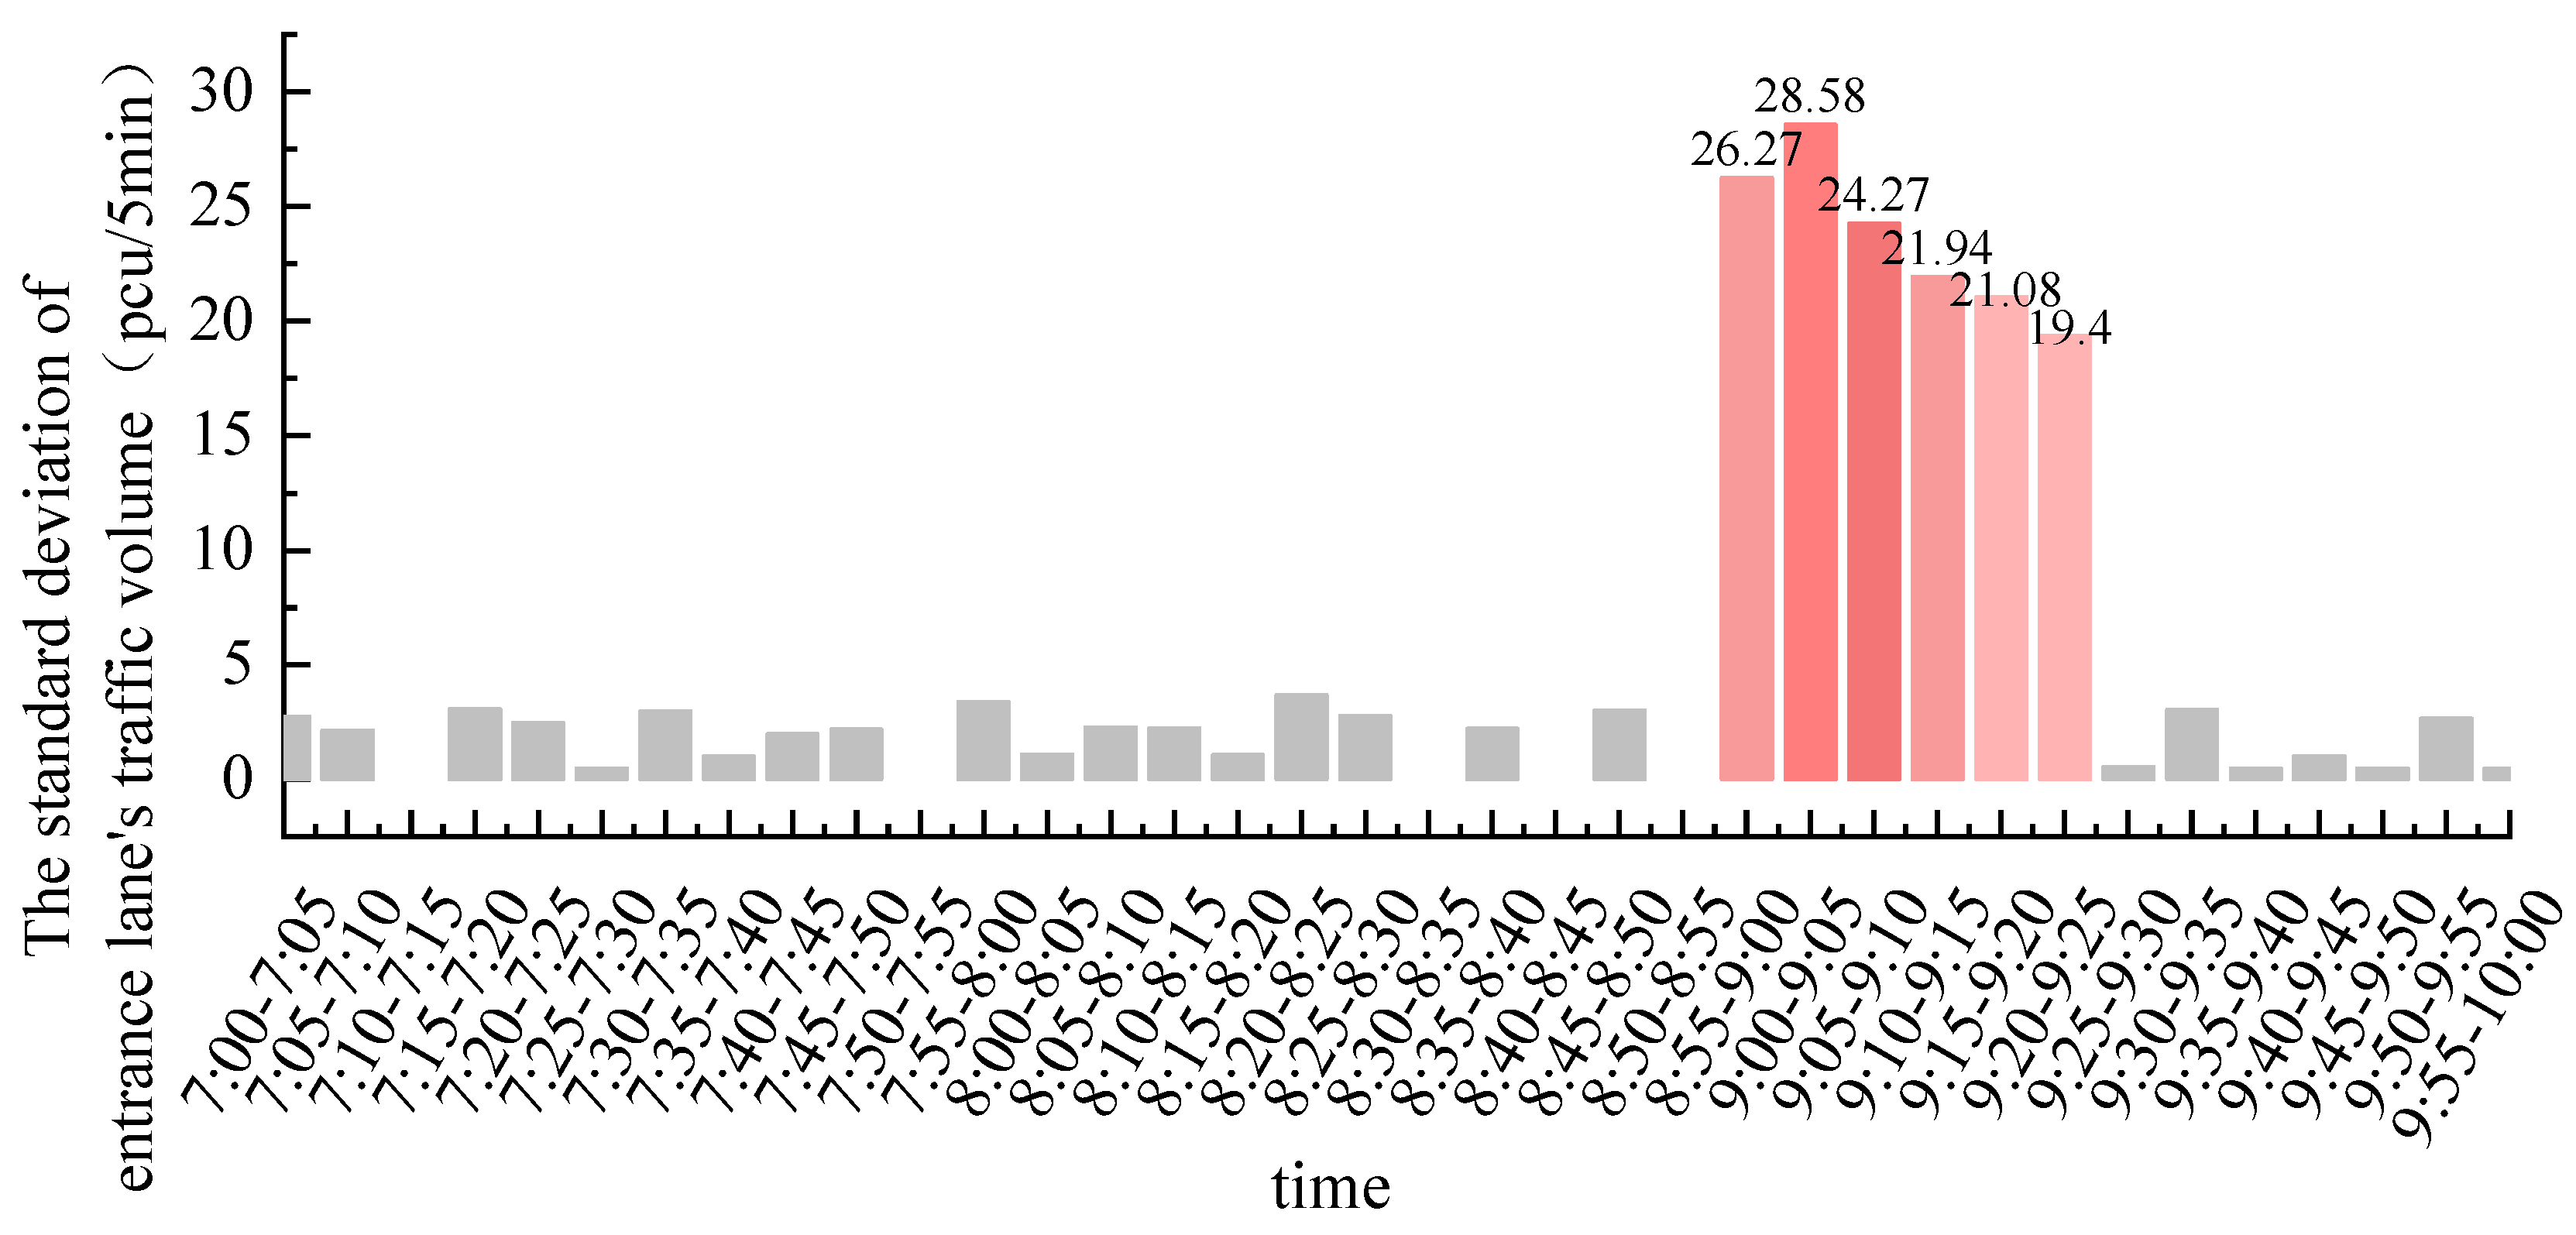
This range can be expressed by the standard deviation of entrance lanes’ traffic volume. Observing Figure 6, we can see that the maximum standard deviation of the entrance lanes’ traffic volume after the accident is 28.58 (pcu/5 min). However, under normal conditions, the traffic volume change trend in each lane is consistent, with a maximum standard deviation of 3.70 (pcu/5 min). Therefore, the standard deviation of the entrance lanes’ traffic volume can more accurately represent the accident impact mechanism.

3. Method

3.1. Intersection Entrance Accident Identification Process

Through the analysis in Section 2.3, we find that the standard deviation of the entrance lanes’ traffic volume can generally express the state characteristics before and after the accident. Therefore, we intend to develop a deep learning algorithm to identify entrance traffic accidents, with standard deviation as the input parameter.
In particular, the algorithm’s core consists of extracting standard deviation characteristics under normal traffic conditions via an encoder and reconstructing this feature vector via a decoder. The performance of the model is evaluated based on its ability to recreate input data.
The trained model demonstrates the following two results during the test:
  • If the test data are normal, the trained model has a strong ability to reconstruct the input data. Therefore, there is no structural difference between the reconstructed data and the input data.
  • If the test data are abnormal, the trained model has poor reconstruction ability for the input data. Consequently, there are significant differences between the reconstructed data and the input data. These variations may indicate potential for accidents.
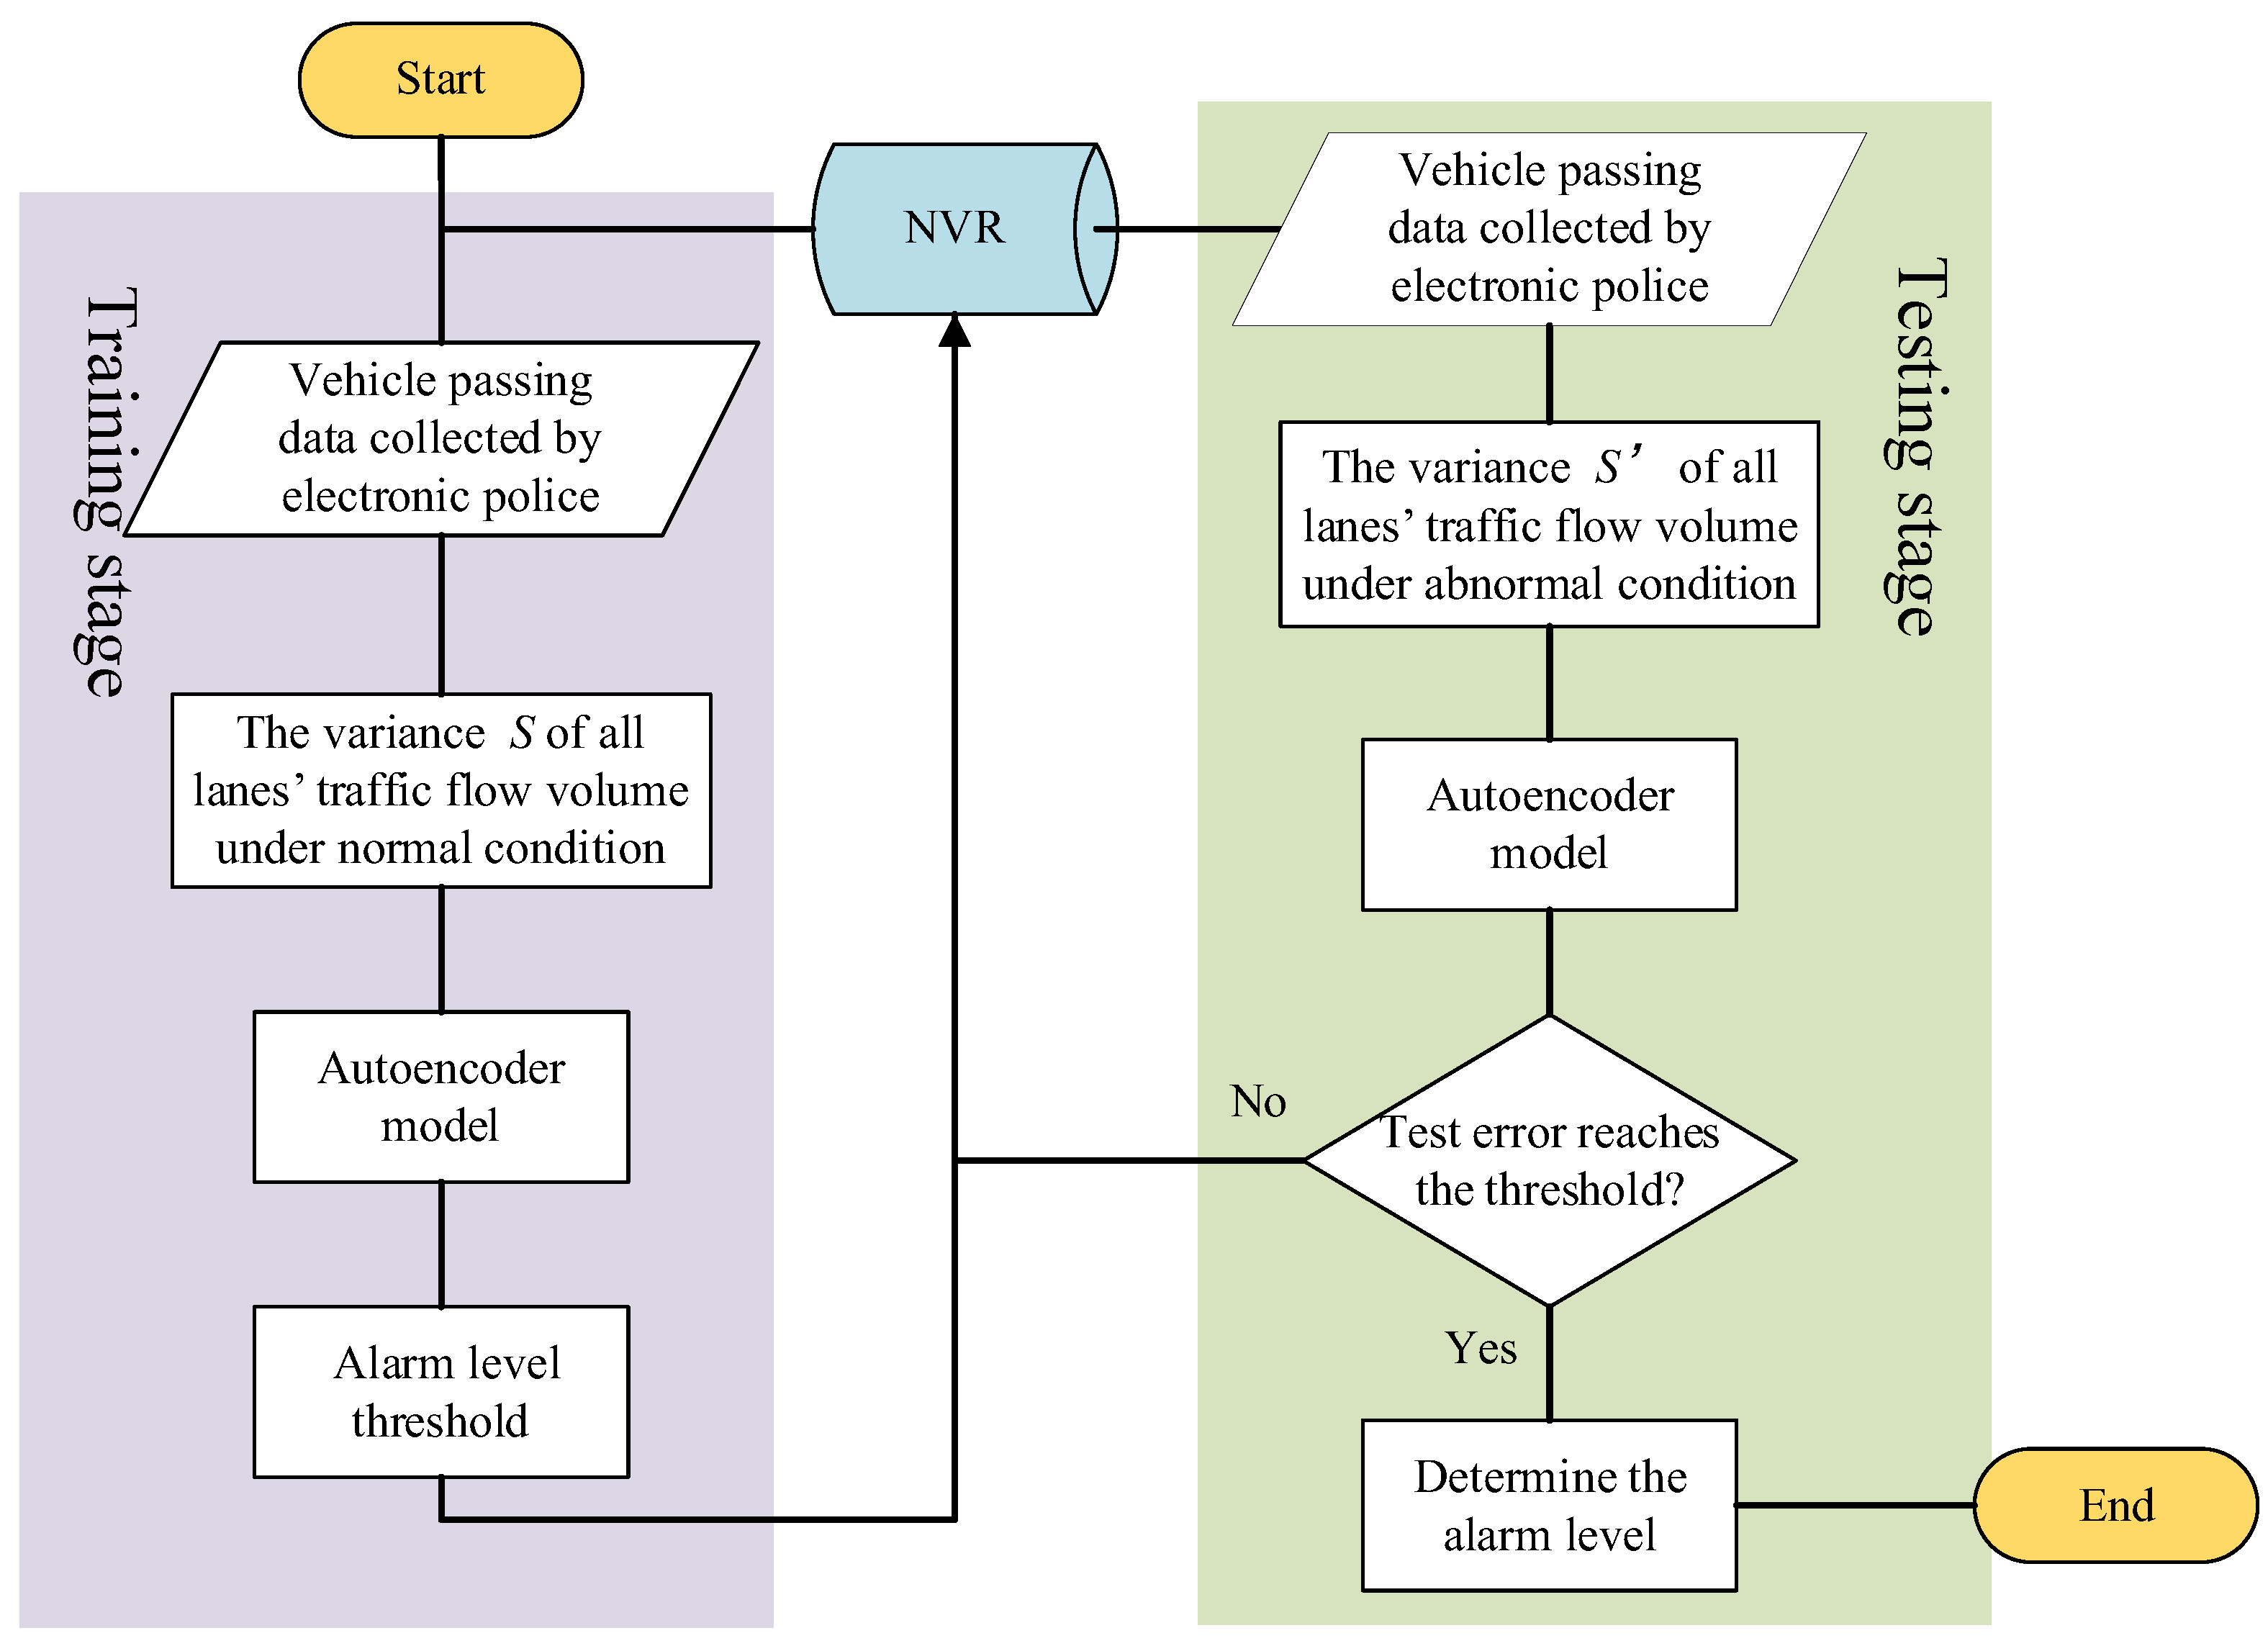
Autoencoders are utilized for accident detection, which is essentially a process of prediction from input data to reconstructed data. The specific procedure is depicted in Figure 7.
The algorithm shown in Figure 7 is implemented as follows:
  • Step 1: Extract the E-Police passing data stored in the network video recorder device.
  • Step 2: Calculate the standard deviation of entrance lanes’ traffic volume.
  • Step 3: Extract the standard deviation characteristics through the encoder.
  • Step 4: Use the decoder to reconstruct the feature vector.
  • Step 5: Calculate the mean square error between the reconstructed data and the input data.
  • Step 6: Determine the threshold value and identify the alarm level.
For the identification of entrance accidents, the following two tasks must be carried out: (a) Obtain the standard deviation of the entrance lanes’ traffic volume; (b) Identify the intersection entrance accident. In addition, we assume the entrance lanes’ traffic volume anomaly is caused by the entrance accident.

3.2. Autoencoder

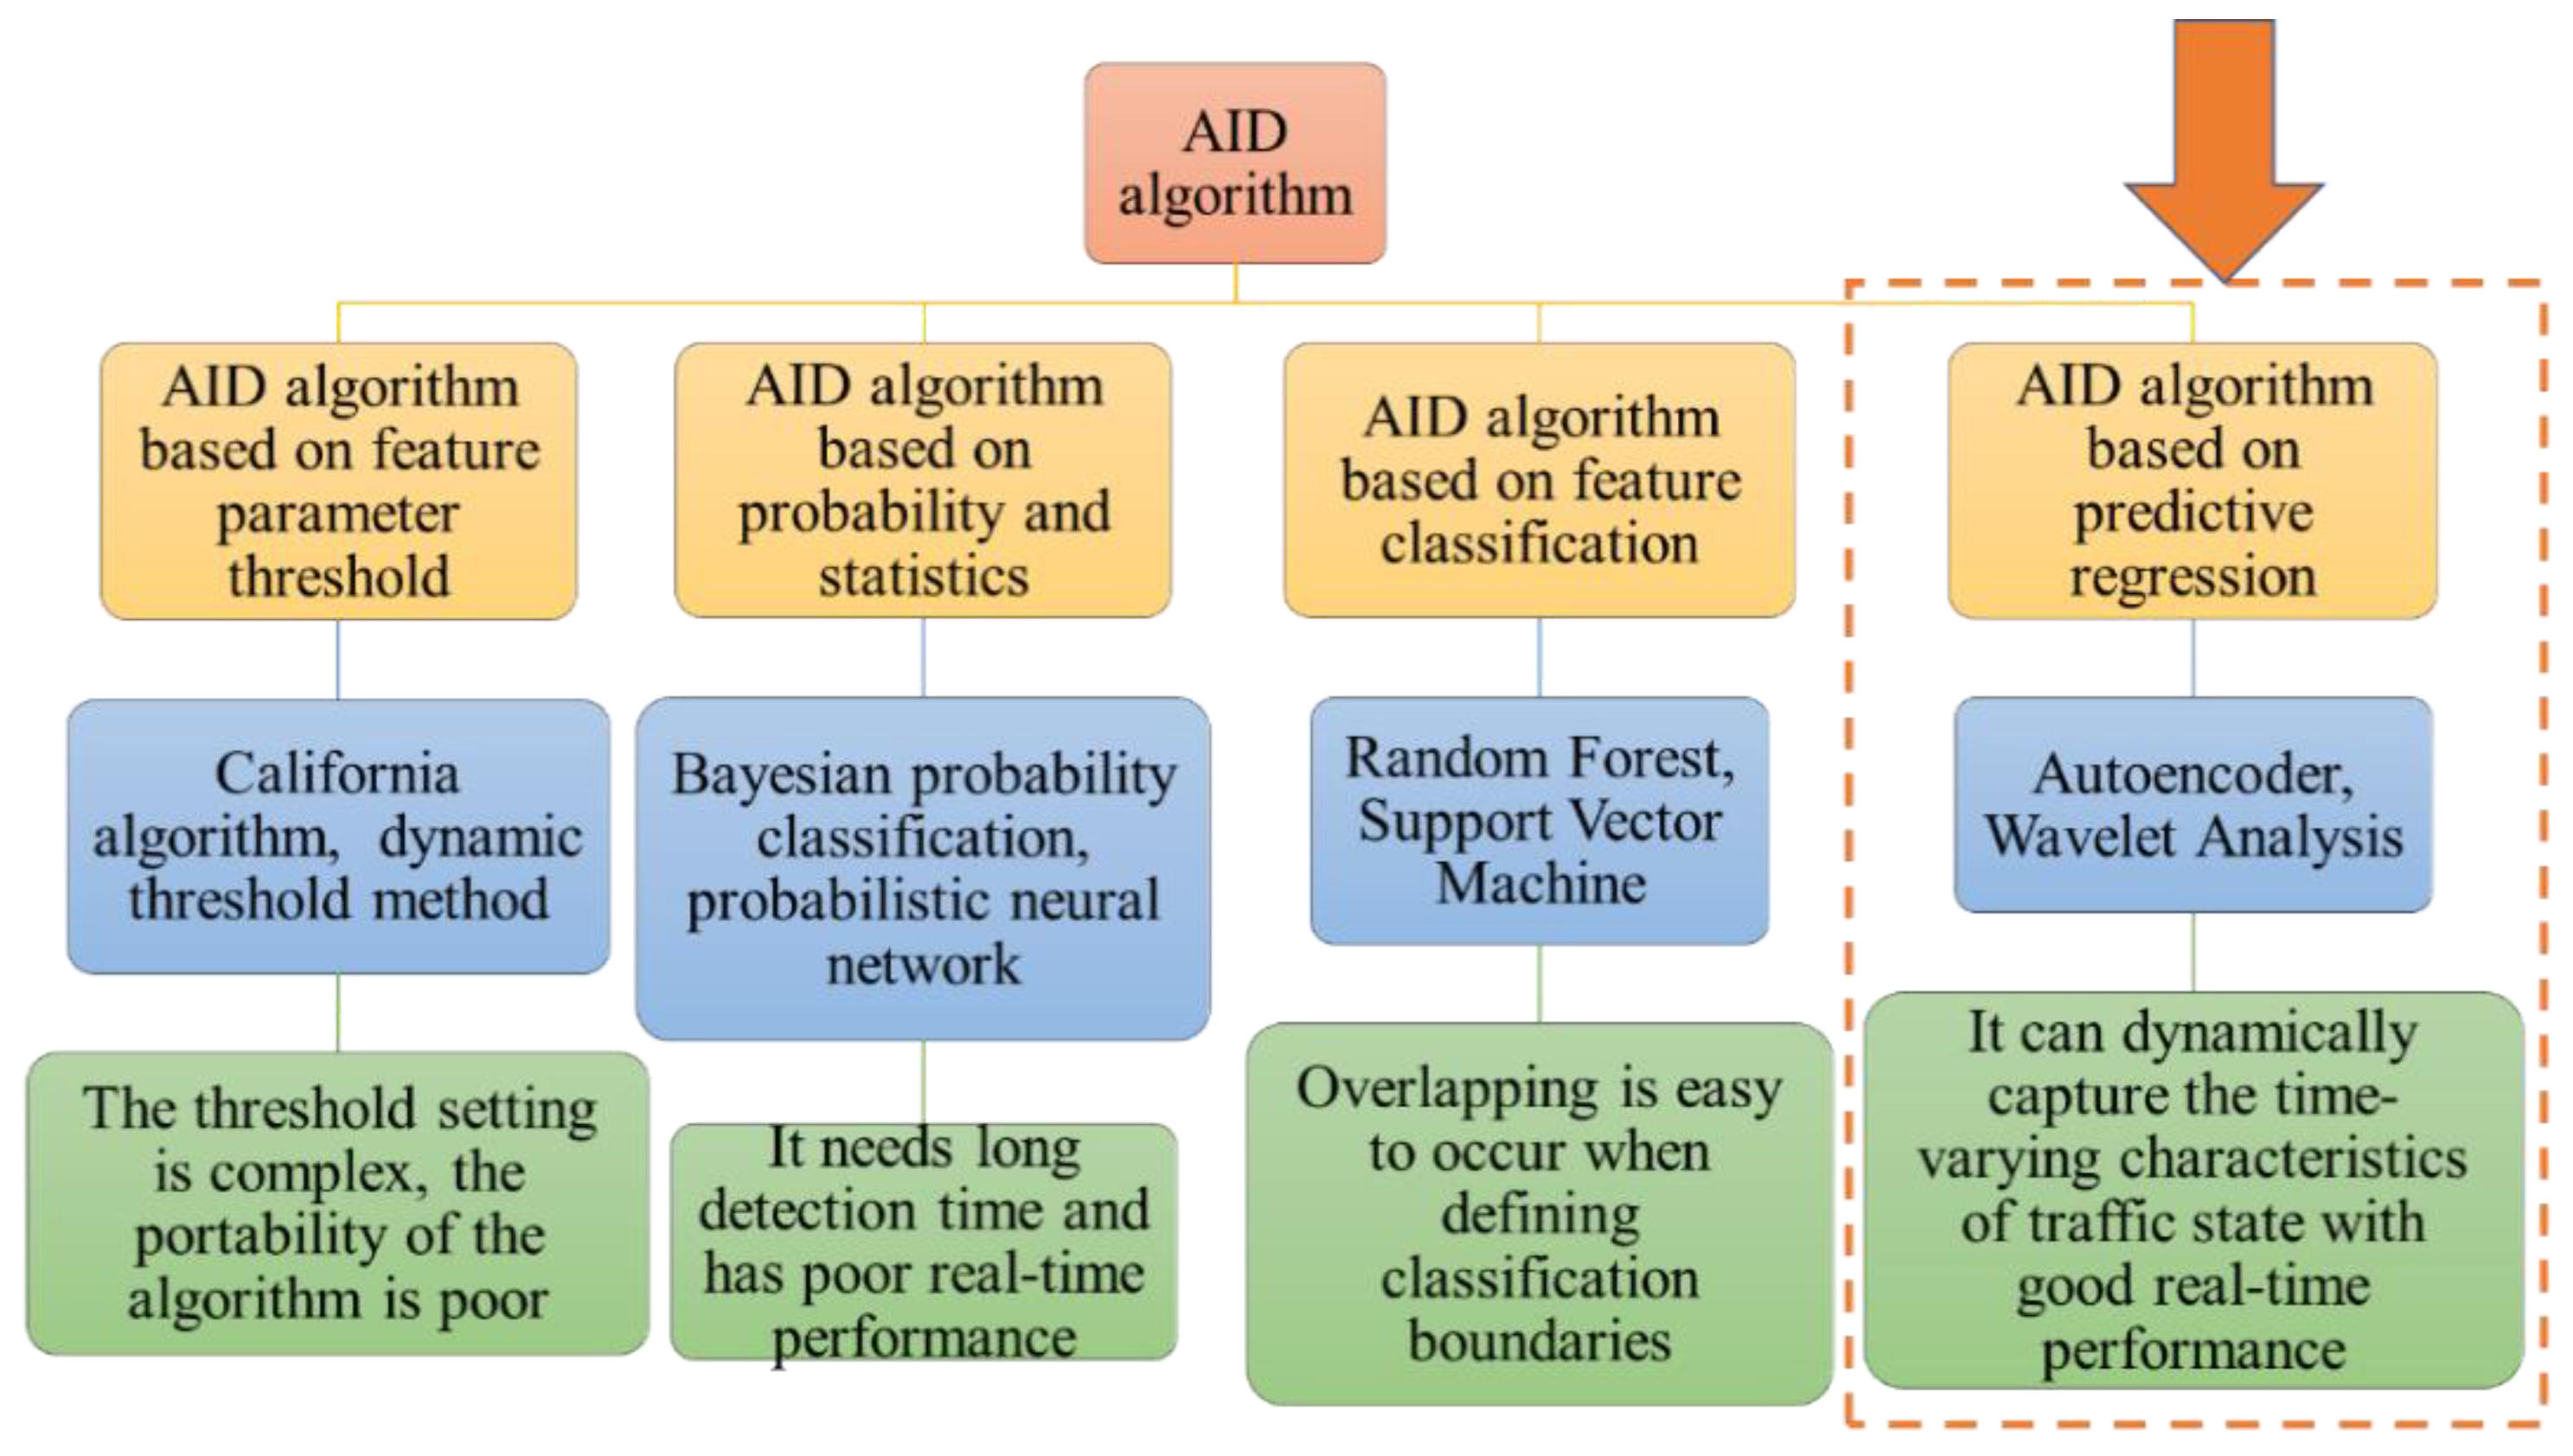
Various automatic incident detection (AID) algorithms were proposed by researchers as early as the 1960s. As illustrated in Figure 8, the algorithm detection principle classifies AID into four categories.
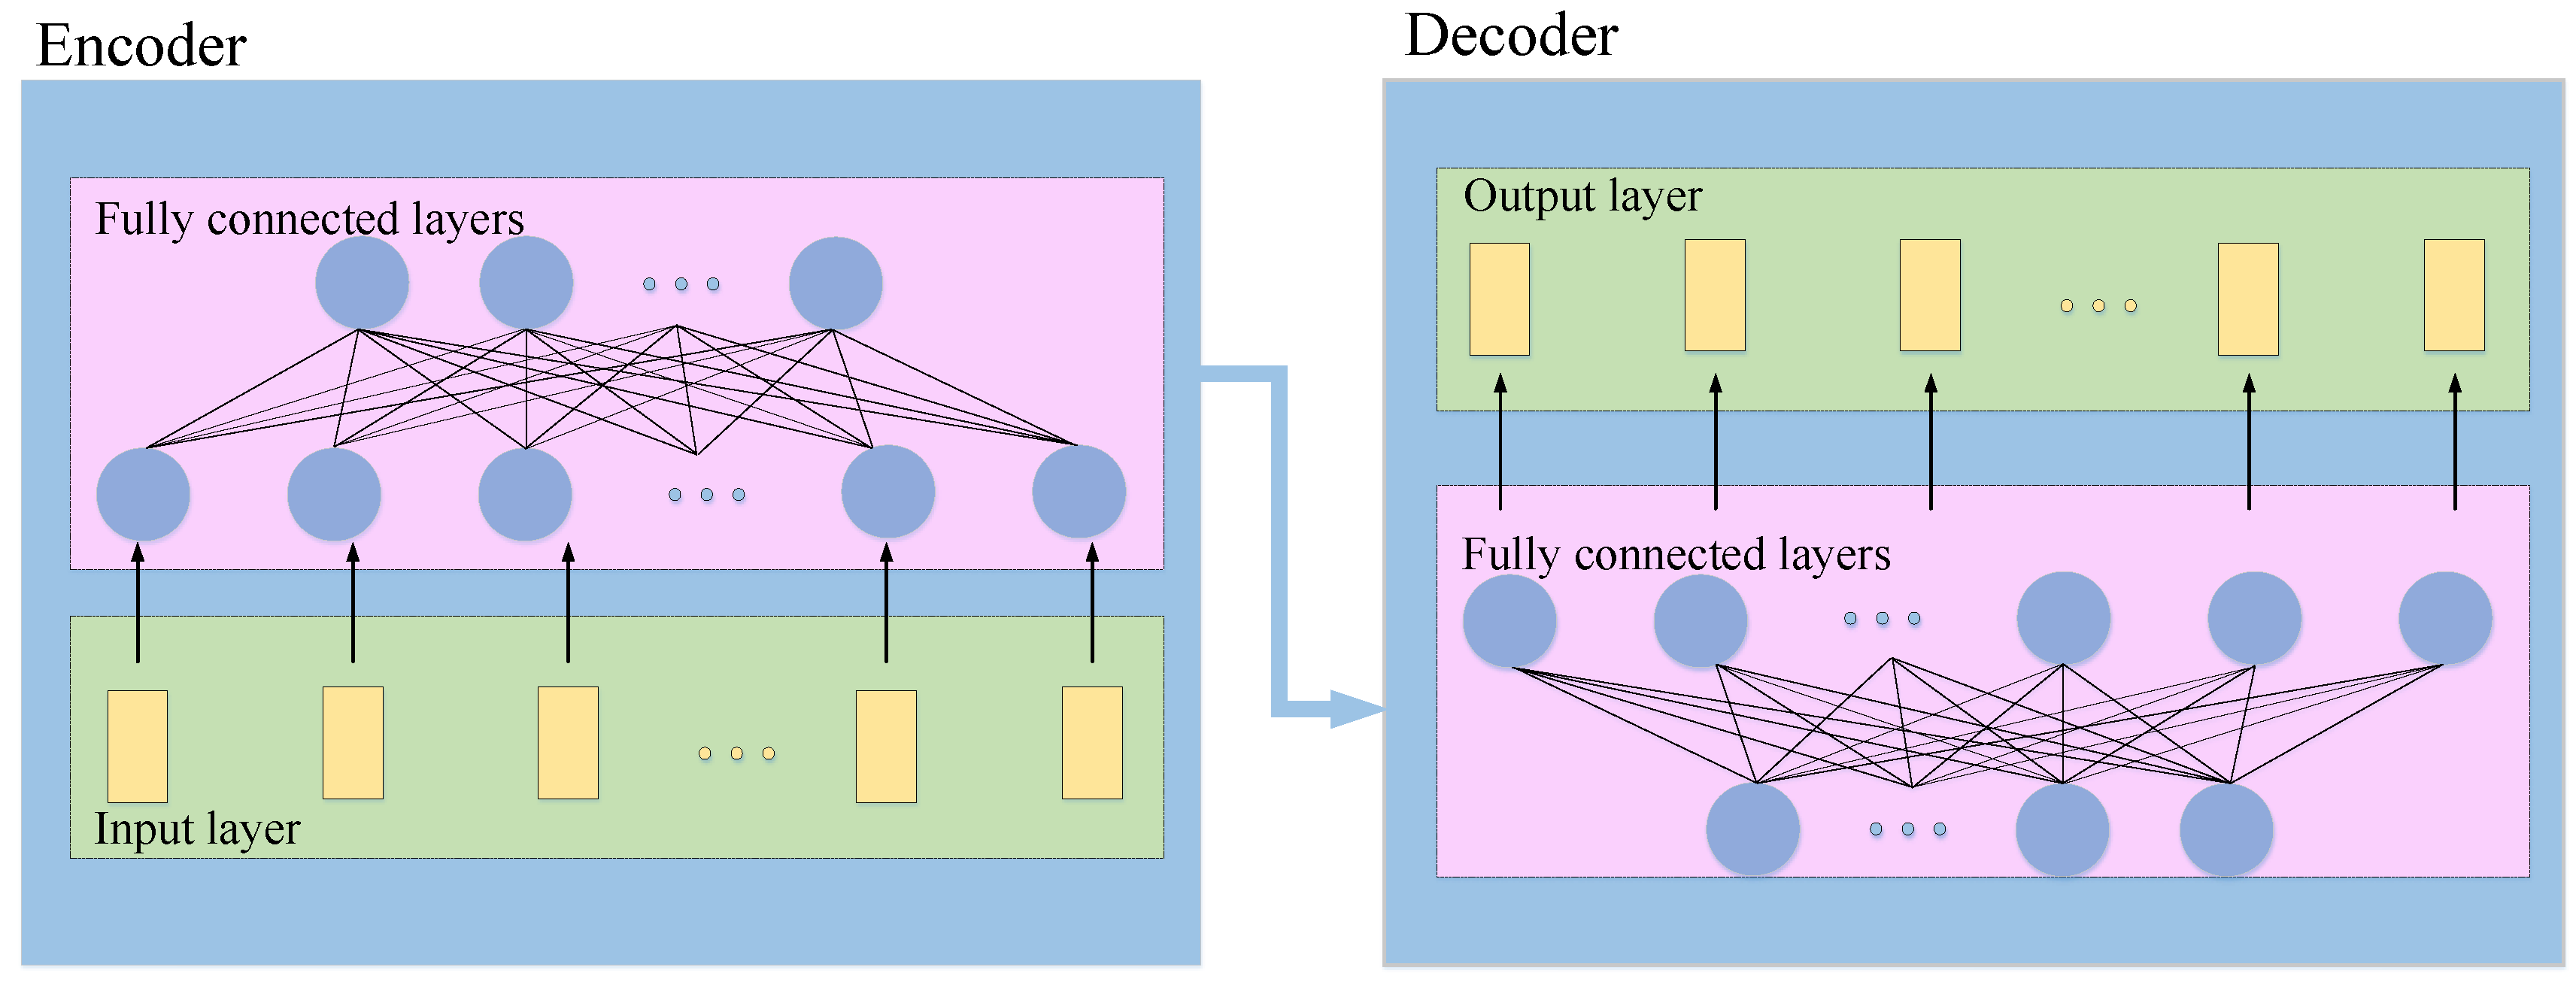
Therefore, we intend to implement accident identification using an autoencoder. An autoencoder (AE) is a neural network model with unsupervised learning as its primary characteristic. The encoder and decoder are the primary components of an autoencoder, according to An et al. [31]. Figure 9 illustrates the structure diagram.
An AE is an ANN-based unsupervised ML algorithm [32] that utilizes a neural network to reconstruct an output value equal to an arbitrary input value [33]. In particular, a basic AE contains a symmetrical structure comprising two functional segments—encoder and decoder—and three layers as follows: the input layer, hidden layer, and output layer. The encoder transforms the original input data (X) into a lower-dimensional layer, called the compressed representation (also known as feature or latent vector). Additionally, the decoder decompresses the representation into new input data (X′), reconstructed according to the relationship between the input variables [34]. Thus, the features of the input values regenerated by the AE exhibit numerical differences [35].
Autoencoder has been used to identify road traffic accidents [36]. They found that under various traffic operating conditions, when the acceptable false detection rate is 5% or 10%, the average detection rate can reach 93% and 98%, respectively; meanwhile, autoencoders can adaptively learn the dynamic changes of the traffic state and have strong adaptability and stability to different traffic operating environments. Therefore, we applied an autoencoder to identify intersection entrance accidents. The E-Police data and accident data were used to verify its detection effectiveness.
As model performance can be expectedly improved by considering numerical difference characteristics, this study implemented an AE to extract traffic flow feature information from electronic police data.
In the process of network training, first, initialize the network weights of the encoder and decoder, and then train the network weights by minimizing the error between the reconstructed item and the original input data to optimize the network parameters. Its unique structure (Figure 9) makes the network interference-resistant.
Assuming that the network input is X, the output is X , and the hidden layer vector is F, the process of mapping the input data X to the hidden layer through the encoding process can be expressed as:
F = e n c o d e X = f X · W + b
The encoder is equivalent to a reverse decoder. It reconstructs the extracted feature vector, and the entire decoding procedure can be described as follows:
X = d e c o d e F = f * F · W * + b *
where f   and f *   represent the activation functions of the encoder and decoder, respectively; W and W* represent the weight matrix of the encoder and decoder, respectively; and b and b* represent the offset vectors of the encoder and decoder, respectively.
In general, the AE minimizes the distance between the input and output by maximally recovering the information from the original input. To this end, the AE model uses loss functions to recreate the features and update the weight parameters to obtain more efficient results, as well as reduce the likelihood of errors. In particular, the loss function based on the reconstruction error is expressed in Equation (3).
Loss X , X = 1 n i = 1 n X i X i 2
where X and X denote the input and output of the autoencoder, respectively.

4. Result

4.1. Data Description

The dataset utilized in this paper is divided into two parts.
Dataset 1 contains electronic police data from 14 intersections in the central urban area of Zibo from 00:00, 7 April 2022to 24:00, 23 June 2022 (77 days). The data from the first 50 days (7 April 2022–27 May 2022) are used as the model training dataset. The data from the middle four days (28 May 2022-31 May 2022) are used as the model validation set. The data from the next 23 days (1 June 2022-23 June 2022) are used as the model testing dataset. The validation set accounts for 5% and the testing set accounts for 30%. We extract traffic volume data at 5-minute intervals and obtain a total of 22,176 sample data. The training dataset includes 14,400 pieces of data, while the test dataset includes 6624 pieces of data.
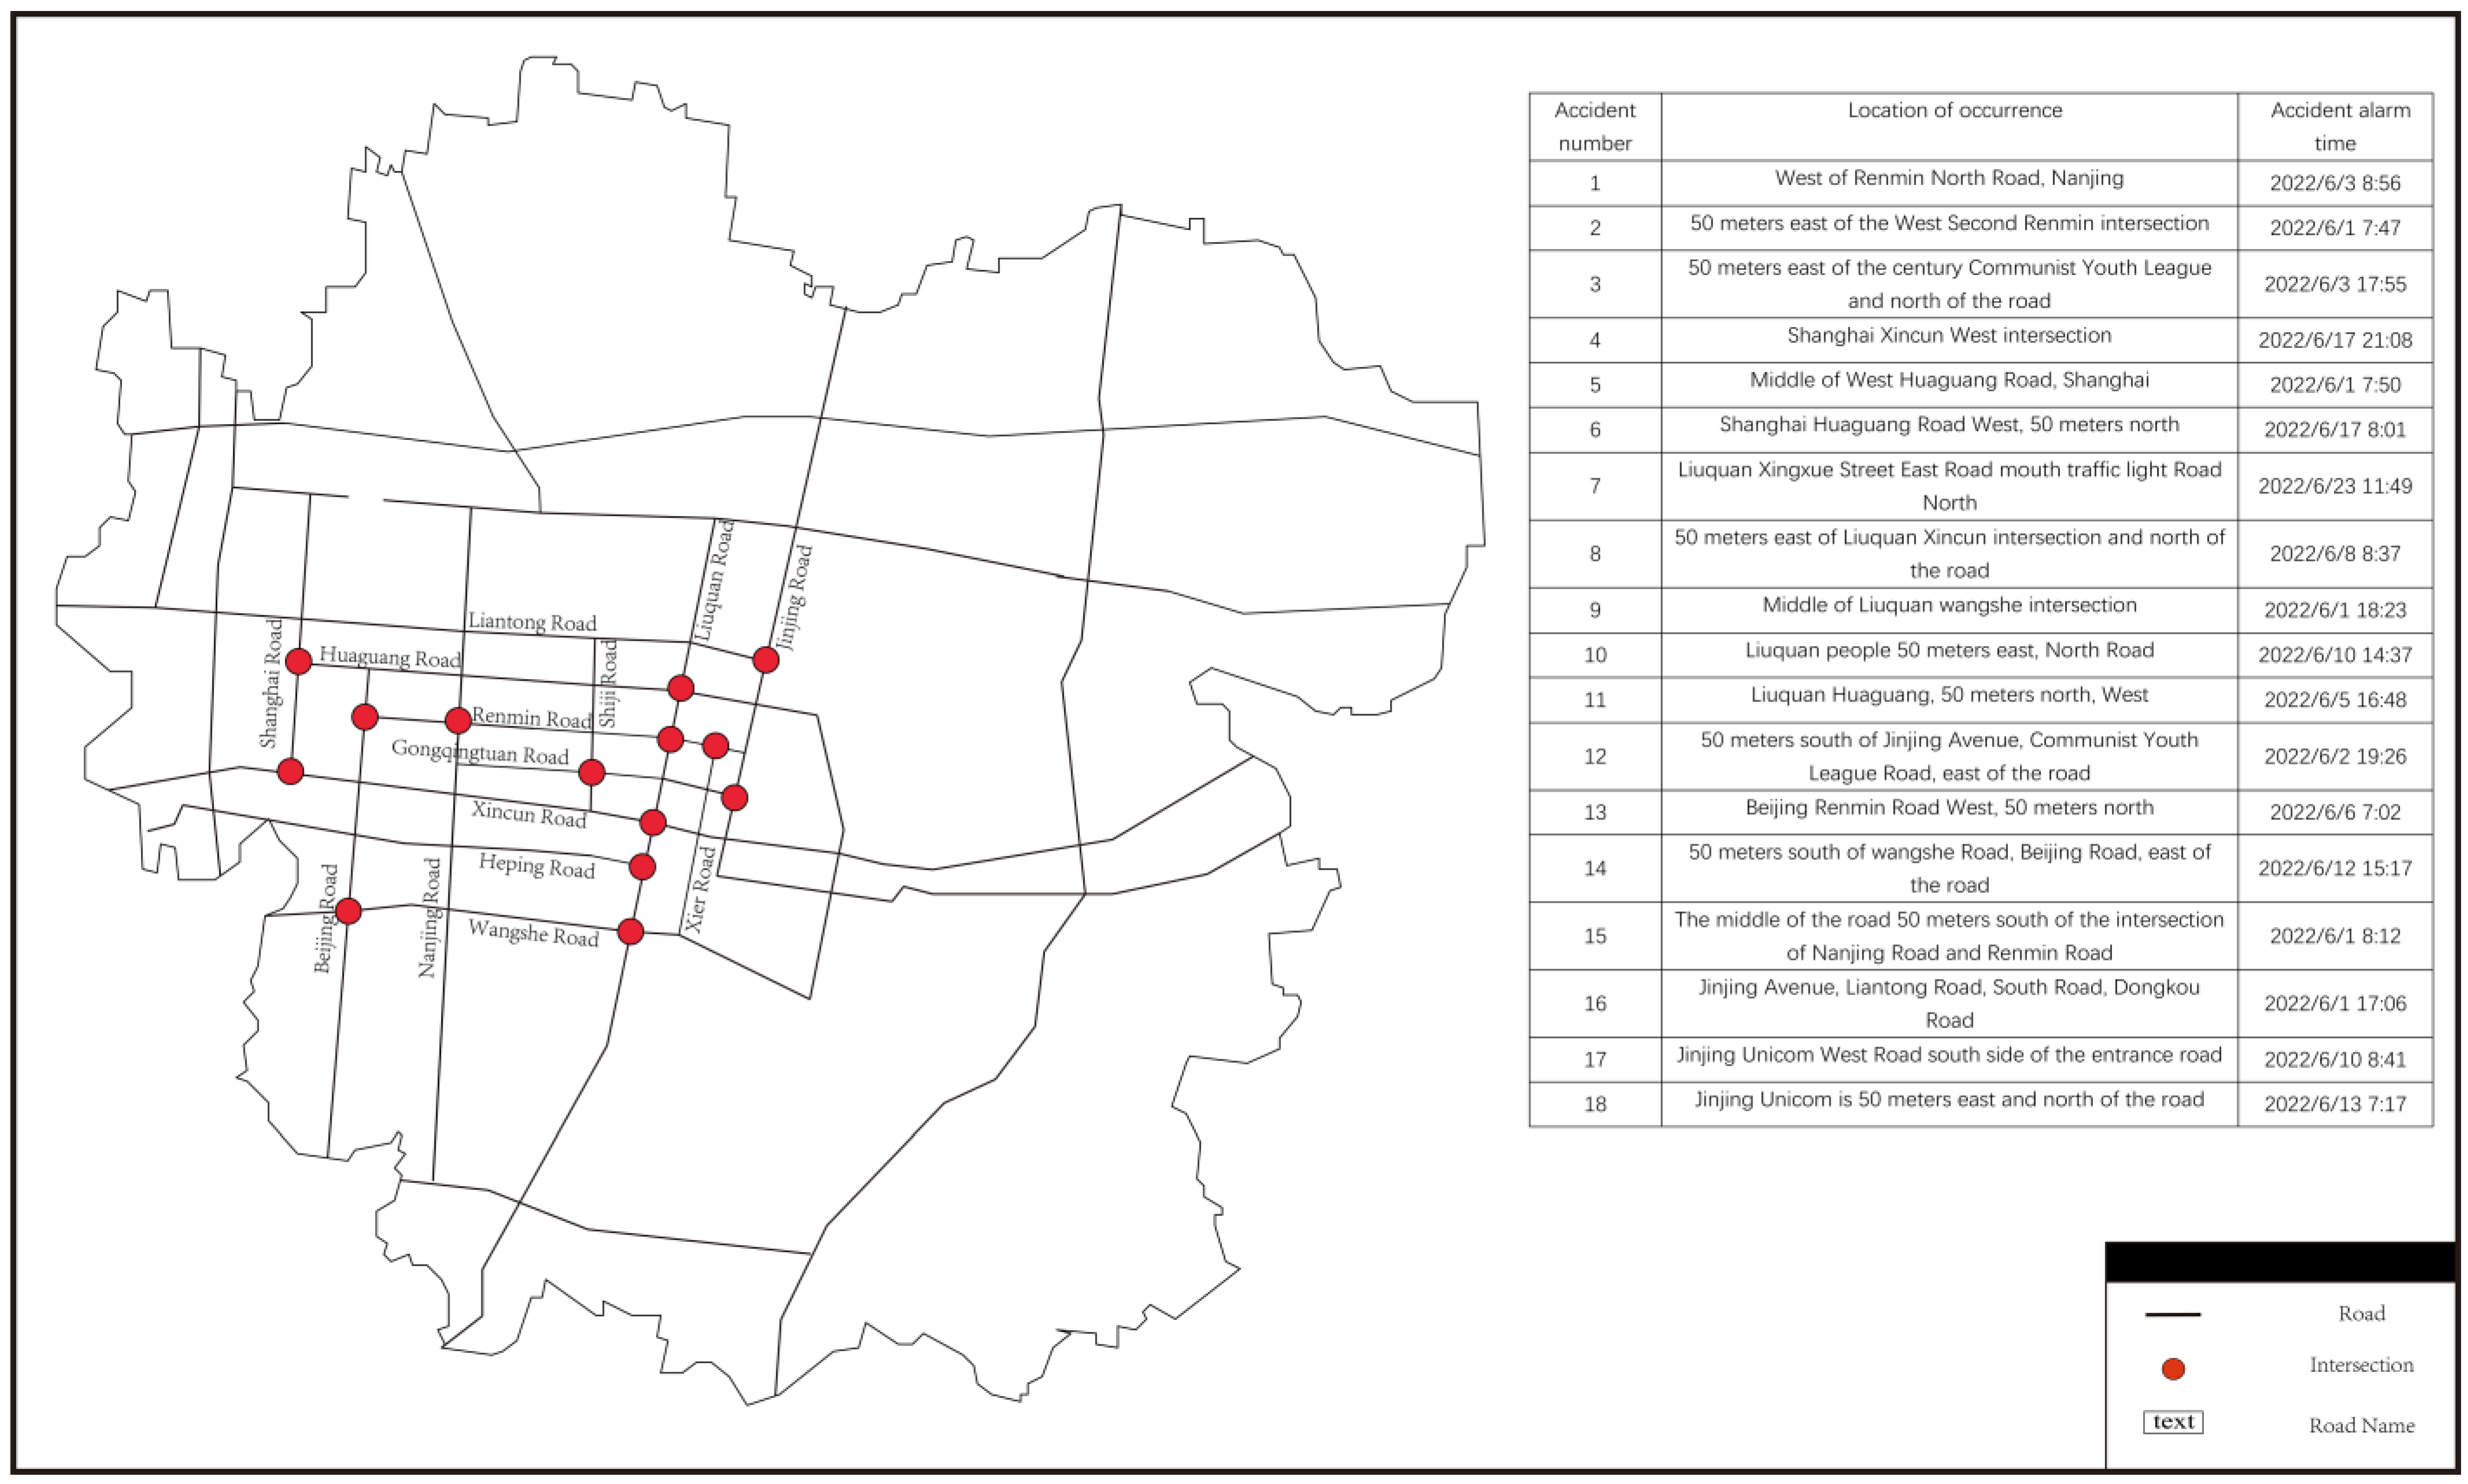
Dataset 2 contains the traffic accident data from 1 June 2022to 23 June 2022. It includes accident alarm time, accident location, accident description, and additional data, as shown in Table 3. There was really no rain in Zibo from 1 June 2022to 23 June 2022. Furthermore, there were no large-scale activities or festivals during this period. Therefore, traffic volume fluctuations are only affected by factors such as traffic accidents. The study area is shown in Figure 10.
The model is implemented using the framework pytorch1.90. The processor for the experimental operation is Intel (R) Core (TM) i7-10750H CPU @ 2.60 GHz. The GPU accelerates the process. A network with a full connection is utilized for model encoding and decoding. The optimal hyperparameter of the network, i.e., Epochs, is 1000, and the learning rate is 0.001. Additionally, the Adam optimizer is chosen as the model, and mean square error (MSE) is employed to train the autoencoder.

4.2. Traffic Accident Threshold Setting

According to the basic principles of statistics, abnormal data points are frequently distributed in the low probability region of the random model, i.e., the probability of abnormal data points being outliers is high. In accordance with the 3σ principle [37], 90%, 95%, and 99% quantiles of the model structure error in the training phase are designated as the accident judgment threshold in the testing phase. The accident alarm is activated when the reconstruction error of test data exceeds these thresholds. Different thresholds correspond to different severity degrees of accident: (a) normal, no accident: it comprises less than 90% quantile of the training set reconstruction error; (b) third-level warning: it is greater than 90% quantile and less than 95% quantile of the training set reconstruction error; (c) second-level warning: it is greater than 95% quantile and less than 99% quantile of the training set reconstruction error; and (d) first-level warning: it is greater than 99% quantile of the training set reconstruction error.
The reconstruction error of the model approximately conforms to the normal distribution and meets the application conditions of the 3σ principle. Therefore, we trained the model using E-Police data from 2022.4.7 to 2022.5.27 and set thresholds for different time periods, as shown in Table 4.
In the process of training the network, the use of an Adam optimizer is chosen. Epochs are set to 1000 and the learning rate is set to 0.001. The model is implemented using the Pytorch 1.90 framework. The processor used for the experimental operation is Intel (R) Core (TM) i7-10750H CPU @ 2.60 GHz, and the acceleration process is achieved using a GPU.

4.3. Verification of Model Results

As shown in Figure 11, we view the loss history curve of the training.
Figure 11 shows that the training set is well fitted. Moreover, there is no “rebound” in the training set, that is, there is no overfitting phenomenon. Therefore, we test the recognition effect of the model on entrance accidents.
On the basis of training the autoencoder with E-Police data in the period from 7 April 2022 to 27 May 2022, this section identifies 100 entrance accidents that occurred during the period from 1 June 2022to 23 June 2022 and tests the recognition effect of the autoencoder model.
Taking six intersection entrance accidents that occurred at the intersection of Nanjing Rd and Renmin Rd from 1 June 2022 to 23 June 2022 as examples, the effectiveness of the model is verified, as shown in Figure 12.
Figure 12 shows the identification effect of entrance accidents at the intersection of Nanjing Rd and Renmin Rd on 1 June 2022, 3 June 2022, 7 June 2022, 14 June 2022, and 23 June 2022.
The first accident occurred on 1 June 2022 at the east entrance of the intersection of Nanjing Rd and Renmin Rd. The alarm event time for the accident was 8:12. The first solid red line in the figure represents the actual values during the 7:30–9:30 period. The black dashed line represents the predicted values during this period. From the graph, it can be seen that the duration of the accident was 20 min (8:10–8:30). There is a significant difference between the predicted value and the actual value.
The second accident occurred on 3 June 2022 at the west entrance of the Nanjing Rd and Renmin Rd intersection. The accident alarm time was 8:56. The second solid green line in the figure represents the actual values during the 8:00–10:00 period. The blue dashed line represents the predicted values during this period. From the graph, it can be seen that the duration of the accident was 25 min (8:50–9:15). There is a significant difference between the predicted value and the actual value.
The third accident occurred on 7 June 2022 at the north entrance of the Nanjing Rd and Renmin Rd intersection. The accident alarm time was 18:05. The third solid yellow line in the figure represents the actual values during the 17:00 to 19:00 period. The purple dashed line represents the predicted values during this period. From the graph, it can be seen that the duration of the accident was 20 min (18:00–18:20). There is a significant difference between the predicted value and the actual value.
The fourth accident occurred on 14 June 2022 at the north entrance of the Nanjing Rd and Renmin Rd intersection. The accident alarm time was 14:58. The solid brown line in the third part of the figure represents the actual values during the period from 14:00 to 16:00. The water blue dashed line represents the predicted values during this period. From the graph, it can be seen that the duration of the accident was 25 min (14:55–15:20). There is a significant difference between the predicted value and the actual value.
The fifth accident occurred on 23 June 2022 at the south entrance of the Nanjing Rd and Renmin Rd intersection. The accident alarm time was 17:50. The solid orange line in the third part of the figure represents the actual values during the period from 17:00 to 19:00. The grass-green dashed line represents the predicted values during this period. From the graph, it can be seen that the duration of the accident was 15 min (17:45–18:00). There is a significant difference between the predicted value and the actual value.
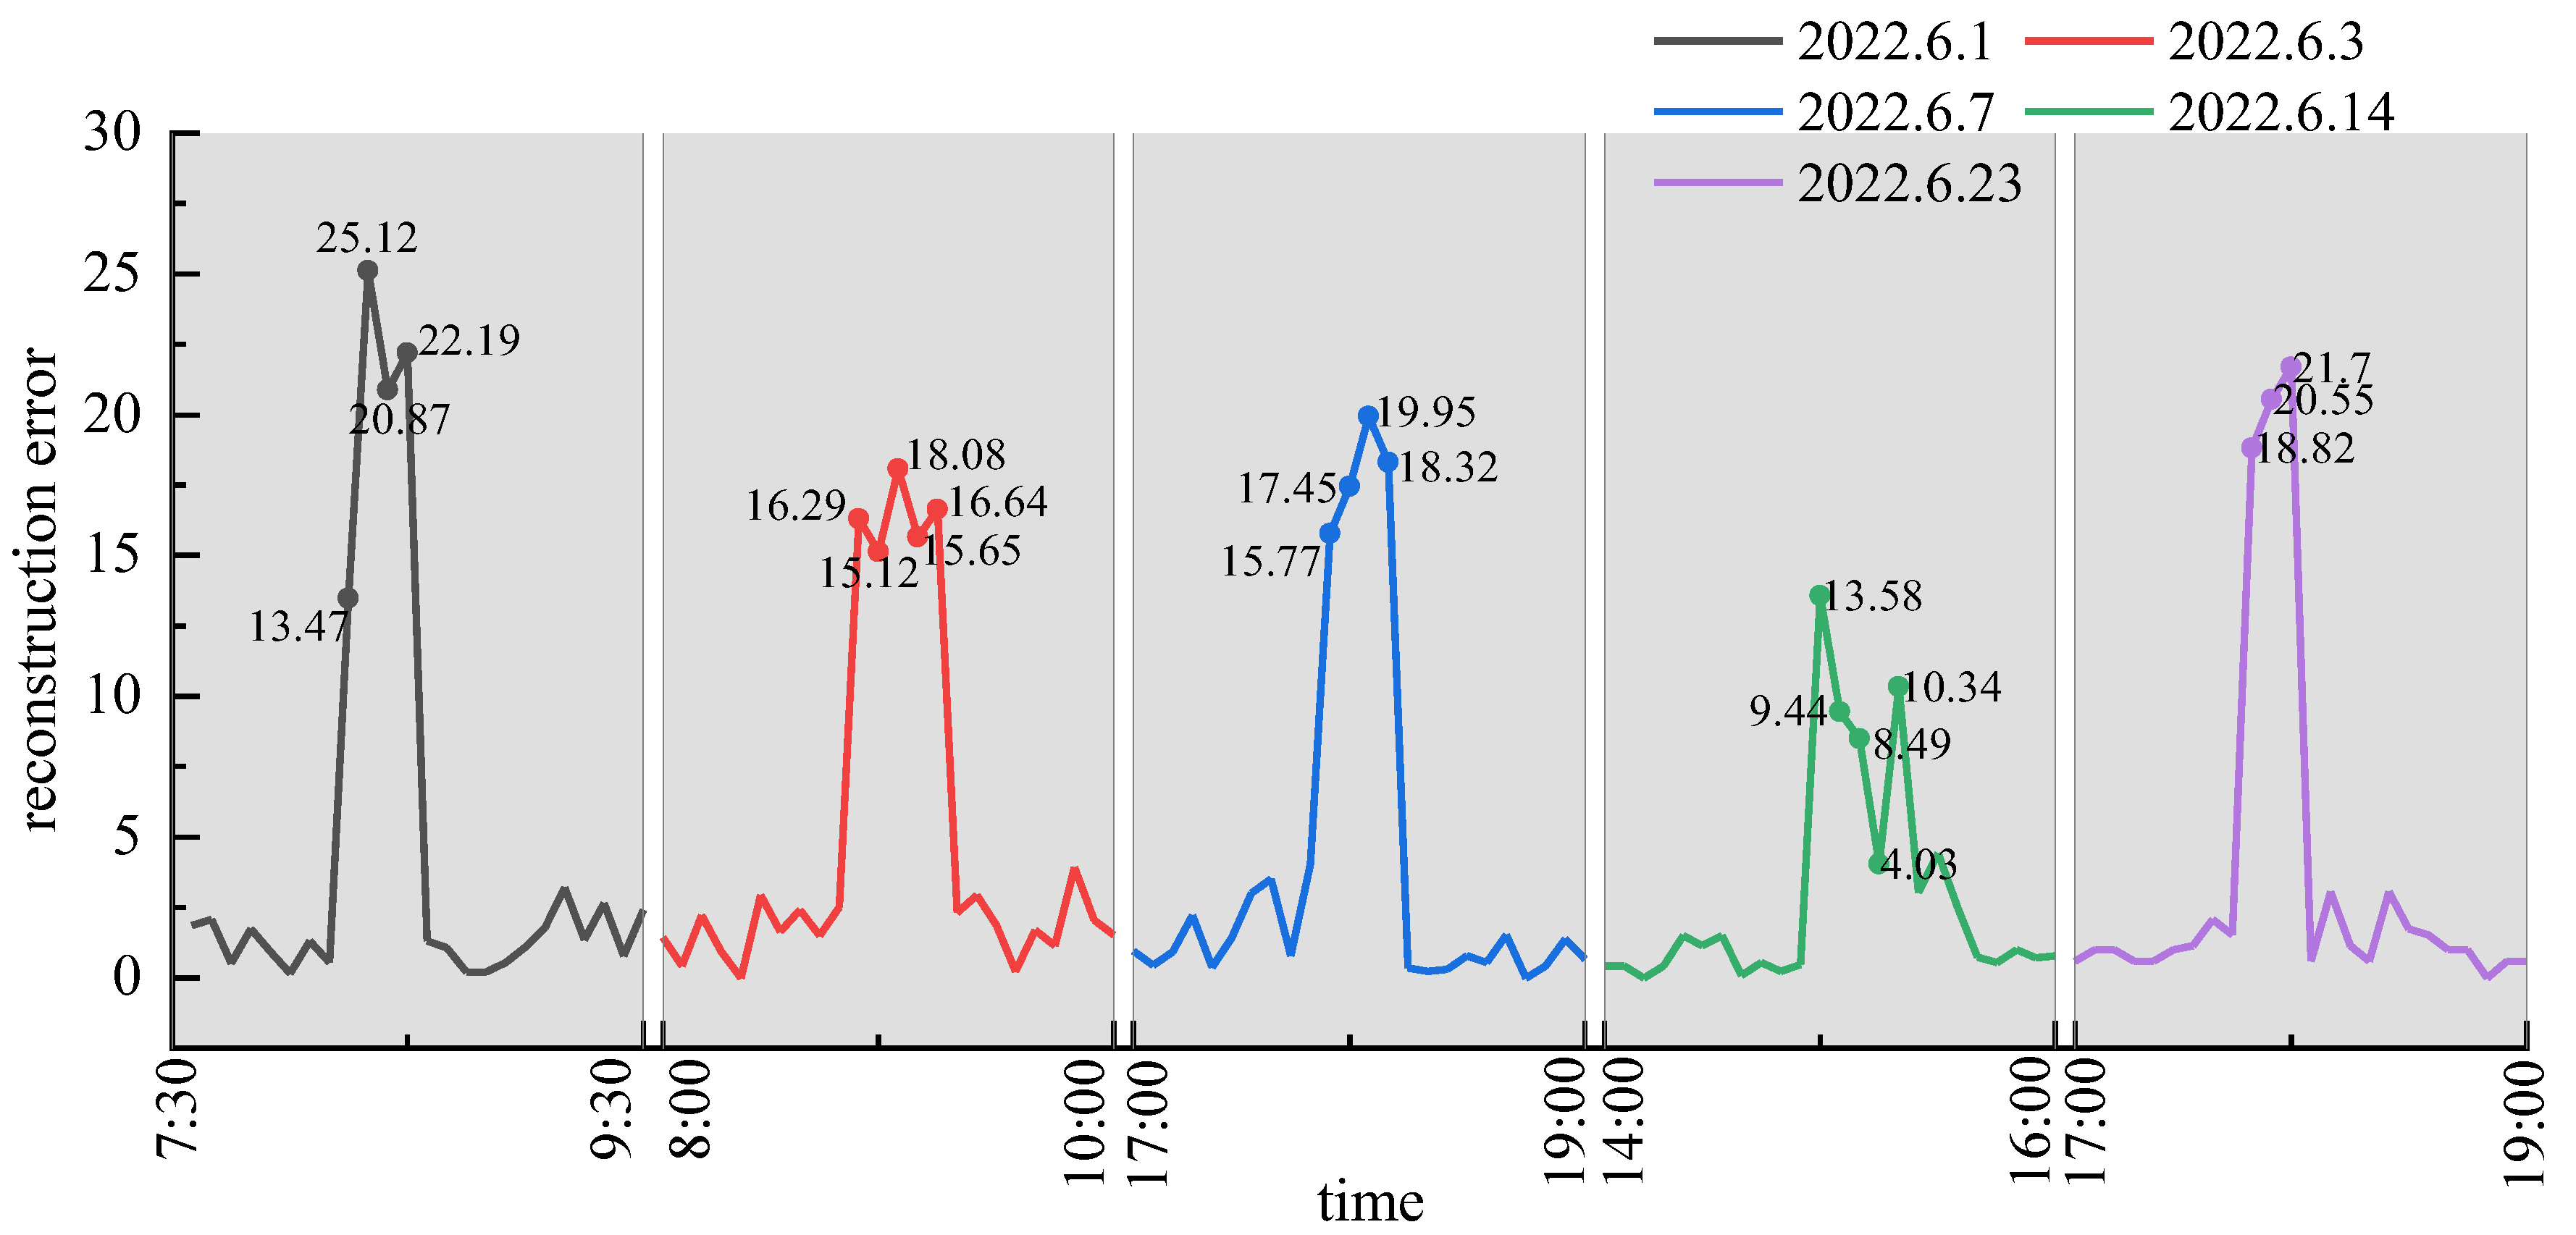
Figure 13 shows the mean square error of the test data. The accidents on 1 June 2022 and 3 June 2022 occurred during the morning peak period. During this period, there is heavy traffic. The utilization rate of each lane reached its highest value in a day. Each lane’s traffic volume is approximately equal. In the first 5 min after the accident, the reconstruction errors reached 13.47 showed in the black line, which means the severity of the accident impact reached level I. The red line’s construction errors reached 16.29. Based on the accident threshold during the morning peak period, it can be determined that the severity of the accident impact is also reached level I.
The accidents on 7 June 2022 and 23 June 2022 occurred during the evening peak period. During this period, the intersection is in a saturated state. In the first 5 min after the accident, the reconstruction errors reached 15.77 showed in the blue line, which means the severity of the accident impact reached level I. The purple line’s construction errors reached18.82. Based on the accident threshold during the evening peak period, it can be determined that the severity of the accident impact is also reached level I.
The accident on 14 June 2022 occurred during daytime off-peak hours. The traffic volume during this period is lower than that during peak hours, so the impact of the accident on the release status of traffic flow is relatively small. From Figure 12, we can see that the model can quickly identify accidents within 5 min. The reconstruction error is 4.03, and the maximum error is 13.58, which exceeds the level I alarm threshold during daytime off-peak hours. The recognition effect is significant.

5. Discussion

At present, the main indicators to evaluate the effectiveness of entrance-accident-detection algorithms are the detection rate (DR), false alarm rate (FAR), and mean time to detection (MTTD). DR and FAR are mainly used to evaluate the detection effect of the algorithm. MTTD is mainly used to measure the detection efficiency of the algorithm. The calculation formula for the index is as follows:
DR = T h e   n u m b e r   o f   a c c i d e n t s   i d e n t i f i e d   b y   t h e   a l g o r i t h m T h e   a c t u a l   n u m b e r   o f   a c c i d e n t s × 100 %
FAR = N u m b e r   o f   a c c i d e n t s   i n c o r r e c t l y   i d e n t i f i e d N u m b e r   o f   a l l   a c c i d e n t s   i d e n t i f i e d × 100 %
MTTD = 1 m i = 1 m t 1 a t 2 a
where t1(a) represents the time when accident a occurs; t2(a) represents the time when accident a is detected; and m represents the number of identified accidents.
Support vector machine (SVM) and random forest (RF) are chosen for comparative evaluation in order to comprehensively assess the algorithm. Among them, support vector machine detects accidents by determining the classification hyperplane of the accident state and normal state [23]; stochastic forest employs the concept of ensemble learning to train multiple classification trees to detect abnormal data; and random forest employs the concept of ensemble learning to train multiple classification trees to detect abnormal data [38]. Table 5 demonstrates the performance of various algorithms.
From Table 5, the following conclusions can be drawn:
a. Compared to support vector machine and random forest, this method achieves a higher detection rate. Morning and evening peak detection rates for the algorithm proposed in this paper are 94.33% and 95.47%, respectively. The DR of the algorithm in the morning peak period is 4.6% higher than that of the other two algorithms on average. Compared to the other two algorithms, the evening peak period DR is increased by an average of 5.7%. The detection effect of the morning and evening peak hours is obviously superior to the other two algorithms. This algorithm’s DR reaches 81.64% when an accident occurs during off-peak daylight hours. This is because there is less traffic during daylight off-peak hours, and the impact of the accident on traffic flow is not obvious.
b. Compared with support vector machine and random forest, the autoencoder has a lower false alarm rate. The FARs of the autoencoder are 5.99% and 6.56%, respectively, in the morning and evening peak hours. Compared with the other two algorithms, the FAR in the morning peak hours is reduced by 13.9% on average and in the evening peak hours, it is reduced by 15.5% on average. The FAR of the autoencoder in this paper is 12.55% during the daytime peak period. We find that the detection performance of the autoencoder is more stable.
c. The autoencoder model has a shorter MTTD in terms of detection efficiency than the other two algorithms. During the morning peak, the MTTD of the autoencoder model is 1.28 min faster than those of support vector machine and random forest. For accidents that occur in the late peak hours, the MTTD of the autoencoder model is reduced by 1.67 min on average compared with the other two algorithms. When an accident occurs during off-peak hours, the MTTD decreases by 1.18 min. This demonstrates that the detection efficiency of the algorithm proposed in this paper is quite high.
d. By comprehensively comparing the performance of the three algorithms in each period, we found that the autoencoder model has better performance in the morning peak period, evening peak period, and daylight off-peak period. This paper proposes an algorithm with a higher detection rate, a lower false alarm rate, and a shorter average detection time. This demonstrates that the autoencoder network can effectively extract and learn the parameter features and has a high level of adaptability and stability across a variety of entrance operation states.
At present, most of the research on accidents analyzes the factors affecting accidents, and only a few studies can evaluate the impact after the accident. Based on E-Police data, we extracted intersection traffic flow volume, which were used to characterize the impact mechanism of the intersection entrance accident and detect the entrance accident. In 2016’s ITSC, Sun et al. [39] also extracted parameters based on video recording equipment at intersections to estimate the impact of accidents on traffic flow. However, Sun et al. [39] only analyzed the effect of accidents on traffic flow volume.
However, based on E-Police equipment, this paper extracts traffic flow volume in different directions and lanes at 5-minute intervals. Then, the autoencoder uses the standard deviation of entrance lanes’ traffic volume as an input parameter and identifies intersection entrance accidents by comparing predicted data to actual measured data. Furthermore, it is evident that an autoencoder can effectively enhance the detection effect and has a shorter detection time of intersection entrance accidents.

6. Conclusions

a. Based on E-Police equipment, this paper extracts traffic volume data of the intersection. We compare each lane’s traffic volume difference horizontally and use the standard deviation of entrance lanes’ traffic volume to express this difference in order to express it uniformly. This reduces the effect of random fluctuations in traffic volume on the accident-detection model.
b. Based on real-time detection data, we propose an autoencoder model to detect intersection entrance accidents in this paper. The autoencoder model can adaptively learn the dynamic change characteristics of traffic volume.
c. To analyze the detection effect and severity of entrance accidents, this paper determines the alarm level for the morning, evening, and daylight off-peak hours by analyzing the reconstruction error during the training phase. This offers a more targeted approach to emergency control.
d. This paper verifies the algorithm using actual data and compares it to random forest and support vector machine. The experimental results demonstrate that the autoencoder model is superior and more effective than the support vector machine and random forest detection, and that it satisfies the recognition requirements of various time intervals.
This paper examined intersection entrance accidents that occurred during the morning peak, evening peak, and daylight off-peak hours based on an autoencoder.
There are two limitations to the model:
a. It is limited to intersection entrance accidents;
b. It is limited to the daytime off-peak hour, morning peak hour, and evening peak hour.
In the follow-up study, we will further investigate how to identify entrance accidents that occur at night. In addition, to further improve the detection effect, we will investigate other parameters to express the accident impact mechanism and gain a deeper understanding of intersection traffic change characteristics.

Author Contributions

Conceptualization, Y.D. and F.S.; data curation, B.L; methodology, Y.D.; validation, P.Z. and B.L.; formal analysis, X.W. and P.Z.; writing—original draft, Y.D.; writing—review and editing, F.S. and F.J.; supervision, F.S. and F.J.; funding acquisition, F.S. All authors have read and agreed to the published version of the manuscript.

Funding

This study was supported by Shandong Province Science and Technology Small and Medium Enterprises Innovation Ability Enhancement Project: 2022TSGC2279, the School-City Integration Development Plan Project of Zhangdian District: No. 2021PT0004.

Institutional Review Board Statement

Not applicable.

Informed Consent Statement

Not applicable.

Data Availability Statement

The dataset is from Traffic Police Battalion, Zhangdian District, Zibo City, Shandong Province, China. The data used to support the findings of this study are available from the corresponding author upon request.

Conflicts of Interest

The authors declare no conflict of interest.

References

  1. Wefering, F.; Rupprecht, S.; Bührmann, S.; Böhler-Baedeker, S.; Granberg, M.; Vilkuna, J.; Saarinen, S.; Backhaus, W.; Laubenheimer, M.; Lindenau, M.; et al. Developing and Implementing a Sustainable Urban Mobility Plan Guidelines—Developing and Implementing a Sustainable Urban Mobility Plan Title: Guidelines; Developing and Implementing a Sustainable Urban Mobility Plan; European Commission: Brussels, Belgium, 2014. [Google Scholar]
  2. Suchanek, M.; Szmelter-Jarosz, A. Environmental Aspects of Generation Y’s Sustainable Mobility. Sustainability 2019, 11, 3204. [Google Scholar] [CrossRef]
  3. Okraszewska, R.; Romanowska, A.; Wołek, M.; Oskarbski, J.; Birr, K.; Jamroz, K. Integration of a Multilevel Transport System Model into Sustainable Urban Mobility Planning. Sustainability 2018, 10, 479. [Google Scholar] [CrossRef]
  4. Farooq, D.; Moslem, S.; Duleba, S. Evaluation of Driver Behavior Criteria for Evolution of Sustainable Traffic Safety. Sustainability 2019, 11, 3142. [Google Scholar] [CrossRef]
  5. OECD. Managing Urban Traffic Congestion, European Conference of Ministers of Transport—Transport Research Centre; OECD Publishing: Paris, France, 2007. [Google Scholar]
  6. Albalate, D.; Fageda, X. Congestion, Road Safety, and the Effectiveness of Public Policies in Urban Areas. Sustainability 2019, 11, 5092. [Google Scholar] [CrossRef]
  7. Zhang, X.; Qi, S.; Zheng, A.; Luo, Y.; Hao, S. Data-Driven Analysis of Fatal Urban Traffic Accident Characteristics and Safety Enhancement Research. Sustainability 2023, 15, 3259. [Google Scholar] [CrossRef]
  8. Han, I. Scenario Establishment and Characteristic Analysis of Intersection Collision Accidents for Advanced Driver Assistance Systems. Traffic Inj. Prev. 2020, 21, 354–358. [Google Scholar] [CrossRef]
  9. Pal, C.; Hirayama, S.; Narahari, S.; Jeyabharath, M.; Prakash, G.; Kulothungan, V. An Insight of World Health Organization (WHO) Accident Database by Cluster Analysis with Self-Organizing Map (SOM). Traffic Inj. Prev. 2018, 19, S15–S20. [Google Scholar] [CrossRef]
  10. Mohapatra, H.; Dalai, A.K. IoT Based V2I Framework For Accident Prevention. In Proceedings of the 2022 2nd International Conference on Artificial Intelligence and Signal Processing (AISP), Vijayawada, India, 12–14 February 2022; pp. 1–4. [Google Scholar]
  11. Ding, T.; Zhang, L.; Xi, J.; Li, Y.; Zheng, L.; Zhang, K. Bus Fleet Accident Prediction Based on Violation Data: Considering the Binding Nature of Safety Violations and Service Violations. Sustainability 2023, 15, 3520. [Google Scholar] [CrossRef]
  12. Mohapatra, H.; Rath, A.K. An IoT Based Efficient Multi-Objective Real-Time Smart Parking System. Int. J. Sens. Netw. 2021, 37, 219–232. [Google Scholar] [CrossRef]
  13. Hui, Z.; Yaohua, X.; Lu, M.; Jiansheng, F. Vision-Based Real-Time Traffic Accident Detection. In Proceedings of the 11th World Congress on Intelligent Control and Automation, Shenyang, China, 29 June–4 July 2014; pp. 1035–1038. [Google Scholar]
  14. Ijjina, E.P.; Chand, D.; Gupta, S.; Goutham, K. Computer Vision-Based Accident Detection in Traffic Surveillance. In Proceedings of the 2019 10th International Conference on Computing, Communication and Networking Technologies (ICCCNT), Kanpur, India, 6–8 July 2019; pp. 1–6. [Google Scholar]
  15. Veni, S.; Anand, R.; Santosh, B. Road Accident Detection and Severity Determination from CCTV Surveillance. In Advances in Distributed Computing and Machine Learning; Tripathy, A.K., Sarkar, M., Sahoo, J.P., Li, K.-C., Chinara, S., Eds.; Springer: Singapore, 2021; pp. 247–256. [Google Scholar]
  16. Kamijo, S.; Matsushita, Y.; Ikeuchi, K.; Sakauchi, M. Traffic Monitoring and Accident Detection at Intersections. IEEE Trans. Intell. Transp. Syst. 2000, 1, 108–118. [Google Scholar] [CrossRef]
  17. Kim, Y.; Tak, S.; Kim, J.; Yeo, H. Identifying Major Accident Scenarios in Intersection and Evaluation of Collision Warning System. In Proceedings of the 2017 IEEE 20th International Conference on Intelligent Transportation Systems (ITSC), Yokohama, Japan, 16–19 October 2017; pp. 1–6. [Google Scholar]
  18. Wei, Y.; Li, K.; Tang, K. Trajectory-Based Identification of Critical Instantaneous Decision Events at Mixed-Flow Signalized Intersections. Accid. Anal. Prev. 2019, 123, 324–335. [Google Scholar] [CrossRef] [PubMed]
  19. Minnikhanov, R.; Anikin, I.; Mardanova, A.; Dagaeva, M.; Makhmutova, A.; Kadyrov, A. Evaluation of the Approach for the Identification of Trajectory Anomalies on CCTV Video from Road Intersections. Mathematics 2022, 10, 388. [Google Scholar] [CrossRef]
  20. Karim, A.; Adeli, H. Comparison of Fuzzy-Wavelet Radial Basis Function Neural Network Freeway Incident Detection Model with California Algorithm. J. Transp. Eng. 2002, 128, 21–30. [Google Scholar] [CrossRef]
  21. Deretić, N.; Stanimirović, D.; Awadh, M.A.; Vujanović, N.; Djukić, A. SARIMA Modelling Approach for Forecasting of Traffic Accidents. Sustainability 2022, 14, 4403. [Google Scholar] [CrossRef]
  22. Agarwal, S.; Kachroo, P.; Regentova, E. A Hybrid Model Using Logistic Regression and Wavelet Transformation to Detect Traffic Incidents. IATSS Res. 2016, 40, 56–63. [Google Scholar] [CrossRef]
  23. Chen, S.; Wang, W.; Van Zuylen, H. Construct Support Vector Machine Ensemble to Detect Traffic Incident. Expert Syst. Appl. 2009, 36, 10976–10986. [Google Scholar] [CrossRef]
  24. Cheng, X.; Lin, W.; Liu, E.; Gu, D. Highway Traffic Incident Detection Based on BPNN. Procedia Eng. 2010, 7, 482–489. [Google Scholar] [CrossRef]
  25. Ahmed, M.; Abdel-Aty, M. A Data Fusion Framework for Real-Time Risk Assessment on Freeways. Transp. Res. Part C Emerg. Technol. 2013, 26, 203–213. [Google Scholar] [CrossRef]
  26. Ozbayoglu, M.; Kucukayan, G.; Dogdu, E. A Real-Time Autonomous Highway Accident Detection Model Based on Big Data Processing and Computational Intelligence. In Proceedings of the 2016 IEEE International Conference on Big Data (Big Data), Washington, DC, USA, 5–8 December 2016; pp. 1807–1813. [Google Scholar]
  27. Li, L.; Qu, X.; Zhang, J.; Ran, B. Traffic Incident Detection Based on Extreme Machine Learning. J. Appl. Sci. Eng. 2017, 20, 409–416. [Google Scholar]
  28. Parsa, A.B.; Taghipour, H.; Derrible, S.; Mohammadian, A. Real-Time Accident Detection: Coping with Imbalanced Data. Accid. Anal. Prev. 2019, 129, 202–210. [Google Scholar] [CrossRef]
  29. Wang, K.; Feng, X.; Li, H.; Ren, Y. Exploring Influential Factors Affecting the Severity of Urban Expressway Collisions: A Study Based on Collision Data. Int. J. Environ. Res. Public Health 2022, 19, 8362. [Google Scholar] [CrossRef] [PubMed]
  30. Yang, M.; Liu, R.M.; Liu, Q.; Zhang, H.Y. A Traffic Flow Detection Algorithm in the Intersection Electronic Police System Based on Video. Adv. Mater. Res. 2012, 383–390, 4982–4986. [Google Scholar] [CrossRef]
  31. Wei, W.; Wu, H.; Ma, H. An AutoEncoder and LSTM-Based Traffic Flow Prediction Method. Sensors 2019, 19, 2946. [Google Scholar] [CrossRef] [PubMed]
  32. Baldi, P. Autoencoders, Unsupervised Learning, and Deep Architectures. In Proceedings of the ICML Workshop on Unsupervised and Transfer Learning; JMLR Workshop and Conference Proceedings, Irvine, CA, USA, 27 June 2012; pp. 37–49. [Google Scholar]
  33. Ranjan, N.; Bhandari, S.; Khan, P.; Hong, Y.-S.; Kim, H. Large-Scale Road Network Congestion Pattern Analysis and Prediction Using Deep Convolutional Autoencoder. Sustainability 2021, 13, 5108. [Google Scholar] [CrossRef]
  34. Davila Delgado, J.M.; Oyedele, L. Deep Learning with Small Datasets: Using Autoencoders to Address Limited Datasets in Construction Management. Appl. Soft Comput. 2021, 112, 107836. [Google Scholar] [CrossRef]
  35. Cha, G.-W.; Hong, W.-H.; Kim, Y.-C. Performance Improvement of Machine Learning Model Using Autoencoder to Predict Demolition Waste Generation Rate. Sustainability 2023, 15, 3691. [Google Scholar] [CrossRef]
  36. Hai-tao, L.I.; Zhi-hui, L.I.; Xin, W.; Zhao-tian, P.A.; Zhao-wei, Q.U. Real-Time Automatic Method of Detecting Traffic Incidents Based on Temporal Convolutional Autoencoder Network. China J. Highw. Transp. 2022, 35, 265. [Google Scholar] [CrossRef]
  37. Hyndman, R.J.; Fan, Y. Sample Quantiles in Statistical Packages. Am. Stat. 1996, 50, 361–365. [Google Scholar] [CrossRef]
  38. Zhou, H.; Zhong, Z.; Hu, M.; Huang, J. Determining the Steering Direction in Critical Situations: A Decision Tree–Based Method. Traffic Inj. Prev. 2020, 21, 395–400. [Google Scholar] [CrossRef]
  39. Sun, C.; Hao, J.; Pei, X.; Zhang, Z.; Zhang, Y. A Data-Driven Approach for Duration Evaluation of Accident Impacts on Urban Intersection Traffic Flow. In Proceedings of the 2016 IEEE 19th International Conference on Intelligent Transportation Systems (ITSC), Rio de Janeiro, Brazil, 1–4 November 2016; pp. 1354–1359. [Google Scholar]
Figure 1. Schematic diagram of the intersection entrance accident.
Sustainability 15 08533 g001
Figure 2. Location and appearance of the E-Police.
Sustainability 15 08533 g002
Figure 3. Collection range of the E-Police.
Sustainability 15 08533 g003
Figure 4. The geographical location and geometry of the analyzed intersection.
Sustainability 15 08533 g004
Figure 5. Traffic volume characteristics of different lanes.
Sustainability 15 08533 g005
Figure 6. The standard deviation characteristic of entrance lanes’ traffic volume.
Sustainability 15 08533 g006
Figure 7. The entrance accident identification process.
Sustainability 15 08533 g007
Figure 8. Classification of automatic accident-detection algorithms.
Sustainability 15 08533 g008
Figure 9. Schematic diagram of the autoencoder structure.
Sustainability 15 08533 g009
Figure 10. The location of intersections where traffic accidents have occurred.
Sustainability 15 08533 g010
Figure 11. Loss and RMSE curve of the training.
Sustainability 15 08533 g011
Figure 12. The detection effect of six intersection entrance accidents that occurred at the intersection of Nanjing Rd and Renmin Rd.
Sustainability 15 08533 g012
Figure 13. Reconstruction errors of six intersection entrance accidents that occurred at the intersection of Nanjing Rd and Renmin Rd.
Sustainability 15 08533 g013
Table 1. The E-Police data example (*** represents the last three characters of the car number).
Car
Number
TimeLocationDirectionLane Number
SD C88 ***08:48:52, 8 June 2022the intersection of
Nanjing Rd and Renmin Rd
From north to south3
SD CY0 ***08:48:51, 8 June 2022the intersection of
Nanjing Rd and Renmin Rd
From north to south2
SD C9X ***08:48:50, 8 June 2022the intersection of
Nanjing Rd and Renmin Rd
From north to south5
SD CED ***08:48:50, 8 June 2022the intersection of
Nanjing Rd and Renmin Rd
From north to south4
No license plate08:48:50, 8 June 2022the intersection of
Nanjing Rd and Renmin Rd
From north to south3
Table 2. Passenger car unit (pcu) data extracted from the intersection of Nanjing Rd and Renmin Rd based on E-Police data.
Time
(26 May 2022)
Line 1
(pcu/5 min)
Line 2
(pcu/5 min)
Line 3
(pcu/5 min)
Entrance Lanes’ Traffic Volume Every 5 min per Hour
(pcu/5 min)
8:10–8:153228312.27
8:15–8:203331311.09
8:20–8:253023253.70
8:25–8:302631272.80
8:30–8:353535350.00
8:35–8:403632332.24
Table 3. Accidents’ description.
NumberAccident Location IntersectionOccurrence Time
1Nanjing Rd and Renmin Rd (North entrance)8:56, 3 June 2022
2West Second Rd and Renmin Rd (East entrance)7:47, 1 June 2022
3Shiji Rd and Gongqingtuan Rd (East entrance)17:55, 3 June 2022
4Shanghai Rd and Xincun West Rd (South entrance)21:08, 17 June 2022
5Shanghai Rd and Huaguang Rd (East entrance)7:50, 1 June 2022
6Shanghai Rd and Huaguang Rd (North entrance)8:01, 17 June 2022
7Liuquan Rd and Xingxue Street (East entrance)11:49, 23 June 2022
8Liuquan Rd and Xincun Rd (East entrance)8:37, 8 June 2022
9Liuquan Rd and wangshe Rd (East entrance)18:23, 1 June 2022
10Liuquan Rd and Renmin Rd (East entrance)14:37, 10 June 2022
11Liuquan Rd and Huaguang Rd (North entrance)16:48, 5 June 2022
12Gongqingtuan Rd and Jinjing (Avenue South entrance)19:26, 2 June 2022
13Beijing Rd and Renmin Rd (North entrance)7:02, 6 June 2022
14Beijing Rd and wangshe Rd (South entrance)15:17, 12 June 2022
15Nanjing Rd and Renmin Rd (South entrance)8:12, 1 June 2022
16Jinjing Avenue and Liantong Rd (South entrance)17:06, 1 June 2022
Table 4. The accident identification threshold setting in different periods.
PeriodMean Value of ErrorStandard Deviation of Error90% Quantile95% Quantile99% Quantile
The morning peak period1.34922.43494.26.312.5
The daylight off-peak period1.26532.04492.84.810
The evening peak period1.41292.46584.15.911.9
Table 5. The accident-detection performance effects of different algorithms.
ModelAERFSVM
DR
(%)
The morning peak period94.3389.3090.15
The daylight off-peak period81.6478.5980.15
The evening peak period95.4789.5290.01
FAR
(%)
The morning peak period5.9920.1319.69
The daylight off-peak period12.5522.1420.45
The evening peak period6.5622.6721.43
MTTD
(min)
The morning peak period3.965.235.44
The daylight off-peak period5.296.596.34
The evening peak period4.216.155.61
Disclaimer/Publisher’s Note: The statements, opinions and data contained in all publications are solely those of the individual author(s) and contributor(s) and not of MDPI and/or the editor(s). MDPI and/or the editor(s) disclaim responsibility for any injury to people or property resulting from any ideas, methods, instructions or products referred to in the content.