Article

Electrostatic Precipitator Design Optimization for the Removal of Aerosol and Airborne Viruses

1
Department of Energy and Refrigerating Air-Conditioning Engineering, National Taipei University of Technology, Taipei 10608, Taiwan
2
International College of Semiconductor Technology, National Yang Ming Chiao Tung University, Hsinchu 30010, Taiwan
*
Author to whom correspondence should be addressed.
Sustainability 2023, 15(10), 8432; https://doi.org/10.3390/su15108432
Submission received: 9 February 2023 / Revised: 15 May 2023 / Accepted: 17 May 2023 / Published: 22 May 2023
(This article belongs to the Section Social Ecology and Sustainability)

Abstract

:
In the midst of the COVID-19 pandemic, new requirements for clean air supply are introduced for heating, ventilation, and air conditioning (HVAC) systems. One way for HVAC systems to efficiently remove airborne viruses is by filtering them. Unlike disposable filters that require repeated purchases of consumables, the electrostatic precipitator (ESP) is an alternative option without the drawback of reduced dust collection efficiency in high-efficiency particulate air (HEPA) filters due to dust buildup. The majority of viruses have a diameter ranging from 0.1 μm to 5 μm. This study proposed a two-stage ESP, which charged airborne viruses and particles via positive electrode ionization wire and collected them on a collecting plate with high voltage. Numerical simulations were conducted and revealed a continuous decrease in collection efficiencies between 0.1 μm and 0.5 μm, followed by a consistent increase from 0.5 μm to 1 μm. For particles larger than 1 μm, collection efficiencies exceeding 90% were easily achieved with the equipment used in this study. Previous studies have demonstrated that the collection efficiency of suspended particles is influenced by both the ESP voltage and turbulent flow at this stage. To improve the collection efficiency of aerosols ranging from 0.1 μm to 1 μm, this study used a multi-objective genetic algorithm (MOGA) in combination with numerical simulations to obtain the optimal parameter combination of ionization voltage and flow speed. The particle collection performance of the ESP was examined under the Japan Electrical Manufacturers’ Association (JEMA) standards and showed consistent collection performance throughout the experiment. Moreover, after its design was optimized, the precipitator collected aerosols ranging from 0.1 μm to 3 μm, demonstrating an efficiency of over 95%. With such high collection efficiency, the proposed ESP can effectively filter airborne particles as efficiently as an N95 respirator, eliminating the need to wear a mask in a building and preventing the spread of droplet infectious diseases such as COVID-19 (0.08 μm–0.16 μm).

1. Introduction

The rapid spread of COVID-19 around the world early in 2020 has led to new issues on air quality. The World Health Organization (WHO) argues that the risk of infection with COVID-19 can increase in crowded, poorly ventilated spaces, and aerosols containing bacteria and viruses enter the body through the respiratory system [1].
COVID-19—transmitt ed through droplets—can float up to 6 feet (Approximately 183 cm) in the air and then spread, when it is attached to the aerosols exhaled along with droplets by an infected person or to those suspended in the air, according to the U.S. Centers for Disease Control and Prevention (CDC). To prevent the inhalation of aerosols with COVID-19, it is important to improve the ventilation of indoor spaces [2], and for buildings, this can be achieved by introducing heating, ventilation, and air conditioning (HVAC). Yet, an HVAC system that serves an entire building must be rigorously designed, lest it facilitates the spread of COVID-19.
As the COVID-19 pandemic continues to persist, people are increasingly focused on filtering bacteria and viruses from the air. Many HVAC systems available in the commercial air purifier market use high-efficiency particulate absorbing (HEPA) filters to remove sources of infection in the air, and such filters, made of nonwoven fabrics, are designed to eliminate the fine particulates in the air and trap airborne bacteria and aerosols. HVAC systems can also be equipped with an ultraviolet germicidal lamp or ozone generator to improve their sterilization performance. However, because a HEPA filter captures particles through fabric pores, the pores are susceptible to being blocked by trapped particles, which can lead to increased pressure drops and weaker ventilation performance—thus making it necessary to replace the filter frequently.
As various industries and urban areas continue to emit increasing amounts of ultrafine particles, which are more likely to penetrate the lungs due to their size, equipment such as electrostatic precipitators (ESPs) is a good filtration method for removing nanoscale aerosols. This issue has been extensively discussed by De et al. [3] and others. The ESP collects dust through Coulomb’s law and the Van der Waals force, which allow it to charge suspended particles in the air and adsorb them onto oppositely charged collection plates. Therefore, this device can not only collect dust effectively [4], but it can also facilitate ventilation by inducing small pressure drops [5,6]. Electrostatic precipitation involves eliminating aerosols suspended in the air; it can achieve sterilization by ionization and electroporation to halt the spread of bacteria or viruses.
However, the ESP technology used in the past has been controversial since it produces ozone with a pungent odor. This is because the advanced discharge process can cause a portion of the oxygen in the air to decompose into unstable oxygen atoms, which then combine with oxygen molecules to form ozone and thus can cause health hazards when ozone is at excess levels [5,7]. Harnessing the rapid advancement of technology, recent studies have shown that to improve the ozone problem in electrostatic dust collection, positive corona needles can be used for discharge to produce ozone levels lower than those produced by negative corona, thereby addressing ozone concerns associated with electrostatic dust collection [5,8]. Therefore, this study used the multi-objective genetic algorithm (MOGA) in conjunction with COMSOL Multiphysics to analyze how the ESP can effectively collect dust and suppress bacteria while meeting safe ozone production levels (below 0.06 ppm/h). A numerical model was created for a two-stage ESP in which the device’s flow and electric fields were simulated through COMSOL Multiphysics and its aerosol collection efficiency was analyzed. By controlling the air flow velocity and varying the voltage to generate different levels of electric field strength, the ability of the ESP to capture airborne bacteria in the air was investigated.
The model’s reliability was determined on the basis of the experimental results. The positive corona discharges from the ESP were examined in order to identify the optimal combination of air flow velocity and electric fields.

2. Working Principles of the ESP

An ESP electrically charges particles in the air by causing them to collide with ionized gases. This way, the statically charged particles are attracted to a collecting plate and subsequently removed. Particles can be charged and collected simultaneously, as Arif et al. [9] have demonstrated with their model, in which particles are charged negatively—the whole process is performed through a one-stage ESP (Figure 1). The one-stage ESP consists of two sets of electrodes, with discharging electrodes installed between two collecting plates. The flowing air serves as the medium between the electrodes, so that when high-voltage power is fed to the precipitator, air molecules are ionized, producing abundant free electrons and ions, and airborne particles collide with the electrons, which then attach themselves to the particles and charge them. Moreover, the charged particles carry ions with the same polarity because of the polarity of the discharging electrodes, and they shift toward the collecting plates, which have opposite polarities. To improve the collection efficiency of airborne particles in the one-stage ESP, where ionization and collection sections share electric fields, many studies have proposed increasing the voltage of charging electrodes to intensify the electric fields [10,11,12,13].
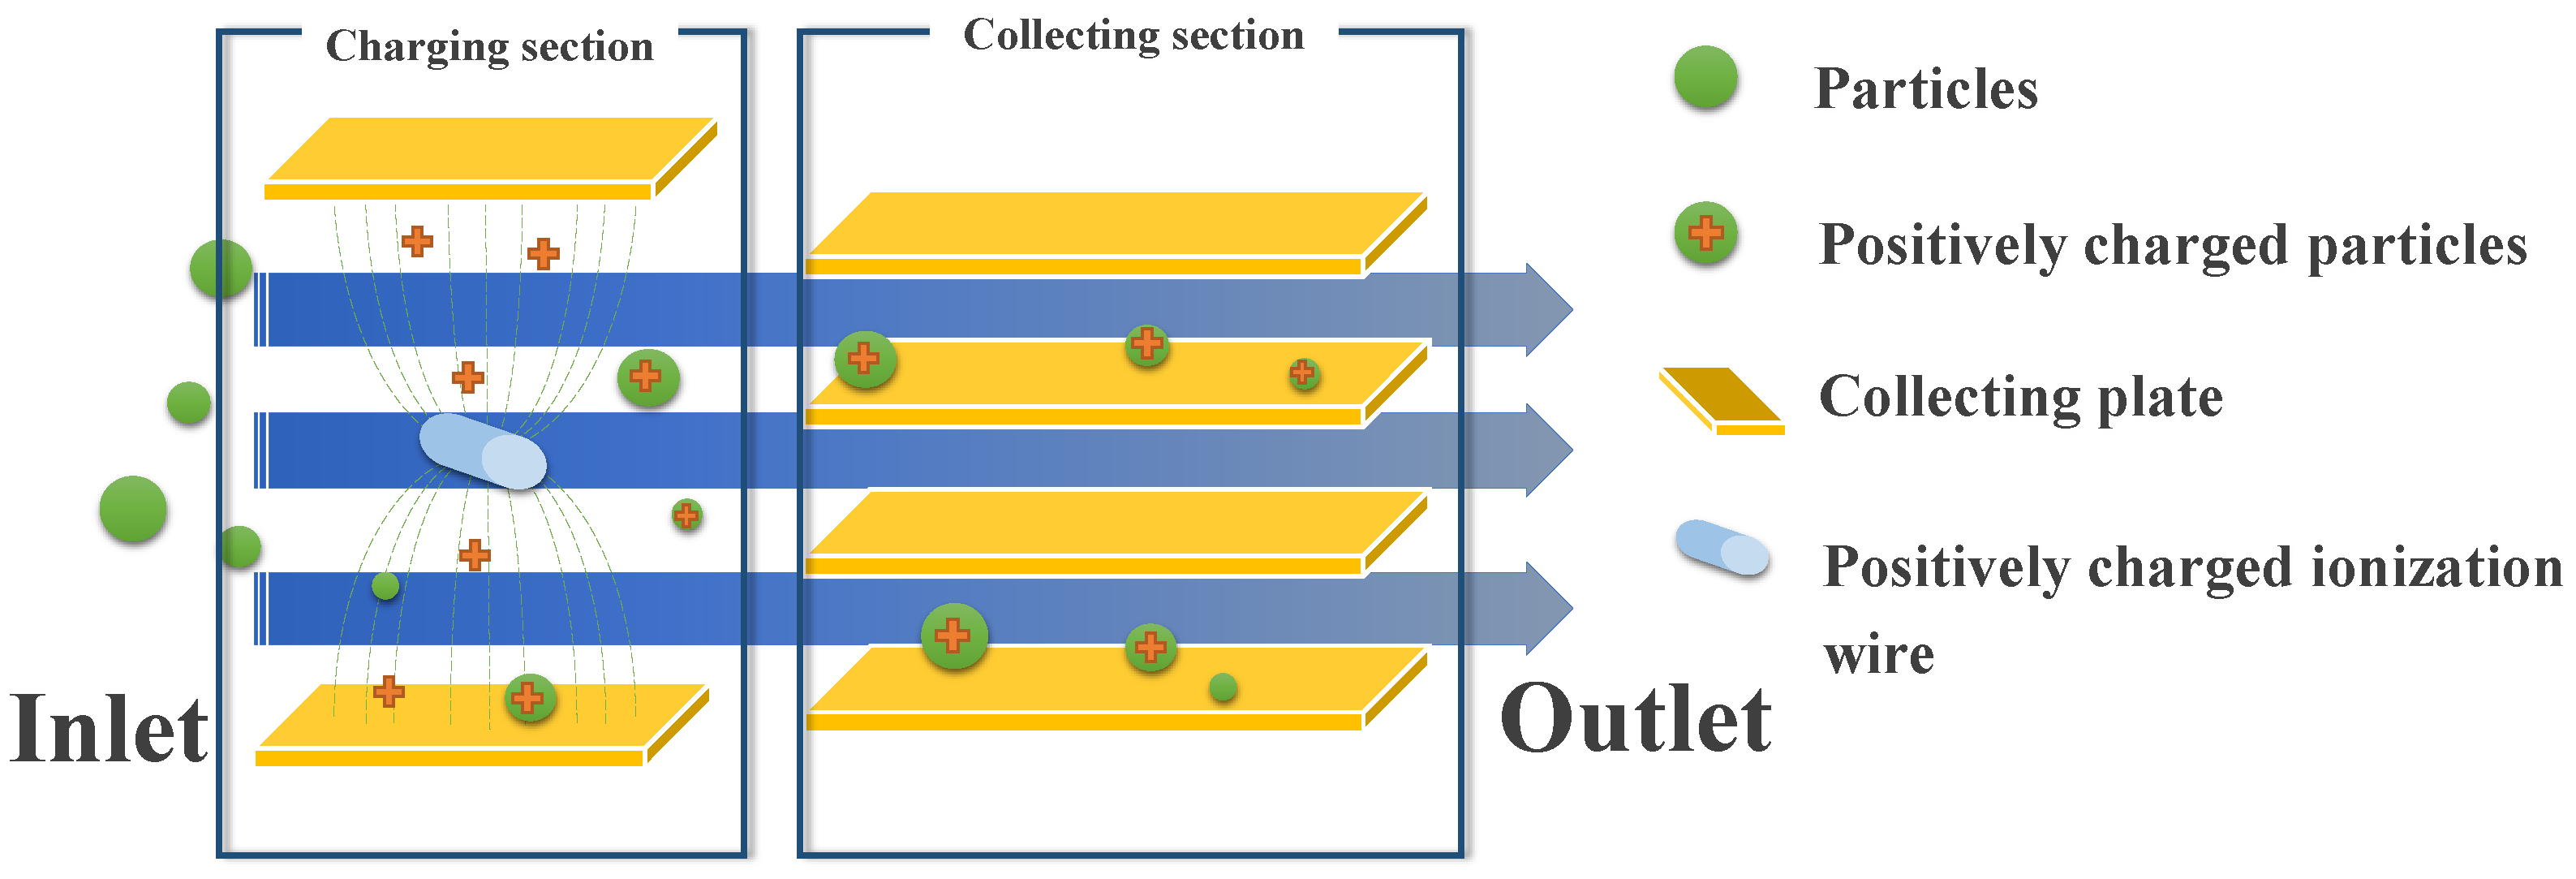
The present study demonstrated a positively charged two-stage ESP, whose mechanism is shown in Figure 2. Between the 1970s and 1980s, Masuda et al. proposed an ESP that consisted of charging and collecting sections, a design intended to achieve higher collection performance [14,15]. Within this precipitator, the particles first pass through the ionization section (which has a positively charged ionization wire). Then the ionization wire generates point discharges, inducing collisions between ionized gas molecules and particles in the air and causing the particles to carry positive electric charges. So, when air currents that carry particles with positive electric charges pass through a collecting section formed by high voltage differences, the particles are attracted to a negative electrode collector through the Coulomb force. Such a design allows the two-stage ESP to collect more dust than its one-stage equivalent.

2.1. ESP Sterilization through Particle Collection

Sterilization refers to a process whereby the growth of microbes is prevented or inhibited. Based on this rationale, the spread of viruses, which prey on the cells of living hosts, can be halted if their host dies or when the droplets or aerosols carrying the viruses are removed. Thus, in this study, collecting plates were used to capture aerosols and sterilization was performed through both electroporation and ionization.
Airborne bacteria or particles that carry bacteria are themselves electrically charged. They can alternatively be charged when passing through the charging section of an ESP; in this case, they shift along with air currents to the collecting section and attach themselves to the collecting plates after positive and negative electric charges attract each other through the Coulomb force.
Li and Gopalakrishnan [16] performed Langevin Dynamics simulations and experiments to examine the relationships between the shapes (spheres, aggregates, and cylinders) and diffusion charging of bioaerosols, and they proposed models describing the collisions and Coulomb interactions between arbitrary-shaped particles, neutral particles, and ions, and calculating the bipolar and unipolar charge distributions of spherical and non-spherical particles.
Considering the charged nature of bioaerosols, as well as the effects of bacteria and virus sizes on the ESP collection efficiency [10,17,18,19], we presented a summary of the sizes of different microbes (See Table 1 and Table 2), on the basis of an electron microscopic atlas of clinical microbes published by the Centers for Disease Control in Taiwan.
As Table 1 and Table 2 suggest, the viruses and bacteria that can be transmitted by air have a size of 0.1 μm–5.0 μm. This size range was used as a parameter for simulations performed with COMSOL Multiphysics to estimate the proposed ESP’s efficiency in collecting aerosols.

2.2. Sterilization by Electroporation

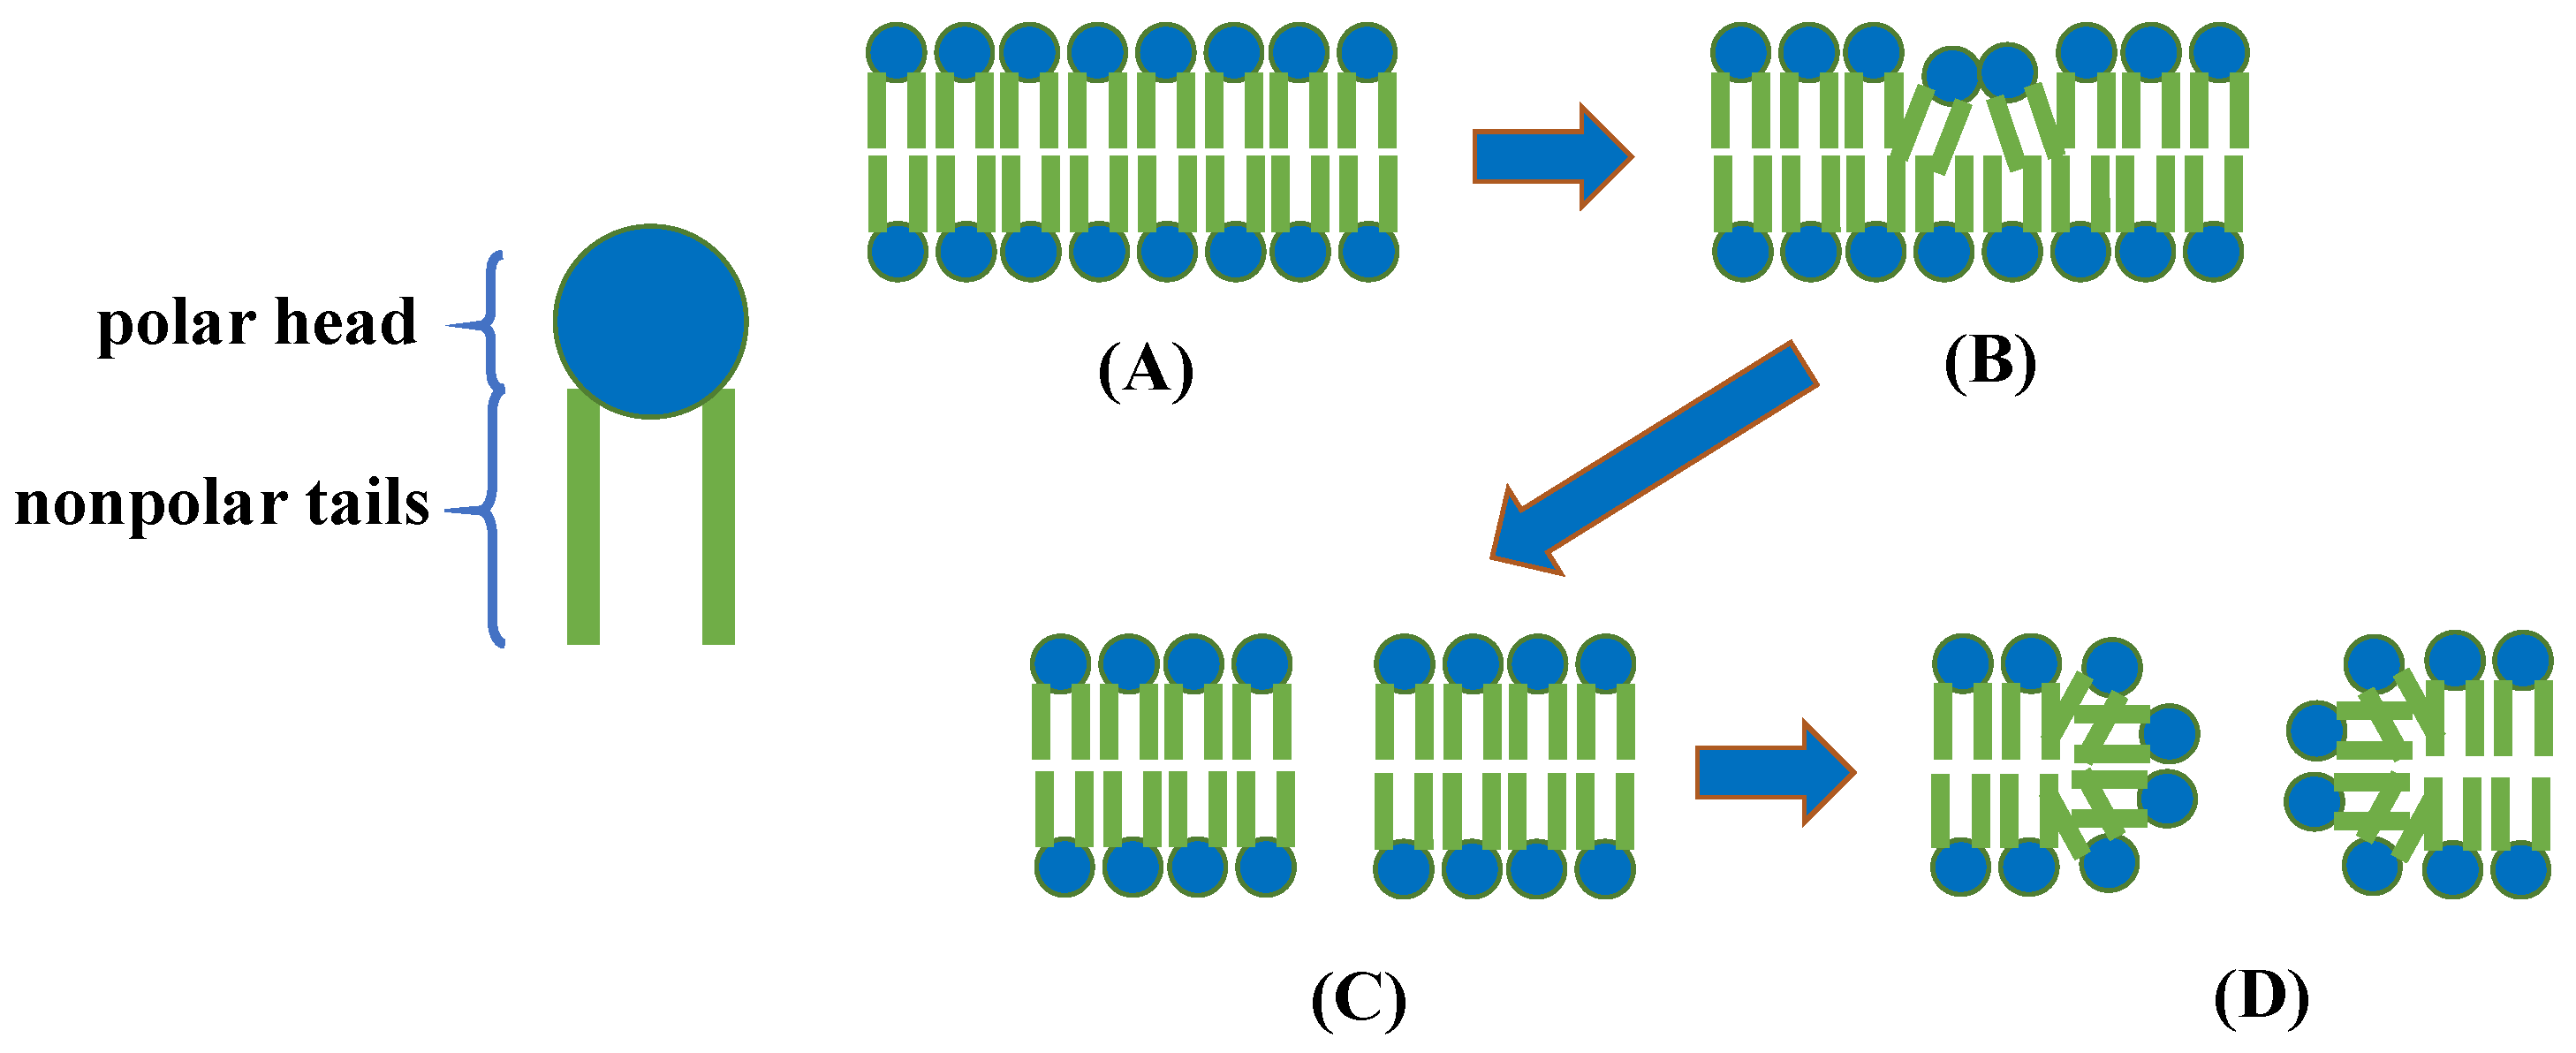
Electroporation occurs when an electric field is applied to a cell and tiny pores subsequently form on the cell’s membrane because of changes in electric potential. Electroporation can be either reversible or irreversible. Reversible electroporation causes the external electric field to close, allowing cells to return to the closure state and thus survive. With regard to irreversible electroporation, cells perish because permanent pores form on them or the cells themselves take too much time to close, thus exposing the matters within the cells. Phospholipids, which consist of hydrophobic chains and hydrophilic headgroups, are an integral part of membranes. This is because when the external electric field induces a transmembrane potential to exceed 1 V [21] the hydrophilic headgroups are attracted by dipoles within the field and oscillate along the normal direction—so that the lipid bilayer is compressed, sags, and recovers after sagging, which in turn creates hydrophobic pores aligned by hydrophobic chains [22]. The whole process is illustrated in Figure 3. In (Figure 3A) Lipids spontaneously form a bilayer, i.e., a sheetlike structure two molecules thick, with the nonpolar tails oriented inward and the polar heads pointing outward. (Figure 3B,C) The formation of pores happens and the stabilization of the pores is based on the transition from the hydrophobic to the hydrophilic pore form. (Figure 3D) The pores then become discernible and separated at membrane voltages above 500 mV.
Kotnik et al. argued that to achieve a transmembrane potential between the cell radius and the external electric field, the shorter the radius is, the stronger the field will become [23]. Moreover, if an electric field is applied to nonspherical cells, the pointed parts of the cells are more subject than the flat parts to electroporation.
When an ESP generates corona discharges—with the reactive oxygen species produced by the surrounding air—positive ions are attracted to the negative electric charges carried by cell surfaces, causing the charges to be repositioned, leading to changes in the structure of cell membranes, and thus killing bacteria [24].

2.3. ESP’s Role in Preventing the Spread of Airborne Viruses

As Figure 4 shows, the ESP sterilizes the virus by capturing the aerosols that carry it or killing the host. Since viruses need to reproduce within the host cells, the ESP can perform electroporation or ionization to kill their host cells, preventing them from surviving on their own. This apparatus uses either process to eliminate aerosols that carry viruses.

2.4. Factors Influencing the Dust Collection Efficiency of ESPs

The ESP technology captures particles suspended in the air by utilizing an electric field to generate a magnetic field and charge the particles. The flow field, electric field, and particle size of the suspended particles play important roles in the ESP dust collection efficiency.
Numerous studies have discussed the dust collection efficiency of ESPs by varying the internal voltage and particle size, or by increasing the number of channels to improve particle charging rates. Generally, when the voltage is increased, the magnitude of the electric field strength increases, resulting in a lower capture rate for larger particles than for smaller particles. However, when the charged particle diameter is less than 1 μm, diffusion charging becomes the main charging method. Although Brownian diffusion causes particle fluctuation, it does not affect the main direction of particle motion. The ion migration rate decreases with increasing particle size, and although the charging efficiency improves with increasing particle size, it may theoretically lead to a decrease in the overall capture rate.
Regarding the discussion on flow rate and dust collection efficiency, previous studies have shown that assuming a constant air flow velocity, the larger the particle size is, the more charge is accumulated on the particles, and the higher the collection efficiency. However, when the air flow velocity increases, particles are more likely to penetrate the ESP [6,8,18].
In recent years, there has been a thorough analysis of the effects of electrode polarity, flow rate, applied voltage, and particle size on particle charging and the electrostatic field [19,25]. It has been concluded that ESP dust collection efficiency is affected by particle size, electric field strength, and flow field velocity. The stronger the electric field is, the greater the particle-charging effect, the stronger the Coulomb force, and the higher the collection rate. The higher the flow rate, the more easily particles penetrate the ESP. Particle-charging methods are divided into diffusion charging for particles under 0.2 μm, field charging for particles exceeding 1 μm, and mixed charging for particles between 0.2 μm and 1 μm. The larger the particles, the greater the charging effect, the more easily particles are driven by the Coulomb force towards the collection plate and adsorbed, resulting in a higher collection rate with increasing particle sizes.

2.5. Simulation of Particle Movement Trajectories

Multi-field-coupled numerical simulation aids in presenting the complex features and advantages and disadvantages of a system. It presents a simulation of particle motion trajectories (which cannot be observed by the naked eye) and the inter-particle force effects. This way, the effects of relevant parameters on the system and the mechanism of particle operation can be analyzed.
Long and Yao [26] compared nine particle-charging models to determine model convergence time and accuracy and analyzed numerical results against experimental data. It was later argued that the 1996 Lawless [27] model was most suitable for predicting the internal particle charging state of ESPs.
Farnoosh et al. [28] employed the finite element method (FEM), the flux-corrected (FC) transport method, and the finite volume method (FVM) to establish a numerical method and simulation program for simulating particle motion trajectories under static electric fields and turbulent flow fields during corona discharge. They used the CFD simulation software FLUENT to perform simulations and calculated gas flow rates using the k-ε turbulence model, the Reynolds-averaged Navier-Stokes equations (RANS), and coupled electric field and charge transport equations. The motion trajectories of particles with diameters of 1 μm, 5 μm, 10 μm, and 50 μm were calculated using the Lagrangian approach, and the ESP’s internal dust collection efficiency was analyzed. The simulation results, compared with past experimental results, all indicated that electrohydrodynamics (EHD) had a small effect on particles with a diameter larger than 1 μm and that the flow field was mainly influenced by the main air flow velocity of 1 m/s. After an overall analysis of the dust collection rate, EHD can be ignored.
Kasdi [29] performed numerical modeling COMSOL Multiphysics to compare different experimental results in order to enhance the ESP dust collection efficiency; the author also investigated the effects of corona current, current density, and voltage on ESP dust collection. The author concluded that increasing the number of discharge electrodes can improve the ESP dust collection efficiency and using the predicted results from COMSOL Multiphysics can shorten research time, with the simulation results in agreement with experimental data.
Xiong et al. [6] simulated the internal flow field, electric field, and particle tracking in ESPs using COMSOL Multiphysics, and verified the model with experiments. They argued that the force on the particles can be ignored compared with the effects of drag force and electrostatic force, and they showed that as flow velocity remains constant, larger particles are more easily captured. Although particle accumulation does not affect the flow field, it weakens the electric field, and as the flow velocity increases, the particle trajectories show a tendency to overflow from the collection zone.
Zhang et al. [30] established a numerical simulation method to study the internal airflow, corona discharge, and particle charging in ESPs in order to improve collection efficiency, and their comparison between particle trajectory simulation with Particle Image Velocimetry (PIV) showed that particle trajectories follow the same motion law. In the electric field, particles move along parabolic trajectories to the collection plate. With the addition of magnetic confinement force, the pattern of particle movement is observed to prolong the residence time of particles in ESPs.
Ito et al. [31] simulated the charged particle trajectory in an ESP, calculated the particle charging rate using the principle of electric field charging and diffusion charging, and compared the results against PIV. The results showed that the electric potential in the ESP increased with the particle movement speed.
Clack [32] used COMSOL Multiphysics to simulate uniform particle settling in an ESP and analyzed several geometric and average particle size parameters. Particle sizes of 20 μm, 50 μm, and 100 μm were used as parameters, and governing equations for each physical quantity were proposed in the study.
Zhou et al. [33] developed a COMSOL Multiphysics numerical model of an ESP to investigate the effects of different geometric collector plates on the ESP’s electric field, ion wind, and collection efficiency. The model was validated with experimental data from the literature.
Kılıç et al. [34] investigated the collection efficiency of a wire-plate single-stage ESP for particle sizes ranging from 0.02 μm to 10 μm. Fluent was used to study and discuss the effects of the distance between different charging and collecting electrodes, inlet velocity of the mainstream flow, and particle size on the particle collection efficiency and ESP performance. Since the simulated particle size is comparable to that of this study, it can be used as a reference for comparison.
Fattah et al. [35] provided a review of the literature related to optimizing the performance of single-stage and multi-stage ESPs by altering various design parameters and assessing their impact on different performance metrics. The review also investigated the correlation between EHD flow and precipitation performance.
Based on the CFD simulations used in various previous articles related to ESP, we have compiled the governing equations used in Table 3.

3. Experimental and Simulation Setup

3.1. Experimental Setup

This study employed an ESP that performs two-stage positive charging. The device was tested according to JEMA standards, and its ozone emissions and air-borne virus elimination performance were evaluated using particles of the size of E. coli, as stipulated in the standard. Subsequently, the ESP’s collection efficiency for particles of different sizes was verified using a digital model. In the JEMA test environment, experiments were conducted using particles in the range of 0.3 μm–1.0 μm, and the results were compared with the simulation results of the digital model to validate its accuracy.
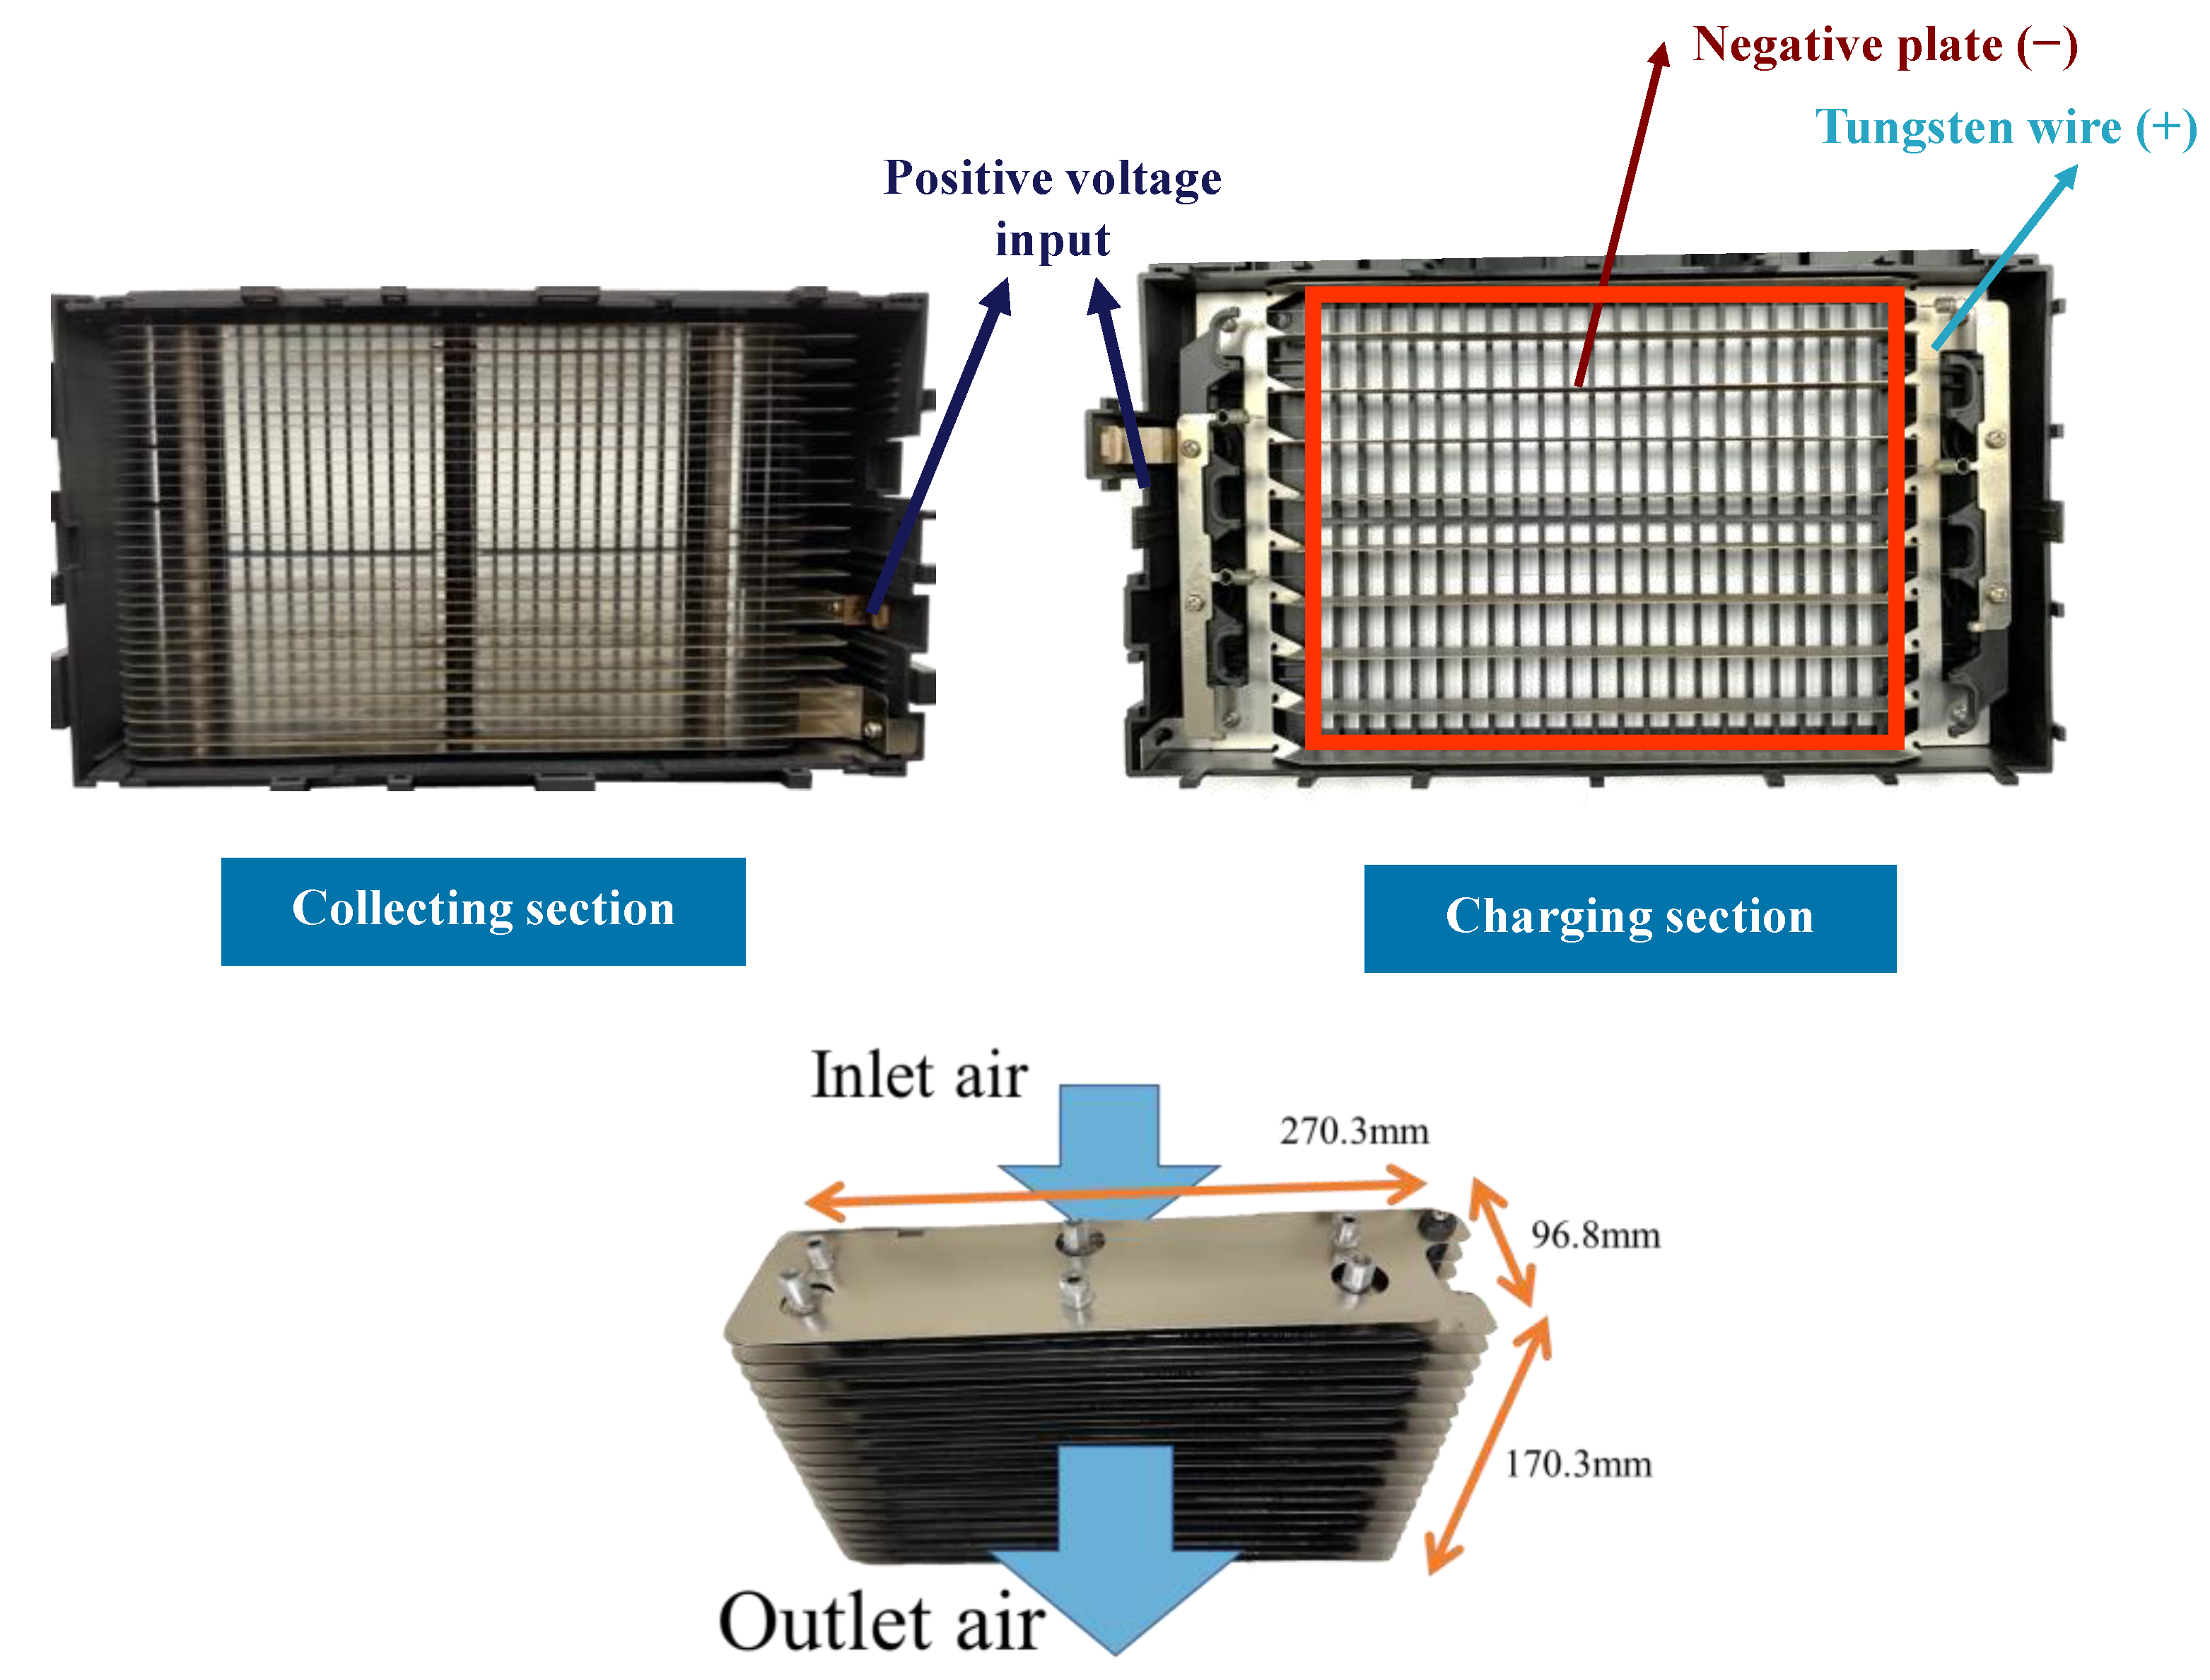
This ESP device measures 270.3 mm in length, 170.3 mm in height, 96.8 mm in width, and weighs 1.15 kg. At an airflow rate of 120 m3/h, the pressure drop was 4 Pa, and the input voltage was AC 110 V. The internal piezoelectric power supply generated high voltage output, providing positive pole voltages ranging from 4.7 kV to 6.5 kV and negative pole voltages ranging from 3.1 kV to 4.5 kV. Figure 5 presents an overview of the ESP used in this study.
The ESP’s effective area is highlighted in red in the right portion of Figure 5, with a cross-sectional area of 228.76 cm2. The charging section employs a tungsten wire (with a diameter of 0.12 mm) as the positive ionization electrode, with input voltages of 5.0 kV and 6.5 kV. The discharge is formed by corona discharge between the charging section and the grounded negative electrode. The dust collection section consists of 19 positive plates with input voltages of 3.0 kV and 3.2 kV, and 18 grounded negative plates, which are arranged in an interleaved manner. Plates of the same polarity are connected by stainless steel columns and separated at a distance of 0.7 cm. Due to the interleaved arrangement of positive and negative plates, each pair of plates with the opposite polarity is separated at a distance of 0.35 cm.
Due to the limitations of our research facility, the microbiological experiments under JEMA standards were conducted by the Kitasato Research Center for Environmental Science in Japan. All other experiments were conducted following the guidelines of ISO/IEC Guide 98-6: 2021. The expanded uncertainties were calculated, encompassing both the Type B standard uncertainties and the Type A standard uncertainties associated with the experimental measurements, with an expansion factor of 2 and a confidence level of 95%.

3.1.1. JEMA Standard

An experiment was conducted on the basis of the standards established in July 2011 by the Japan Electrical Manufacturers’ Association (JEMA) for the performance of air cleaners designed to eliminate airborne viruses [36].
Taking into account the WHO’s guidelines and the regulations of managing pathogens safely that are set forth by the Japanese National Institute of Infectious Disease, we conducted a JEMA microbe experiment in which E. coli bacteriophages with a size of 0.02 μm–0.2 μm were used, an E. coli bacteriophage-containing liquid was sprayed in a space of 20 m 3 –32 m 3 , and an ESP was used to collect the bacteriophages.
In the experiment, the indoor temperature was set to 296.15 ± 5 K and the initial relative humidity to 50 ± 10%, a mixer fan was used, and the bacteriophages were captured by a collector placed in the middle of a side wall 120 cm above the floor. The setup of the experiment is illustrated in Figure 6.
Figure 7 describes the procedure for the JEMA experiment. A vaporizer was used to spray 1 mL of E. coli bacteriophage-containing liquid within a space of 25 m 3 at a flow speed of 1.94 m/s, in order to sterilize the E. coli bacteriophage and Influenza A virus H1N1. The whole sterilization experiment lasted for 15 min. To begin with, the mixer fan ran for 2 min, the collector was used to collect the E. coli bacteriophages (at the experimental time of 0 s), and the ESP was activated following the collection process to sample around 10 L of the indoor air for 2 min. The sampling process lasted for 15 min for the experimental (with the ESP) and control (without the ESP) groups, respectively. The collector contained a 20 mL solution of sodium sulfite (Na2S2O3) with a concentration of 0.015%.
After the sampling process was completed, the liquids collected by the collectors respectively set up for the experimental and control groups were diluted by a culture medium (prepared with deionized water) at a ratio of 1 to 10 and used as the sample liquids, which were subsequently left at a temperature of 308.15 ± 1 K for 10 min–20 min to culture E. coli bacteriophages. The liquids were then added with soft Nutrient Broth at 318.15 K, filled into the lower layer of the square culture medium, and cultivated in a petri dish placed upside down for 24 h at 308.15 ± 1 K.

3.1.2. Ozone Generation Standard

This test was conducted at an authorized laboratory in accordance with the CNS 60335-2-65 standard, which specifies the requirements for air-cleaning appliances [37]. (CNS 60335-2-65 is a national industrial standard introduced by the Taiwanese government; it is established based on the international standard IEC 60335-2-65.). Under this standard, the test was conducted in a 2.5 m × 3.5 m × 3.0 m space without any opening on all sides—and with the walls covered by polyethylene sheets, an air cleaner placed 750 mm above the floor in the center of the test setting, the ambient temperature maintained at 298.15 K, and the relative humidity at 50%. Moreover, after the air cleaner operated for 24 consecutive hours, the ozone sampling opening was placed 500 mm from an air outlet to collect samples. The initial ozone concentration measured before the cleaner’s operation was subtracted from the highest measurement; the ozone concentration should not exceed 5 × 10⁶ mL/min after this 24-h test came to an end.

3.2. Simulation Setup

To explore the influence of the flow and electric fields and the sizes of collected particles on the collection efficiency of the ESP’s charging and collecting sections, a two-dimensional numerical model was created taking into account flow speed, the electric field, the charging of particles, and the motions of particles by force. The assumptions for the simulation are described as follows:
  • Simulation base on Cartesian coordinates;
  • Steady flow and electric fields;
  • Time-dependent particle trajectory;
  • No slip condition between the wall and the fluid;
  • The ambient temperature remains at 298.15 K and the reference air pressure is 1 atm (1.01 × 10⁵ pa).
  • A review of studies on sterilization through ESPs suggested that:
  • E. coli carries negative electric charges when it is spread by air [38];
  • when the transmembrane potential of the E. coli cells exceeds 1 V, the cells are killed by electroporation [38,39];
  • viruses and bacteria can be attached to bioaerosols [39,40,41].
On the basis of these assumptions, the present study analyzed the ESP’s collection efficiency and sterilization performance by considering an electroporation process that arises from dramatic changes in electric potential [38,39]—which occur when bioaerosols carrying viruses and bacteria are collected [41,42] or when the ESP absorbs airborne E. coli that carries negative electric charges [38].
The simulation parameters were based on the setup of the JEMA experiment. These parameters are described in Table 4.
Figure 8 depicts COMSOL 2D model of a cross-section extracted from the physical model with a height of 35 mm and depth of 100 mm, as shown in the amber-colored section of the figure. The charging section in this portion covers two sets of ionization wires and three negative plates, while the collecting section covers interlaced positive and negative collecting plates. This model was used to simulate the collection efficiency of the ESP.
In the 2D model of the section, air enters from the left side of the ESP and exits from the right side. The fully-developed flow is defined as the boundary condition for the air inlet, with the average flow speed used as a parameter; and pressure is defined as the boundary condition for the air outlet, with the addition of normal flows and the suppression of reverse flows serving as pressure conditions.
The ESP proposed in this study comprised a charging section in the front and a collecting section in the back. The charging section served as the positive pole when the ionization wire induced high potential and high voltage. The wire interweaved between the upper and lower parts of a negative plate for ground connection to create voltage differences, thereby generating point discharges that in turn would charge particles. The collecting section consisted of a positive late with low potential and high voltage overlapping with a negative plate.

3.2.1. Mathematical Model

The one-way low Reynolds K-epsilon (k-ε) turbulence model (single-phase fluid, spf), which is a built-in module of COMSOL Multiphysics, was used to perform a more accurate analysis of the fluids near the walls and core. The fluids were described through equations for the conservation of mass, momentum, and energy, and additional boundary conditions were defined for the inlet and outlet. Then the RANS equations were adopted to describe the turbulent region within the ESP and the viscous sublayer and transition layer of the walls, with no-slip boundary conditions defined for the walls and the fluid field.
The Poisson’s equation and the current continuity equation were both used to compute the electric field and charge density during a corona discharge. The corona discharge module—which is a physical built-in module COMSOL Multiphysics—was used to couple the following multi-physics modules: space-charge density coupling (SCDC), potential coupling (PC), and the electrode (EL). The initial strength of the corona field was computed on the basis of Peek’s law.
Particles were released at the inlet of the COMSOL model. Meanwhile, considering that the particle-tracing module of COMSOL Multiphysics specifies the particle size as an additional variable, the trajectories of particles within the ESP can be altered by the flow field, resistance, and the force of gravity, and the particle concentration is not high enough to affect flows, this study computed the trajectories of one-way coupled particles within the flow field. The resistance equation, which was coupled with Stokes’ law and the dilution effect, was corrected using the Cunningham correction factor.
  • Electric field
The corona discharge follows the law of conservation of charge and is calculated using Poisson’s equation to determine the movement of charges. The constant flow of charges is described by the continuity equation of current to solve for the electric field at the tip of the ESP.
  • The law of conservation of charge is expressed as:
· J = 0 ,
J = Z q μ i ρ q E + ρ u ,
ε 0 2 V = ρ q ,
  • The current continuity equation in an electric field is expressed as:
μ i ρ q 2 ε 0 V · ρ q + ρ q · u = 0 ,
The space charge density ρ q is calculated using the Lagrangian method to verify the potential in the model.
  • The Poisson’s equation is used as the boundary condition to calculate the normal component of the electrostatic field at the ESP electrode. The boundary condition formula is given as:
n · E = E 0 ,
where E 0 represents the electric field of the electrode and is expressed in the unit of V/m.
  • The electric field at the discharge electrode is calculated using Peek’s law, which is expressed as:
E 0 = E c δ 1 + C r δ r c ,
2.
Flow field
During the simulation, the fluid mechanics is calculated using the governing equations: the mass conservation equation, the momentum conservation equation, and the energy conservation equation.
  • Continuity Equation
u i x i = 0 ,
  • Momentum Equation
t ρ u i + x j ρ u i u j = ρ g i p x i + x j μ + μ t u i x j + u j x i ,
The two equations above are expressed in terms of the spatial coordinate x, with subscripts i and j denoting the components in a Cartesian coordinate system. The terms u, t , ρ , g ,  p , μ , a n d   μ t represent fluid velocity, time, density, gravity, pressure, molecular dynamic viscosity, and turbulent dynamic viscosity, respectively.
  • Energy Equation
u i T x i + x i λ + λ t T x i = 0 ,
where T , λ , a n d   λ t represent temperature, molecular conductivity, and turbulent conductivity, respectively.
In the process of electrostatic precipitation, the airflow carries particles in the air, and after being charged by a high-voltage electric field, the particles are adsorbed onto the collecting plate due to the Coulomb force of the electric field. Therefore, in the present study, the COMSOL Multiphysics module accounted for the fluid flow, electric field, and particle tracking in the flow field.
  • The Reynolds number ( R e ) is used to determine the laminar or turbulent flow for the air purifier tested, and it is defined as follows:
R e = ρ u l μ = u D v k = Q D v k A C ,
  • The Reynolds number ranged from 5512 to 7438. This suggested that the ESP flow in this study was turbulent. The compressibility of the fluid can be determined by the Mach number (M), which is calculated using the following formula:
M = u s u ,
If the Mach number of the flow field is greater than 0.3, the fluid cannot be compressed due to insufficient pressure, and the density of the fluid remains constant with changes in pressure, indicating an incompressible flow field.
3.
Particle tracking in the flow field
Particle motion in the flow field follows Newton’s second law, and the particle positions are determined using a second-order equation for vector components, as expressed by the following formula:
d q d t = v p ,
d d t m p v p = F t ,
  • The motion of particles in the flow field is influenced by drag force, electric field force, and the interaction between particles and the fluid, which can be calculated based on particle mass, density, and diameter. The equation for the particle trajectory is expressed as follows:
d m p v p d t = F D + F E d q d t = v p ,
  • When the fluid medium is continuous, incompressible, and viscous, Stokes’ Law can be used to represent the drag force generated by particles in the fluid motion or the force exerted by the fluid on stationary particles. Under low-Reynolds-number conditions, if the particle velocity is greater than the fluid velocity, the drag force on the particle increases, and the rarefaction effects must be considered for small particle radii. The drag force is expressed as follows:
F D = 1 τ p S m p u v p d q d t = v p ,
τ p = 4 ρ p d p 2 3 μ C D R e r d q d t = v p ,
  • The electric force ( F E ) acting on particles is related to the charge accumulated on the particles. The formula is expressed as follows:
F E = e Z E d q d t = v p ,
The accumulated charge on a single particle ( Z ) is calculated using the Lawless charging model in this study.

3.2.2. Boundary Conditions

When using simulation software to find solutions, one should consider the quality of the grid during its construction and define boundary conditions. Failure to satisfy boundary conditions will directly affect the convergence of a numerical method. Table 5 lists the boundary conditions provided by the COMSOL Multiphysics module for solving partial differential equations.
The gas temperature was set to 298.15 K, considering the JEMA laboratory’s temperature standard of 296.15 ± 5 K. The environmental pressure at the surface was set to 1 atm (1.01 × 10⁵ pa).
The high voltage input to the ESP was set to 5.0 kV and 6.5 kV, while the corresponding low voltage input was set to 3.0 kV and 3.2 kV. These parameters were used when comparing the ESP collection efficiency at different input voltages. The particle size was specified based on the sizes of bacteria and viruses [17,20], and particles’ density, viscosity, and dielectric constant were all defined based on [19].

3.3. Design Optimization

3.3.1. Multi-Objective Genetic Algorithm (MOGA)

The intent of multi-objective optimization is to find all possible trade-offs between multiple objective functions, which may be conflicting. Engineering problems require optimizing objectives and constraints that may conflict with each other. Unlike single-objective optimization problems, the solution to multi-objective optimization problems is a set of solutions called the “Pareto-optimal solutions.” The multi-objective purpose functions can be represented by the following equation, which includes multiple objective parameters:
Maximize/minimize
F x = f 1 x , f 2 x , , f n x ,
Subject to constraints
G i x = 0 , i = 1 , , m
H j x 0 , j = 1 , , m
The functions F x , G x , and H x represent the objective function, equality, and inequality constraints, respectively; n is the number of objectives; x is an n-dimensional vector. The Genetic Algorithm (GA) is a randomized search method based on natural selection and genetic mechanisms. The algorithm involves genes, which are the variables to be optimized, and chromosomes, which represent the solution to the problem. It searches for the best solution from a population of chromosomes to achieve the optimization objective. Its advantages include handling multiple designs simultaneously and obtaining acceptable solutions between the constraints, as these solutions are chosen through probabilistic selection.
The algorithm begins by creating a random initial population and then performs fitness evaluation, selection, crossover, and mutation. If the standards are not met, the algorithm returns to the initial population. Ultimately, the algorithm obtains Pareto solutions.

3.3.2. Multi-Objective Function and Constraints

The MOGA optimization was performed to achieve the design objectives while adhering to constraints. In this study, the “gamultiobj” function in MATLAB (a variant of NSGA-II) was utilized as a solver based on the MOGA to find the best solution in analysis. Specifically, MATLAB was used to obtain the execution results from COMSOL within the constraints and to perform an analysis. The objective of this study was to obtain the optimal dust collection efficiency while maintaining the voltage and air flow velocity under some limitations of ozone generation. A central composite design (CCD) was employed to generate experimental design (DOE) points and perform simulation under constraints. Based on the study by Deb et al. [43] and our own experience from past laboratory research [44], we were able to achieve convergence by setting the maximum allowable Pareto percentage and convergence stability percentage to 95 and 0.00002, respectively.
Previous studies have suggested that higher input voltage and lower flow speed can lead to higher collection efficiency. Yet, the application of an ESP should take into account the apparatus’s efficiency in purifying its immediate environment and the ozone generated during a point discharge. The MOGA was therefore used to determine the optimal combination of flow speed and voltage [45,46]. To avoid breaching the indoor ozone limits defined under the Indoor Air Quality Act in Taiwan, the voltage was restricted to 5 kV to 7 kV and the flow speed to 0.3 m/s–2.7 m/s, in which case the purification process would only take a moderate amount time to complete.
The Handbook of Electrostatic Processes states that because particles of different sizes are charged in different ways, they differ in theoretical migration velocity when charged at a uniform voltage [47]. Moreover, Zhu et al. [19] reported that with the air flow velocity staying at 1 m/s and the voltage at 8 kV, the amount of charge on particles decreased as their sizes grew from 0.1μm to 1.0 μm; thus, larger particle sizes mean lower amounts of charge on particles. However, Pirhadi et al. [18] examined the ESP collection efficiency in experiments that involved particles of 0.015μm–2.5 μm, three flow volumes (50 lpm, 75 lpm, and 100 lpm), three flow speeds (0.73 m/s,1.1 m/s, and 1.46 m/s), and a voltage of +12 kV, and compared both predicted and experimental results—observed that the collection efficiency was the lowest for particles of 0.1 μm–0.2 μm, at which they reached the lowest theoretical migration velocity. The authors added that the efficiency decreased as particles of 0.01μm–0.1 μm grew in size, and the efficiency increased with the particles of 0.2 μm–2.5 μm. Given this rationale, the present study used the MOGA to determine the optimal parameters for the average collection efficiency for particles of 0.1 μm–5.0 μm; doing so would prevent the collection efficiency from varying wildly in the presence of particles of different sizes. Figure 9 describes the MOGA used in this study.

4. Results and Discussions

4.1. Standard Test Results

The initial ozone concentration measured before the cleaner’s operation was subtracted from the highest measurement; the ozone concentration should not exceed 5 × 10⁶ mL/min.
The ESP prototype used in this study met the requirements specified in a test report published by Japan Air Cleaning Association [48]. The ESP produced only 0.01 mg/m3–0.02 mg/m3 of ozone (equivalent to 0.005 ppm–0.01 ppm), far lower than the amount of ozone in nature (Table 6). This apparatus met the Taiwanese Environmental Protection Administration’s indoor air quality standard of 0.06 ppm/h [49], but it failed to enable ozone sterilization (for which the ozone concentration must be higher than 0.01 ppm) and was thus excluded from consideration for performing this sterilization process.
The amount of ozone generated q o was determined using the equation for ozone concentration, which is expressed as:
q o = O 2 O 1 × Q w ,
Considering that sterilization entails preventing or inhibiting the growth of microbes, collecting plates were used in this study to capture aerosols and sterilization was performed by electroporation and ionization.
The ESP prototype designed for this study was experimentally proved to have produced ozone in amounts far lower than that in the natural air. Since the ESP did no damage to the human body, we examined how well it could collect aerosols under the JEMA standards. For the JEMA experiment, the ESP was used to collect E. coli bacteriophages of 0.02 μm–0.2 μm from a sprayed liquid.
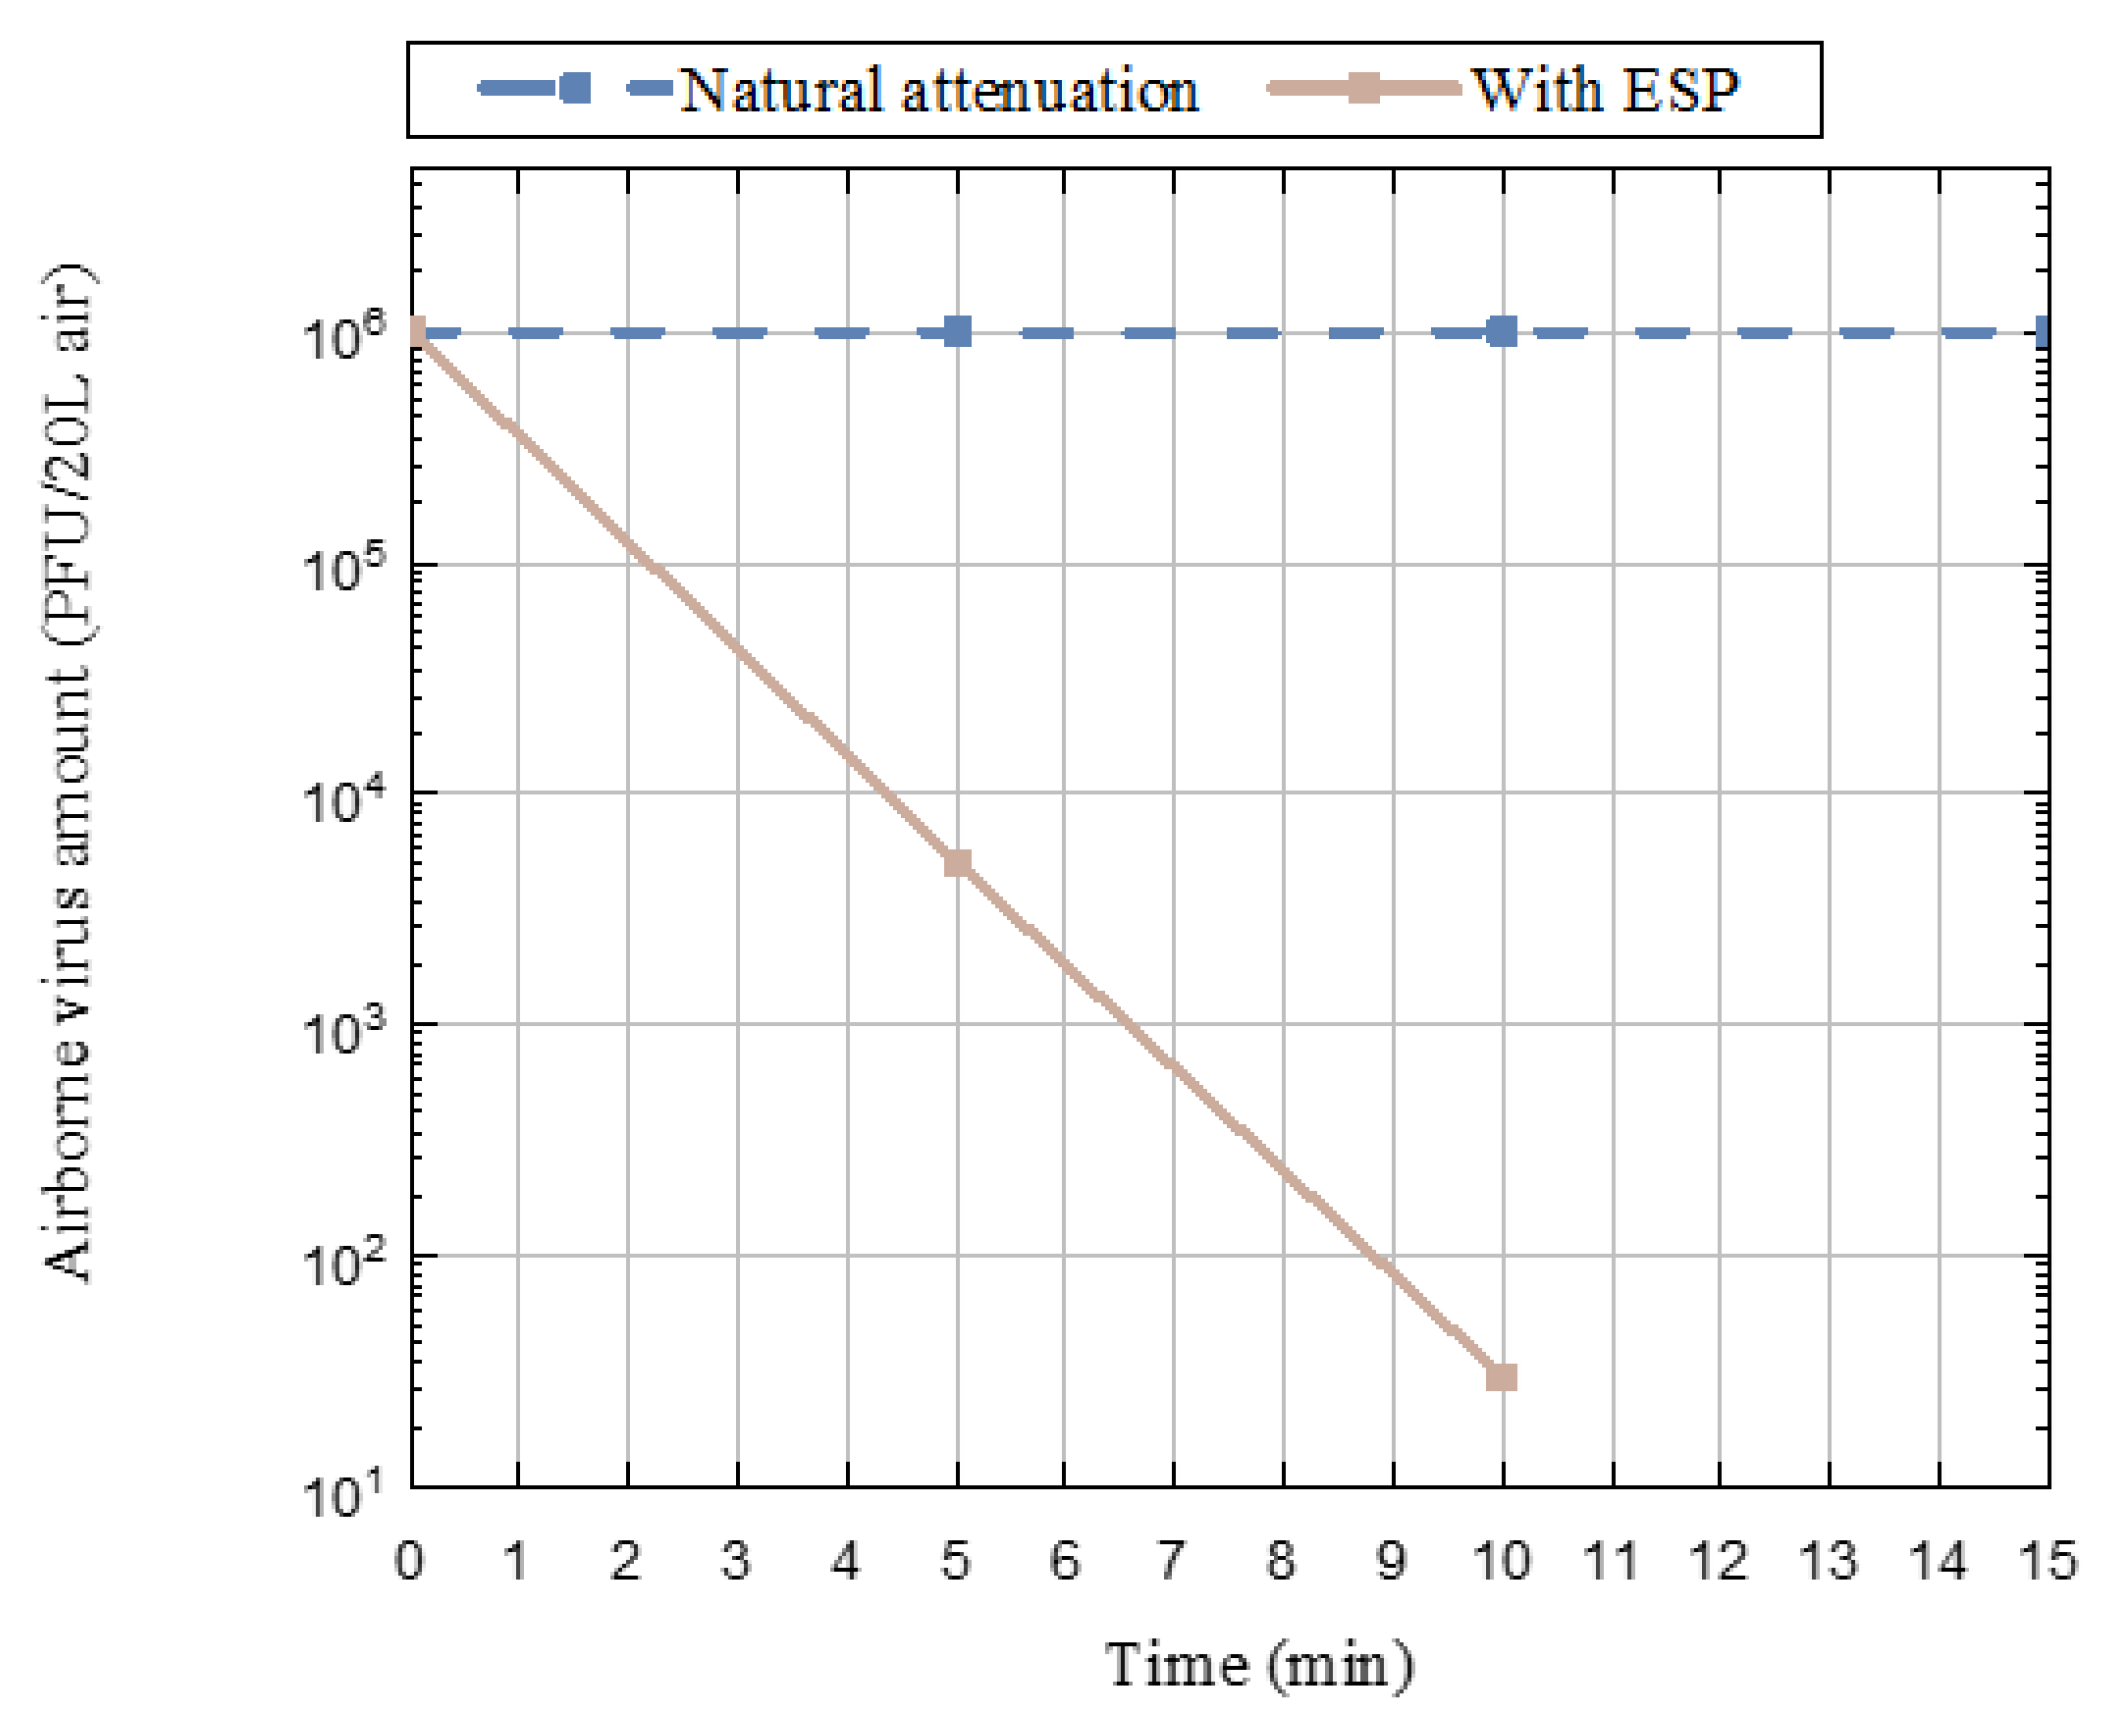
Figure 10 describes the results of the JEMA experiment. Compared with natural attenuation (the control group), the ESP reduced the number of airborne viruses by at least 90% after it operated for around 3 min and by 99% after it ran for 5 min. In particular, when the experiment reached the 15th min, the number of airborne viruses showed a negligible decrease under the natural attenuation condition, but with the ESP, it decreased to below the minimum level measured.

4.2. Validating Experimental and Simulation Results

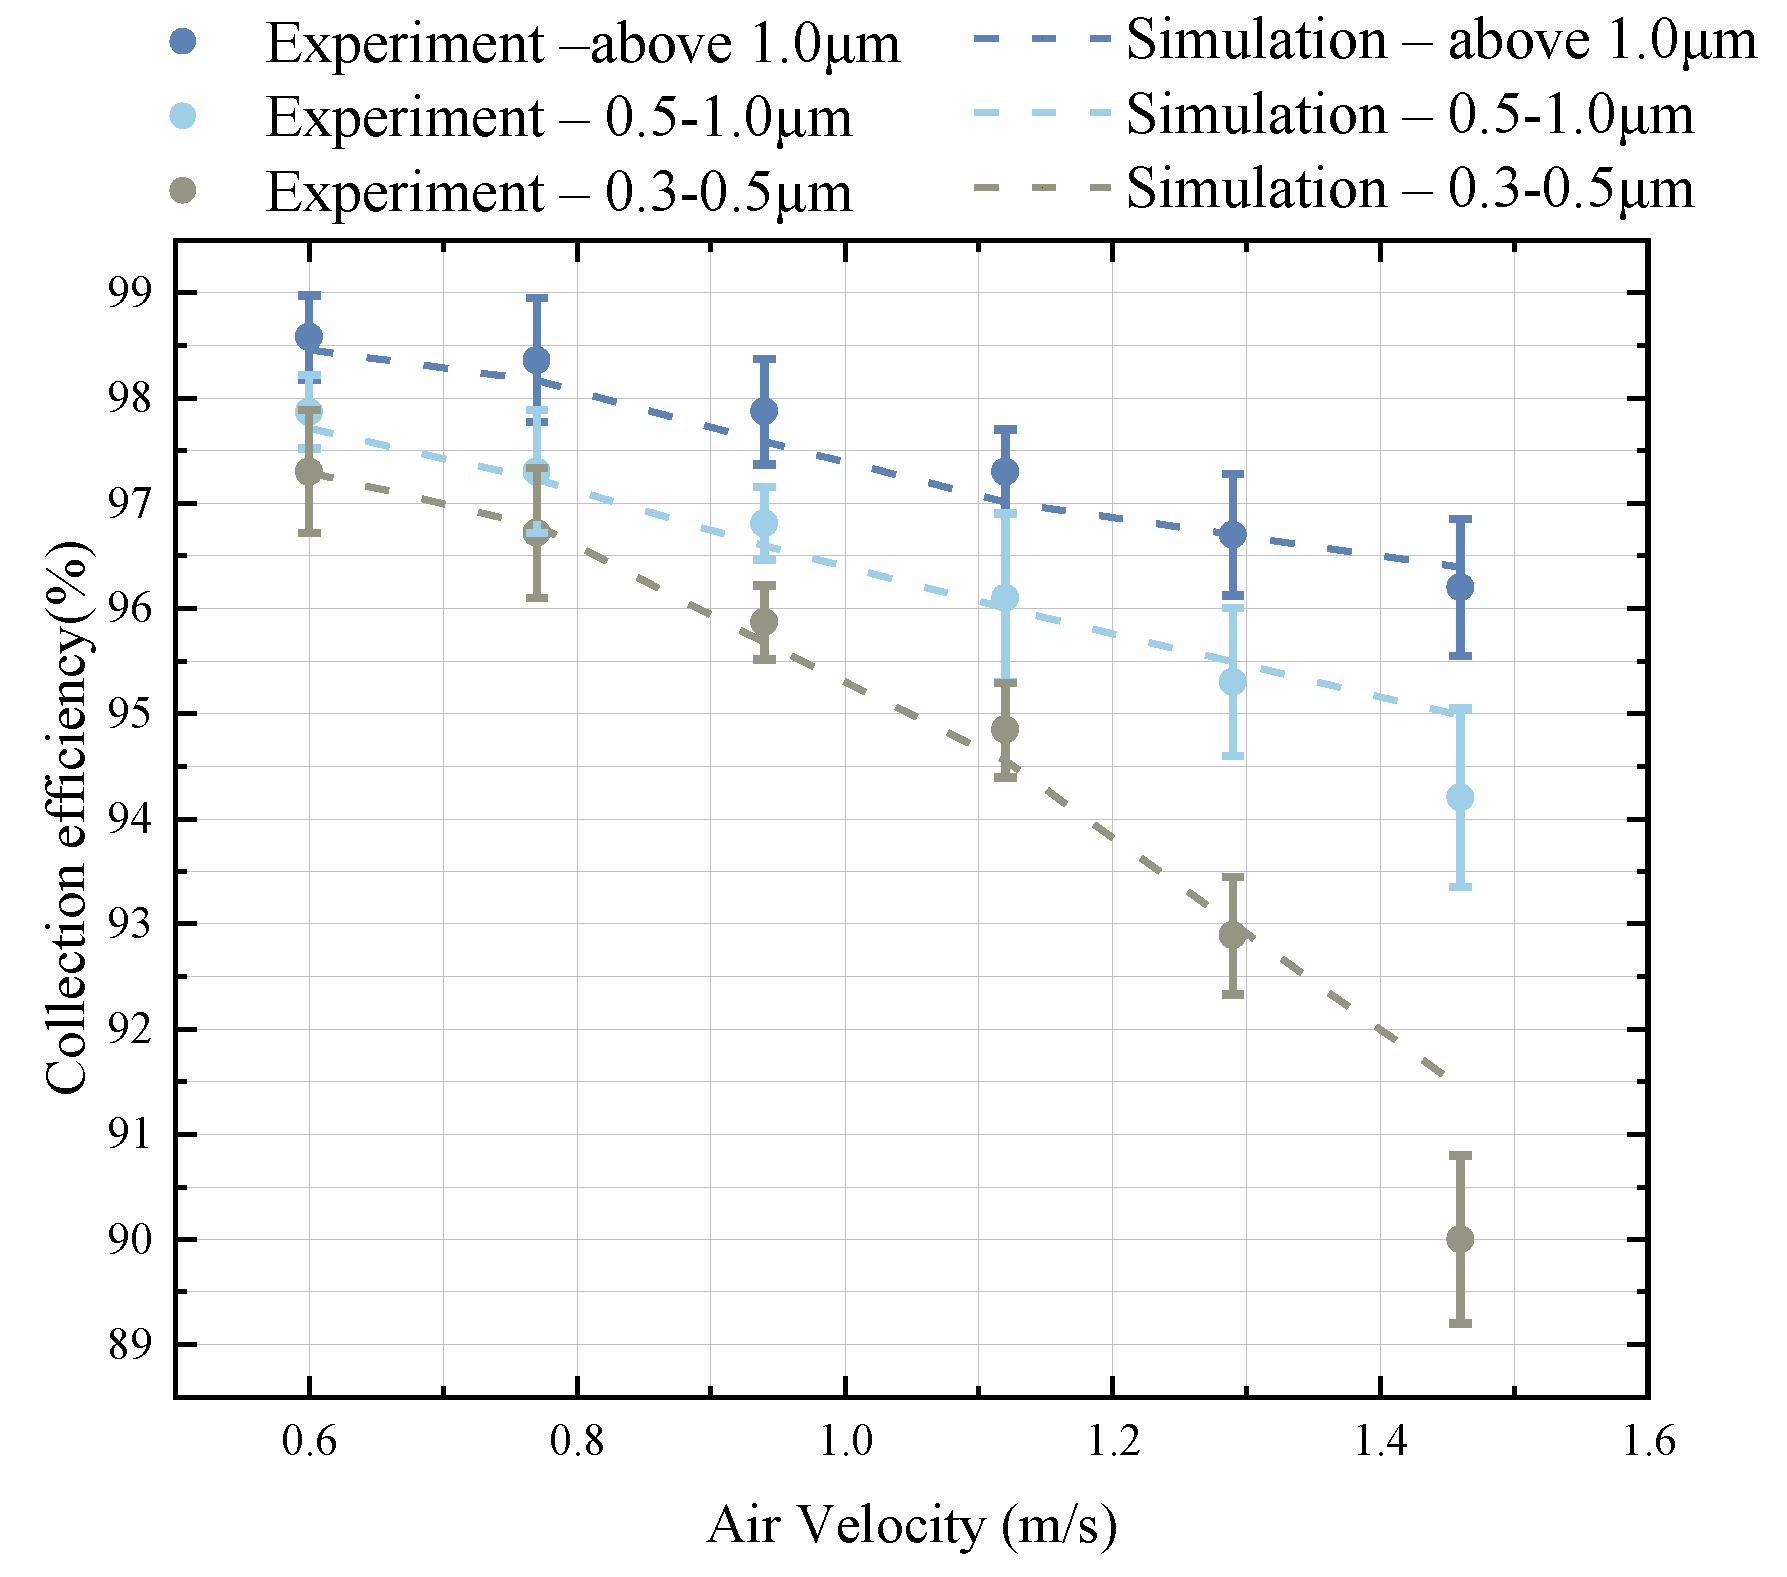
Numerical simulation was performed to investigate the physical changes in the velocity field, electric field, and particle size with respect to dust collection and antibacterial effects in the ESP. To determine the accuracy of the simulation process, the simulation results were compared with experimental data on dust collection. The input voltage was set to 5.0 kV and 3.0 kV, and the airflow rate during the experiment ranged from 70 m3/h to 170 m3/h, which was equivalent to a air flow velocity of 0.60 m/s to 1.46 m/s. Dust with particle sizes of 0.3 μm–0.5 μm, 0.5 μm–1.0 μm, and over 1.0 μm were collected, as shown in Figure 11, where the dots represent the experimental data and the dashed lines represent the simulated values.
Comparing the simulation results against the experimental data on dust collection, it is worth noting that the model used in this study did not consider the effect of electro-hydro dynamics (EHD). However, H. Lei et al. [50] pointed out that particles with a diameter smaller than 0.1 μm are greatly affected by EHD when the particles move in turbulent flow fields. Therefore, our simulation results suggested that when the particle size was 0.3μm–0.5 μm, the collection efficiency was relatively close to the experimental data. And among all the three particle sizes examined, the efficiency was the highest. This finding is consistent with [17,18]. As for particle sizes above 1 μm, the simulation results were not fully in line with the experimental data due to the neglect of EHD, but they showed the same trend. Consistent with previous studies [8,10,24,49], the results indicated that as particle size increases with dust collection efficiency, while higher air flow velocity leads to lower collection efficiency.
Overall, when the particle size was 0.3 μm–1.0 μm, dust collection efficiency increased with the particle size. However, increasing air flow velocity caused the dust collection rate to decrease constantly. The optimal dust collection rate for all three particle size ranges was achieved at an airflow rate of 70 m3/h (0.60 m/s), while the lowest dust collection rate was observed at an airflow rate of 170 m3/h (1.46 m/s). Furthermore, the dust collection rate for the smallest particle size range (0.3 μm–0.5 μm) was found to be most subject to changes in air flow velocity.

4.3. ESP Optimization Results

Based on the experimental results above, numerical simulation was performed to optimize the design of the ESP. Following the optimization process, the ESP achieved a collection efficiency of over 95%, protecting people in a building against COVID-19 and other droplet-transmitted diseases as effectively as an N95 respirator and thus allowing them to walk around without having to wear a mask.
To examine the influence of the flow and electric fields and the sizes of collected particles on the collection efficiency of the ESP’s charging and collecting sections, COMSOL Multiphysics® was used to create a two-dimensional numerical model taking into account flow speed, the electric field, the charging of particles, and the motions of particles by force.
After Reynolds and Mach numbers were determined, the flow field was defined as an incompressible turbulent flow field. Two wind volumes set for the simulation experiment were 120 m3/h and 160 m3/h, equivalent to an average flow speed of 1.46 m/s and 1.94 m/s, respectively. The normal flow speed for the air inlet was specified using the aforementioned parameters. The atmospheric pressure of the air outlet was set to 1 atm (1.01 × 10⁵ pa). The Reynolds-averaged Navier-Stokes (RANS) equations were used to determine the ESP’s efficiency of capturing charged bacteria as flow speed varied.
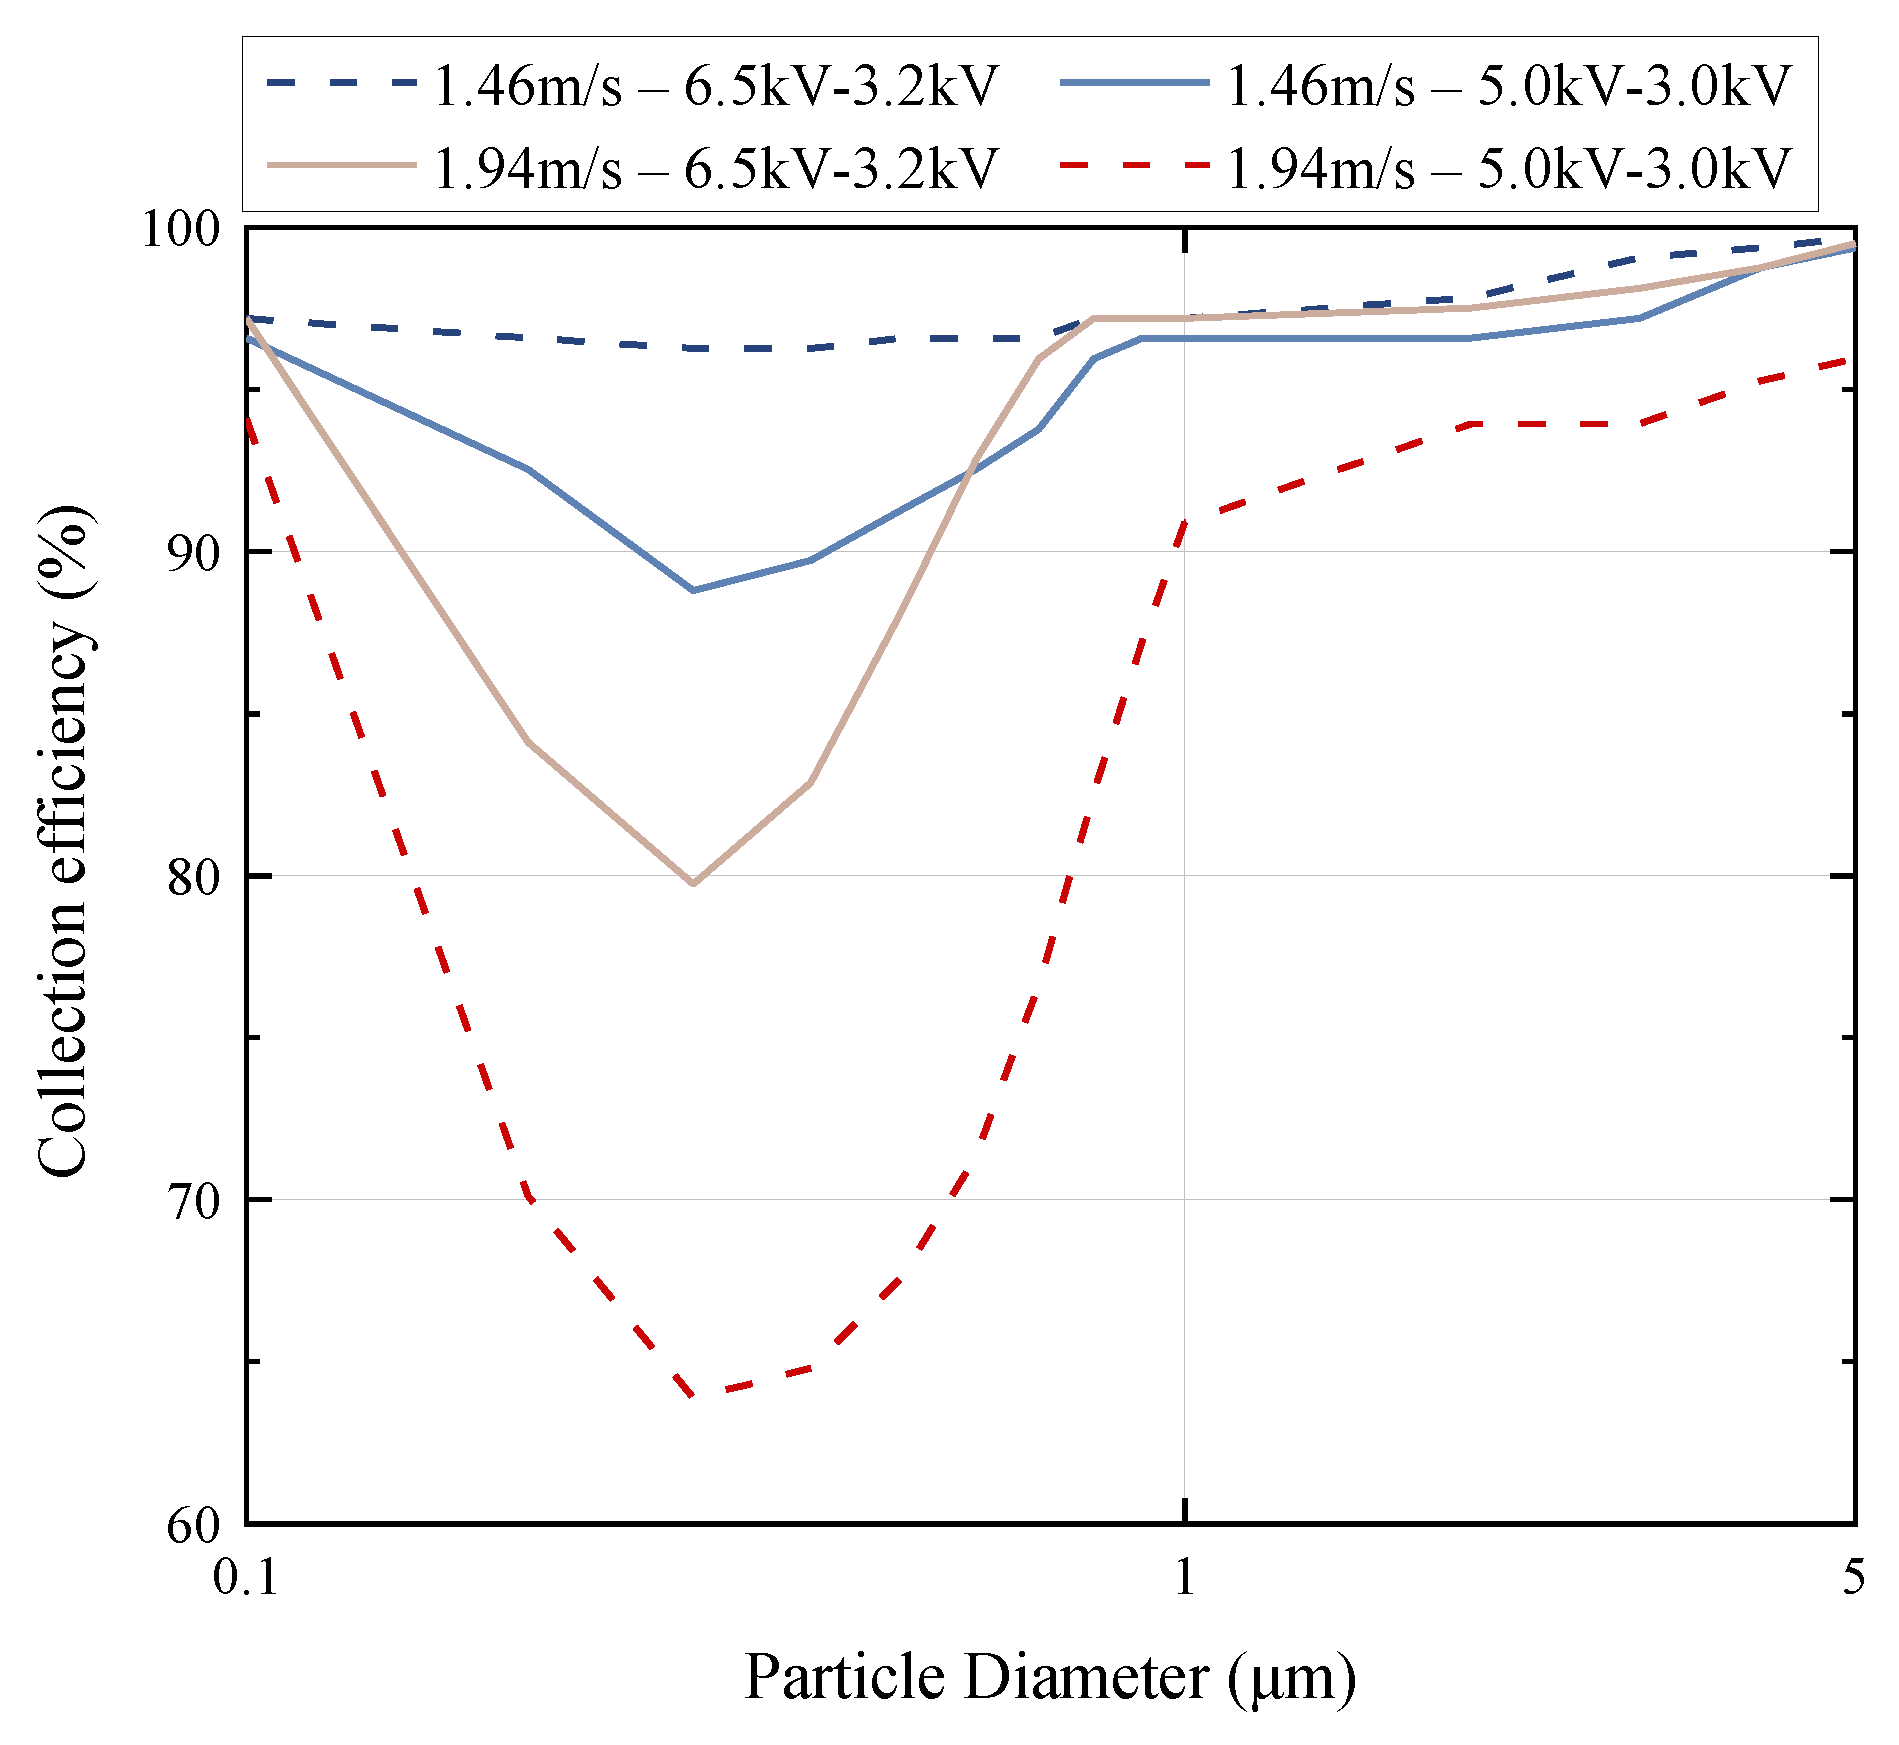
Figure 12 describes the simulated ESP collection efficiency across different combinations of flow speed and voltage levels. The results of the four simulations are summarized as follows:
  • When the particle size was 0.1μm–5.0 μm and the flow speed increased from 1.46 m/s to 1.94 m/s, the ESP’s average collection efficiency decreased by 12.7% at a voltage of 5 kV and 4.1% at 6.5 kV.
  • When the particle size was 0.1μm–5.0 μm and the voltage in the ESP increased from 5 kV to 6.5 kV, the ESP’s average collection efficiency increased by 2.7% at a flow speed of 1.46 m/s and 11.3% at 1.94 m/s.
  • When the particle size increased from 0.1 μm to 0.3 μm at a uniform flow speed and a 5 kV voltage, the ESP’s collection efficiency decreased by 7.8% at a flow speed of 1.46 m/s and 30.2% at 1.94 m/s.
  • When the particle size increased from 0.3 μm to 5.0 μm at a uniform flow speed and a 5 kV voltage, the ESP’s collection efficiency increased by 10.6% at a flow speed of 1.46 m/s and 32.1% at 1.94 m/s.
  • When the particle size increased from 0.1 μm to 0.3 μm at a uniform flow speed and a 6.5 kV voltage, the ESP’s collection efficiency decreased by 0.9% at a flow speed of 1.46 m/s and 17.4% at 1.94 m/s.
  • When the particle size increased from 0.3 μm to 5.0 μm at a uniform flow speed and a 6.5 kV voltage, the ESP’s collection efficiency increased by 3.4% at a flow speed of 1.46 m/s and by 19.7% at 1.94 m/s.
For the model with a flow speed of 1.46 m/s and high voltages of 6.5 kV and 3.2 kV, the collection efficiency was the highest across all conditions, ranging from 96.3% to 99.7%, and it showed the least variation even when the particle size changed. By contrast, for a model with the same flow speed but low voltages of 5.0 kV and 3.0 kV, the collection efficiency was 88.8–99.4%, a difference of 0.3–7.5% from the aforementioned model.
The model with a flow speed of 1.94 m/s and the same high voltages showed a collection efficiency of 79.8–99.5%, ranking third among all the models. The lowest collection efficiency, at 63.9–95.9%, was found in the model with a flow speed of 1.94 m/s and low voltages of 5.0 kV and 3.0 kV, and the efficiency exhibited the most pronounced variations as the particle size changed.
These results indicated that when the flow speed increased from 1.46 m/s to 1.94 m/s at a uniform voltage, particles had their stay time shortened in the ESP and did not sustain adequate collision with positive charges. This in turn led to decreases both in the amount of charge on the particles and the collection efficiency.
Across all four simulation models, the collection efficiency was at its lowest for particles of 0.3 μm. This finding agreed with an observation made by Ning et al. in 2008: that the collection efficiency for particles of 0.1 μm–0.3 μm declines because their theoretical migration velocities decrease as their sizes increase [17]. For particles of 0.1 μm–0.2 μm, which underwent diffusion charging, and those of 0.3 μm, which underwent mixed charging, the collection efficiency decreased as the particle size increased. Moreover, as the flow speed increased, the collection efficiency showed further decreases at a uniform voltage and with larger particles. For particles of 0.3 μm–1.0 μm, which were charged by the electric field, the collection efficiency increased with the particle size. As the flow speed increased, the collection efficiency showed further increases at a uniform voltage and with larger particles.
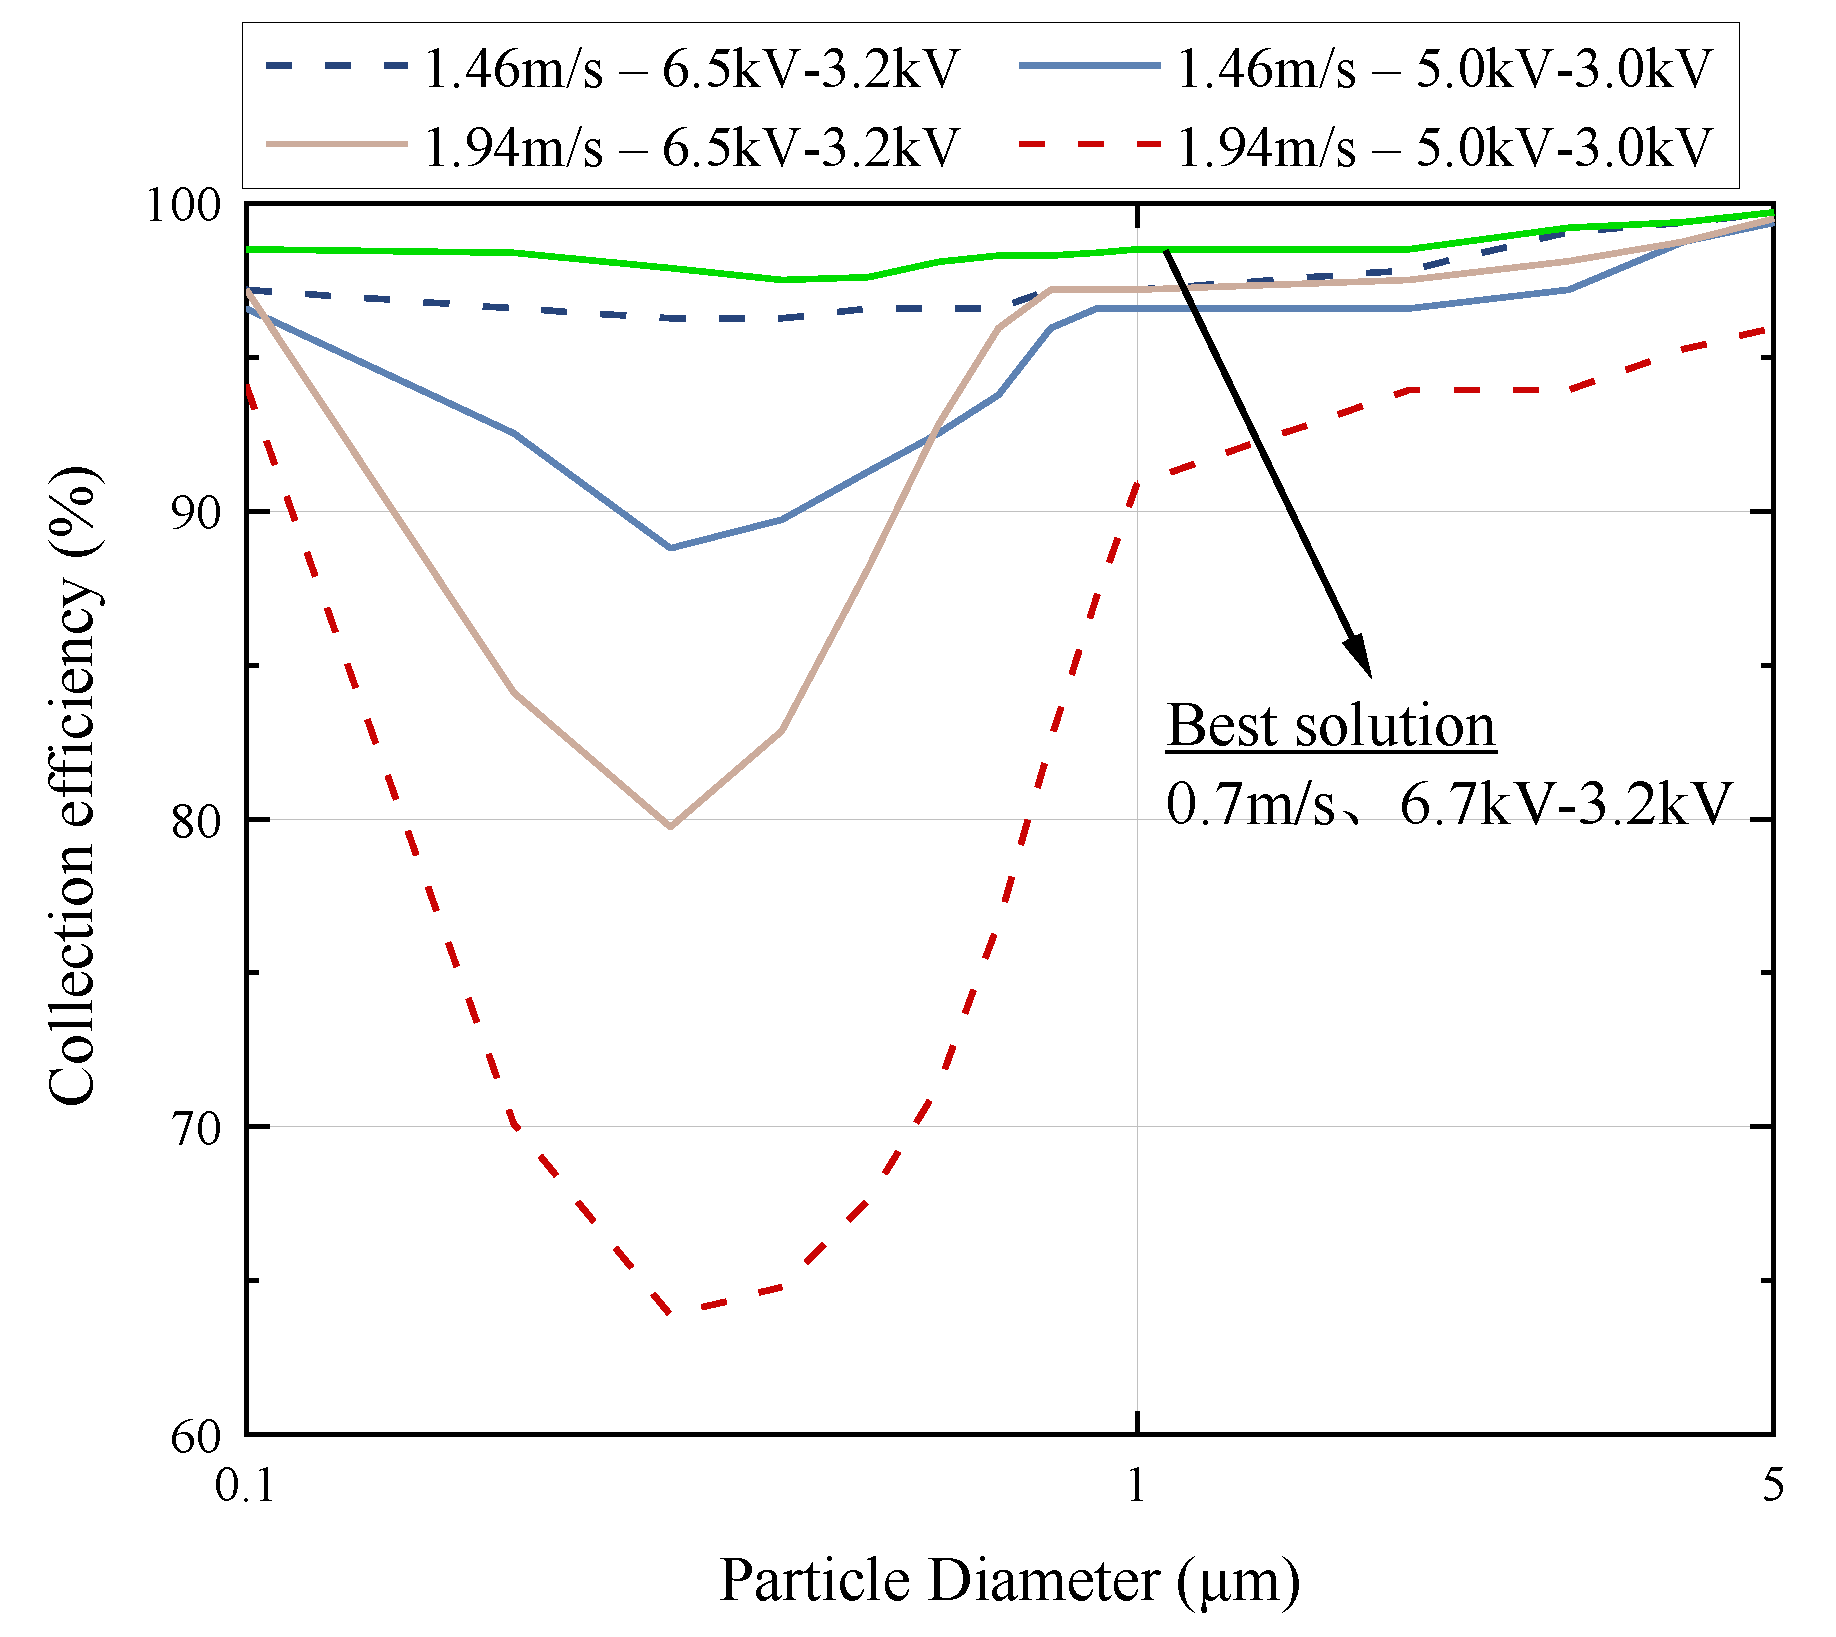
The MOGA yielded the optimal parameter combination for simulation: a flow speed of 0.7 m/s–0.8 m/s and a voltage of 6.5 kV–6.7 kV, in which case the collection efficiency averaged up to 98.4% (Figure 13) and showed stable changes on the whole (Figure 14).

5. Conclusions and Future Directions of Research

In this study, a COMSOL Multiphysics numerical model was created to simulate an ESP collecting bacteria under JEMA standards and analyze the flow field coupling with the ESP. The RANS equations and a low Reynolds k-ε turbulence model were used to build flow field models; a finite element method was adopted to calculate the electric field and charge density; and the Lagrange multiplier was employed to model particle trajectories. The numerical model’s reliability was established on the basis of the results of a JEMA experiment.
After the optimal flow speed/voltage combination was determined through the MOGA, the collection efficiency was higher in the JEMA experiment even with higher flow speed—which indicated that high voltages and the varying sizes of H1N1 particles released were the main factors affecting the results of the experiment. Specifically, in the JEMA experiment the ESP killed particles of 0.02 μm–0.2 μm upon their entry; its collection efficiency improved for those of 1.5 μm–20 μm as their sizes increased. Moreover, when the flow speed was altered to increase the amount of time that the bioaerosols took to pass through the ESP, they either were attracted through static electricity onto the collecting plates or had their bacteria killed by electroporation—a process that can be utilized to prevent the transmission of droplet infectious diseases.
Although raising the input voltage can improve the ESP collection efficiency, this also leads to more ozone generated. Thus, the voltage should not be raised, so that the amount of ozone generated during point discharges can remain within the safe limits. We recommended applying reasonable levels of voltage. Indeed, through the MOGA and numerical simulation, we showed that the collection efficiency for particles of 0.1 μm–5.0 μm increased by 3.7–5.1% on average in the JEMA experiment, when a low voltage of 6.7 kV was applied and the flow speed decreased to 0.7 m/s. Under such conditions, the collection efficiency improved by 8.4–17.4% for particles of 0.3 μm and even reached over 95% for particles of all sizes. In brief, taking into account low flow speed and reasonable levels of voltage can be the most effective way to optimize the ESP design.
Other approaches to optimize the ESP design can include the proposed two-stage ESP with a positive voltage. This precipitator generates ozone in amounts equivalent to that in the natural air. It also applies the Coulomb force to collect aerosols and bacteria in the air, thereby preventing their spread. Moreover, with a collection efficiency of over 95%, the ESP filters airborne particles as effectively as an N95 respirator, allowing people in a building to walk around without having to wear a mask.

Author Contributions

Y.-T.C. and S.-J.L. (conceptualization); Y.-T.C. and C.-L.L. (software and methodology); Y.-T.C., C.-L.L. and S.-J.L. (validation); Y.-T.C. (formal analysis); Y.-T.C. and S.-J.L. (investigation); Y.-T.C., C.-L.L. and S.-J.L. (resource acquisition); Y.-T.C. and S.-J.L. (data curation); Y.-T.C. and S.-J.L. (original draft preparation); Y.-T.C. (manuscript review and editing); S.-J.L. (visualization); D.-S.L. (supervision); Y.-T.C. (project administration); D.-S.L. (funding acquisition). All authors have read and agreed to the published version of the manuscript.

Funding

This research was funded by the Ministry of Science and Technology, Taiwan under Grant No. 110-2221-E-027-061-MY3.

Institutional Review Board Statement

Not applicable.

Data Availability Statement

The datasets generated during and/or analyzed during the current study are available from the corresponding author upon reasonable request.

Acknowledgments

The authors would like to acknowledge the financial support of this work by the Ministry of Science and Technology, Taiwan, R.O.C. under Grant No. 110-2221-E-027-061-MY3.

Conflicts of Interest

The authors declare no conflict of interest.

Nomenclature

A C Cross-sectional area ( m 2 )
C D Drag Coefficient
C r Empirical Constant
Dhydraulic diameter of the pipe (m),
d p Particle Diameter (m)
E Electric Field Strength ( V / m )
E 0 Electric Field of the Electrode ( V / m )
E c Critical Breakdown Electric Field (V/m)
e Elementary Charge of an Electron ( 4.8 × 10 08 ,   C )
F D Drag Force Acting on the Particle ( k g · m / s 2 )
F E Electric Field Force Acting on the Particle ( k g · m / s 2 )
F t Force Acting on the Particle ( N )
J Current Density ( A / m 2 )
l Characteristic Length ( m )
MMach Number
m p Particle Mass ( k g )
QVolumetric Flow Rate ( m 3 / s )
qParticle Position ( m )
R e Reynolds Number
R e r Relative Reynolds Number ( R e r = ρ p u v d p μ )
r c Electrode Radius (m)
SResistance Correction Coefficient ( S = 1 + K n ( C 1 + C 2 e x p C 3 K n )
TTemperature (K)
tTime (s)
gGravity ( m / s 2 )
pPressure (Pa)
uFlow Velocity ( m / s )
u s Velocity ( m / s )
v p Particle Velocity ( m / s )
VElectric Potential (V)
ZNet Charge on a Single Particle
Z q Charge Number
δ Air Density (kg/m3)
λ Molecular Conductivity
λ t Turbulent Conductivity
ε 0 Vacuum Permittivity C / ( V · m )
μ Dynamic Viscosity of Fluid ( P a · s )
μ i Ion Mobility m 2 V · s
μ t Turbulent Dynamic Viscosity
ρ Density of Fluid ( k g / m 3 )
ρ p Particle Density ( k g / m 3 )
ρ q Space Charge Density ( C / m 3 )
v k Kinematic Viscosity ( m 2 / s )
τ p Particle Relaxation Time ( s )

References

  1. World Health Organization Europe (WHO Europe). Transmission of SARS-CoV-2: Implications for Infection Prevention Precautions; Scientific Brief; WHO: Geneva, Switzerland, 2020. [Google Scholar]
  2. Centers for Disease Control and Prevention USA How COVID-19 Spreads. Available online: https://www.cdc.gov/socialmedia/syndication/405380/403327.html (accessed on 18 July 2022).
  3. De, F.; Lima, A.; Medeiros, G.B.; Augusto, P.; Chagas, M.; Lopes Aguiar, M.; Guerra, V.G. Aerosol Nanoparticle Control by Electrostatic Precipitation and Filtration Processes—A Review. Powders 2023, 2, 259–298. [Google Scholar] [CrossRef]
  4. Pushpawela, B.; Jayaratne, R.; Nguy, A.; Morawska, L. Efficiency of Ionizers in Removing Airborne Particles in Indoor Environments. J. Electrostat. 2017, 90, 79–84. [Google Scholar] [CrossRef]
  5. Othman, M.; Latif, M.T.; Yee, C.Z.; Norshariffudin, L.K.; Azhari, A.; Halim, N.D.A.; Alias, A.; Sofwan, N.M.; Hamid, H.H.A.; Matsumi, Y. PM2.5 and Ozone in Office Environments and Their Potential Impact on Human Health. Ecotoxicol. Environ. Saf. 2020, 194, 110432. [Google Scholar] [CrossRef] [PubMed]
  6. Xiong, W.; Lin, Z.; Zhang, W.; Chen, T.; Zhao, C. Experimental and Simulation Studies on Dust Loading Performance of a Novel Electrostatic Precipitator with Dielectric Barrier Electrodes. Build. Environ. 2018, 144, 119–128. [Google Scholar] [CrossRef]
  7. Liu, S.; Huang, Q.; Zhang, X.; Dong, W.; Zhang, W.; Wu, S.; Yang, D.; Nan, B.; Zhang, J.; Shen, H.; et al. Cardiorespiratory Effects of Indoor Ozone Exposure Associated with Changes in Metabolic Profiles among Children: A Repeated-Measure Panel Study. Innovation 2021, 2, 100087. [Google Scholar] [CrossRef] [PubMed]
  8. Chen, L.; Gonze, E.; Ondarts, M.; Outin, J.; Gonthier, Y. Electrostatic Precipitator for Fine and Ultrafine Particle Removal from Indoor Air Environments. Sep. Purif. Technol. 2020, 247, 116964. [Google Scholar] [CrossRef]
  9. Arif, S.; Branken, D.J.; Everson, R.C.; Neomagus, H.W.J.P.; le Grange, L.A.; Arif, A. CFD Modeling of Particle Charging and Collection in Electrostatic Precipitators. J. Electrostat. 2016, 84, 10–22. [Google Scholar] [CrossRef]
  10. Zhu, J.; Zhao, Q.; Yao, Y.; Luo, S.; Guo, X.; Zhang, X.; Zeng, Y.; Yan, K. Effects of High-Voltage Power Sources on Fine Particle Collection Efficiency with an Industrial Electrostatic Precipitator. J. Electrostat. 2012, 70, 285–291. [Google Scholar] [CrossRef]
  11. Thonglek, N.; Dechthummarong, C.; Kiatsiriroat, T. Soot Treatment by Using High Voltage Pulse Energized Electrostatic Precipitator. Energy Procedia 2011, 9, 292–298. [Google Scholar] [CrossRef]
  12. Pal, A.; Dixit, A.; Srivastava, A.K. Design and Optimization of the Shape of Electrostatic Precipitator System. Mater. Today Proc. 2021, 47, 3871–3876. [Google Scholar] [CrossRef]
  13. Kim, H.J.; Han, B.; Kim, Y.J.; Yoa, S.J. Characteristics of an Electrostatic Precipitator for Submicron Particles Using Non-Metallic Electrodes and Collection Plates. J. Aerosol Sci. 2010, 41, 987–997. [Google Scholar] [CrossRef]
  14. Masuda, S.; Hosokawa, S. Performance of Two-Stage Type Electrostatic Precipitators. IEEE Trans. Ind. Appl. 1984, IA-20, 709–717. [Google Scholar] [CrossRef]
  15. Sjoholm, P.; Ingham, D.B.; Lehtimaki, M.; Perttu-Roiha, L.; Goodfellow, H.; Torvela, H. Gas-Cleaning Technology. In Industrial Ventilation Design Guidebook; Academic editor: Cambridge, MA, USA, 2001. [Google Scholar]
  16. Li, L.; Gopalakrishnan, R. An Experimentally Validated Model of Diffusion Charging of Arbitrary Shaped Aerosol Particles. J. Aerosol Sci. 2021, 151, 105678. [Google Scholar] [CrossRef]
  17. Ning, Z.; Sillanpää, M.; Pakbin, P.; Sioutas, C. Field Evaluation of a New Particle Concentrator- Electrostatic Precipitator System for Measuring Chemical and Toxicological Properties of Particulate Matter. Part. Fibre Toxicol. 2008, 5, 15. [Google Scholar] [CrossRef] [PubMed]
  18. Pirhadi, M.; Mousavi, A.; Sioutas, C. Evaluation of a High Flow Rate Electrostatic Precipitator (ESP) as a Particulate Matter (PM) Collector for Toxicity Studies. Sci. Total Environ. 2020, 739, 140060. [Google Scholar] [CrossRef]
  19. Zhu, Y.; Chen, C.; Chen, M.; Shi, J.; Shangguan, W. Numerical Simulation of Electrostatic Field and Its Influence on Submicron Particle Charging in Small-Sized Charger for Consideration of Voltage Polarity. Powder Technol. 2021, 380, 183–198. [Google Scholar] [CrossRef]
  20. Taiwan Centers for Disease Control. EM Atlas of Clinical Microbes; Centers for Disease Control, Department of Health: Taipei, Taiwan, 2009. [Google Scholar]
  21. Zimmermann, U.; Vienken, J.; Pilwat, G. Development of Drug Carrier Systems: Electrical Field Induced Effects in Cell Membranes. Bioelectrochem. Bioenerg. 1980, 7, 553–574. [Google Scholar] [CrossRef]
  22. Kotnik, T.; Kramar, P.; Pucihar, G.; Miklavčič, D.; Tarek, M. Cell Membrane Electroporation—Part 1: The Phenomenon. IEEE Electr. Insul. Mag. 2012, 28, 14–23. [Google Scholar] [CrossRef]
  23. Kotnik, T.; Bobanović, F.; Miklavčič, D. Sensitivity of Transmembrane Voltage Induced by Applied Electric Fields—A Theoretical Analysis. Bioelectrochem. Bioenerg. 1997, 43, 285–291. [Google Scholar] [CrossRef]
  24. Nunayon, S.S.; Zhang, H.H.; Jin, X.; Lai, A.C. Experimental Evaluation of Positive and Negative Air Ions Disinfection Efficacy under Different Ventilation Duct Conditions. Build. Environ. 2019, 158, 295–301. [Google Scholar] [CrossRef]
  25. Afshari, A.; Ekberg, L.; Forejt, L.; Mo, J.; Rahimi, S.; Siegel, J.; Chen, W.; Wargocki, P.; Zurami, S.; Zhang, J. Electrostatic Precipitators as an Indoor Air Cleaner—A Literature Review. Sustainability 2020, 12, 8774. [Google Scholar] [CrossRef]
  26. Long, Z.; Yao, Q. Evaluation of Various Particle Charging Models for Simulating Particle Dynamics in Electrostatic Precipitators. J. Aerosol Sci. 2010, 41, 702–718. [Google Scholar] [CrossRef]
  27. Lawless, P.A. Particle Charging Bounds, Symmetry Relations, and an Analytic Charging Rate Model for the Continuum Regime. J. Aerosol Sci. 1996, 27, 191–215. [Google Scholar] [CrossRef]
  28. Farnoosh, N.; Adamiak, K.; Castle, G.S.P. 3-D Numerical Analysis of EHD Turbulent Flow and Mono-Disperse Charged Particle Transport and Collection in a Wire-Plate ESP. J. Electrostat. 2010, 68, 513–522. [Google Scholar] [CrossRef]
  29. Kasdi, A. Computation and Measurement of Corona Current Density and V–I Characteristics in Wires-to-Plates Electrostatic Precipitator. J. Electrostat. 2016, 81, 1–8. [Google Scholar] [CrossRef]
  30. Zhang, J.; Chen, D.; Zha, Z. Theoretical and Experimental Study of Trapping PM2.5 Particles via Magnetic Confinement Effect in a Multi-Electric Field ESP. Powder Technol. 2020, 368, 70–79. [Google Scholar] [CrossRef]
  31. Ito, K.; Tamura, R.; Zukeran, A.; Kawada, Y.; Taoka, T. Simulation and Measurement of Charged Particle Trajectory with Ionic Flow in a Wire-to-Plate Type Electrostatic Precipitator. J. Electrostat. 2020, 107, 103488. [Google Scholar] [CrossRef]
  32. Clack, H.L. Further Consideration of Gas-Particle Mass Transfer Simulation during Electrostatic Precipitation Using Lower Order Representations of Particle Size Distributions: Variable Size Distributions. J. Electrostat. 2020, 104, 103418. [Google Scholar] [CrossRef]
  33. Zhou, W.; Jiang, R.; Sun, Y.; Chen, B.; Liu, B. Study on Multi-Physical Field Characteristics of Electrostatic Precipitator with Different Collecting Electrodes. Powder Technol. 2021, 381, 412–420. [Google Scholar] [CrossRef]
  34. Kılıç, M.; Mutlu, M.; Altun, A.F. Numerical Simulation and Analytical Evaluation of the Collection Efficiency of the Particles in a Gas by the Wire-Plate Electrostatic Precipitators. Appl. Sci. 2022, 12, 6401. [Google Scholar] [CrossRef]
  35. Fattah, R.; Reverberi, A.; Badran, M.; Mansour, A.M. Evaluating Performance Indices of Electrostatic Precipitators. Energies 2022, 15, 6647. [Google Scholar] [CrossRef]
  36. JEMA. JEM 1467: Household Air Purifiers; Japan Electrical Manufacturers Association (JEMA): Tokyo, Japan, 2015. [Google Scholar]
  37. Bureau of Standards, Metrology and Inspection, M.O.E.A. Household and Similar Electrical Appliances—Safety—Part2-65: Particular Requirements for Air-Clearning Appliances; Bureau of Standards, Metrology and Inspection, M.O.E.A.: Taipei, Taiwan, 2015; pp. 8–9. [Google Scholar]
  38. Simon, X.; Bau, S.; Bémer, D.; Duquenne, P. Measurement of Electrical Charges Carried by Airborne Bacteria Laboratory-Generated Using a Single-Pass Bubbling Aerosolizer. Particuology 2015, 18, 179–185. [Google Scholar] [CrossRef]
  39. Vega-Mercado, H.; Martín-Belloso, O.; Qin, B.L.; Chang, F.J.; Góngora-Nieto, M.M.; Barbosa-Cánovas, G.V.; Swanson, B.G. Non-Thermal Food Preservation: Pulsed Electric Fields. Trends Food Sci. Technol. 1997, 8, 151–157. [Google Scholar] [CrossRef]
  40. World Health Organization. Ambient Air Pollution; WHO: Geneva, Switzerland, 2018. [Google Scholar]
  41. Cao, Y.; Shao, L.; Jones, T.; Oliveira, M.L.S.; Ge, S.; Feng, X.; Silva, L.F.O.; BéruBé, K. Multiple Relationships between Aerosol and COVID-19: A Framework for Global Studies. Gondwana Res. 2021, 93, 243–251. [Google Scholar] [CrossRef]
  42. Hwang, S.E.; Chang, J.H.; Oh, B.; Heo, J. Possible Aerosol Transmission of COVID-19 Associated with an Outbreak in an Apartment in Seoul, South Korea, 2020. Int. J. Infect. Dis. 2021, 104, 73–76. [Google Scholar] [CrossRef]
  43. Deb, K.; Pratap, A.; Agarwal, S.; Meyarivan, T. A Fast and Elitist Multiobjective Genetic Algorithm: NSGA-II. IEEE Trans. Evol. Comput. 2002, 6, 182–197. [Google Scholar] [CrossRef]
  44. Chen, W.H.; Wang, C.M.; Lee, D.S.; Kwon, E.E.; Ashokkumar, V.; Culaba, A.B. Optimization Design by Evolutionary Computation for Minimizing Thermal Stress of a Thermoelectric Generator with Varied Numbers of Square Pin Fins. Appl. Energy 2022, 314, 118995. [Google Scholar] [CrossRef]
  45. Elsoragaby, S.; Yahya, A.; Mahadi, M.R.; Nawi, N.M.; Mairghany, M.; Elhassan, S.M.M.; Kheiralla, A.F. Applying Multi-Objective Genetic Algorithm (MOGA) to Optimize the Energy Inputs and Greenhouse Gas Emissions (GHG) in Wetland Rice Production. Energy Rep. 2020, 6, 2988–2998. [Google Scholar] [CrossRef]
  46. Pu, L.; Qi, D.; Xu, L.; Li, Y. Optimization on the Performance of Ground Heat Exchangers for GSHP Using Kriging Model Based on MOGA. Appl. Therm. Eng. 2017, 118, 480–489. [Google Scholar] [CrossRef]
  47. Quakernaat, J. Handbook of Electrostatic Processes. J. Clean. Prod. 1995, 3, 175. [Google Scholar] [CrossRef]
  48. Japan Air Cleaning Association. JP-G12_Dust Collection & Efficiency Ozone Measurement Test Report; Doc no, KU28-182; Japan Air Cleaning Association: Tokyo, Japan, 2016. [Google Scholar]
  49. Environmental Protection Administration. Indoor Air Quality Standard; Environmental Protection Administration: Taipei, Taiwan, 2012. [Google Scholar]
  50. Lei, H.; Wang, L.Z.; Wu, Z.N. EHD Turbulent Flow and Monte-Carlo Simulation for Particle Charging and Tracing in a Wire-Plate Electrostatic Precipitator. J. Electrostat. 2008, 66, 130–141. [Google Scholar] [CrossRef]
Figure 1. One-stage ESP: The corona discharge causes ionized gas molecules to collide with the particles, which are subsequently negatively charged and attracted toward the positive, grounded collection plates by Coulomb force.
Sustainability 15 08432 g001
Figure 2. Two-stage ESP: The particles were positively charged by passing through the positively charged ionization wire, and are attracted to a negative electrode collector through the Coulomb force.
Sustainability 15 08432 g002
Figure 3. Sterilization through the ESP: A sufficiently strong electric field is applied perpendicularly to the bilayer. The main molecular constituents of every cell membrane are the lipids. Each of them has a polar (hydrophilic) and a nonpolar (hydrophobic) part [21]. The process of sterilization involves the transition of lipids from their normal arrangement (A) to the formation of pores (B) and eventually membrane rupture (C), followed by stabilization (D).
Sustainability 15 08432 g003
Figure 4. Illustration of an ESP preventing the spread of airborne viruses.
Sustainability 15 08432 g004
Figure 5. The ESP prototype used in the present study.
Sustainability 15 08432 g005
Figure 6. Setup of the JEMA experiment.
Sustainability 15 08432 g006
Figure 7. List of all steps and their duration in the JEMA experiment.
Sustainability 15 08432 g007
Figure 8. COMSOL 2D simulation geometric shape and mesh.
Sustainability 15 08432 g008
Figure 9. Block diagram of the multi-objective genetic algorithm (MOGA) used in the present study.
Sustainability 15 08432 g009
Figure 10. Results of a JEMA experiment on collecting airborne viruses. (by the Kitasato Research Center for Environmental Science in Japan under report number “2020_038”).
Sustainability 15 08432 g010
Figure 11. Comparison of model simulation results against experimental data on dust collection.
Sustainability 15 08432 g011
Figure 12. ESP collection efficiency for particles of 0.1 μm–5 μm at different voltages and flow speeds.
Sustainability 15 08432 g012
Figure 13. Optimal ESP collection efficiency at a flow speed of 0.7 m/s–0.8 m/s and a voltage of 6.5 kV–6.7 kV, as determined through a MOGA.
Sustainability 15 08432 g013
Figure 14. ESP collection efficiency under the optimal condition: at a 0.7 m/s flow speed and a 6.7 kV.
Sustainability 15 08432 g014
Table 1. Viruses by type [17,20].
TypeViruses
NameCoronavirusHuman metapneumovirusInfluenza B
virus
Influenza A
Virus
(H1N1, 3N2)
Characteristics80–160 nm, enveloped156–300 nm, enveloped80–120 nm, enveloped, has a polymorphic appearance and appears in a spherical or tubular shape3.0–20 μm.
Causes mild upper respiratory tract infections or severe acute respiratory syndrome (SARS).Causes upper and lower respiratory tract infections and cold symptoms. Children and older adults with weaker immunity are liable to pneumonia or other severe illnesses if infected.Spreads fast by air. People with weak immunity are liable to pneumonia or other severe illnesses if infected.Transmitted by droplets.
Positive single-strand RNA virusNegative single-strand RNA virusCovers the nucleoprotein and transcriptases of the RNA
Table 2. Bacteria by type [20].
TypeBacterium
NameBordetella pertussisStaphylococcus aureusEscherichia coli (E. coli)Legionella pneumophila
Characteristics0.1–0.5 μm in diameter, 0.5–2.0 μm in length, Brevibacteria, has a bacterial capsule0.5–1.0 μm in diameter1.5–3.0 μm in diameter2.0.–5.0 μm in diameter, has no bacterial capsule
A bacterial respiratory tract disease that has humans as the only host and spreads by air or droplets.A hospital-acquired bacterium with an aerodynamic diameter of 0.7–0.8 μm.Spreads by water have an aerodynamic diameter of 0.78 μm.Causes Legionnaires’ disease, leading to inflammation in the lungs.
NameNeisseria meningitidisPseudomonas aeruginosaStreptococcus pneumoniaeMycobacterium tuberculosis
Characteristics0.5–1.0 μm,
has no bacterial capsule, spherical
0.5–1.0 μm in diameter and 2.0–5.0 μm in length, has no endospore and has one flagellum.0.4–1.2 μm in diameter, has a bacterial capsule0.2–0.6 μm in diameter and 1–10 μm in length, has a shape resembling a short spherical rod or long chain.
Spreads by dropletsGrown in moist environments, spreads by different media. Spreads by air, droplets, dust, or by droplet nuclei.
Table 3. Governing equations used in previous studies for the COMSOL Multiphysics simulation of electrostatic precipitation.
Article2016,
Kasdi [29]
2018,
Xiong et al. [6]
2020,
Ito [31]
2020,
Clack [32]
2021,
Zhou et al. [33]
Dimensions2D2D2D2D2D
Number of ionization lines1–5901–1033
Ionization line diameter ( m m ) 0.4, 0.820.2612
Distance between ionization lines ( m m ) 40, 60, 805015500200
Length of dust collection plate ( m ) 0.770.510.0520.6
Distance between dust collection plates ( m ) 0.10.040.030.30.2
Type of electrostatic dust collection1 step2 steps1 step1 step1 step
Fluid flow module-turbulent (spf)turbulent (spf)turbulent (spf)turbulent (spf)
Flow field- k ε
(Low Re)
k ω - k ε
Flow velocity ( m / s ) -1.0, 2.510.75, 1.55, 30.1
Electric field module-static electricity (es)-static electricity (es)static electricity (es)
Electrode electric fieldPeek’s law---Peek’s law
StaticPoisson’s equation-Poisson’s equationPoisson’s equationPoisson’s equation
Current continuity equation-Current continuity equationCurrent continuity equationCurrent continuity equation
Particle trajectory-Kuhn-Han correction factor-Kuhn-Han correction factor-
---Lagrangian functionLagrangian function
-Newton’s Second LawNewton’s Second Law-Newton’s Second Law
Charging mechanism-Cochet, 1961-Electric Field ChargingLawless, 1996
Mesh element--1,300,00025,00010,000–27,000
Ion migration rate (m2/Vs)0.000180.000210.000169-0.00016
Table 4. Definitions of simulation parameters.
ParameterJEMA Experiment
Flow speed ( m / s ) 1.94
Voltage of the ionization wire ( k V ) 6.5
Voltage of positively charged collecting plates ( k V ) 3.2
BacteriaE. coli bacteriophages, Influenza A virus (H1N1)
Particle size (μm)0.02–0.2
Table 5. Boundary conditions.
Gas Flow Velocity
( m / s )
Gas Temperature ( K ) Gas Pressure ( P a ) Gas Density ( k g / m 3 ) Gas Viscosity Coefficient ( P a · s ) Gas Dielectric Constant ( C 2 / N · m 2 )
0.5–1.95 298.15101,3251.184 1.319 × 10 5 1 [29,30]
Positive Electrode Dust Collecting Plate Voltage
( k V )
Positive Electrode Dust Collecting Plate Voltage
( k V )
Particle Diameter
( μ m )
Particle Density
( k g / m 3 )
Particle Viscosity Coefficient
( P a · s )
Particle Dielectric Constant
( C 2 / N · m 2 )
5.0, 6.5 3.0, 3.20.3–1.23900 [33] 1.319 × 10 5 2.5 [9,26]
Table 6. Results of an ozone generation test on the ESP prototype.
Ultraviolet Absorption Ozone Concentration Meter: 1006AHJ
Wind volume: Q w
( m 3 / m i n )
Ozone concentration ( p p m ) Amount of ozone generated: q o
( m L / m i n )
Upstream: O 1 Downstream: O 2 Difference
2.00.00040.01422.00.0004
Disclaimer/Publisher’s Note: The statements, opinions and data contained in all publications are solely those of the individual author(s) and contributor(s) and not of MDPI and/or the editor(s). MDPI and/or the editor(s) disclaim responsibility for any injury to people or property resulting from any ideas, methods, instructions or products referred to in the content.