1. Introduction
Internet-based information and communication technologies can capture the changing patterns of human activities. These changes arise and are influenced by the dynamic environment in which people interact, work and live [
1]. The COVID-19 pandemic had a substantial effect on retail behaviors, shifting them in time and space and accelerating pre-existing trends for contactless consumption and thereby altering the nature of face-to-face consumption and the spaces and places within which it occurs [
2,
3,
4].
Retail businesses are essential elements of local communities and economies. As such, it is vital to understand how people move and interact within urban environments to build resilient and sustainable retail infrastructure. This may also fit into the broader sustainable urban mobility planning for cities, with mobility indirectly affecting the building of resilient infrastructures [
5]. This can include understanding shopping patterns and behaviors and how these might have changed following crises and disasters, as well as how to promote more sustainable mobility within the city post-crisis/disaster. While extant studies have examined shopping behaviors during COVID-19 [
6,
7,
8], highlighting a major transition to online shopping [
9], this transition poses a significant threat to traditional retailing in CBDs. So far, limited studies [
10] have assessed the impact of changing consumer behavior in terms of retail patterns in CBDs during the pandemic. This research analyzes the relationship between pedestrian flow and retail spending within the context of a revitalized and redeveloped CBD during COVID-19, as well as the implications for building a resilient and sustainable retail industry and developing sustainable urban mobility.
We examine this relationship in the context of Christchurch, New Zealand, which provides a unique setting following the Canterbury earthquakes and COVID-19. In 2010 and 2011, the city was partially destroyed by two large earthquakes. The rebuilding of its CBD after the 2011 earthquake provided an opportunity for urban renewal and revitalization [
11]. This was a unique opportunity for a CBD that, like many cities, had been under persistent pressure from new shopping malls embedded within residential areas of the city.
In Christchurch, an estimated NZD 1.4 billion was lost in spending leakage from the CBD to suburban malls between 1995 and 2005. This led to a deterioration of trading conditions for inner-city retailers [
12]. Suburban malls had, over time, caused CBD retail to be hollowed out, resulting in store closures and job losses. Furthermore, the shift in spending behaviors negatively impacted the viability and vitality of non-retail businesses within the Christchurch CBD [
3,
4]. These issues can have negative implications for long-term economic sustainability, including the reorientation of CBDs and their (re)development.
This research employs OLS regression modeling and seeks to improve our understanding of the changes in pedestrian behavior in the Christchurch CBD, as well as how this has influenced retail spending, before and after the pandemic. Significant changes in coefficients are determined via the Chow test. While previous studies [
10] have employed footfall equipment to analyze pedestrian traffic, this study utilizes data gathered from cameras in public spaces to show how the CBD’s physical and social environment evolved to help shape a resilient CBD [
13]. In this way, we seek to develop a better understanding of how smart CBD redevelopment opportunities can increase the vibrancy of local retail and entertainment businesses and, in turn, contribute to a more resilient and sustainable CBD. By assessing the connections between the physical and social environment of a smart city and the ability of a CBD to generate resilient foot traffic to support retail, the paper provides a unique and informative case analysis of a city in transition. The study contributes to extending the research on regional development and urban resilience [
10,
14] by providing evidence on how retail districts can be agile enough to prosper under the negative impacts of COVID-19 and increasing competition from online retailing channels [
15].
The paper proceeds as follows. In the next section, we review the literature associated with retail growth and resilience within CBD regions. Following this, we introduce the data sources and analytical processes adopted in this study. We then present the methodology, results and discussion, and we conclude with an assessment of the paper’s key findings and contribution to the literature, along with the study’s main limitations.
2. Literature
2.1. Retail Growth in CBDs
While e-commerce continues to grow the share of retail sales globally, retail through physical stores remains an important channel. Within physical retail, many regions have seen a “hollowing out” of CBD businesses in favor of decentralized shopping malls [
16,
17]. This trend was first observed by Reilly [
18], who suggested that retail zones attract consumers from their neighboring communities in proportion to the adjacent area’s population, but in inverse proportion to the distance between these population communities and the retail zone. A consequence of what has become known as
Reilly’s Law of Retail Gravitation is that as suburban populations have grown on the periphery of cities, they have generated demand for local shopping areas and have tended to “hollow out” central urban shopping areas within CBDs [
19]. Additional factors facilitating the decentralization of retail away from inner CBDs include rising costs in urban areas, increases in the cost of transportation, changes in consumer behavior and the development of new technologies [
2]. For example, changes in consumer behavior, such as increasing preferences for enhanced shopping experiences, may have tended to decentralize retail, leading to the growth of suburban centers and suburban fringe shopping destinations that offer more space, leisure and recreational activities.
Different local jurisdictions have managed this hollowing-out process in different ways, although it is an emerging and shared concern for many large cities and urban communities [
20,
21,
22]. Many planners are concerned about the decline in livability as key retailers, including supermarkets, retreat from urban centers [
23], while others are concerned with the loss of community vitality and diversity engendered through the loss of diversified and distributed shopping areas [
16]. Proximity mobility in urban planning through the promotion of public transport and cycle lane networks [
5] and the creation of safe and attractive shopping areas that are conducive to pedestrian traffic has also been a driver to revitalize the CBD in many parts of the world.
Arguably, these problems were exacerbated and made more urgent by COVID-19, as many commuting workers worked from home throughout much of 2020 and 2021 and many consumers, hitherto reluctant to embrace e-commerce for certain product categories, did so for safety and convenience reasons associated with the pandemic [
24]. While several studies have examined the impact of COVID-19 on shopping behaviors [
6,
7,
8,
25], these studies do not always examine resilience or lack thereof as a consequence of changing shopping patterns. Studies have also examined how the COVID-19 pandemic has affected travel behaviors and transportation system operations within cities [
26,
27,
28], and have determined reopening strategies that take into account health measures for the safety of commuters.
2.2. Retail and Resilience
Town centers have coped differently with the challenges presented by COVID-19, with some arguing that smaller centers have been less impacted by the pandemic given that they are less dependent on serving longer-distance commuters and visitors [
10]. As cities promote more sustainable urban mobility [
5], including increased use of public transport [
26], investors and developers need to create retail infrastructure that is inclusive, green and safe. The ways in which CBDs build resilience by diminishing their vulnerability against economic shocks and their subsequent capacity and recovery trajectories remain understudied [
10]. Resilience is, therefore, seen as the ability of urban systems, of which retail is an important facet, to recognize shocks and adapt and reorganize in the face of disruptive events [
29]. Resilience is a context-specific process, and, in the case of CBDs, refers to how they can respond to economic and social change by being flexible and adaptive while also developing new paths to achieve growth [
30]. This concept is also used to analyze how CBDs can cope with structural changes in the retail sector [
31]. Resilience is further used in connection with urban planning as a way to deal with unexpected or extreme events, as well as shocks [
10], and, increasingly, with the examination of urban mobility issues [
5]. Understanding how CBDs, in particular, responded to COVID-19 is essential for future crisis/disaster preparedness and resilience-building strategies to handle external shocks [
10]. Within the literature on high streets and CBDs, adaptive resilience appears to be an overarching goal that focuses on future-proofing retail performance in urban centers [
14,
32]. Existing studies converge around several factors that can make retail centers in urban areas more resilient, including their ability to persist through changes and adapt to them, mitigating omnichannel retailing and unexpected shocks, building relationships through networks and developing micro-resilience strategies [
14]. These factors need to be considered alongside strategies to revitalize urban centers and their resilience, including sustainable urban mobility issues. Accordingly, building retail resilience should not be devoid of considerations for urban resilience, regional economic resilience and broader sustainable urban planning issues. Thus, retail resilience should also consider urban resilience as a key enabler, and factors such as the diversity mix of users within CBDs, flexible of use of spaces and facilities, multi-functionality of urban spaces, governance and design processes and innovative capacity, amongst others [
33], should be included in responding to COVID-19.
2.3. Pedestrian Traffic in CBDs
Long-term downward trends in urban shopping areas have been encouraged by ownership fragmentation of CBD real estate [
34]. In many cases, the built environments of inner cities have not kept pace with the facilities available in suburban centers, where ownership and asset management are coupled in the hands of a professional asset manager [
35]. In some cases, this is negatively enhanced by a lack of local government intention to facilitate changes in business ownership and place-making activities.
Within this context, the adoption of low-cost camera and sensor technology has provided some innovative solutions to understanding residential and consumer behavior in CBDs. By gathering data on consumer behavior in the form of pedestrian flows, trip purposes and commercial patterns of use, planners, analysts and policymakers are able to identify and understand the dynamics of people and places. This fits within the broader concern of mobility patterns in urban settings, which are increasingly monitored using a suite of interconnected systems capable of tracking movements around cities [
36].
In the following section, we assess the potential of our available data to provide insights into pedestrian-based retail in the context of Christchurch’s CBD.
3. Data and Analysis
The contemporary “Smart Cities” philosophy of urban development approaches regional urban development with a focus on increased involvement of residents and visitors; inclusivity and diversity; smart approaches to waste, energy, renewables and infrastructure; and new concepts for mobility and efficient usage of urban spaces [
37].
The smart element of smart cities relies on the increased deployment and utilization of data-gathering sources, including IOT sensors, and shared connectivity among users and infrastructure. Within this context, the deployment of sensors such as CCTV has provided innovative solutions to develop a better understanding of residential and consumer behavior in specific areas. By gathering data in the form of pedestrian flows, trip purpose (through purchasing behavior or non-purchasing behavior), planners, analysts and local government policy makers are better able to identify and understand the dynamics of people and places.
Like many cities, Christchurch is pursuing the smart city approach. However, Christchurch provides a unique case of the importance of smart technologies to assess urban shopping patterns over a period of time that spans pre- and post-COVID-19 lockdowns. This is due to the wholesale rejuvenation of the CBD in response to the dual earthquakes of 2010 and 2011. Urban regeneration was a stated aim of the redevelopment process, and the quality of urban infrastructure that has emerged in the Christchurch CBD tended to place it on a level playing field with high-quality retail spaces that tend to be reserved for greenfield retail assets in suburban areas.
In this paper, we explore the impact of urban pedestrian traffic flows on retail turnover in the context of the COVID-19 pre- and post-lockdown periods. To achieve this, we used an automated measurement of pedestrian flows in various locations of the Christchurch CBD to connect these flows to retail spending behavior.
We note a nuanced set of outcomes which this paper goes on to discuss. For example, some retail sectors/locations experienced lower/changed spending by pedestrians, possibly due to moves online or suburban shopping precincts, while for others, pedestrian traffic remained a strong predictor of spending.
Trasberg et al. [
38] observed a lack of robust data-driven empirical evidence in determining the relationship between pedestrian traffic and retail income. This study contributes to the empirical evidence of the pedestrian–retail nexus through a comprehensive database of daily spending and pedestrian data. We use a novel source of data available in New Zealand, namely, publicly available EFTPOS data and footfall data from fixed cameras installed within the Christchurch CBD.
3.1. Pedestrian Traffic
Daily pedestrian traffic data for this study were collected from CCTV cameras that were installed by the Christchurch City Council (CCC) in the post-earthquake environment to better understand the usage of city infrastructure, attendance at events, usage of parking facilities, pedestrian travel patterns and areas where they pedestrians tend to sit and rest [
39].
The Smart Christchurch program used existing cameras whenever possible. The cameras were placed in areas where they would not interfere with daily operations or unreasonably invade people’s privacy.
Data from the camera footage was gathered until the processing took place (about one week following capture) and then erased (after approximately a week of processing). The trial’s output consisted of aggregated pedestrian totals by location, day and time of day, date and total count.
Signs posted at the cameras’ viewing areas informed the public that the cameras were being watched primarily for security and crime prevention purposes and secondarily for analytics collection.
The initial implementation of the Smart Cities program not only enabled observational data, as mentioned above, but also provided measurable outcomes for an emerging city that continued to be rebuilt after the damaging 2011 earthquakes. Understanding the behavior of pedestrians, including where they walk and rest, is important for urban planning. Furthermore, and especially in the context of rebuilding, attendance at pop-up and temporary events provides information that can be shared with stakeholders to better understand the movement patterns of residents and visitors to the CBD [
39]. The initial stakeholders included developers, event managers, tourism operators, city administration and planners; however, the application of the data expanded to include retailers, property managers, politicians and researchers who are interested in understanding consumer change and resilience over time.
The cameras were located in strategic locations throughout the CBD, and their operation and the analysis of the data they produce is an improvement on the manual processing of pedestrian counts that used to include clickers to manually count pedestrians as they passed through [
39]. While useful, the ability to generate pedestrian counts without the use of cameras was primarily utilized by students during holiday periods, and, as a result, did not provide a comprehensive overview of pedestrian movements over time. The permanent nature of the cameras provides the ability to track and measure movement over time.
For our study, foot traffic data were obtained from three different locations of the Christchurch CBD by CCTV cameras between 2018 and 2022, within the Christchurch CBD retail precinct. No pedestrian counts were collected during most of 2020 due to COVID-19 and related reasons. A schematic representation indicating the location of the three cameras utilized in this study can be seen in
Figure 1. The figure reveals the major retail area within the Christchurch CBD. This area experienced significant investment in commercial activity after the 2011 earthquakes.
Some pedestrian traffic data were missing due to operational failures of some of the camera equipment. This appears to have occurred for brief intervals randomly distributed through the two periods. In such cases, we deleted the entire record for the affected days to retain a balanced sample of valid data. The counts were available hourly, between 8 a.m. and 9 p.m. daily, for either 10- or 15-min intervals. In instances where partial hourly counting took place, counts were adjusted to hourly counts. A
t-test was performed to determine whether there was a significant difference in hourly counts when only the first 15 min of the counts were available. The test compared a random sample from two groups. The first group was a set of complete pedestrian counts for the hour, and the second group consisted of hourly counts based on the first 15 min count total.
Table 1 reveals the results of the
t-test.
The results reveal that the p-value [P(T<=t) two-tail] of 0.69 is larger than the α of 0.05, suggesting no significant difference between the two groups. The tests suggest that the sum of all quarters is representative of the hourly pedestrian counts.
3.2. Retail Data
Daily retail spending data by retail sub-type was obtained from Verisk, New Zealand [
40], and consisted of estimates based on aggregated electronic funds transfers at points of sale (EFTPOS) by retail sub-sector. The retail sub-sectors were “apparel & personal goods”, “cafes, bars & restaurants”, ”fuel & automotive”, “groceries & liquor”, “home & recreation” and “other retail”. The retail data covered the core CBD area of Christchurch. This core is illustrated in
Figure 1.
For our analysis, we divided the available data into two distinct groups: pre-lockdown, covering the period from 2 November 2018 to 11 March 2020, and post-lockdown, covering the period from 6 May 2021 to 22 July 2022. As increased inflationary pressures impacted retail figures, especially in the latter part of the post–lockdown period, we applied Statistics New Zealand’s retail deflators to the entire dataset to adjust for inflationary effects on customer retail spending behavior.
Some descriptive statistics can be seen in
Table 2 and
Table 3.
Table 2 shows mean pedestrian counts by CCTV camera in the three locations of interest. It is evident that the pedestrian counts were substantially lower in the post-lockdown environment, particularly at the Cashel Street and Hereford Street measurement sites, which lost 79% and 70% of pedestrian traffic, respectively, whereas the Terrace site lost around 10%. It should be noted that the environment of the Terrace CCTV site features mostly hospitality venues along the aesthetically pleasing riverbank of the Avon River.
Table 3 displays the mean daily retail spending in the Christchurch core CBD by sector. Spending was generally slightly less in the post-lockdown environment, except for the apparel and personal goods sector, where average daily post-lockdown spending increased by 23%. There is no petrol station in the Christchurch CBD, so it can be assumed that the limited pre- and post-lockdown spending on fuel/automotive related to over-the-counter miscellaneous EFTPOS sales by car dealers in the area. Looking at the traffic and spending figures revealed in
Table 2 and
Table 3, it is already clear that significant changes in individual spending patterns must have occurred between the pre- and post-lockdown periods.
3.3. Retail and Pedestrian Nexus
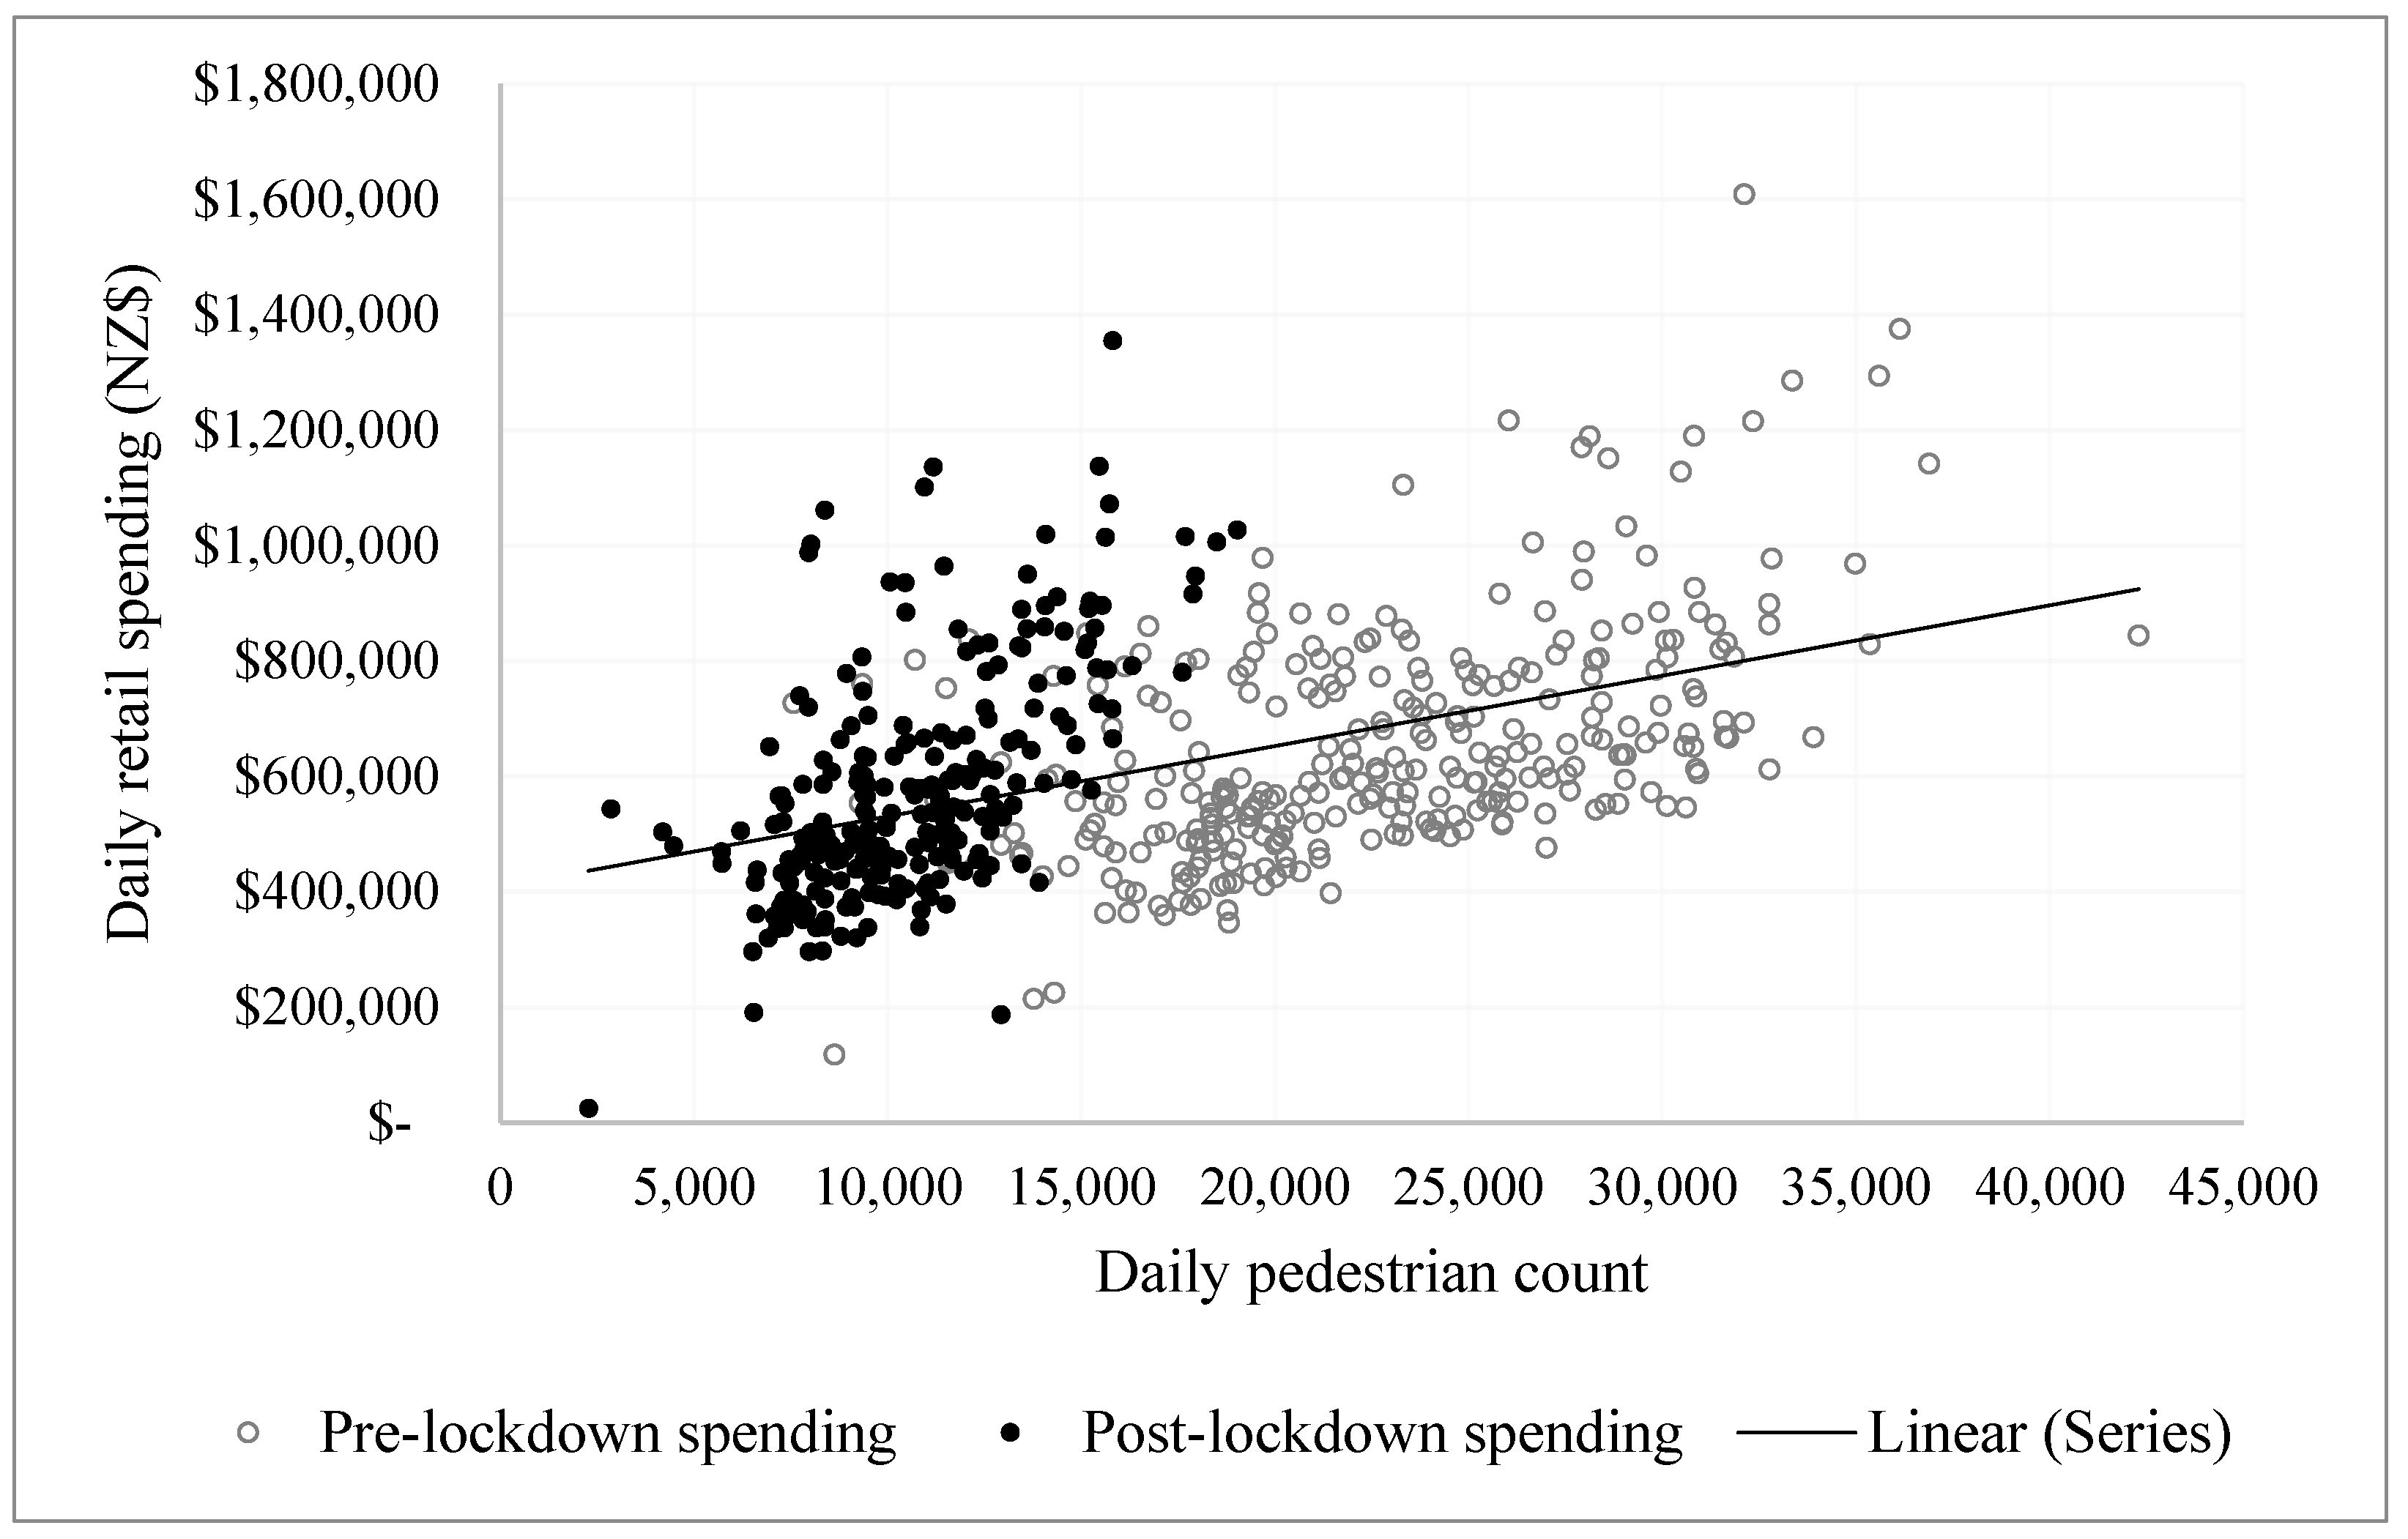
This research benefited from access to daily EFTPOS retail data, coupled with daily pedestrian counts, to provide empirical evidence of shifting consumer spending behavior within an era of disruption. We plotted the variables on a scatterplot, which is visualized in
Figure 2. The fitted line reveals the positive relationship between pedestrian traffic and retail spending, and is similar to other related studies [
38,
41]. The decrease in pedestrian traffic is evident in the post-lockdown period compared with the period before lockdown, primarily due to a decline in international travel from visitors. Health-related business restrictions remained during this period in New Zealand; however, most businesses were allowed to operate as long as they followed the COVID-19 Protection Framework [
42]. The linear relationship between retail spending and pedestrian counts during this disruption reflects a positive linear relationship.
The available data allow us to assess retail performance within a CBD that has experienced several disruptions. The results of this assessment are valuable to urban planners, city economic development agencies, retailers, academics and students, as they provide insight into retail recovery and resilience after one of the most disruptive events influencing the global retail industry. Our methodological approach is informed by the type, availability and time frame of the data to assess performance during this time. In particular, we found multivariate regression to be the most applicable approach for explaining the performance change, which further allowed us to assess and interpret sub-industry changes in retail activity.
4. Methodology
Our interest in possible changes to COVID-19 lockdown-related consumer behaviors in conjunction with anticipated differences in the magnitude of the changes between the various retail sectors prompted us to build a multivariate regression model consisting of five individual equations, where a number of the same predictors were regressed on retail spending in the various retail sectors under consideration. This approach enabled the analysis of the impact of the same predictors across several models (e.g., the impact that foot traffic had on different retail sectors), as well as inferences with respect to unobserved variables with a similar impact on different retail sectors. In addition, we structured our models in a way that allowed for the obtained regression parameters to be tested concerning changes in coefficients between the pre-lockdown period group and the post-lockdown period via the inclusion of interactions between the pre- and post-lockdown periods. Using Chow tests across the constituent regression equations in our multivariate regression model, we were able to determine whether the coefficients of pre-lockdown differ from those post-lockdown. Our working hypothesis was that different foot traffic patterns affect spending in different ways due to pent up-demand, re-direction of spending into other retail sectors, greater awareness of health risks, etc.
The structure of our regression model thus takes the following form:
where:
Y(a–e)→NZD spending volume for the five equations for each retail sector in our multivariate model; subscripts a to e indicate: a—apparel and personal goods; b—hospitality; c—fuel and automotive; d—groceries and liquor and e—home and recreation;
C1→Foot traffic captured by Camera 1 (Cashel Street);
C2→Foot traffic captured by Camera 2 (Hereford Street);
C3→Foot traffic captured by Camera 3 (The Terrace);
LD→Dummy variable indicating post-lockdown period;
DoW→Vector of weekday dummies;
C→Intercept.
In this notation, x1 represents the coefficient for Camera 1 foot traffic in the pre-lockdown period and coefficient x2 represents the deviation of the post-lockdown period coefficient for foot traffic from the pre-lockdown period. Likewise, coefficients x3 and x5 represent the pre-lockdown period coefficients, whereas x4 and x6 represent the difference in coefficient magnitude between the pre- and post-lockdown periods for their respective camera locations. Coefficient x7 stands for the difference in intercepts between the pre- and post-lockdown periods, and x7–13 represents coefficients denoting the six weekdays, with Sunday being the reference category.
5. Results and Discussion
The results of our Chow regression model can be seen in
Table 4.
Equation (1)(a–e) have reasonable explanatory magnitude, as indicated by R-squared values ranging from 0.16 (fuel and automotive sales) to 0.87 (hospitality) of the explained variance. The comparatively low explained variance in fuel and automotive sales (0.16) is to be expected, as the purchase of such goods cannot be considered a prime motivation for pedestrians in the CBD.
Cashel Street is the location of the major shopping mall in the Christchurch CBD. It was purposefully redeveloped as a retail precinct as part of the rebuild and recovery plan after the devastating 2011 earthquakes [
43]. Looking at the Camera 1 location, it can be noted that in the pre-lockdown period, increased foot traffic was significantly associated with increased retail spending in all retail sectors except fuel/automotive, with home and recreation sales benefiting the most by an average of NZD 24.95 spent per measured pedestrian at the CCTV location. In the post-lockdown period, this spending increased substantially in each retail sector, with hospitality sales accounting for a mean additional spending of NZD 68.91 per foot traffic unit, which brings total spending per measured pedestrian to (NZD 18.76 + NZD 68.91) = NZD 87.67. Apparel and personal goods (NZD 11.99), as well as groceries and liquor sales (NZD 3.55), showed a significant relationship between the measured pedestrian movements prior to lockdowns and significant increases in spending per measured pedestrian movement after the lockdowns (apparel and personal goods: NZD 11.99 + NZD 56.75 = NZD 68.74; groceries and liquor: NZD 3.55 + NZD 8.27 = NZD 11.82).
CCTV Camera 2, located in Hereford Street, was in an area characterized mainly by commercial buildings, take-away outlets and lunch bars popular with employees from nearby offices and retailers. In CCTV location 2, the measured pedestrian traffic prior to lockdown was only associated with spending in two retail sectors, apparel and personal goods (−NZD 3.33) and groceries and liquor (−NZD 0.49). These negative associations may be a result of the absence of outlets in these two sectors in the vicinity of the CCTV location. The negative association in the apparel and personal goods sector was exacerbated after the lockdown (NZD −3.33−NZD 15.18 = −NZD 18.51), whereas groceries and liquor sales flipped from a significantly negative to a positive association between sales and measured pedestrian traffic (−NZD 0.49 + NZD 4.16 = NZD 3.67).
CCTV Camera 3 was located at the Terrace. The Terrace is a picturesque hospitality area along the River Avon in the Christchurch CBD, and is home to numerous cafés, bars and restaurants. The pricing level of the services provided by these establishments is generally well above the average for Christchurch. The area incurred significant damage from the two 2010/11 earthquakes, and, subsequently, the Terrace underwent significant remodeling and reconstruction. Since 2018, a substantial number of new venues have opened, as well as existing venues which reopened after renovation. Due to the attractions in the vicinity, such as the Botanic Gardens, city center and arts precinct, along with the increasing numbers of domestic and international tourists, the Terrace has emerged as a major hub for visitors and diners.
It is, thus, notable that our model does not reveal any substantial relationship between pedestrian traffic and hospitality sales volume at the Terrace. This holds for both pre- and post-COVID-19 lockdowns. While increased pedestrian traffic along the Terrace did not relate to higher consumer spending on hospitality in the Christchurch CBD, there were significant associations between foot traffic along the Terrace and spending on “apparel & personal goods” and “home & recreation”, despite the lack of such outlets in this area of the CBD. Furthermore, we observed a reversal of the established pre-lockdown pattern in the post-lockdown period for both retail sectors (
Table 4 and
Table 5). For both retail sectors, we observed a substantive negative relationship between foot traffic and consumer spending in the pre-lockdown period (x
5 = −15.1 and x
5 = −21.1 respectively). This may be due to the presence of international and domestic tourists. In the post-lockdown environment, on the other hand, this negative association disappeared.
Finally, in CCTV location 3, the Terrace, there was a strong negative pre-lockdown association between pedestrian traffic and retail spending in the apparel and personal goods sector (−NZD 4.06 per measured pedestrian); however, in the post-lockdown environment, there was a significant turnaround in spending, with spending becoming positively associated with increasing foot traffic (−NZD 4.06 + NZD 5.17 = NZD 1.11).
Table 5 shows the significance levels of the changes between the regression coefficients from pre- to post-lockdown. It is evident that in many location/retail sector combinations, there were significant changes in the associations between pedestrian traffic and spending.
One of the advantages of a multivariate regression model is that it enables an examination of whether the residuals of constituent regression equations are independent of one another, as well as whether there are unobserved variables that are common to individual equations. In our specific multivariate model, we found that there was dependency regarding what drives spending between individual sectors (chi2 = 508.45;
p < 0.001), and that there were substantial correlations of residuals between apparel and personal goods and hospitality, groceries/liquor and home and recreation spending (
Table 6). This indicates that there is a common driver that prompts residents to visit the CBD to frequent outlets in these retail sectors.
6. Discussion
Prior to 2011, “the wider CBD was in slow decline, fighting a losing battle against the domination of suburban retail malls” [
12]. The decentralization of retail areas has been driven by many factors. Reilly’s Law describes a long-term trend of retail gravitation away from CBDs. While city planners and policy makers envisioned a growing and successful retail precinct following the recovery from the earthquake, the pressure of e-commerce, changes in consumer behavior and exogenous events such as COVID-19 continue to test the resilience of retail. As retail has bounced back from unexpected events, it has become clear that recovery and future growth strategies need to be embedded into management strategies for CBD revitalization that recognize the changing spatial retail patterns of consumers post-crisis, but also as ways to build urban resilience and disaster resilience. Recovery and future growth strategies must also consider sustainable urban mobility planning issues to take cognizance of the need for city centers to become more inclusive, safe, resilient and sustainable over time [
5,
27,
28]. The findings have implications for resilient and sustainable urban mobility planning and real estate growth in CBDs, but should also be able to assist the local government in funding allocation for recovery and regeneration projects.
Christchurch provides a unique opportunity to assess the relationship between pedestrian traffic and retail spending, as the regeneration of the built environment and public open space is still continuing a decade after the damaging earthquakes. The commercial investment response in the CBD since the earthquake has been remarkable, replacing 85 percent of the 446,000 square meters of commercial stock lost in the earthquake [
44]. The outcome of this investment resembles a new business and retail precinct [
45]. The pedestrian–spending relationship within Christchurch is not only important for local investment and local city planners, but also provides an opportunity for wider realignment and adoption of revitalization and regeneration for place-makers, planners, economists, investors and tenants in their respective environments. Consumer spending through EFTPOS continues to be relevant in an era of disasters, pandemics and disruption. Thus, pedestrian traffic is an important indicator of adaptive resilience [
32], allowing urban planners to devise recovery strategies that may boost such traffic within the CBD post-COVID-19 and retain the vibrancy of urban centers.
Our results confirm what other research has shown—that COVID-19–associated lockdowns have had a significant impact on consumer behaviors, in terms of both the magnitude of spending and its component elements [
4]. Associations between spending and pedestrian traffic have changed in the majority of locations. Several factors may have contributed to these changes.
The strongest findings from our models pertain to one shopping area—namely, Cashel Street. This shopping area contains major retailers and related businesses, and it is clear that pedestrian visits to this location are linked with a primary intention to engage in shopping activities. For the Cashel Street model, the following was observed:
Online shopping—the shift to online shopping by New Zealand consumers increased during the pandemic [
4]. This may explain the reduced spending on the apparel and personal goods sector and the increase in spending in the home and recreation sector, as people changed their preferences regarding online and brick and mortar shopping after the pandemic. It may be assumed that for home and recreation, there is a persistent preference for a physical retail experience for many shoppers. These trends conform to what has been observed in previous studies conducted in other locations [
10,
14].
Changes in tourist spending—the Christchurch CBD was heavily reliant on international and domestic tourism prior to the pandemic, with tourists frequenting hospitality- and tourist-related businesses. The inability of international and domestic tourists to visit during both lockdowns explains the decrease in spending in the hospitality sector during this period, as tourist pedestrians represented a lower share of the pedestrian mix throughout the examined period.
By expanding this discussion, it can clearly be seen that the nature of pedestrian and consumer behavior in the hospitality sector changed between the pre- and post-lockdown periods. While overall pre-lockdown spending on hospitality was higher than that post-lockdown, larger crowds in the CBD were detrimental to hospitality spending pre-COVID-19, whereas in the post-COVID-19 environment, increases in CBD foot traffic increased hospitality receipts, pointing to different traffic and consumption patterns in the aftermath of the COVID-19 lockdowns. Estimating predictive margins for consumer spending on hospitality associated with traffic on “The Terrace” (Camera 3) revealed a different spending pattern. Camera 3 was located at the center of the Christchurch CBD entertainment precinct. Here, post-lockdown consumer spending exceeded pre-lockdown spending; however, greater crowds in the pre-lockdown period generated disproportionally greater consumer spending on hospitality. This hospitality spending pattern is the reverse of the one observed in the adjacent CBD region.
In response to this potential challenge, retailers may need to reposition themselves as more hospitality- and entertainment-focused nodes in order to draw more customers away from online shopping. This could potentially include activities such as hosting events, offering discounts and/or partnering with local hospitality establishments.
Changes to local spending patterns—The local resident population in Christchurch was better prepared for the second lockdown and may have been more inclined to prepare meals at home or receive them from delivery services, as they were prepared for disruptions in food and hospitality services within the CBD. Furthermore, the increase in spending in the groceries and liquor sector post-lockdown may be explained by this adaptation by consumers during the pandemic.
Christchurch’s redevelopment, with new commercial buildings and an expanding office employment sector, provides a range of compelling reasons for pedestrians to visit retail and hospitality areas. This could be further enhanced by introducing more entertainment facilities, such as cinemas, theaters and museums, as well as greater encouragement for downtown living. The spending shift from consumers within the CBD demonstrates the diversity a CBD can offer as a regional retail node, able to withstand changes in consumer spending habits within a relatively short period of time. The ongoing changing economic environment, with high inflation and increasing interest rates, is likely leading to another round of disruption to retail, which will provide an avenue for future research.
7. Conclusions
In conclusion, this paper confirms the strong pre-lockdown association between pedestrian traffic and retail spending in Christchurch, which has changed since the COVID-19 lockdown periods were imposed. This research found that the established relationship between pedestrian traffic and retail spending in key product areas remains strong. It is also evident that in certain areas (the Terrace), the relationship between such traffic and hospitality spending, in particular, indicates the changing nature of this area of the CBD, becoming a vibrant location within which people can congregate and meet. Taken together, the regressions also suggest that there is a degree of complexity in the interconnection between pedestrians and retail spending. This could be due to a change in the mix of pedestrians (especially in terms of international visitor mix) and to changes in the purchasing preference of locals who substitute spending in different sectors and locations.
As the pandemic abated, the disruption of retail businesses and services concomitantly declined. During this phase, local city planners, retailers, investors and tenants began to consider the future trajectory of the retail sector in order to make informed decisions. For example, consumer trends and spending patterns needed to be monitored closely to ensure that resources were allocated optimally, so that businesses were able to respond to changing consumer retail needs. The risk of online competition also inexorably increased as digital shopping continued to attract more customers.
Pedestrian count data can be used to inform decision makers of the attractiveness of CBD locations for potential new tenants and retailers who may be turning away from the online shopping experience in favor of physical presence for certain product categories. By understanding the spending patterns and preferences of consumers in relation to pedestrian foot traffic, local city planners, retailers, investors and tenants can better respond to the changing retail landscape, ensuring that their businesses are optimally positioned to take advantage of the opportunities brought on by the pandemic and an Amazon-proof city.
8. Limitations
Our study has several limitations. We obtained a partial view of Christchurch consumers only—even those who visit the CBD. Our pedestrian data were collected at only three Christchurch CBD locations. While these did provide a reasonable insight into foot traffic, our data represented only a limited view of the whole of the Christchurch CBD. Furthermore, we did not capture spending via other digital forms, such as digital wallets or payment through cash.
Suburban consumers, who are less likely to visit the CBD, may have shifted their shopping locations during the pandemic for certain retail categories. The impact of the COVID-19 pandemic on retail spending and the shift in consumer behaviors needs to be closely monitored by local city planners, retailers, investors and tenants in order to adjust to new realities and ensure the marginalization of risks and future resilience. This impact is an area of study that is not limited to Christchurch alone, but is warranted for many urban centers adapting to the changing nature of consumer behavior and the perception of the CBD.


