Article

Accurate Detection of Concrete Pavement Thickness Based on Ultrasonic Array

1
Key Laboratory of Transport Industry of Road Structure and Material, Research Institute of Highway, Ministry of Transport, Beijing 100029, China
2
Key Laboratory of Road and Traffic Engineering of the Ministry of Education, Key Laboratory of Infrastructure Durability and Operation Safety in Airfield of CAAC, Tongji University, Shanghai 200092, China
3
Taizhou Airport Investment Development Co., Ltd., Taizhou 317700, China
*
Author to whom correspondence should be addressed.
Sustainability 2023, 15(10), 8228; https://doi.org/10.3390/su15108228
Submission received: 14 March 2023 / Revised: 12 May 2023 / Accepted: 15 May 2023 / Published: 18 May 2023
(This article belongs to the Special Issue Structural Health Monitoring and Sustainable Built Structures)

Abstract

:
Thickness detection of concrete pavement is a critical step in construction completion acceptance and serves as an important metric for subsequent pavement performance evaluations. The crux of thickness evaluation lies in determining the interface reflection echo propagation sound time. Based on the acoustic impedance difference between the surface layer and contact layer, pavement can be classified into two types: large-difference and small-difference. By examining the singularity of the detection signal, we employed the improved correlation coefficient method and the wavelet transform maximum value method to identify the interface reflection echo sound time. This study refines the traditional correlation coefficient method by using the surface direct wave as the reference signal, simplifying the signal analysis process. In actual detection, for the type of concrete pavement with large differences in acoustic impedance, the average relative error between the improved correlation coefficient method and the core drilling method can be reduced to 1.7%; for the type with small differences, the average relative error of the detection results obtained using the wavelet transform modulus maximum method can be reduced to 1.9%, showcasing high accuracy.

1. Introduction

The thickness of concrete pavement must adhere to design specifications and standards to ensure it can support the weight of aircraft and other loads on the runway. Runway surface thickness significantly impacts the overall strength of the runway and serves as an essential factor in evaluating the road surface structure [1,2]. Timely evaluation of the runway surface’s structural condition can help prevent extensive structural damage and ensure the runway’s normal and safe operation [3,4].
Initially, engineers primarily employed core sampling drilling methods, digging, or other destructive techniques. Later, ground penetrating radar (GPR), ultrasonic reflection, and other non-destructive testing technologies began to be applied for pavement thickness detection. Compared to traditional methods, GPR has substantially improved efficiency, with the accuracy of detection results exceeding 90%. However, GPR relies on the dielectric properties of concrete; particularly, dielectric changes caused by early-stage aging can affect the accuracy and stability of measurement results [5,6,7]. Additionally, waveform analysis is more complex and often requires manual correction [8,9,10].
Furthermore, some researchers have proposed a new inverse algorithm for multi-layer pavement structure based on the backcalculation of moduli using the Falling Weight Deflectometer (FWD), capable of calculating both pavement stiffness and thickness simultaneously [11,12]. A semi-automatic tool for pavement condition detection based on three-dimensional profile scanning has also been proposed [13].
The ultrasonic pulsed detection method leverages the propagation characteristics of pulses in a medium to determine surface layer thickness based on the intensity, phase, direction, and other acoustic indicators of reflected or transmitted waves. This method boasts high signal resolution accuracy, fast processing speeds, and stable results. Edwards employed various nondestructive testing methods to obtain pavement structure layer thickness and analyzed the errors, finding that the ultrasonic pulse wave testing method demonstrated higher accuracy [14]. Mary used an ultrasonic array device to detect the surface layer thickness of two newly constructed cement concrete roads with an asphalt stabilized crushed stone base, achieving a correlation coefficient of 0.9968 between the results and core drilling thickness data, with an average error of 6 mm [15,16,17].
Compared to other methods, ultrasonic detection is better suited for surface layer thickness testing. The crux of thickness detection lies in determining the interface reflection echo propagation sound time T. However, issues such as signal identification at the interface between the surface layer and subgrade, signal scattering by large-size aggregates, and the superposition of surface, transverse, and reflected waves in the signal can hinder accurate determination of T [18]. The correlation coefficient method is commonly used to ascertain T. The crucial step in this process involves obtaining the reference signal. Traditionally, this reference signal is computed analytically, by simulating the waveform of the transmitted pulse wave. However, as the transmitted wave propagates through the medium, it experiences gradual signal attenuation. The accuracy of this traditional method is entirely reliant on the calculation precision of the analytical method, a level of exactness that often falls short in meeting the demands of the engineering field.
Fu utilized a one-sender-two-receiver system to gather echo pulse signals, identifying reflected waves based on their kinematic and dynamic characteristics. This approach resulted in an absolute error of no more than 7 mm and a relative error of no more than 3% [19]. Nonetheless, due to the non-uniformity of cement concrete materials, multiple samples are required at each detection point, necessitating a specific observation method. The actual operation is not only laborious but also destabilizes the final measurement results. Wang, on the other hand, applied the multiple wavelet method to eliminate noise signals, using waveform analysis to determine the take-off point position. Field detection results showed that this method had an error of less than 4% for the thickness detection of newly constructed pavements, and an error exceeding 10% for pavements already in use, signifying a relatively large margin of error [18,20]. Both methods initially approximate the reflection echo’s range by estimating the pavement’s thickness, then analyze the specific time point of the reflection echo’s arrival. However, when the pavement thickness is unknown or inaccurately estimated, it directly impacts the detection results.
In ultrasonic array detection, the surface direct wave experiences minimal loss compared to the emitted wave, allowing the surface direct wave to serve as a reference signal for improving the traditional correlation coefficient method. Considering the variability of detection signals and types of surface structures in actual engineering projects, pavements can be classified into two types based on the differences in acoustic impedance between the surface layer and contact layer: large and small. This study will examine the variation patterns of detection signal singularity for both types and propose corresponding methods for determining the propagation time of the respective interface reflection echoes.

2. Ultrasonic Array Testing Equipment and Principle

2.1. Ultrasonic Array Testing Equipment

Figure 1 shows the ultrasonic array detection apparatus and the detection principle applied in this study. The detection apparatus has dry point contact transducers built in, with nine array transducers in the transmitting area and nine array transducers in the receiving area, all arranged in a 3 × 3 matrix. Each transducer in the device’s transmitting area emits a 50 kHz transverse wave to the concrete structure, and the receiving transducer’s transverse counterpart collects the scanned signal. In a single detection, multiple pairs of scanned signals exist concurrently, and the detection signal that is obtained after averaging the data improves the signal-to-noise ratio and stability. It should be noted that to ensure the accuracy of the measurement results, the ultrasound equipment has been factory-calibrated prior to conducting the experiments.

2.2. Ultrasonic Array Testing Principle for Concrete Surface Layer Thickness Detection

Ultrasonic array testing equipment emits ultrasonic pulsed waves through the transmitting transducer. When the ultrasonic pulse waves are incident from medium 1 to medium 2, reflection and refraction of waves will occur on the interface between the two media. Figure 2 is the principle of ultrasonic detection of surface layer thickness [21,22]. The ultrasonic pulsed wave is incident from the surface layer to the base, and reflection and refraction are generated on the interface of surface layer and base. The reflected waves reflected by the interface (the interface reflection echo) and the direct wave propagated on the surface layer (the surface direct waves) are collected by the receiving transducer.
The propagation distance of an ultrasonic pulse wave in a structure can be calculated using the propagation speed and time of the ultrasonic pulse wave. The built-in transducer spacing is fixed, and the thickness of the surface can be calculated using Equation (1), which uses the geometric relationship between the built-in transducer spacing and the propagation distance to calculate the thickness of the surface.
H = 1 2 ( C T ) 2 L 2
where
H: concrete thickness, m;
C: sound velocity, m/s;
T: interface reflection echo propagation sound time, s;
L: distance between two transducers, m.
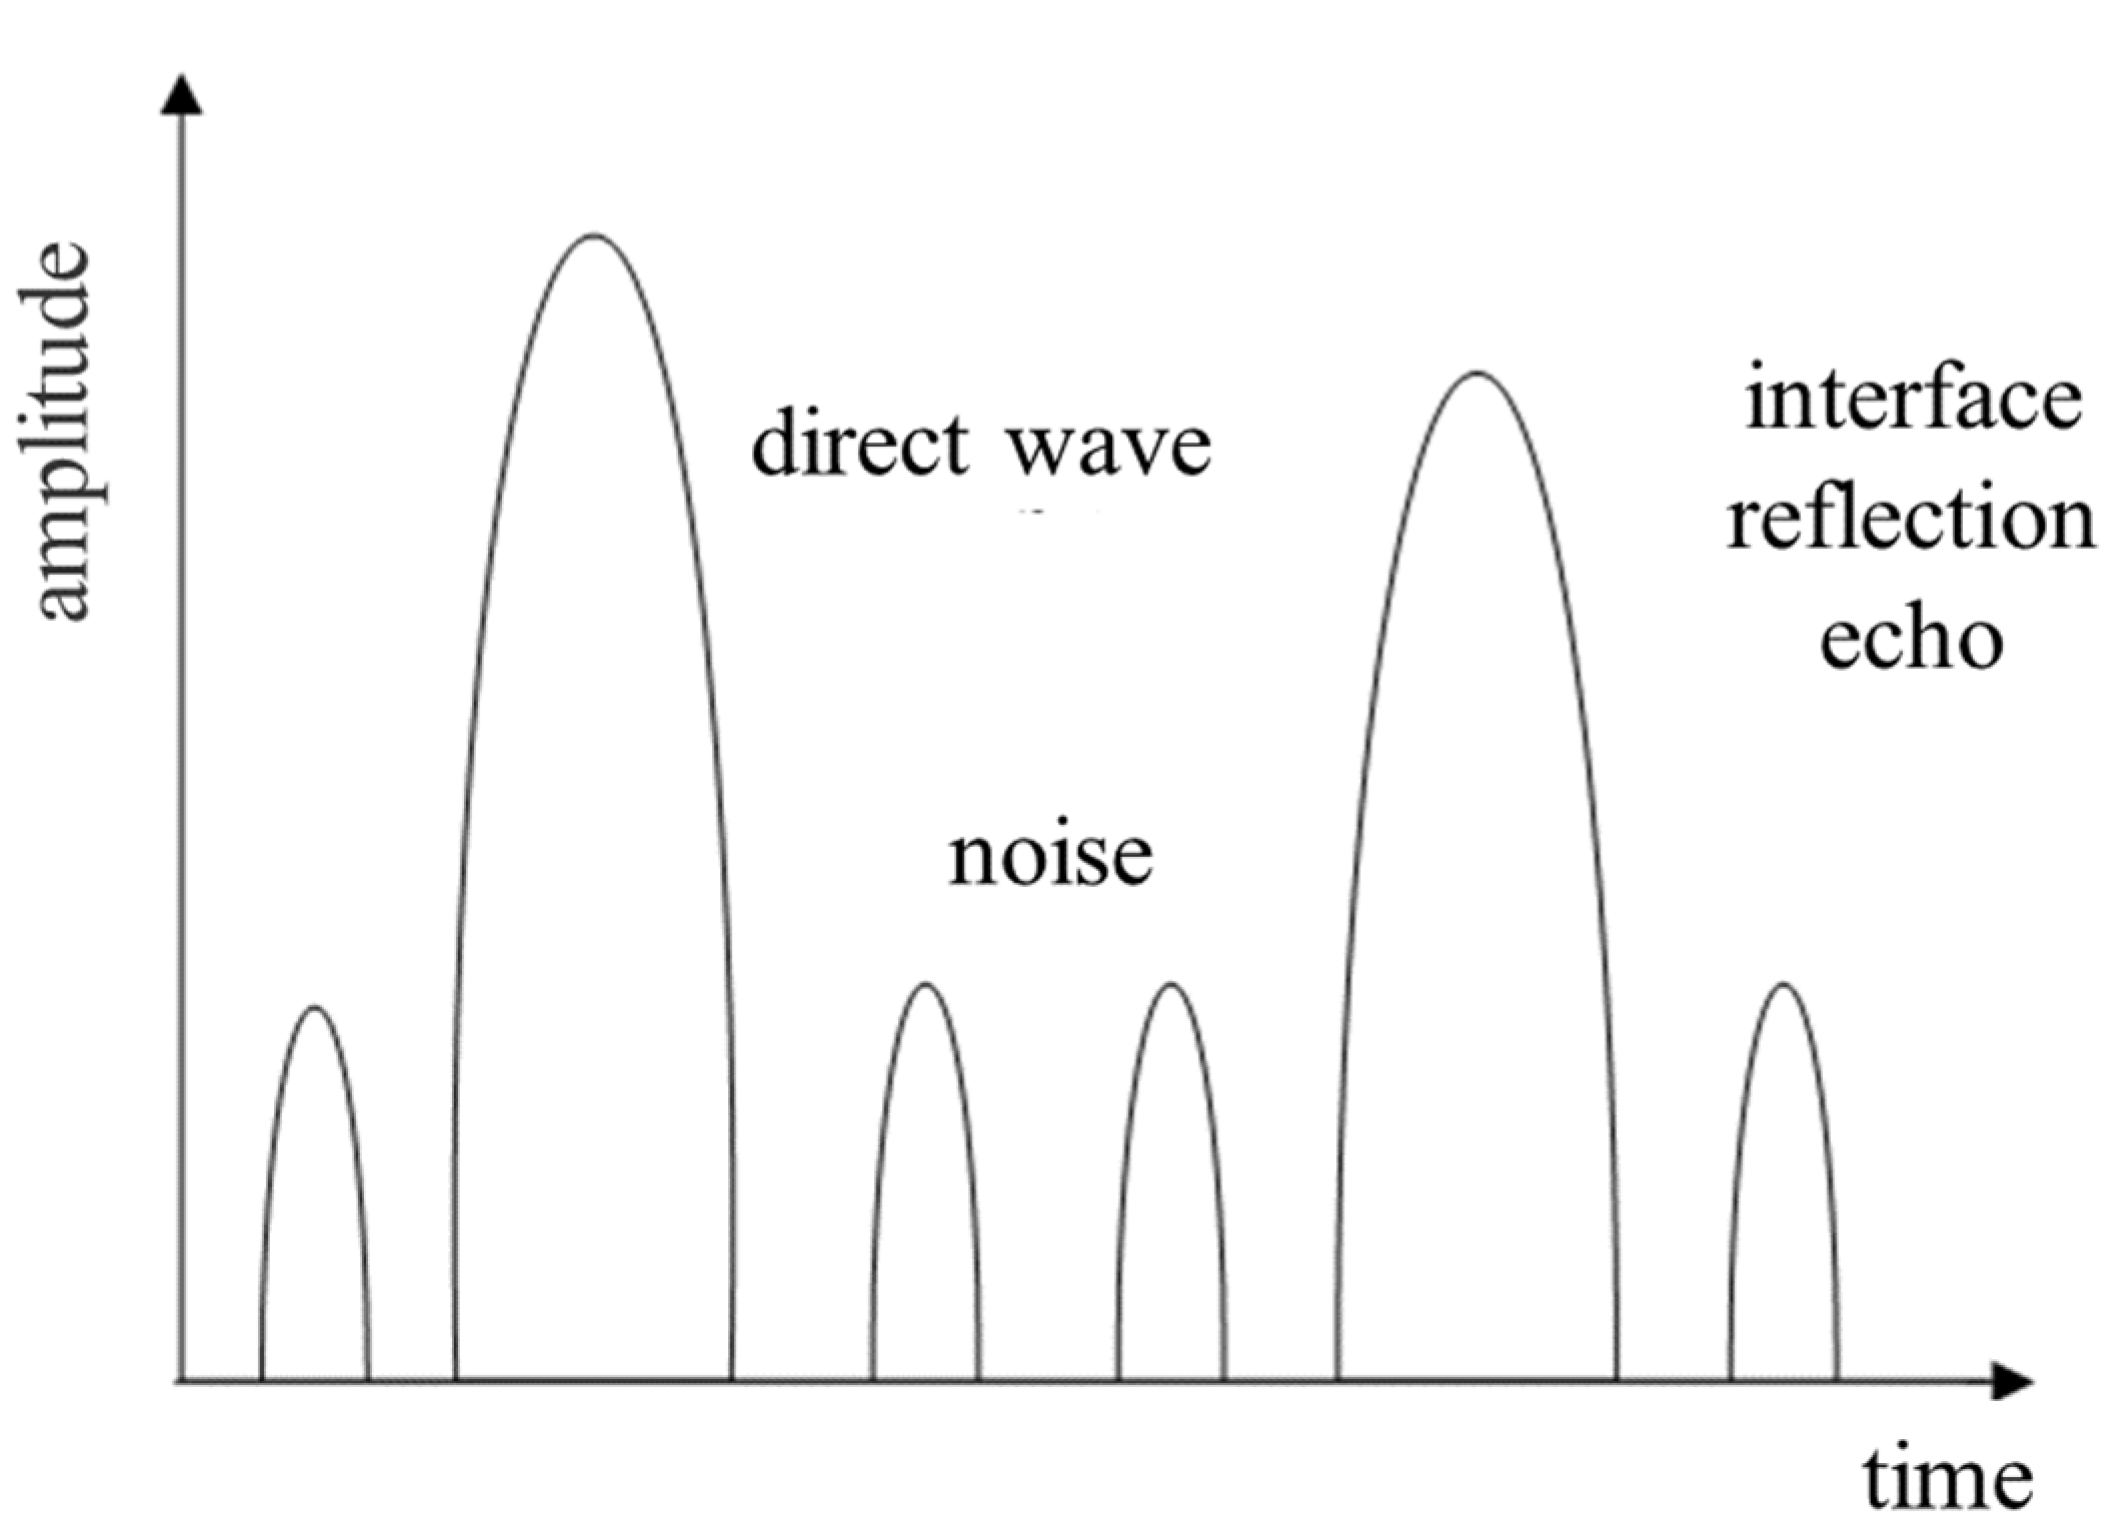
Figure 3 depicts a schematic diagram of an ultrasonic array detection signal. The detection signal primarily consists of surface direct waves, interface reflection echoes, and noise. The amplitude of the interface reflection echo is tied to the interface reflectivity. The larger the disparity between the acoustic impedance of medium 1 and medium 2, the higher the interface reflectivity. Conversely, the closer the acoustic impedance of medium 1 and medium 2, the lower the interface reflectivity. As per Equation (1), the accurate measurement of the surface layer’s thickness hinges on obtaining the sound velocity C and the sound propagation time T of the interface reflection echo. For the ultrasonic array testing device used in this study, L is a constant. The device features a sound velocity determination module that eliminates the need for post-processing, thereby enabling the acquisition of the ultrasonic pulse wave sound velocity for each detection. In essence, the crux of evaluating surface layer thickness lies in determining the interface reflection echo propagation sound time T from the acquired signal, which includes the surface direct wave and interface reflection echo.

2.3. Classification of Concrete Pavement Structures for Ultrasonic Array Detection

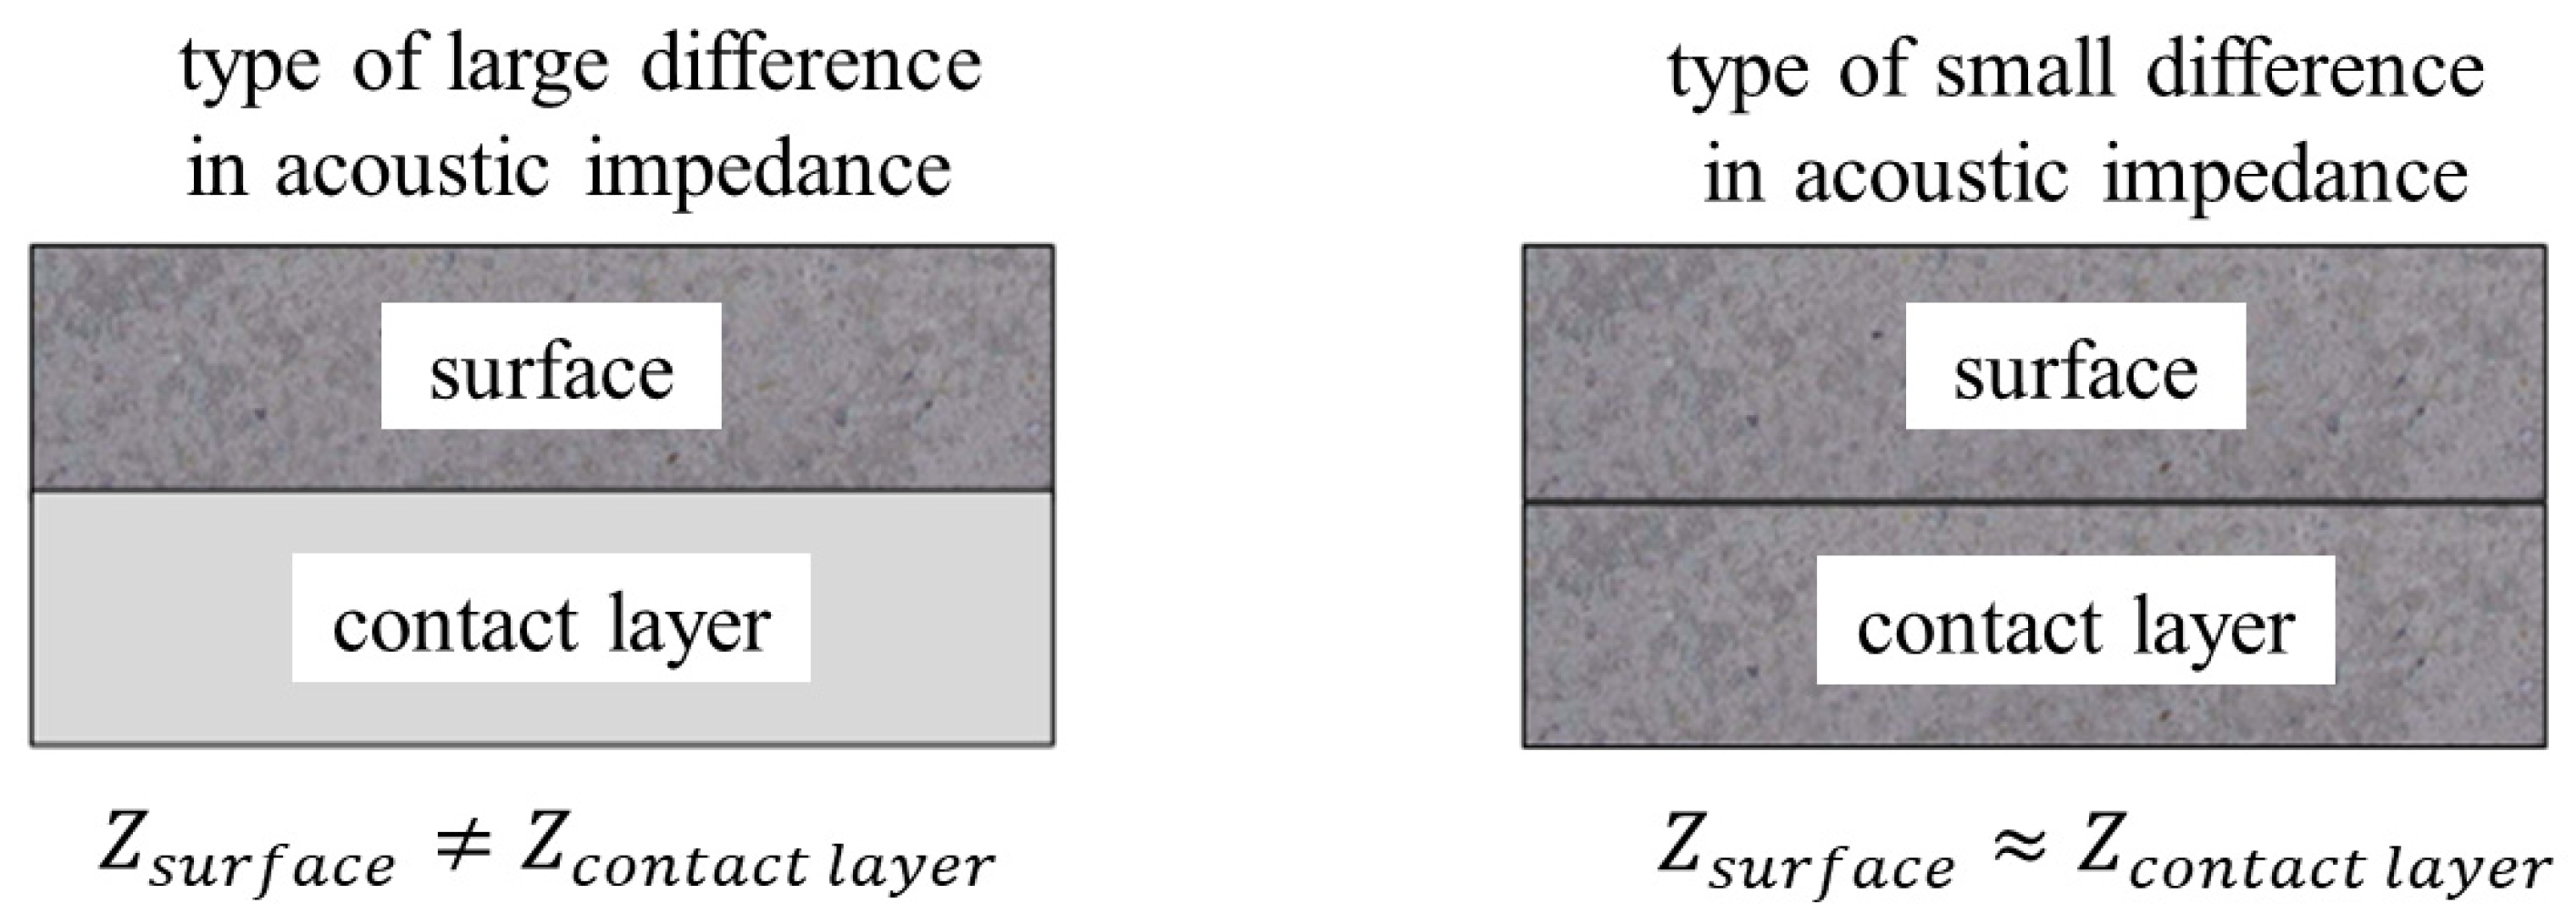
A concrete pavement base is usually either semi-rigid or flexible, and in some cases, an isolation layer is placed between a semi-rigid base and the surface layer. The ultrasonic array detection signal is related to the interface reflectivity between the surface and contact layers. The interface reflectivity is determined by the acoustic impedance of the adjacent medium, and the acoustic impedance is related to the physical properties of the material. Depending on detection signal variability and the actual pavement structure, a concrete pavement structure can have either a large or small difference in acoustic impedance between the surface layer and the contact layer. In this paper, a large difference in terms of acoustic impedance between the surface and contact layer material is referred to as the ‘type of large difference in acoustic impedance’ of concrete pavement structure. It typically has a flexible base or an isolation layer between the base and the surface layer, etc. A small difference in terms of acoustic impedance between the surface and contact layer material is referred to as the ‘type of small difference in acoustic impedance’. It typically has a base composed of semi-rigid material, with no separation layer between the surface and the base. Figure 4 shows the structural composition of types of large and small difference in acoustic impedance of concrete pavement, where Z is the acoustic impedance.

3. Signal Processing and Data Analysis

The primary goal of ultrasonic array detection for surface layer thickness evaluation is to determine the sound time T of the reflected echo propagation at the surface layer/base layer interface. The threshold and correlation coefficient methods are commonly used to calculate the propagation sound time T for the type of large difference concrete pavement. The threshold method sets the amplitude threshold. When the signal wave amplitude exceeds the threshold, T can be determined. However, this threshold method is susceptible to noise and its detection accuracy is low. The correlation coefficient method offers greater accuracy than the threshold method, but the reference signal is more complicated to obtain.
This study aims to extract the reference signal by analyzing the original waveform features of the surface direct wave. For pavements with a large difference in acoustic impedance, an improved correlation coefficient method is employed to simplify the signal processing flow. For pavements with a small difference in acoustic impedance, the detection signal is analyzed using the wavelet transform modulus maximum method to extract characteristic information related to the reflection of interface echo propagation sound.

3.1. Signal Pre-Processing

By studying the fluctuation condition of the detection signal and comparing the advantages and disadvantages of various signal processing algorithms, this study propose the following pre-processing method: (1) the Pearson coefficient method (Equation (2)) to determine the mean value of the signal after removing the abnormal signal to eliminate interference from the abnormal signal; (2) signal normalization to eliminate the numerical difference of the detection signal that is caused by different initial setting parameters; and (3) wavelet denoising to reduce noise and improve the signal-to-noise ratio.
C j X Y = C o v [ X , Y j ] V a r [ X ] V a r [ Y j ] = i = 1 N ( x i x m e a n ) ( y i j y j m e a n ) i = 1 N ( x i x m e a n ) 2 i = 1 N ( y j i y j m e a n ) 2
where
j: the j t h signal;
i: the i t h intensity value within a signal;
X and Y j : reference signal and j t h comparison signal, respectively;
Cov and Var: covariance and variance, respectively;
x i and y j i : the i t h intensity value within the reference signal and comparison signal, respectively;
x m e a n and y m e a n j : the mean intensity value of the reference signal and comparison signal, respectively;
N: number of intensity values in the signal;
C X Y j : a value of 0 indicates no correlation, a value of 1 indicates that the two signals are linearly correlated, and a higher value indicates that the two signals are more closely correlated.

3.2. Empirical Mode Decomposition to Remove Surface Direct Waves

The detection signal includes surface direct waves, interface reflection echoes, and defect reflection echoes, etc. The surface direct wave and interface reflection echo waveforms are similar but appear at different times. The improved correlation coefficient method will be affected by the surface direct wave when the method is used to identify the propagation sound of the interface reflection echo. Therefore, empirical mode decomposition is used to remove the surface direct wave.
Empirical mode decomposition is applicable for nonlinear nonstationary signals and provides high accuracy with regard to both time and frequency [23,24]. In addition, the signal processing does not require prior analysis, so it is suitable for removing surface direct waves. This method first decomposes the detected signal into empirical modes to obtain several intrinsic mode functions (IMFs) and then selects the corresponding IMFs to reconstruct the signal by setting the energy threshold value. Equation (3) defines the ultrasound continuous signal.
x ( t ) = A e α t cos ( 2 π f t )
where
A: signal amplitude;
f: natural frequency, Hz;
α : decay factor.
The specific steps for empirical mode decomposition are as follows.
(1)
Calculate the maxima and minima values of x ( t ) .
(2)
Use the cubic spline interpolating function to calculate the maxima envelope x max ( t ) and the minima envelope x min ( t ) .
(3)
Calculate m ( t ) = ( x max ( t ) + x min ( t ) ) / 2 .
(4)
Calculate d ( t ) = x ( t ) m ( t ) .
(5)
Replace x ( t ) with d ( t ) and repeat steps (1)~(4) for k times, then obtain the d k and d k 1 . Where, d k is k t h filtered data, and d k 1 is ( k 1 ) t h filtered data.
(6)
Judge whether d k and d k 1 meet the conditions of Equation (4).
t = 0 T d k 1 ( t ) d k ( t ) d k 1 2 ( t ) 0.3
where, T is total number of sampling points. If the conditions are met, d k is the first intrinsic modal function (IMF), denoted as c 1 otherwise, repeat step (1)~(5) until the condition is met.
(7)
Replace x ( t ) with r 1 ( t ) = x ( t ) c 1 . Repeat steps (1)~(6) to obtain each intrinsic mode function in turn. Empirical modal decomposition ends when r n ( t ) can no longer be decomposed.
After decomposition, the original signal can be expressed as Equation (5).
x ( t ) = j = 1 n c j ( t ) + r n ( t )
where
r n ( t ) : residual amount after decomposition;
c j ( t ) : the j t h intrinsic mode function after decomposition.
Each IMF that is obtained via decomposition contains information about different frequency bands, and some contain information about removing surface direct waves. By calculating the energy of the intrinsic mode functions and setting the energy threshold, energy of the intrinsic mode functions that are smaller than the threshold is removed, and the remaining mode functions are used to reconstruct the signal.
Equation (6) is the intrinsic mode function energy calculation formula [25].
E ( j ) = t = 1 T e j 2 ( t )
where
T: intrinsic mode function’s total number of discrete points;
e j ( t ) : t t h discrete point amplitude of the j t h intrinsic mode function.
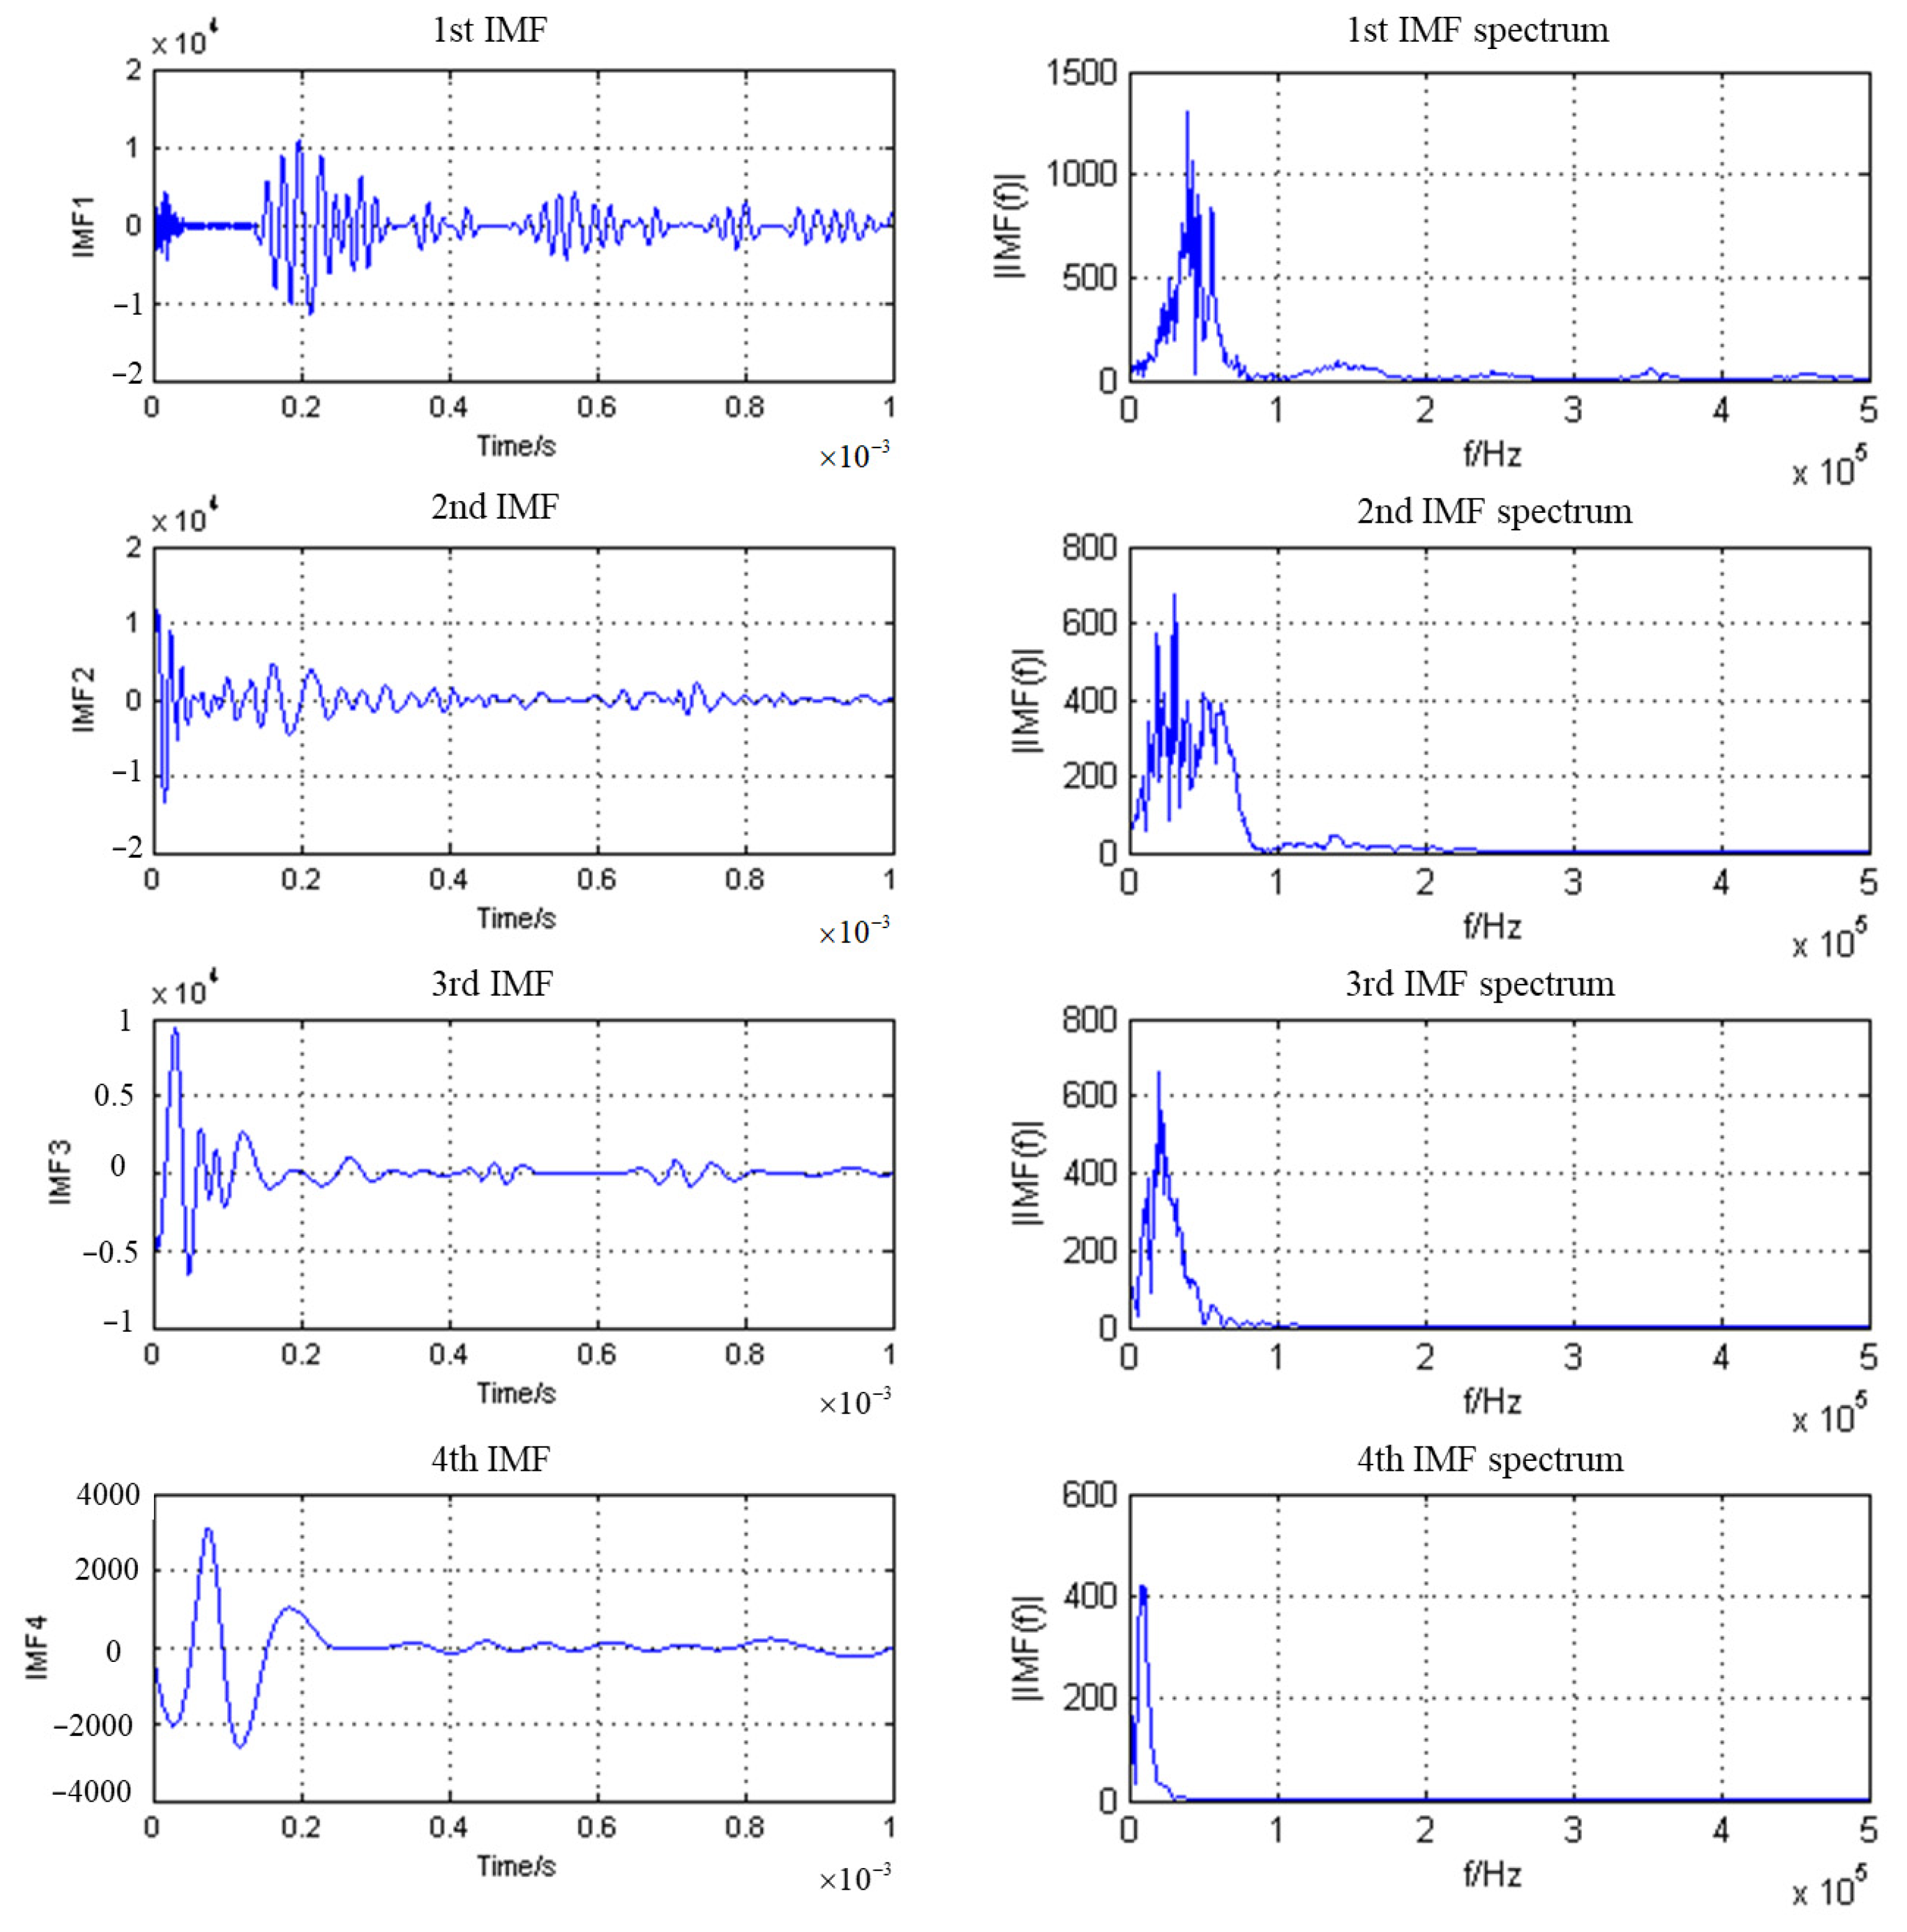
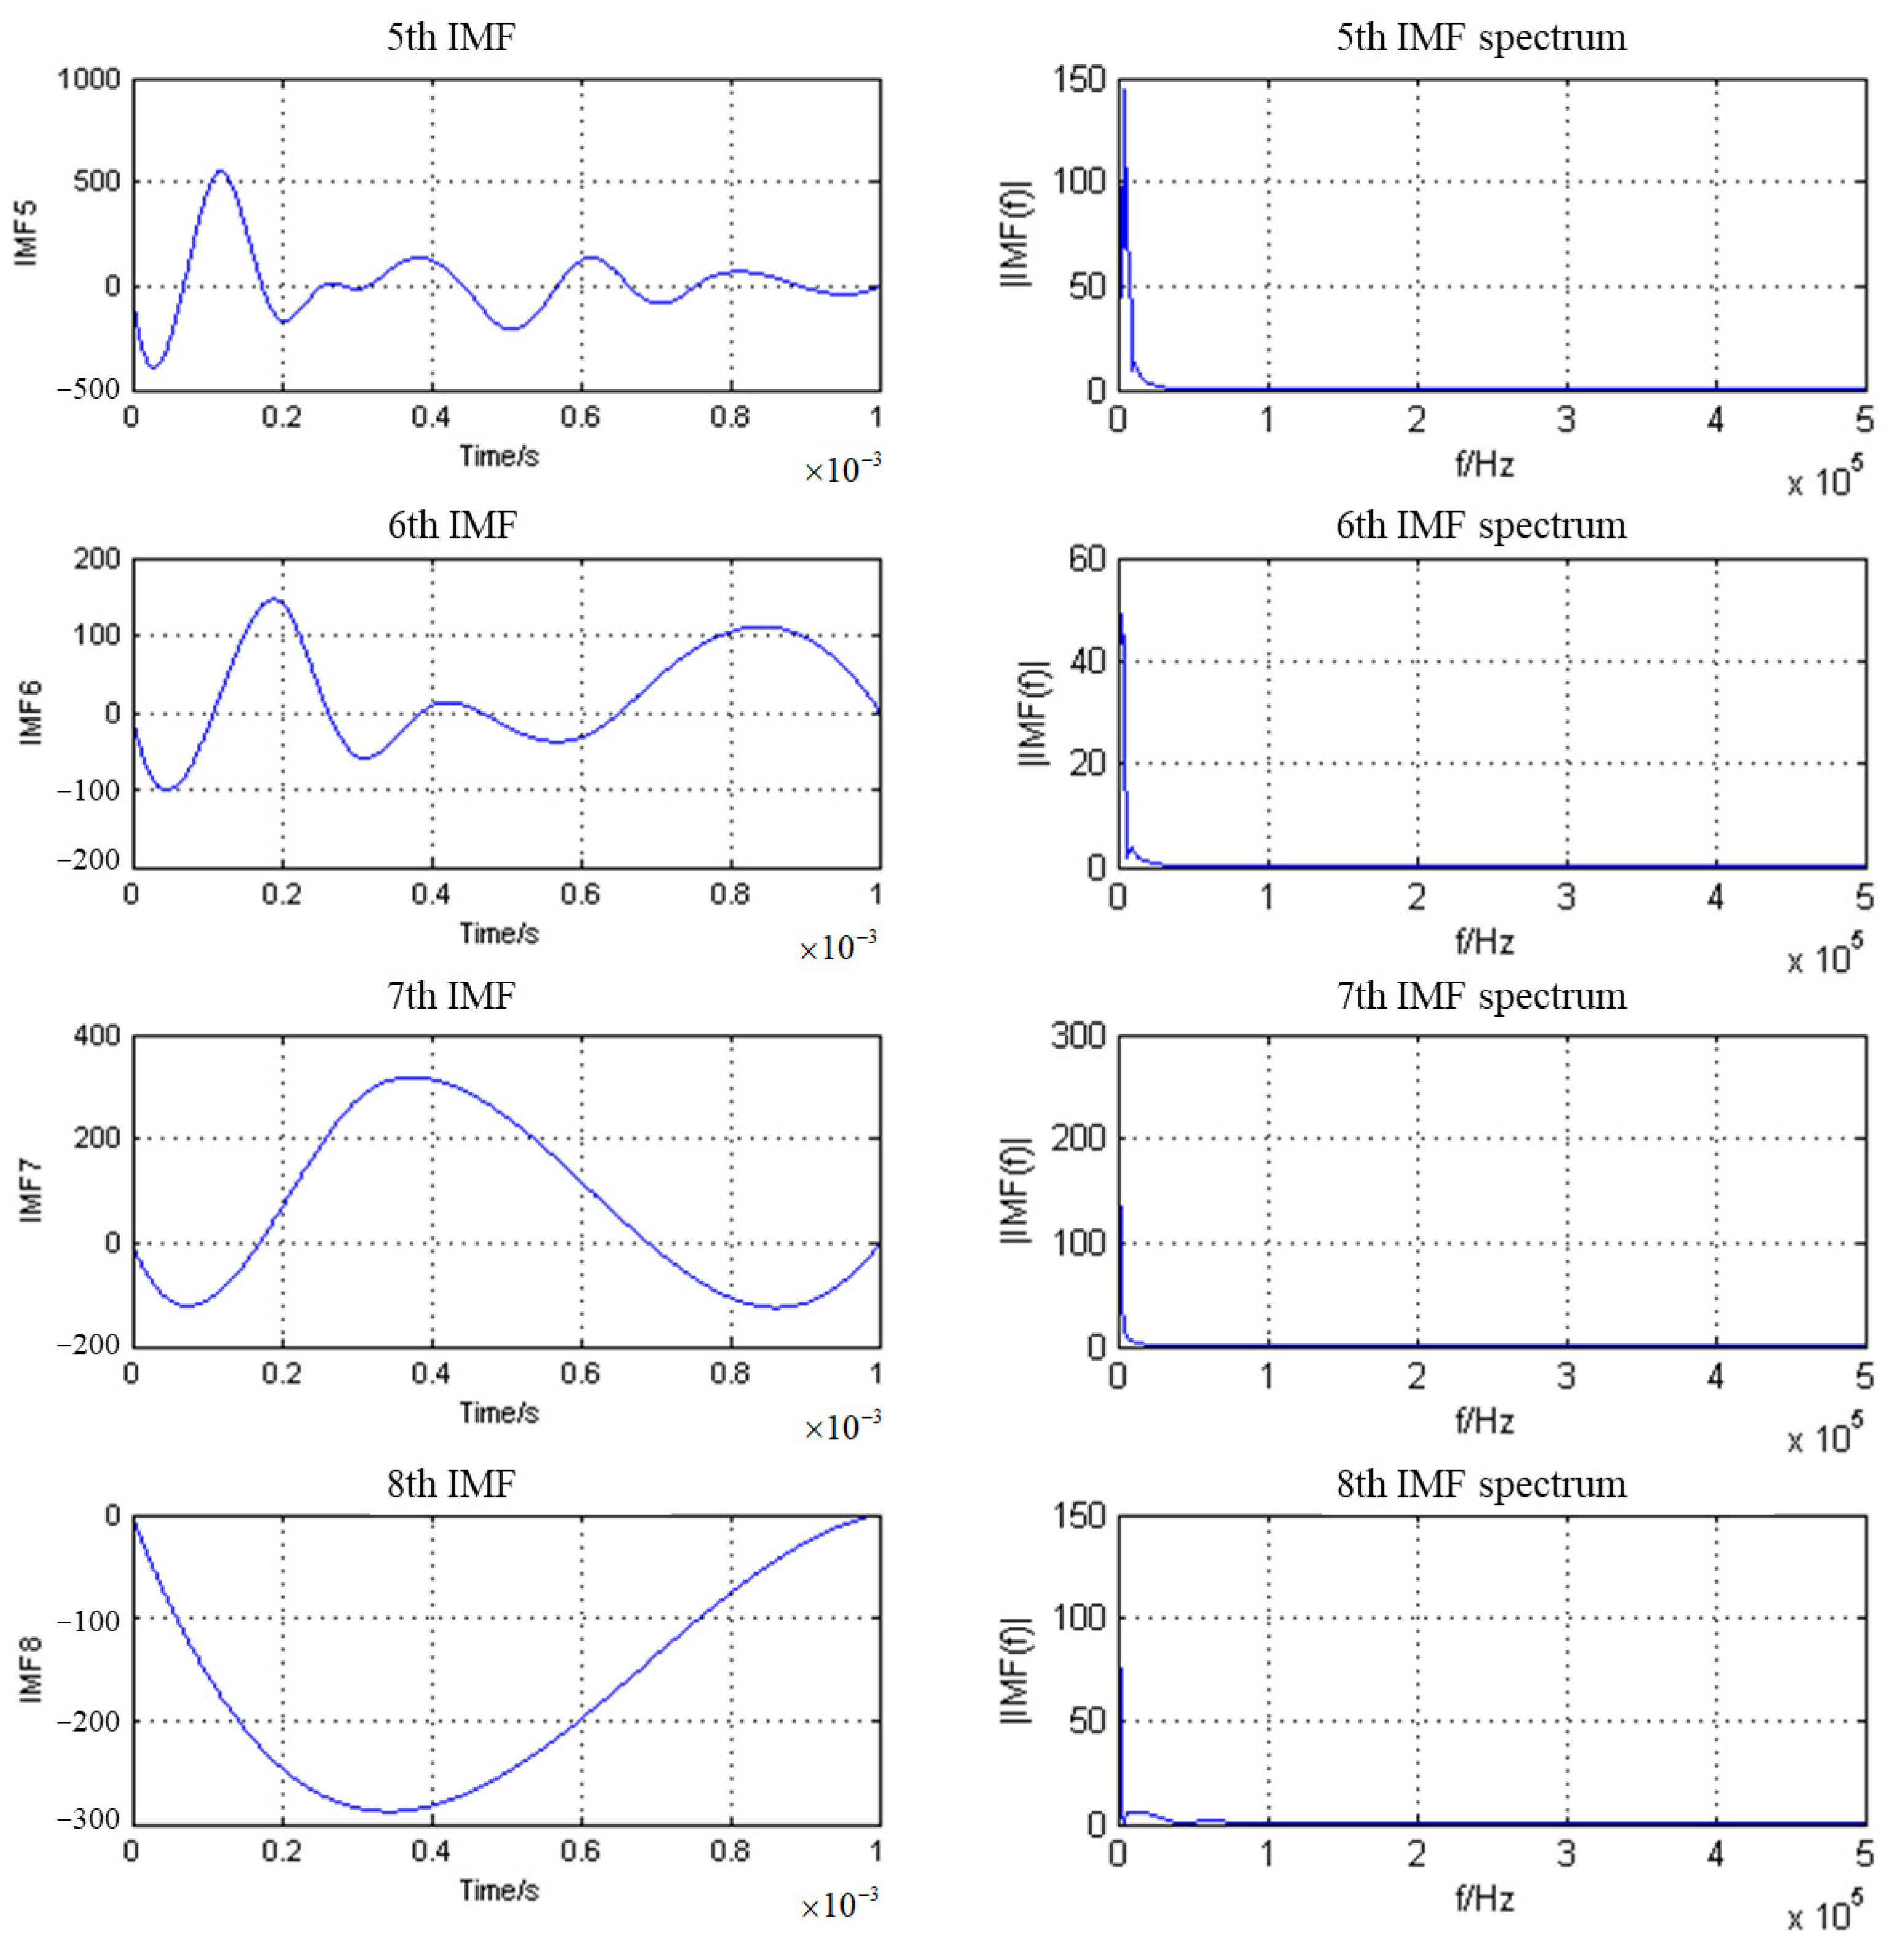
Figure 5 shows the IMF component of the detected signal at a measurement point that contains surface direct waves.
The IMF1 component has the highest energy of all the IMFs after decomposing the detection signals, followed by IMF2. The first two IMF components are selected to synthesize the reconstructed signals after analyzing numerous reconstructed signals. Figure 6 presents a comparison of the reconstructed signal and the original signal after decomposition and synthesis, indicating that the original signal’s surface direct wave has been removed and thus cannot affect interface reflection echo identification.

3.3. Determining the Location of the Interface Reflection Echo Starting Point

The key purpose of surface layer thickness evaluation is to determine the interface reflection echo propagation sound time T, which in turn identifies the signal singularity. When the difference in acoustic impedance between the surface and contact layer materials is large, the signal singularity is the discontinuity points of the first kind. When the difference in acoustic impedance between the surface and contact layer materials is small, the signal singularity is the discontinuity points of the second kind.
(1) The large-difference type in acoustic impedance.
The correlation coefficient R is calculated as expressed in Equation (7) [26].
R = i = 1 n ( x i x ¯ ) ( y i y ¯ ) i = 1 n ( x i x ¯ ) 2 i = 1 n ( y i y ¯ ) 2 = n i = 1 n x i y i i = 1 n x i i = 1 n y i n i = 1 n x 2 i ( i = 1 n x i ) 2 n i = 1 n y 2 i ( i = 1 n y i ) 2
where
x: reference signal;
y: detection signal with the same time window as the reference signal.
When the transmitting wave propagates in the medium, the surface direct wave reaches the receiving transducer first. The surface direct wave has the shortest propagation distance in the medium, little signal attenuation, and has a waveform that is similar to that of the transmitting wave. Therefore, the correlation coefficient method employs the surface direct wave as the reference signal. In addition, the arrival time of the surface direct wave can be determined based on the fixed distance between the transmitting and receiving transducers and the sound velocity of the ultrasonic pulse wave. The arrival time of the surface direct wave is used as the starting point of the reference signal.
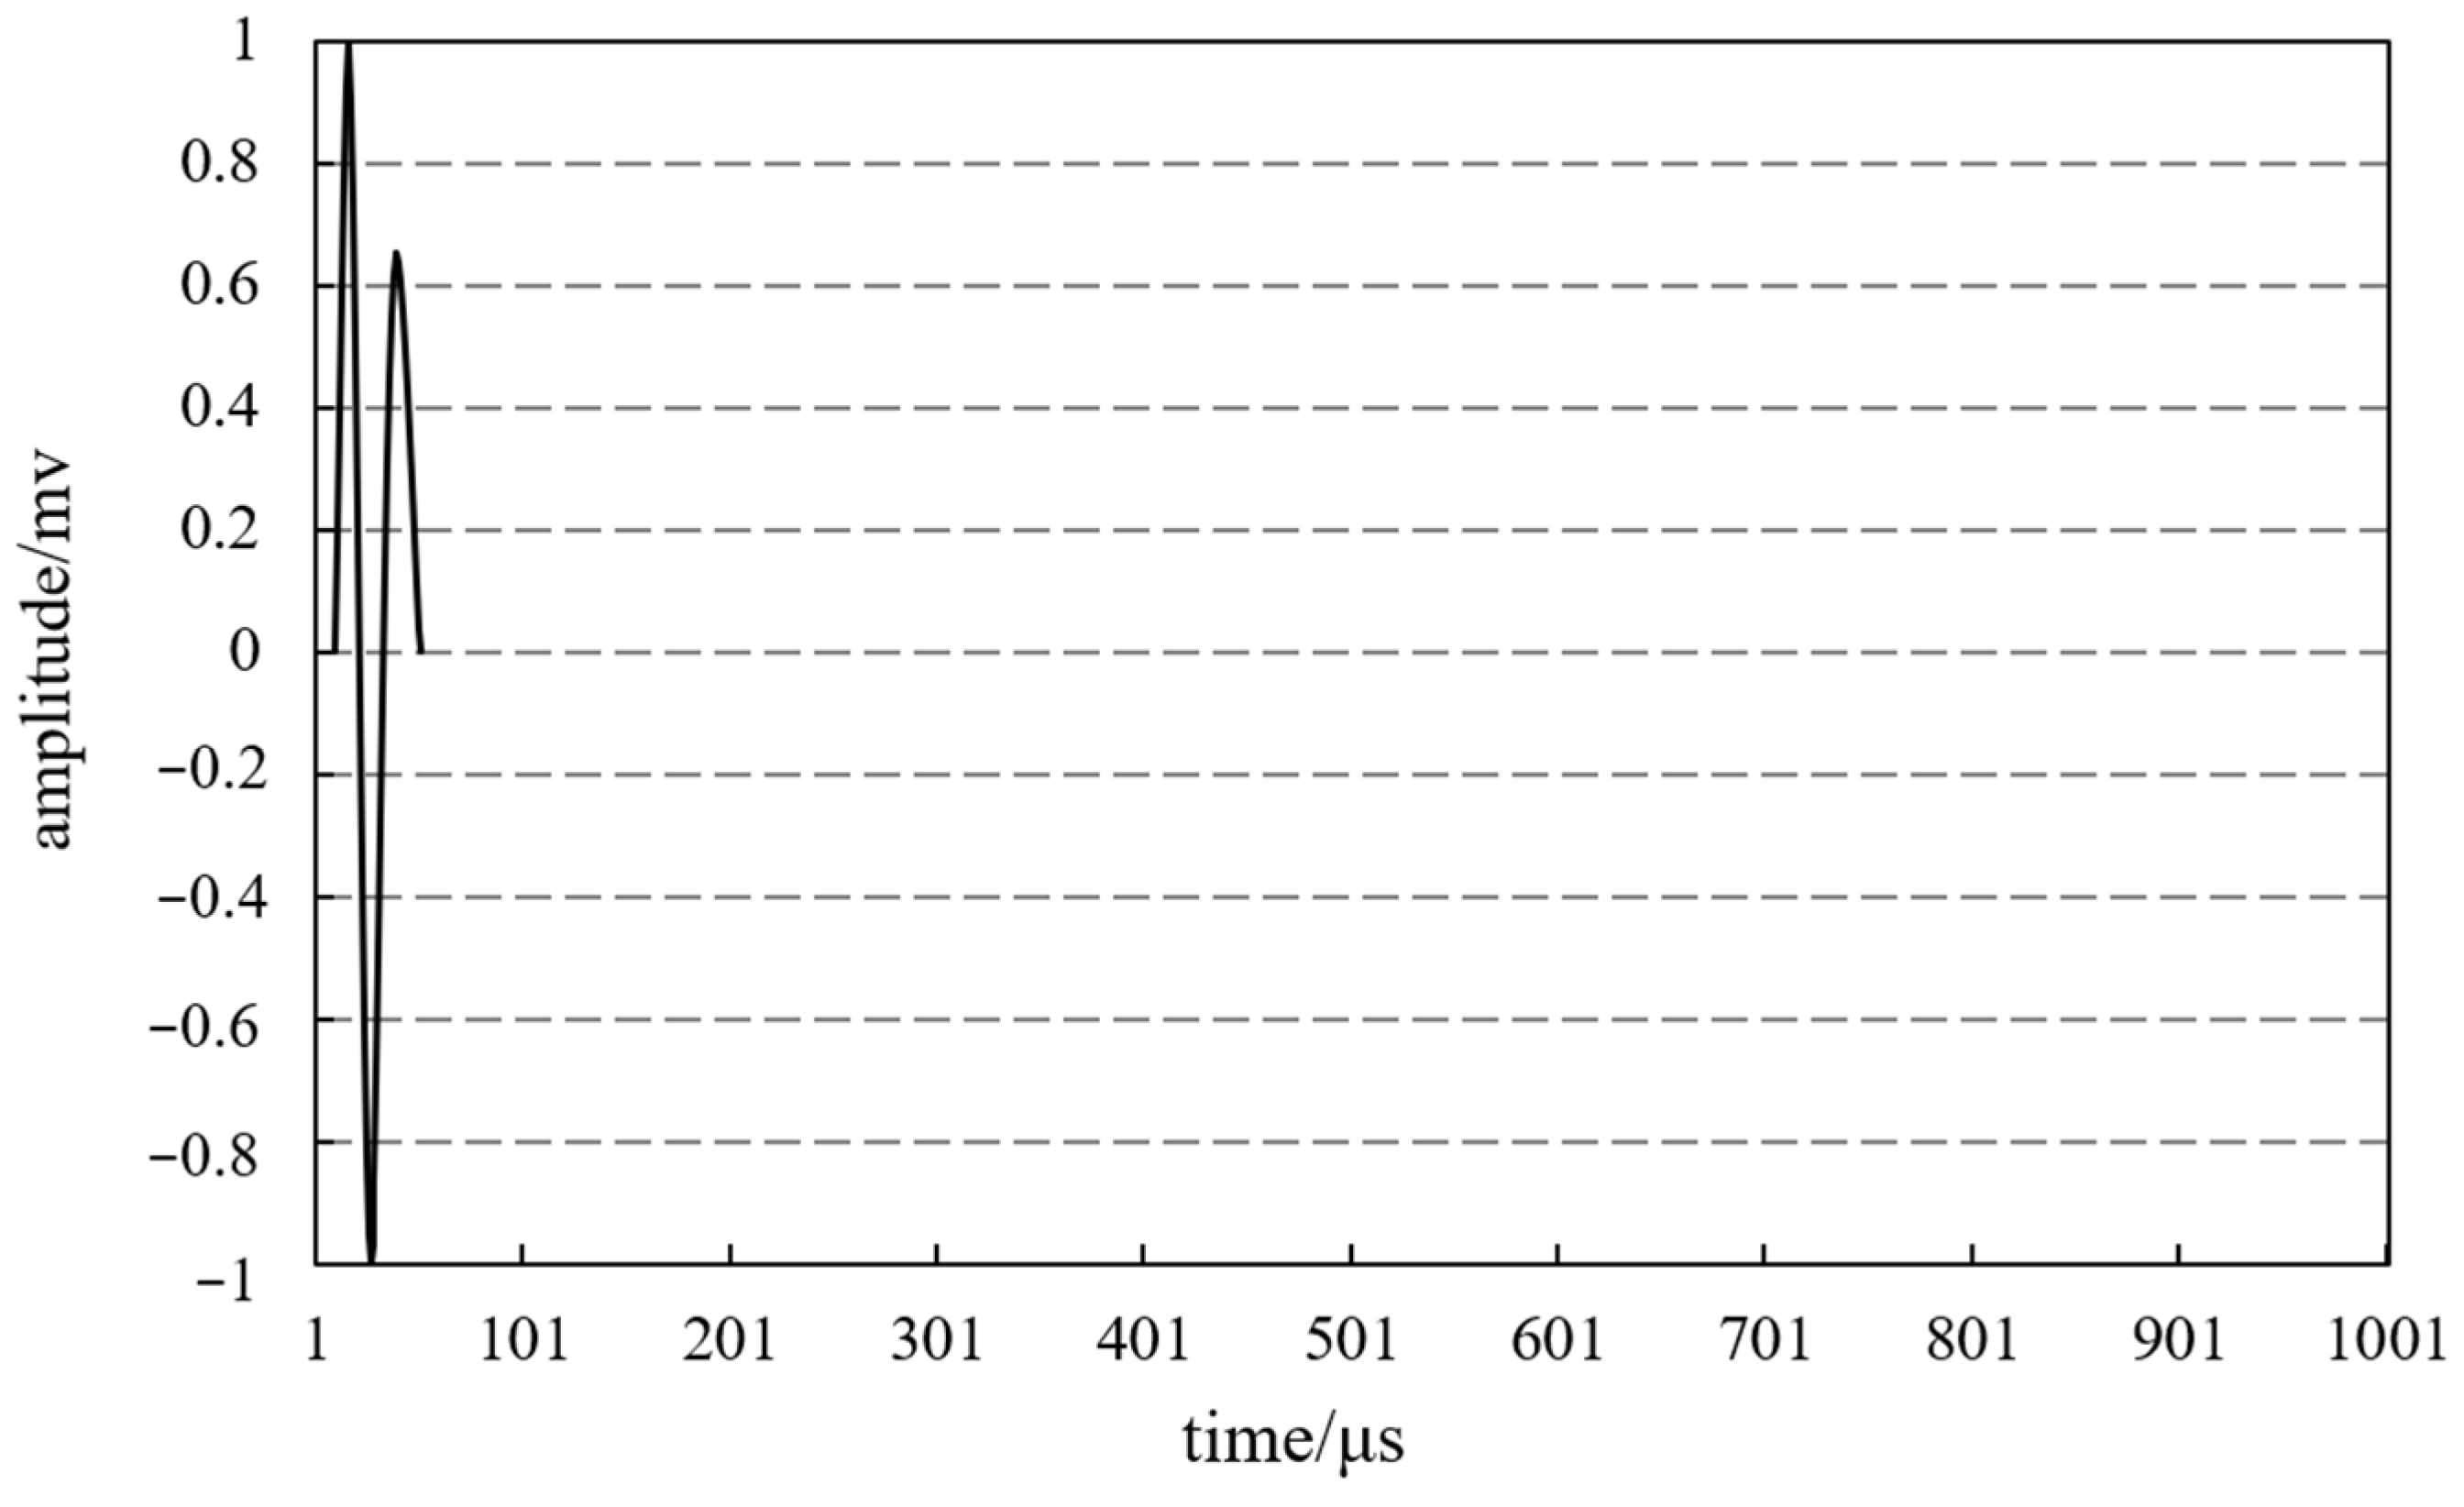
After integrating the starting and ending point acquisitions [27], the reference signal extraction location is centered at the maximum peak of the surface direct wave, the first zero point is selected forward as the starting point of the reference signal, and the third zero point is selected backward as the ending point of the reference signal. Figure 7 shows the reference signal for a certain detection signal.
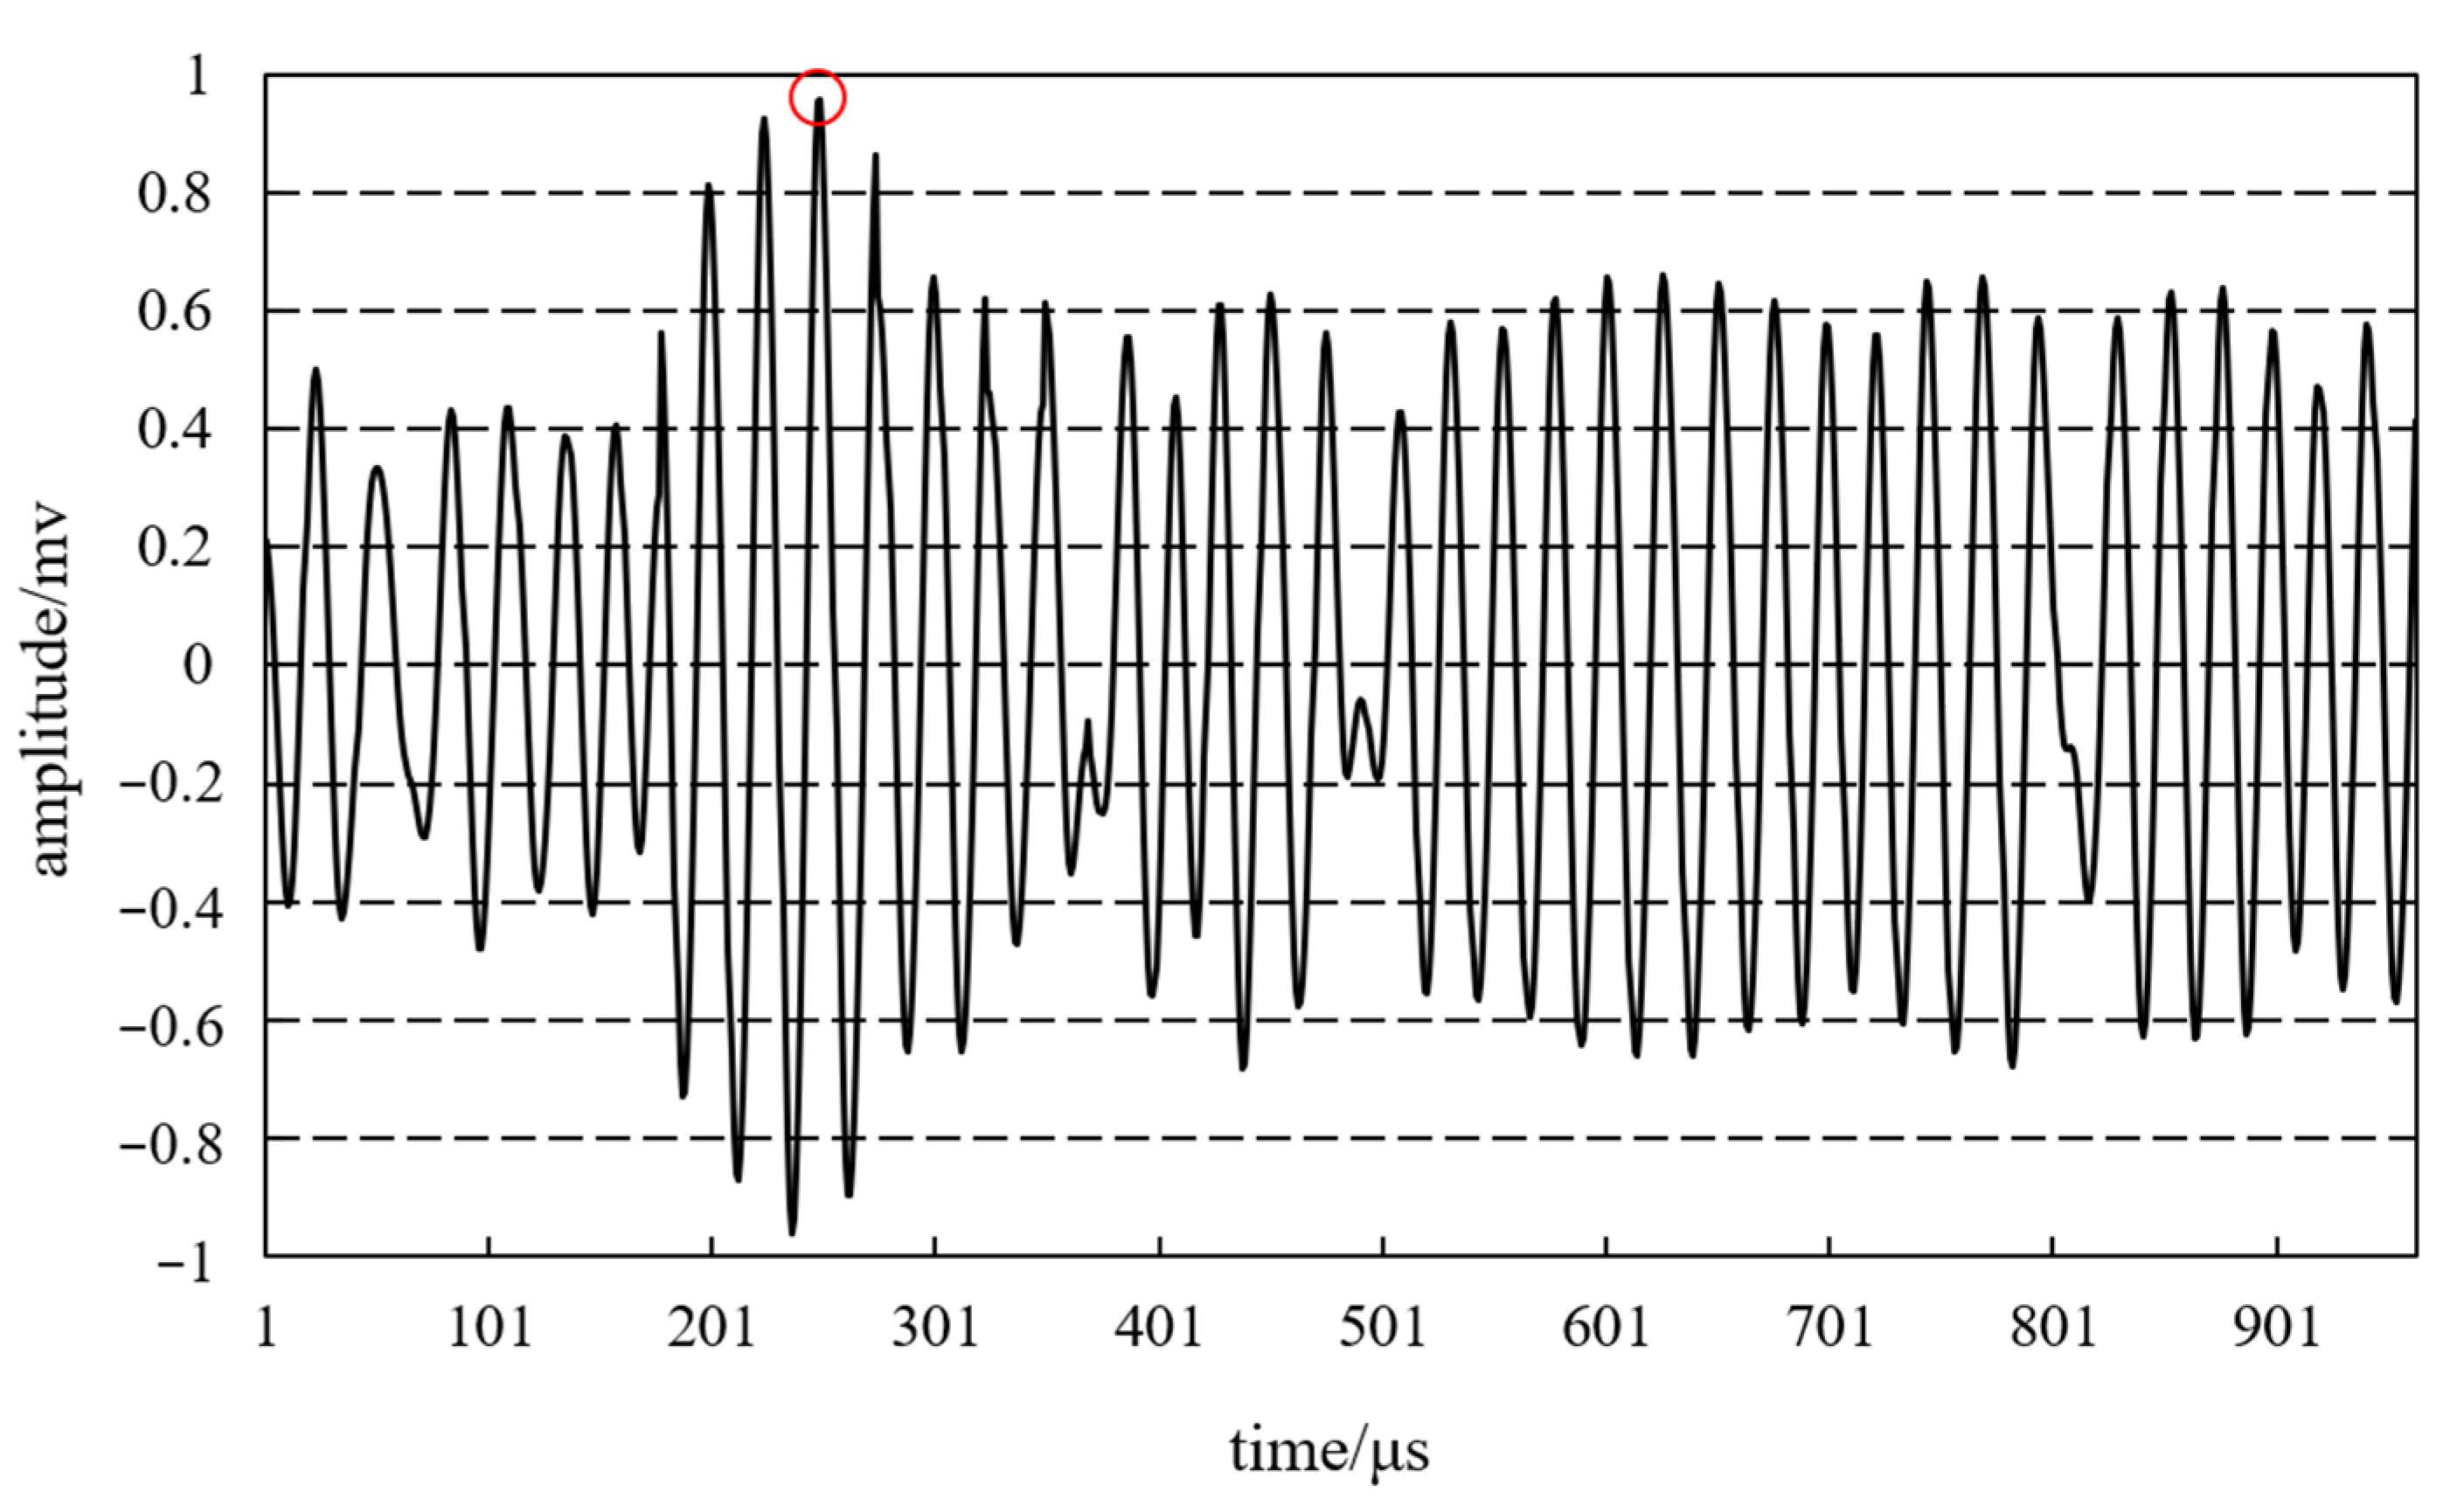
To obtain a graph of the correlation coefficients over time, the reference signal is used as a time interval with the sampling point spacing of 1 μs. The correlation coefficient of the detection signal with the same time window as the reference signal is calculated from the beginning of the time axis. Figure 8 shows the variation. When the correlation coefficient reaches its maximum, the time window t corresponds to the starting point of the interface reflection echo; then, the interface reflection echo propagation sound time T can be calculated. The red dot in the figure represents the correlation coefficient’s peak, and the corresponding moment is the interface reflection echo’s arrival moment. If the surface direct wave is not removed, then the moment that corresponds to the peak becomes the surface direct wave’s arrival moment, resulting in detection error.
The improved correlation coefficient method was used to determine the interface reflection echo propagation sound time T for 40 detected signals under both working conditions, i.e., the types of large and small difference in acoustic impedance, and then the surface layer thickness was calculated. The average absolute error between type of large difference in acoustic impedance and the actual surface layer thickness of 200 mm is 7 mm, indicating that the detected thickness is basically the same as the actual surface layer thickness. However, the average absolute error between the small-difference type and the actual surface layer thickness of 200 mm is 20 mm, with a larger detection error, indicating that the correlation coefficient method is not applicable to the small-difference type of concrete pavement.
Analysis thus shows that the improved correlation coefficient method is applicable for large differences in acoustic impedance between the surface and the contact layer material, such as when a concrete pavement has a flexible base or when an isolation layer is placed between the base and surface layers. The interface reflectivity is greater as a result, as are the received interface reflection echo amplitude, the correlation coefficient value, and the recognition accuracy.
(2) The small-difference type in acoustic impedance.
When the difference in the material’s acoustic impedance between the surface and the contact layer is small, for example in cases when no isolation layer is present between the surface layer and semi-rigid base or when the acoustic impedance is similar between the semi-rigid base and surface material, then the interface reflectivity is low, resulting in low interface reflection echo wave amplitude without mutation and signal singularity for the discontinuity point of the second kind. Thus, the improved correlation coefficient method is not applicable for the small-difference type of concrete pavement.
Figure 9 shows the modal maxima distribution of the detected signal using four different types of wavelet basis function processing, with the wavelet analysis size set to 32. Figure 9 shows that different wavelet basis functions can be employed to analyze the same signal and that the mode maxima distribution varies greatly. When the Haar and Sym3 wavelet functions are used to process the signal, more mode maxima lines are evident and the distinction is low, making it difficult to determine the location of the corresponding singularities at the interface. In contrast, when Mexh and Gaus3 wavelets are used, there are relatively few mode maxima lines, and the Mexh wavelet function has a better effect and more differentiation than Gaus3. The Mexh wavelet basis function is a derivative of a continuous derivable low-pass smoothing function with second-order vanishing moments and symmetry that provides expertise in singularity detection and is suitable for detecting impulse-like mutations of ultrasonic pulse waves. Based on this analysis, the Mexh wavelet basis function was chosen as the wavelet transform method in this study, with a scale range from 10 to 32.
The steps for the acoustic time acquisition of the small-difference type interface reflection echoes are as follows: (1) calculate the wavelet transform coefficients within the scale range from 10 to 32 and obtain the distribution of the wavelet transform coefficients in the time-scale plane; (2) calculate the modal maximum of the wavelet transform coefficients at each scale, pool the two nearest modal maxima at adjacent scales as modal maxima lines, obtain the set of modal maxima lines in the time-scale plane, and obtain the set of modal maxima lines across the entire scale range; (3) calculate the mean value of the wavelet transform modal maximum at each moment and determine the acoustic time T of interface reflection echo propagation according to the moment t0 when the mean value of the modal maximum appears.
Figure 10 presents the time-frequency distribution of the wavelet transformation coefficients for a detection signal. Areas of brighter color correspond to larger wavelet transformation coefficients. The maximum wavelet transformation modulus, or wavelet coefficient maximum, is visible in these bright regions. In the low-scale range of 1–10, the colors are particularly vibrant, indicating a predominance of noise. However, the modulus maxima triggered by the signal’s singularity must extend to a larger scale. Consequently, signals within a scale range from 1–10 are eliminated, and signals within a scale range from 10–32 are analyzed instead. As can be inferred from the figure, the wavelet transformation modulus’ maximum value is most likely to occur within the 100–200 range.
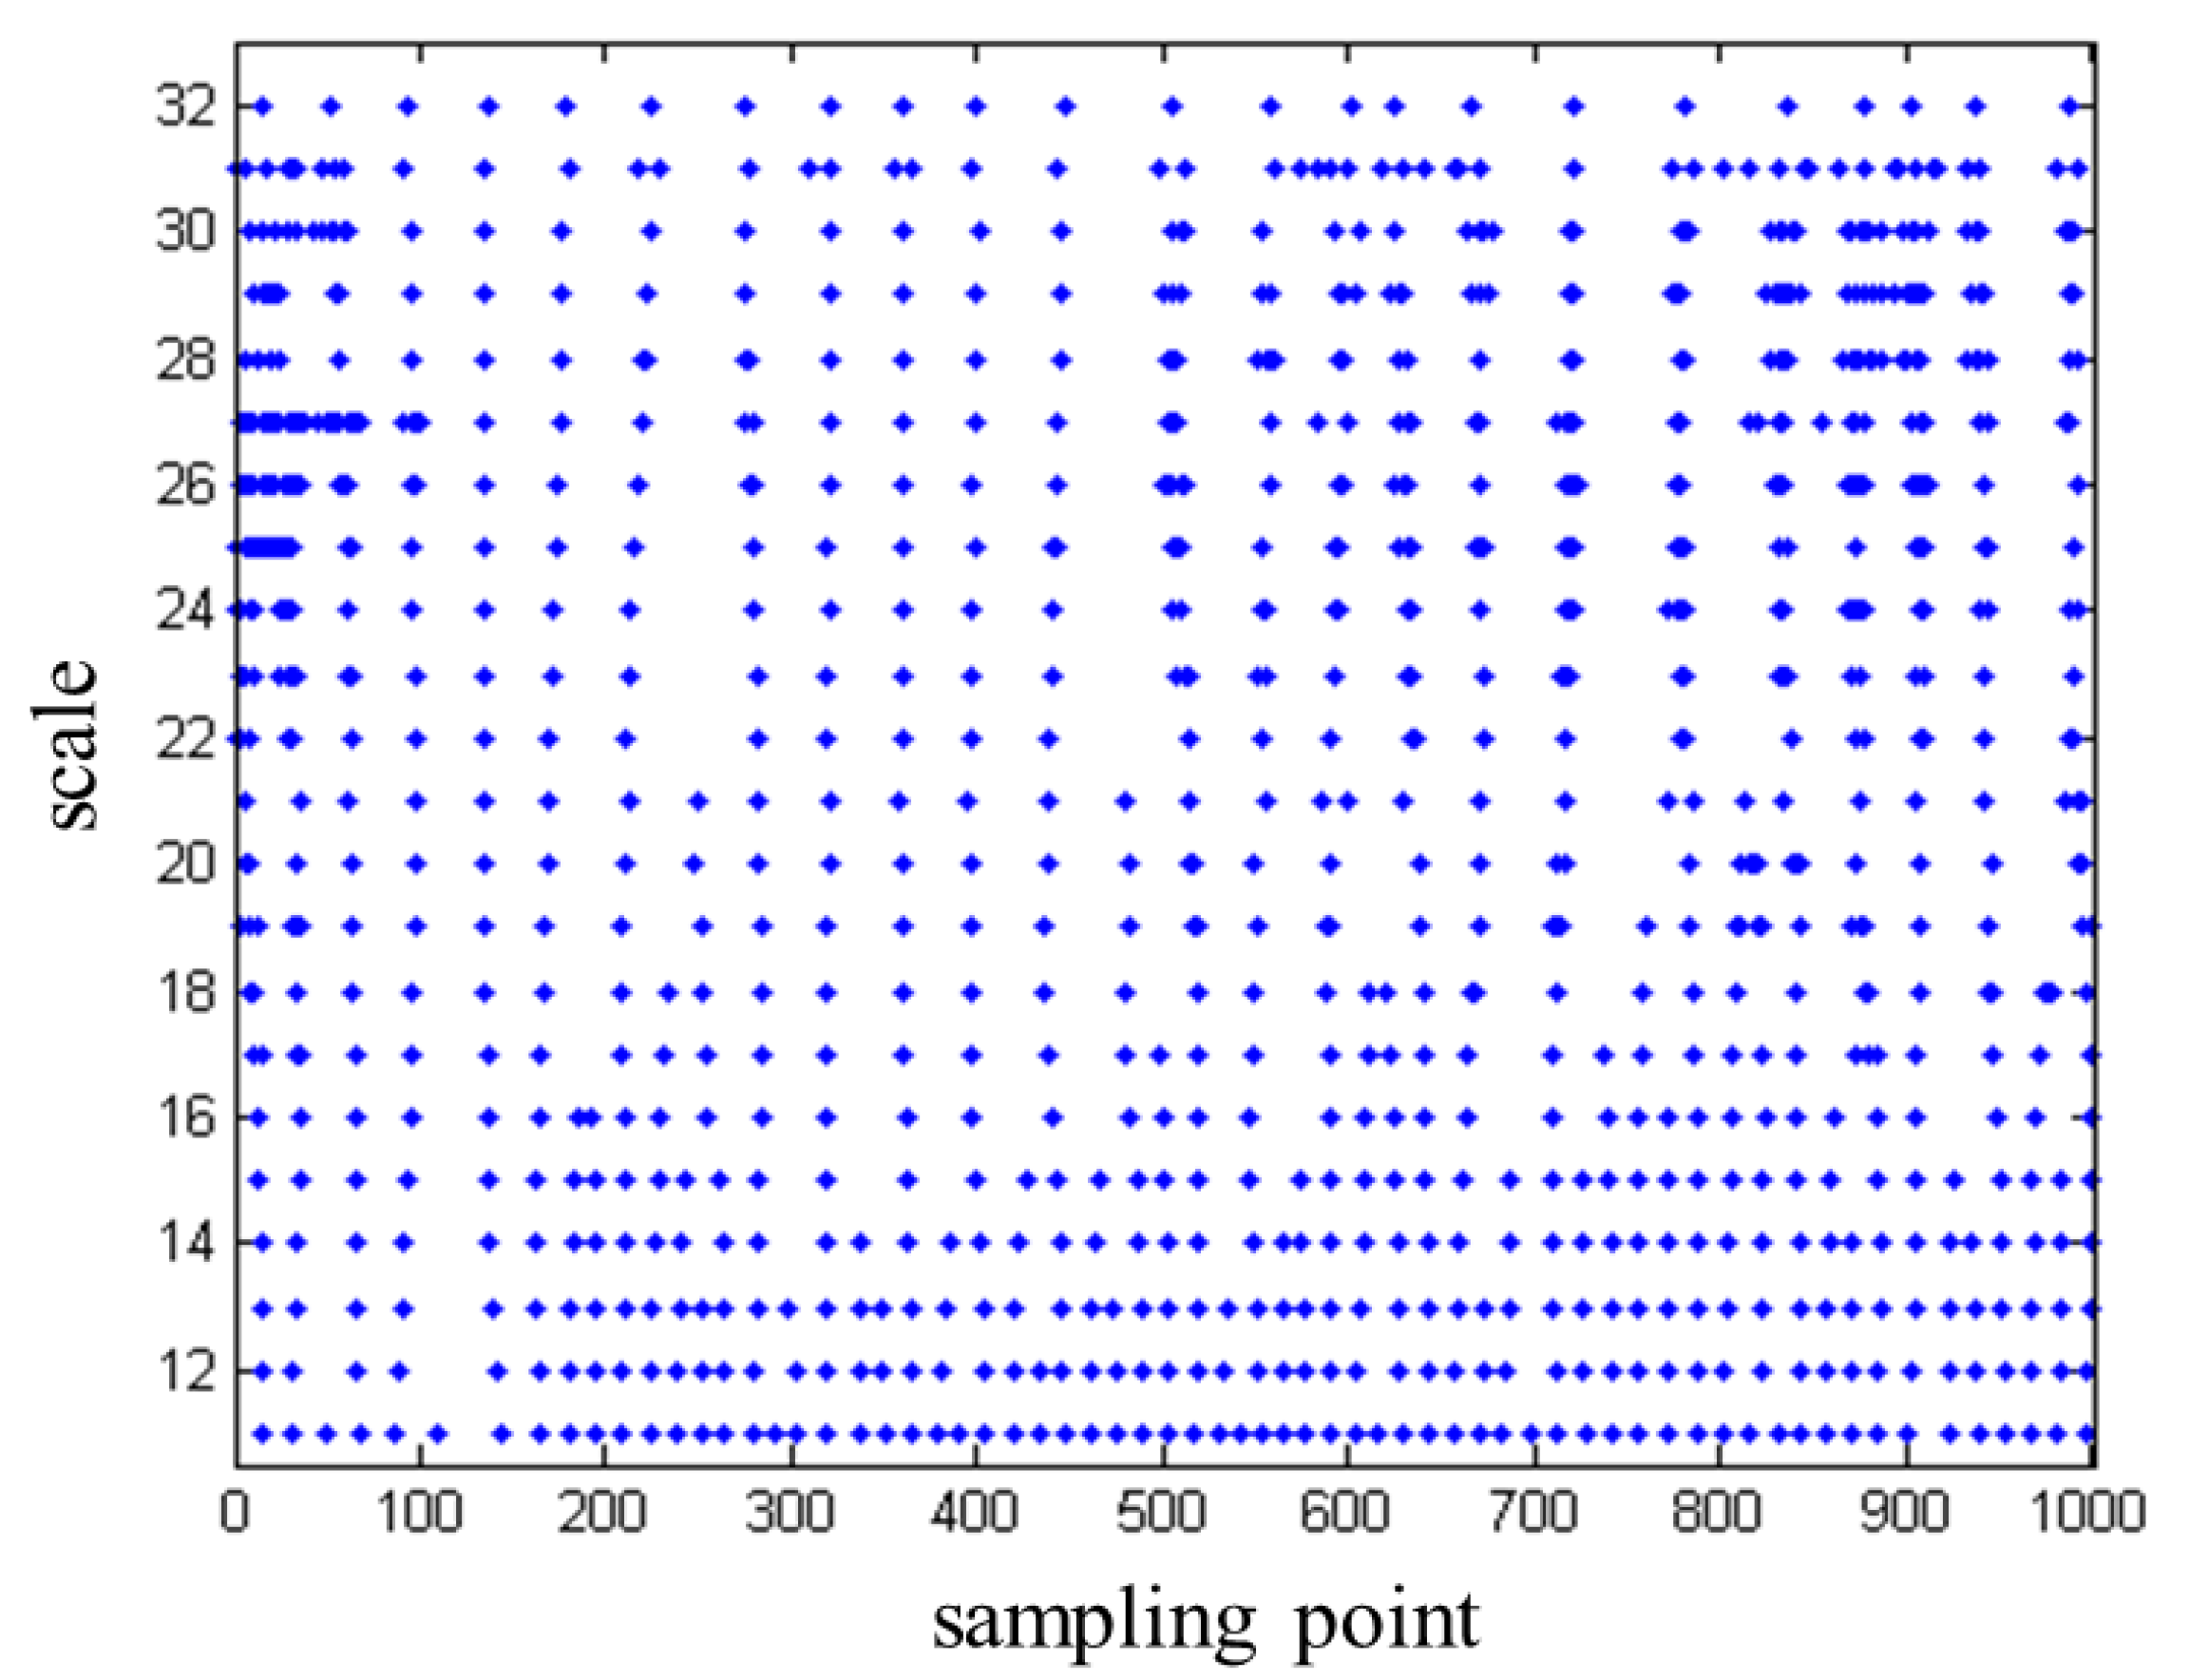
Figure 11 shows the time-frequency distribution of the wavelet coefficient mode maxima, with each blue point representing the wavelet transform mode maxima that appear at each time point and scale and the locations of the mode maxima that correspond to the signal singularity. Figure 11 shows that the wavelet transform mode maxima distribution spans the entire scale range. To reduce error in determining the temporal location of a single scale signal’s singularity, the wavelet transform mode maxima are averaged in the scale direction. That is, at each moment location, the mean values of the mode maxima at all scales are used to characterize the mutation in signal singularity.
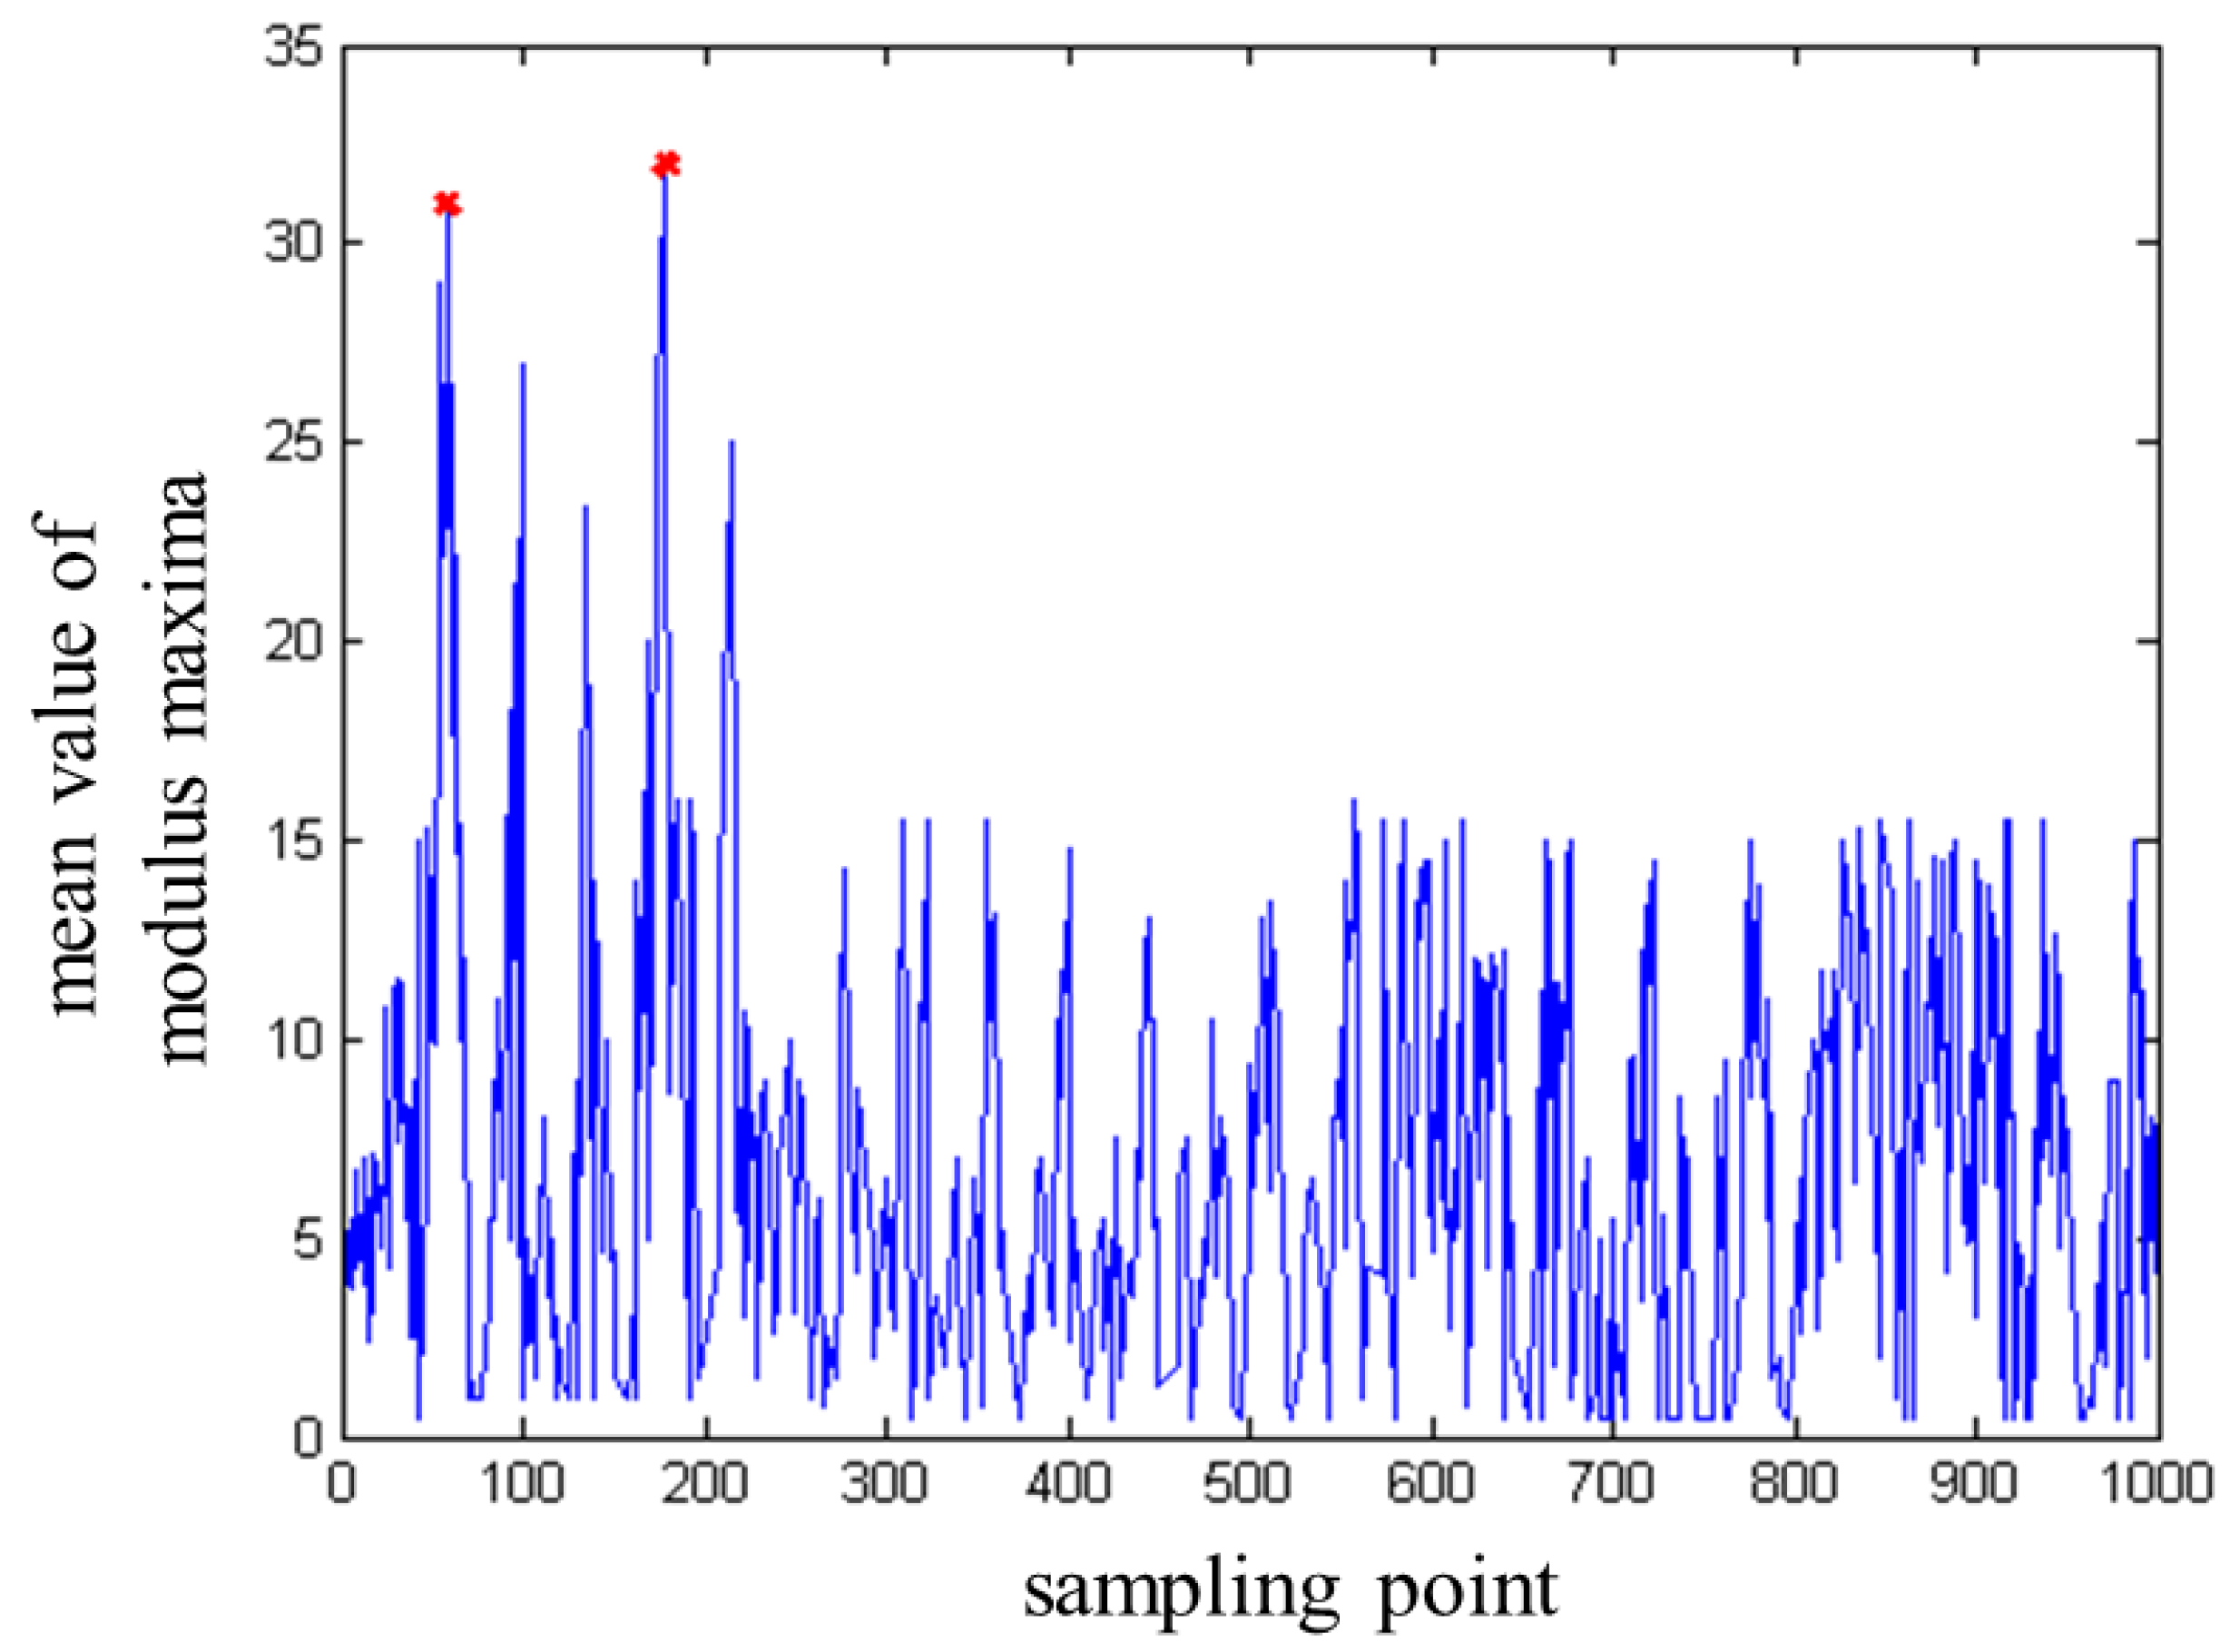
Figure 12 shows the distribution of the mean value of the wavelet transform modal maxima over time, and the value represents the degree of signal singularity at that point. When the receiving transducer receives the interface reflection echo, the signal appears as a single mutation, as indicated by the maximum value of the mode maxima mean, which is represented by the second red dot. The propagation time T of the interface reflection echo can be calculated by locating the maximum value of the mode maxima mean. It was discovered that the surface direct wave is the point where the signal appears closer to the maximum value of the mean at an earlier moment. Due to the high energy of the surface direct wave, the receiving transducer produces signal singularity mutation after receiving the surface direct wave, and the wavelet transform is bound to produce the mode maximum point, so the maxima mean value becomes greater. Thus, the empirical mode decomposition method can be used to remove the surface direct wave.
The wavelet transform modulus maximum method was used to determine the interface reflection echo propagation sound time T for 40 detected signals under both working conditions, i.e., the types of large and small difference in acoustic impedance, and then calculated the surface layer thickness. The average absolute error between the large-difference type and the actual surface layer thickness of 200 mm is 8 mm, indicating that the detection accuracy does not differ much from that obtained using the improved correlation coefficient method. However, the average absolute error between small-difference type and the actual surface layer thickness of 200 mm is 9 mm, which is a significant improvement compared to the improved correlation coefficient method. The wavelet transform modulus maximum method is thus found to be applicable to small-difference type of concrete pavement. That is, this method can be employed to determine the signal singularity for the second type of intermittent point interface reflection echo propagation sound time T. The surface layer thickness then can be calculated using the reflection echo propagation sound time T, as expressed in Equation (1).

4. Field Test

4.1. Nanjing Lukou International Airport

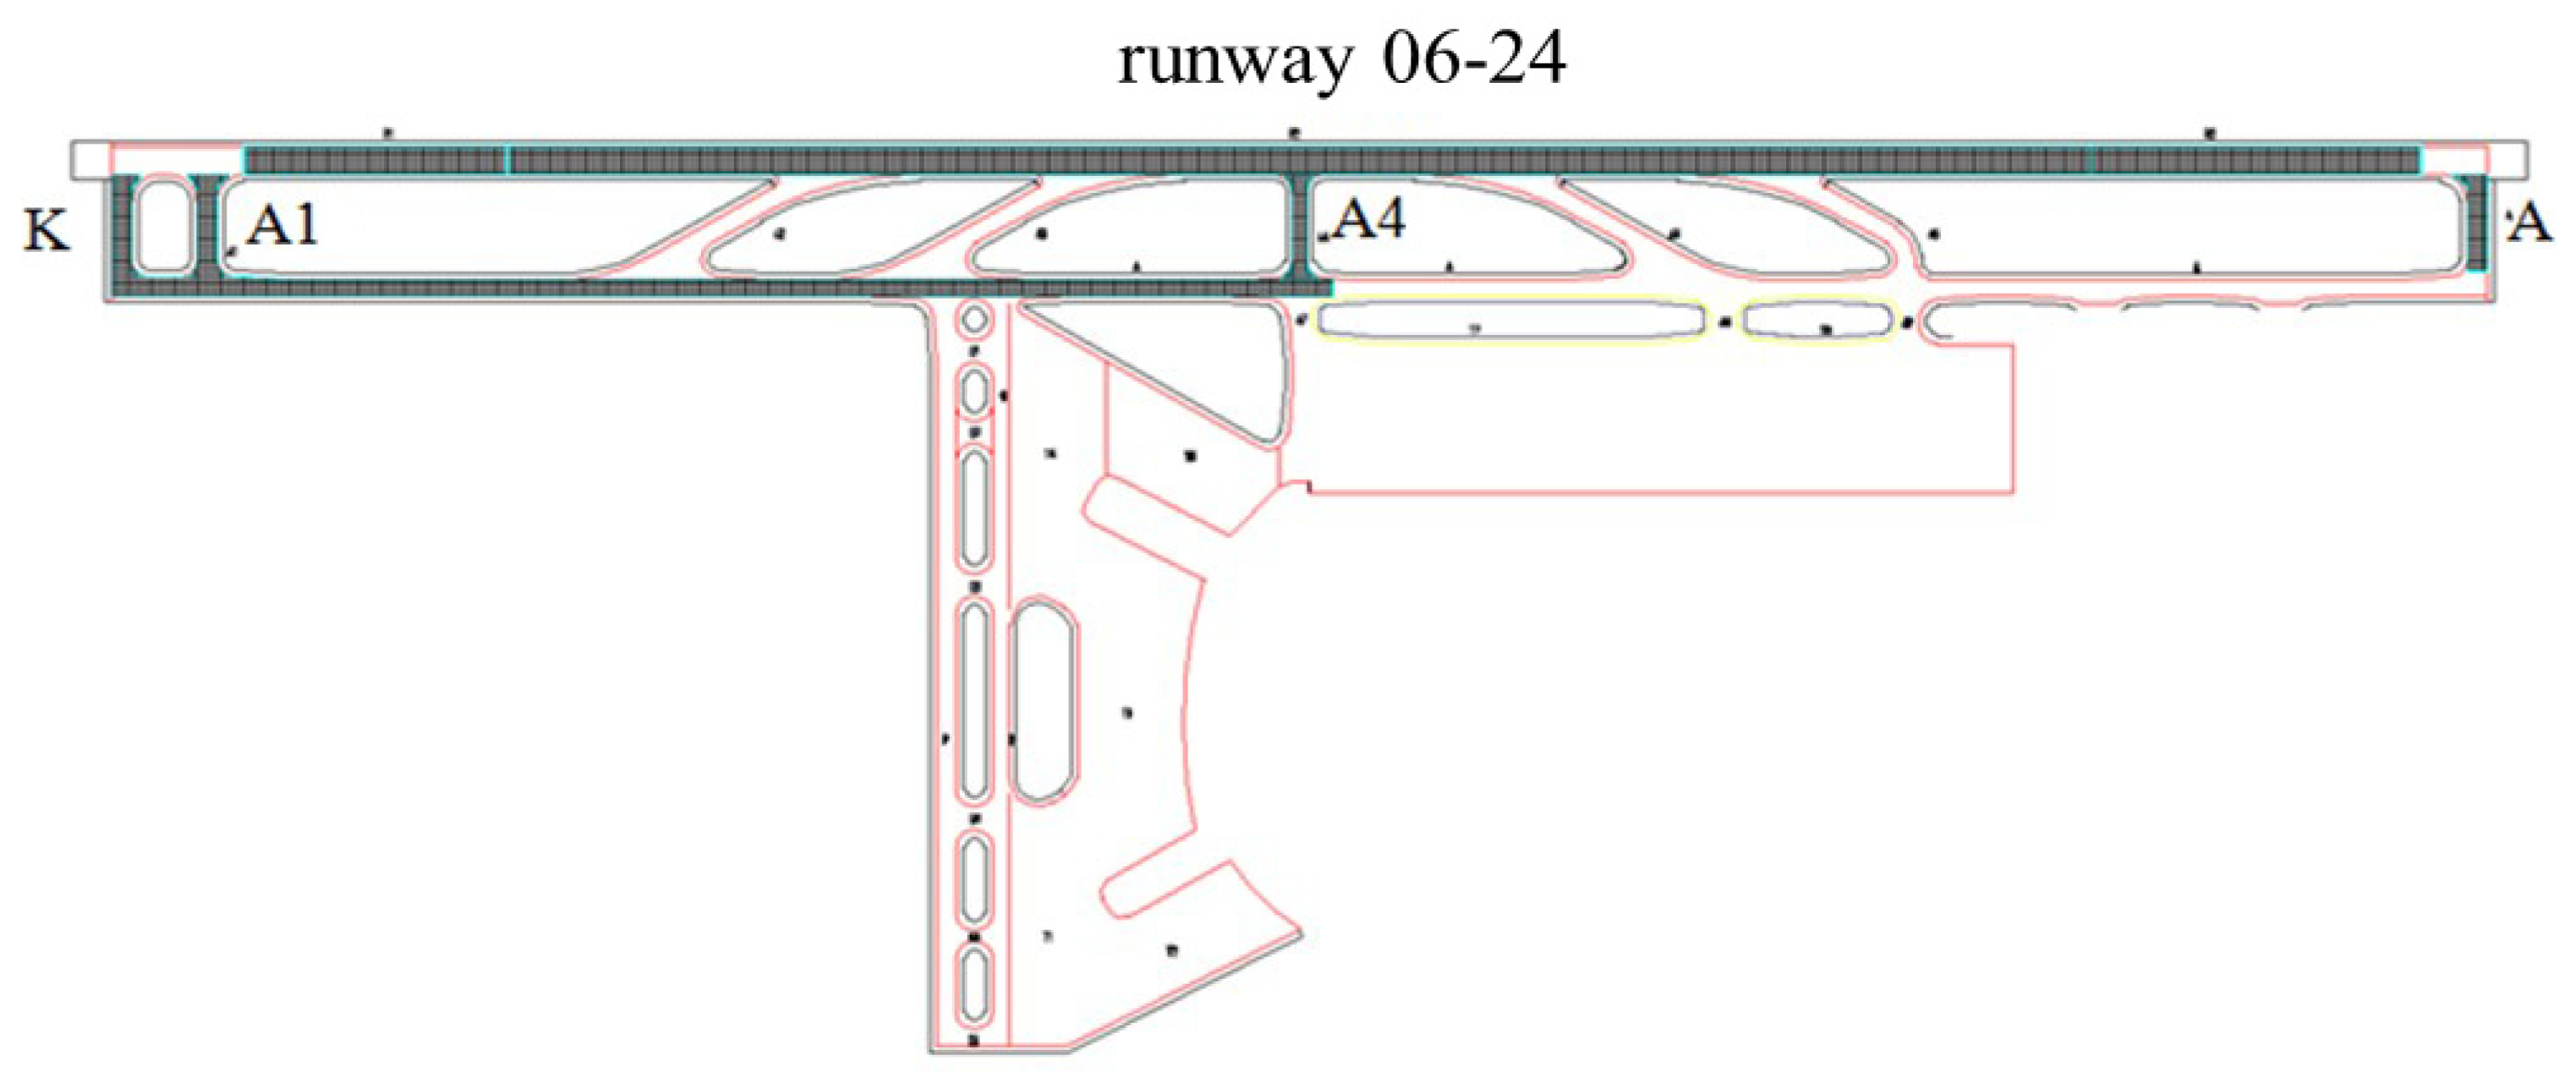
Runway 06–24 of Nanjing Lukou International Airport, a 4F-class runway, has been in service for 20 years. The thickness detection was performed to evaluate the runway’s performance condition. Figure 13 shows a detailed schematic diagram of the airport runway’s surface area.
Drilled core thickness detection of the runway area was carried out at a frequency of one point per 5000 m2. The total number of samples is 28, numbered 1 to 28 in the order the cores were drilled. Figure 14 shows sections of core samples extracted from the runway surface. The runway surface structure is a cement concrete surface layer, 20 mm of crushed stone leveling layer, and a lime/fly ash-stabilized aggregate base. As shown in Figure 14, the base is semi-rigid material, and the leveling layer is set between the surface and the base.
However, due to improper construction operations that resulted in the lack of a leveling layer in some areas, those surfaces are in direct contact with the semi-rigid base. Thus, the acoustic impedance is similar between the surface layer and the contact layer material. The detect signal’s time domain waveform characteristics in this region lack a wave amplitude mutational site, indicating that the signal singularity is a second type of intermittent point, and the improved correlation coefficient method cannot be used to calculate the thickness of the surface. The surface layer thickness is determined using the small-difference type surface layer thickness evaluation method.
The ultrasonic array detection point is at the same location as the drilled core sampling point. Five detection signals were detected at each detection point to exclude interference of error signal. The detection point number is the same as the drilled core number; the wavelet transform modulus maximum method is used to acquire the surface layer thickness after removing the pre-processed signal from the surface direct wave. Figure 15 shows the time-frequency distribution of the wavelet transform coefficients of the detection signals at points 1–6. The distribution of the wavelet coefficients at detection points 7–28 is not specifically listed. In the figure, the wavelet coefficients of each point are represented by colors, with the maximum value of the wavelet transform modulus appearing in the area with the highest brightness. The detection signals of points 1–6 are wavelet-transformed using the Mexh wavelet basis function.
According to the wavelet coefficient distribution of each detection point, the wavelet modulus maxima distributions could be obtained after signal analysis. Figure 16 shows the wavelet modulus maxima distributions of detection points 1 through 6. The wavelet modulus maxima distributions of detection points 7 through 28 are not specifically listed.
The wavelet modal maxima distribution is complicated, and the location of the signal change point cannot be determined intuitively. Therefore, the mean values of the maxima along the time axis are used to calculate the interface reflection echo propagation time T. Figure 17 shows the mean values of the maxima at detection points 1 through 6, but does not specifically list the mean values of the modal maxima at detection points 7 through 28.
The maximum value of the modal maxima mean is determined by the interface reflection echo starting point, and the surface layer thickness is calculated using interface reflection echo propagation sound time T. The ultrasonic pulse wave sound velocity used for this test is 2500 m/s. Table 1 provides a summary of the surface layer thickness data.
The absolute difference between the ultrasonic array thickness and core drilling thickness is 14 mm at its maximum, 7 mm on average, and 0 mm at its minimum. Exhibiting high detection accuracy, the average error is only 1.9%. Figure 18 shows the absolute difference between the thickness of the core sample and the ultrasonic array varies; the absolute difference between some detection points is more than 10 mm. It is found that the acoustic impedance of the surface and contact layer was similar, and the difference in acoustic impedance between the surface and leveling layer was smaller than the difference between the leveling layer and base. Thus, the signal singularity was determined as the leveling layer and base, resulting in thickness measurement error.

4.2. Shanghai Pudong Outer Ring Road

The thickness testing site is situated on Haixu Road, an auxiliary road of the Pudong Outer Ring Road, which runs from north to south between Gaodongxin Road and Guangcan Road. It is located 1 km away from the exit of Zhouhai Road on the Outer Ring Road. This study aims to investigate the thickness detection of cement pavement featuring an asphalt-treated permeable base. The detection area comprises two cement slabs, each measuring 5 m × 3.75 m. Core drilling and ultrasonic array thickness detection methods are utilized, with an equal number of detection points for both techniques. Figure 19 illustrates the detection points arranged in a 3 × 3 grid on each cement slab, resulting in a total of 18 detection points. Points 1, 3, 7, and 9, located at the four corners of the slab, are positioned 30 cm away from the border. Points 2, 4, 6, and 8 are situated midway between the corner points, while point 5 is located at the center of the slab. The numbers in the figure represent the core drilling surface layer thickness in centimeters.
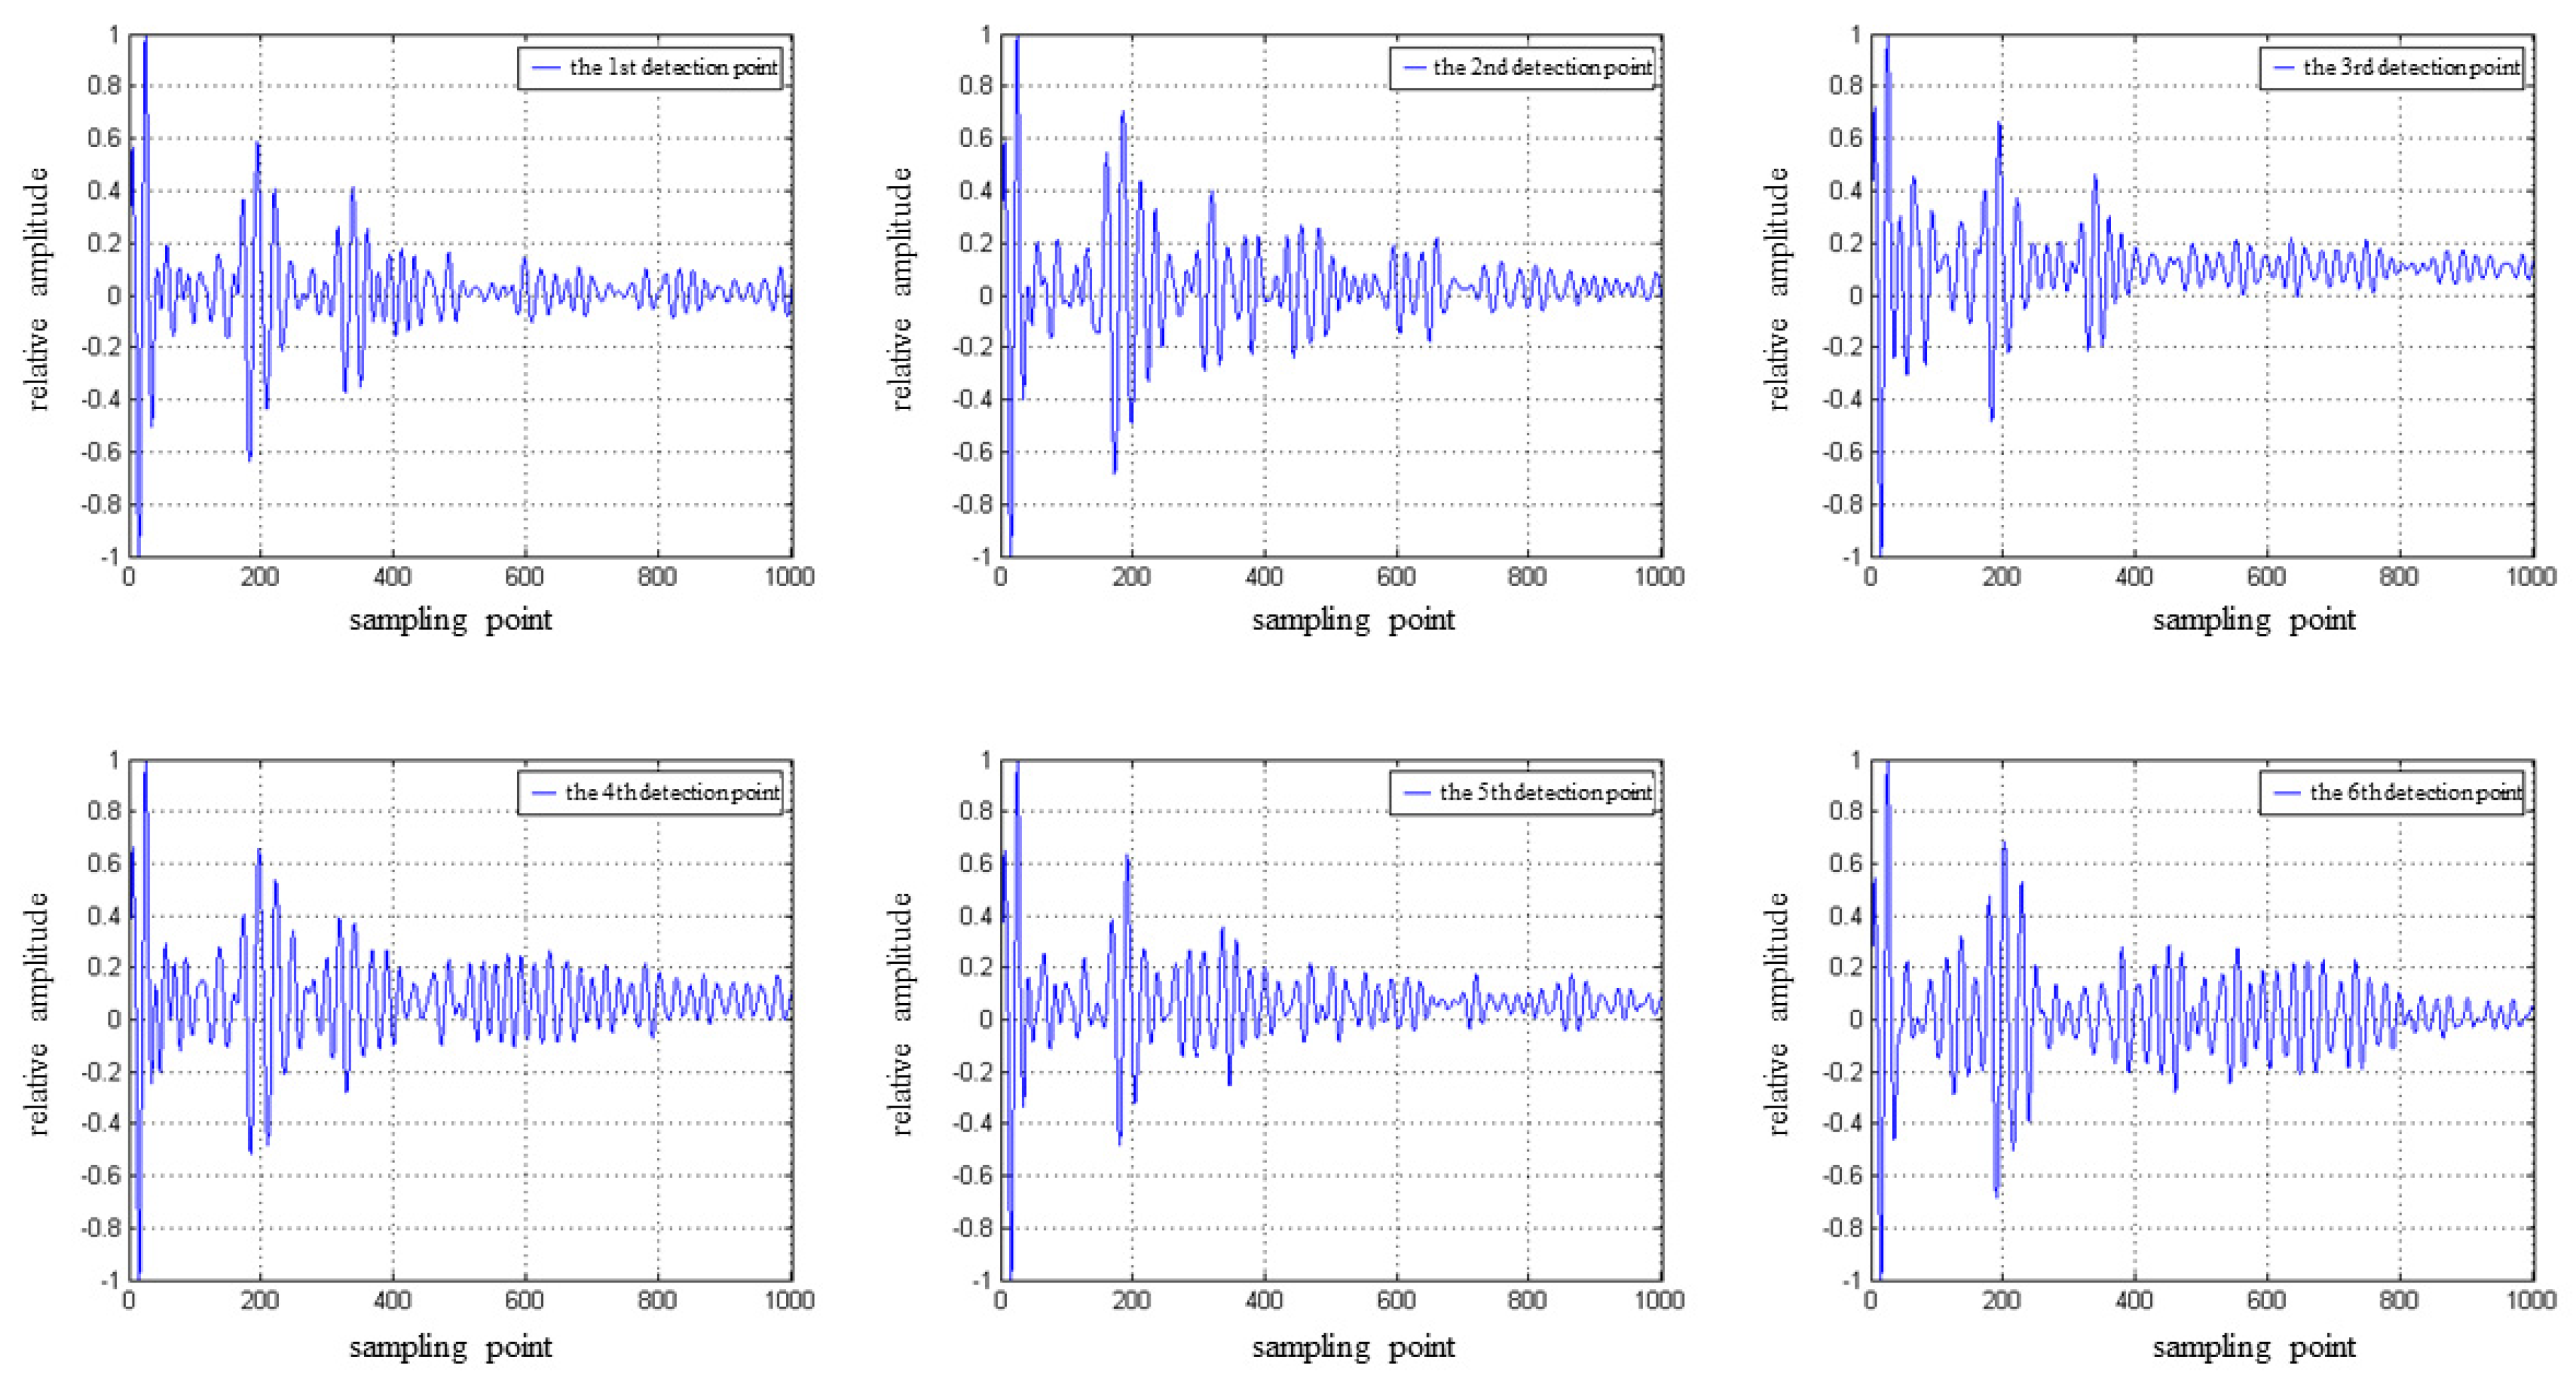
The pavement’s base layer consists of flexible material, which belongs to the category of large differences in acoustic impedance. As a result, the amplitude of the interface reflection echo experiences a sudden change. The thickness is determined using the evaluation method designed for large-difference types. Figure 20 displays the original signals for detection points 1–6, while the signals for detection points 7–18 are not specifically depicted.
In the original signal depicted in Figure 20, the amplitude of the direct surface wave is relatively large. The empirical mode decomposition method is employed to remove the direct surface wave. Figure 21 presents the detection signal after the removal of the surface direct wave.
After removing the surface direct wave, the corresponding reference signal is obtained according to the reference signal acquisition method proposed in this study. Figure 22 illustrates the change in correlation coefficient value over time when using the improved correlation coefficient method.
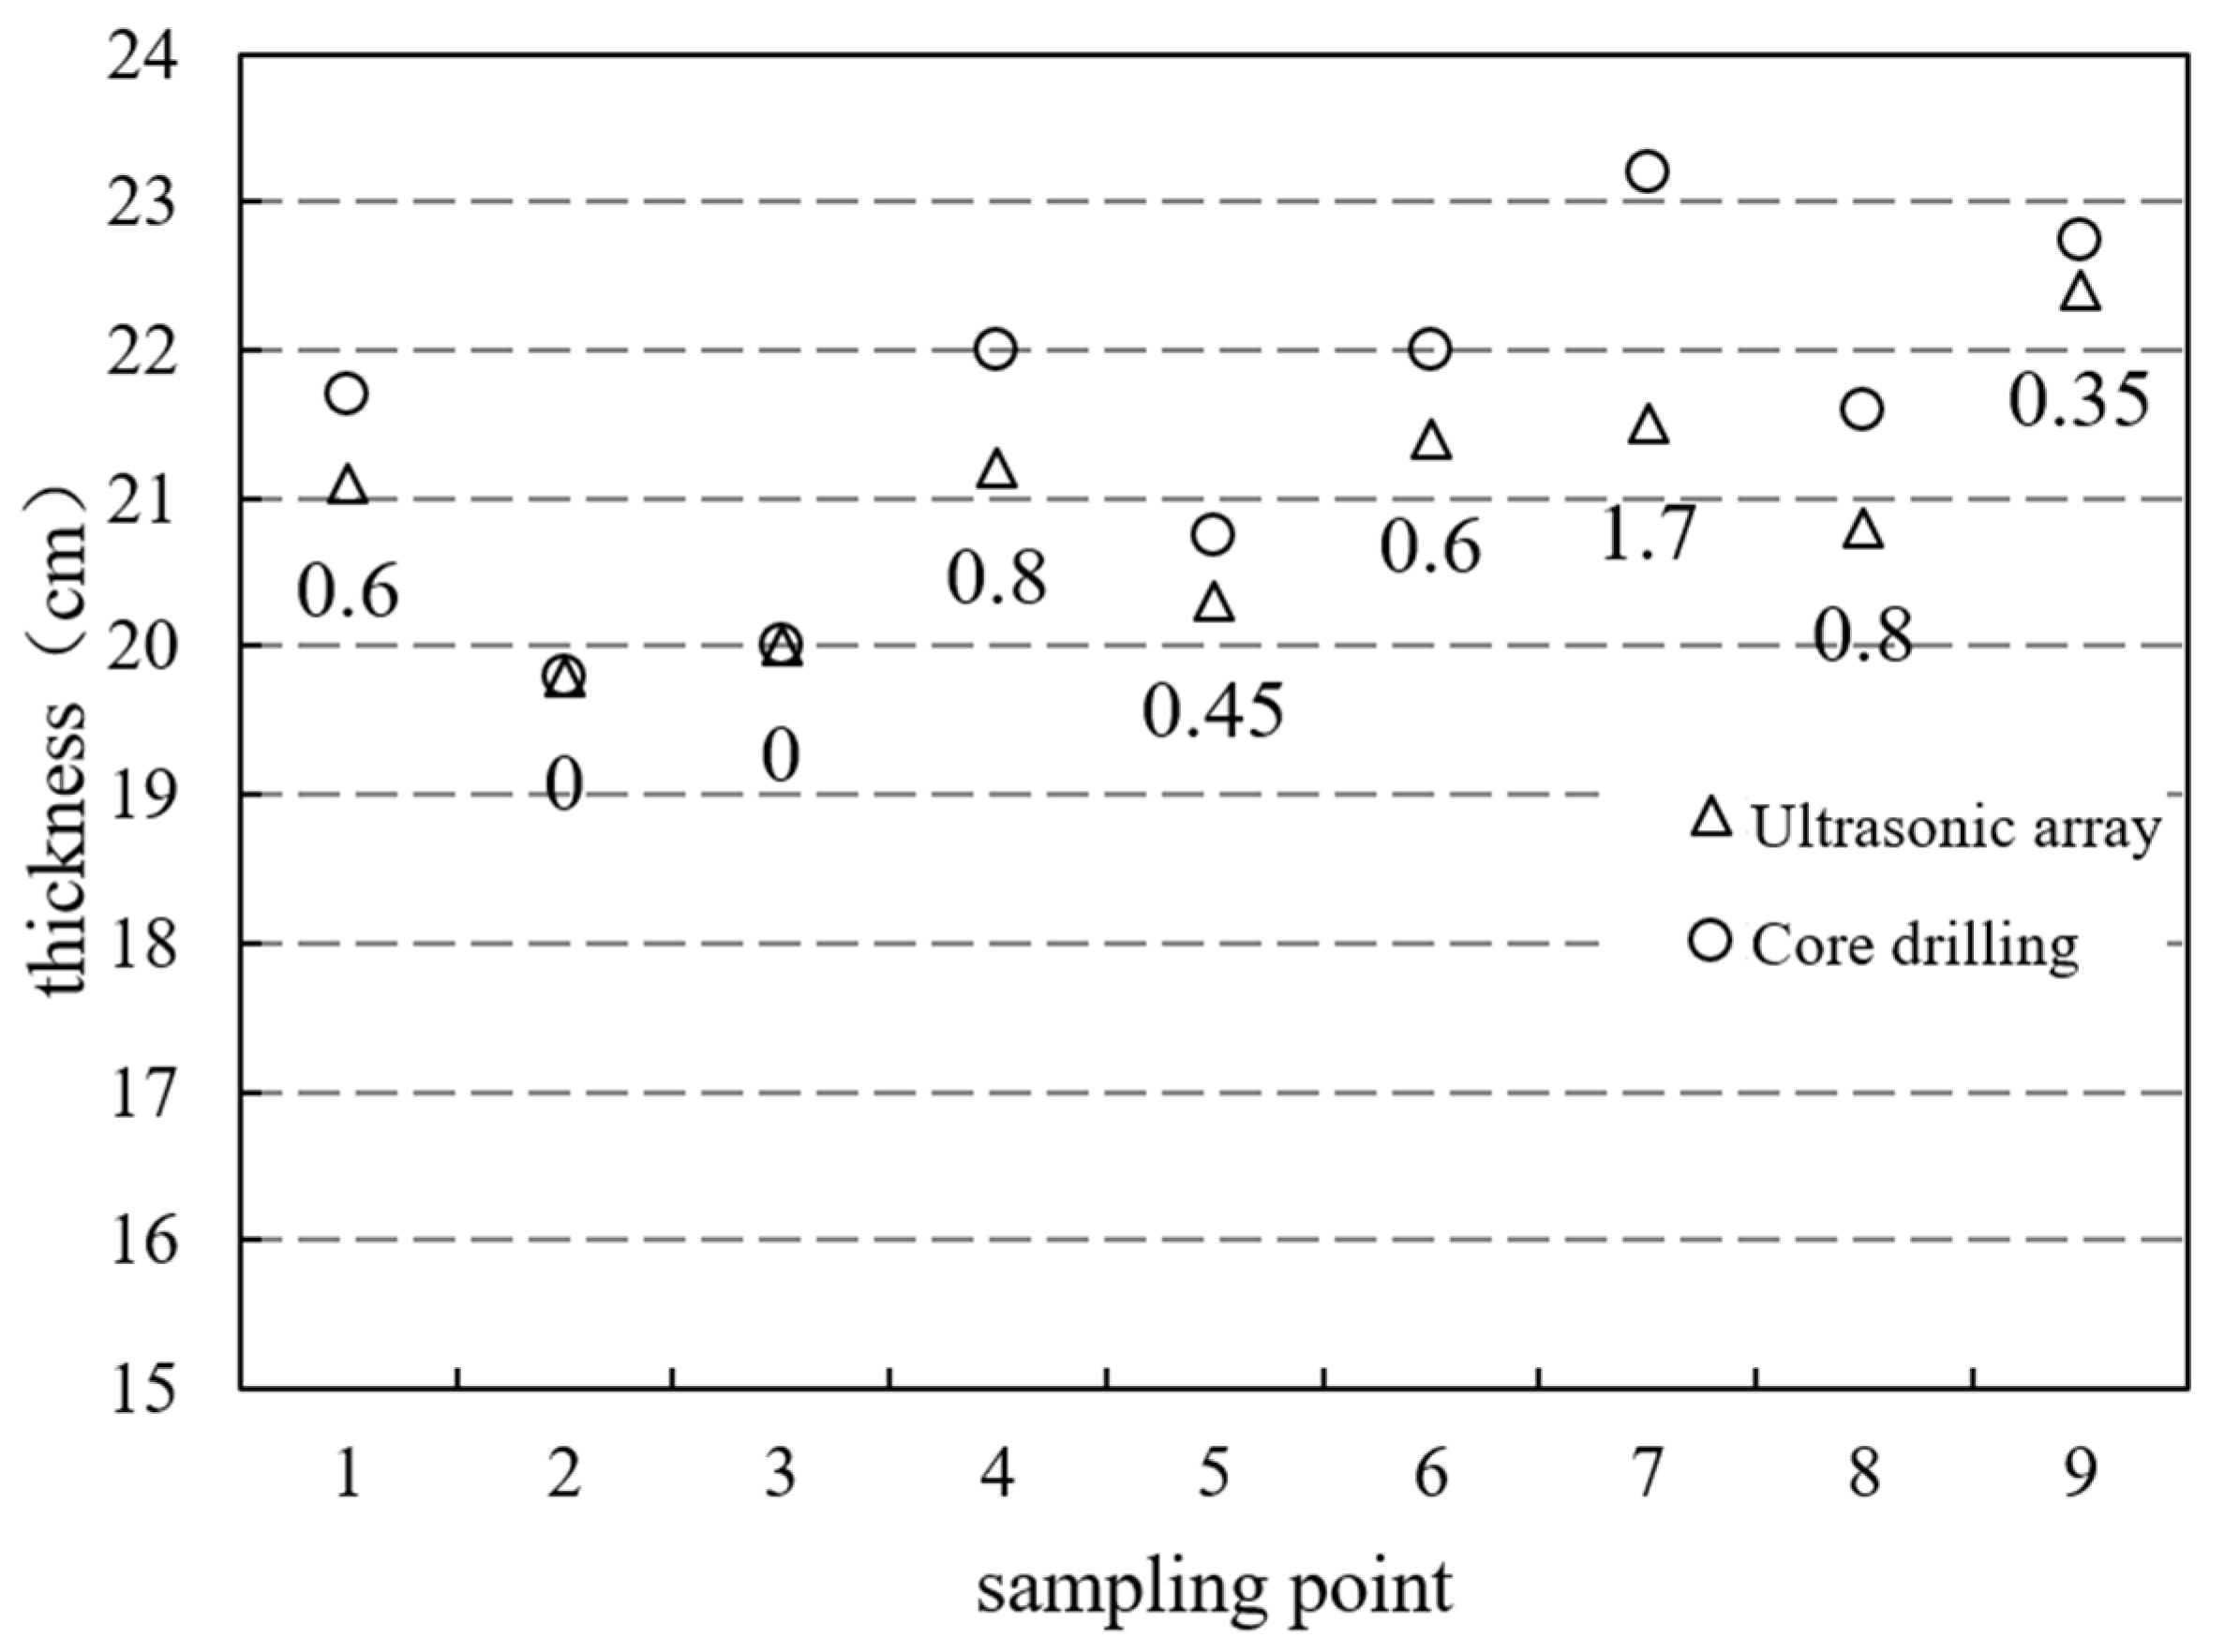
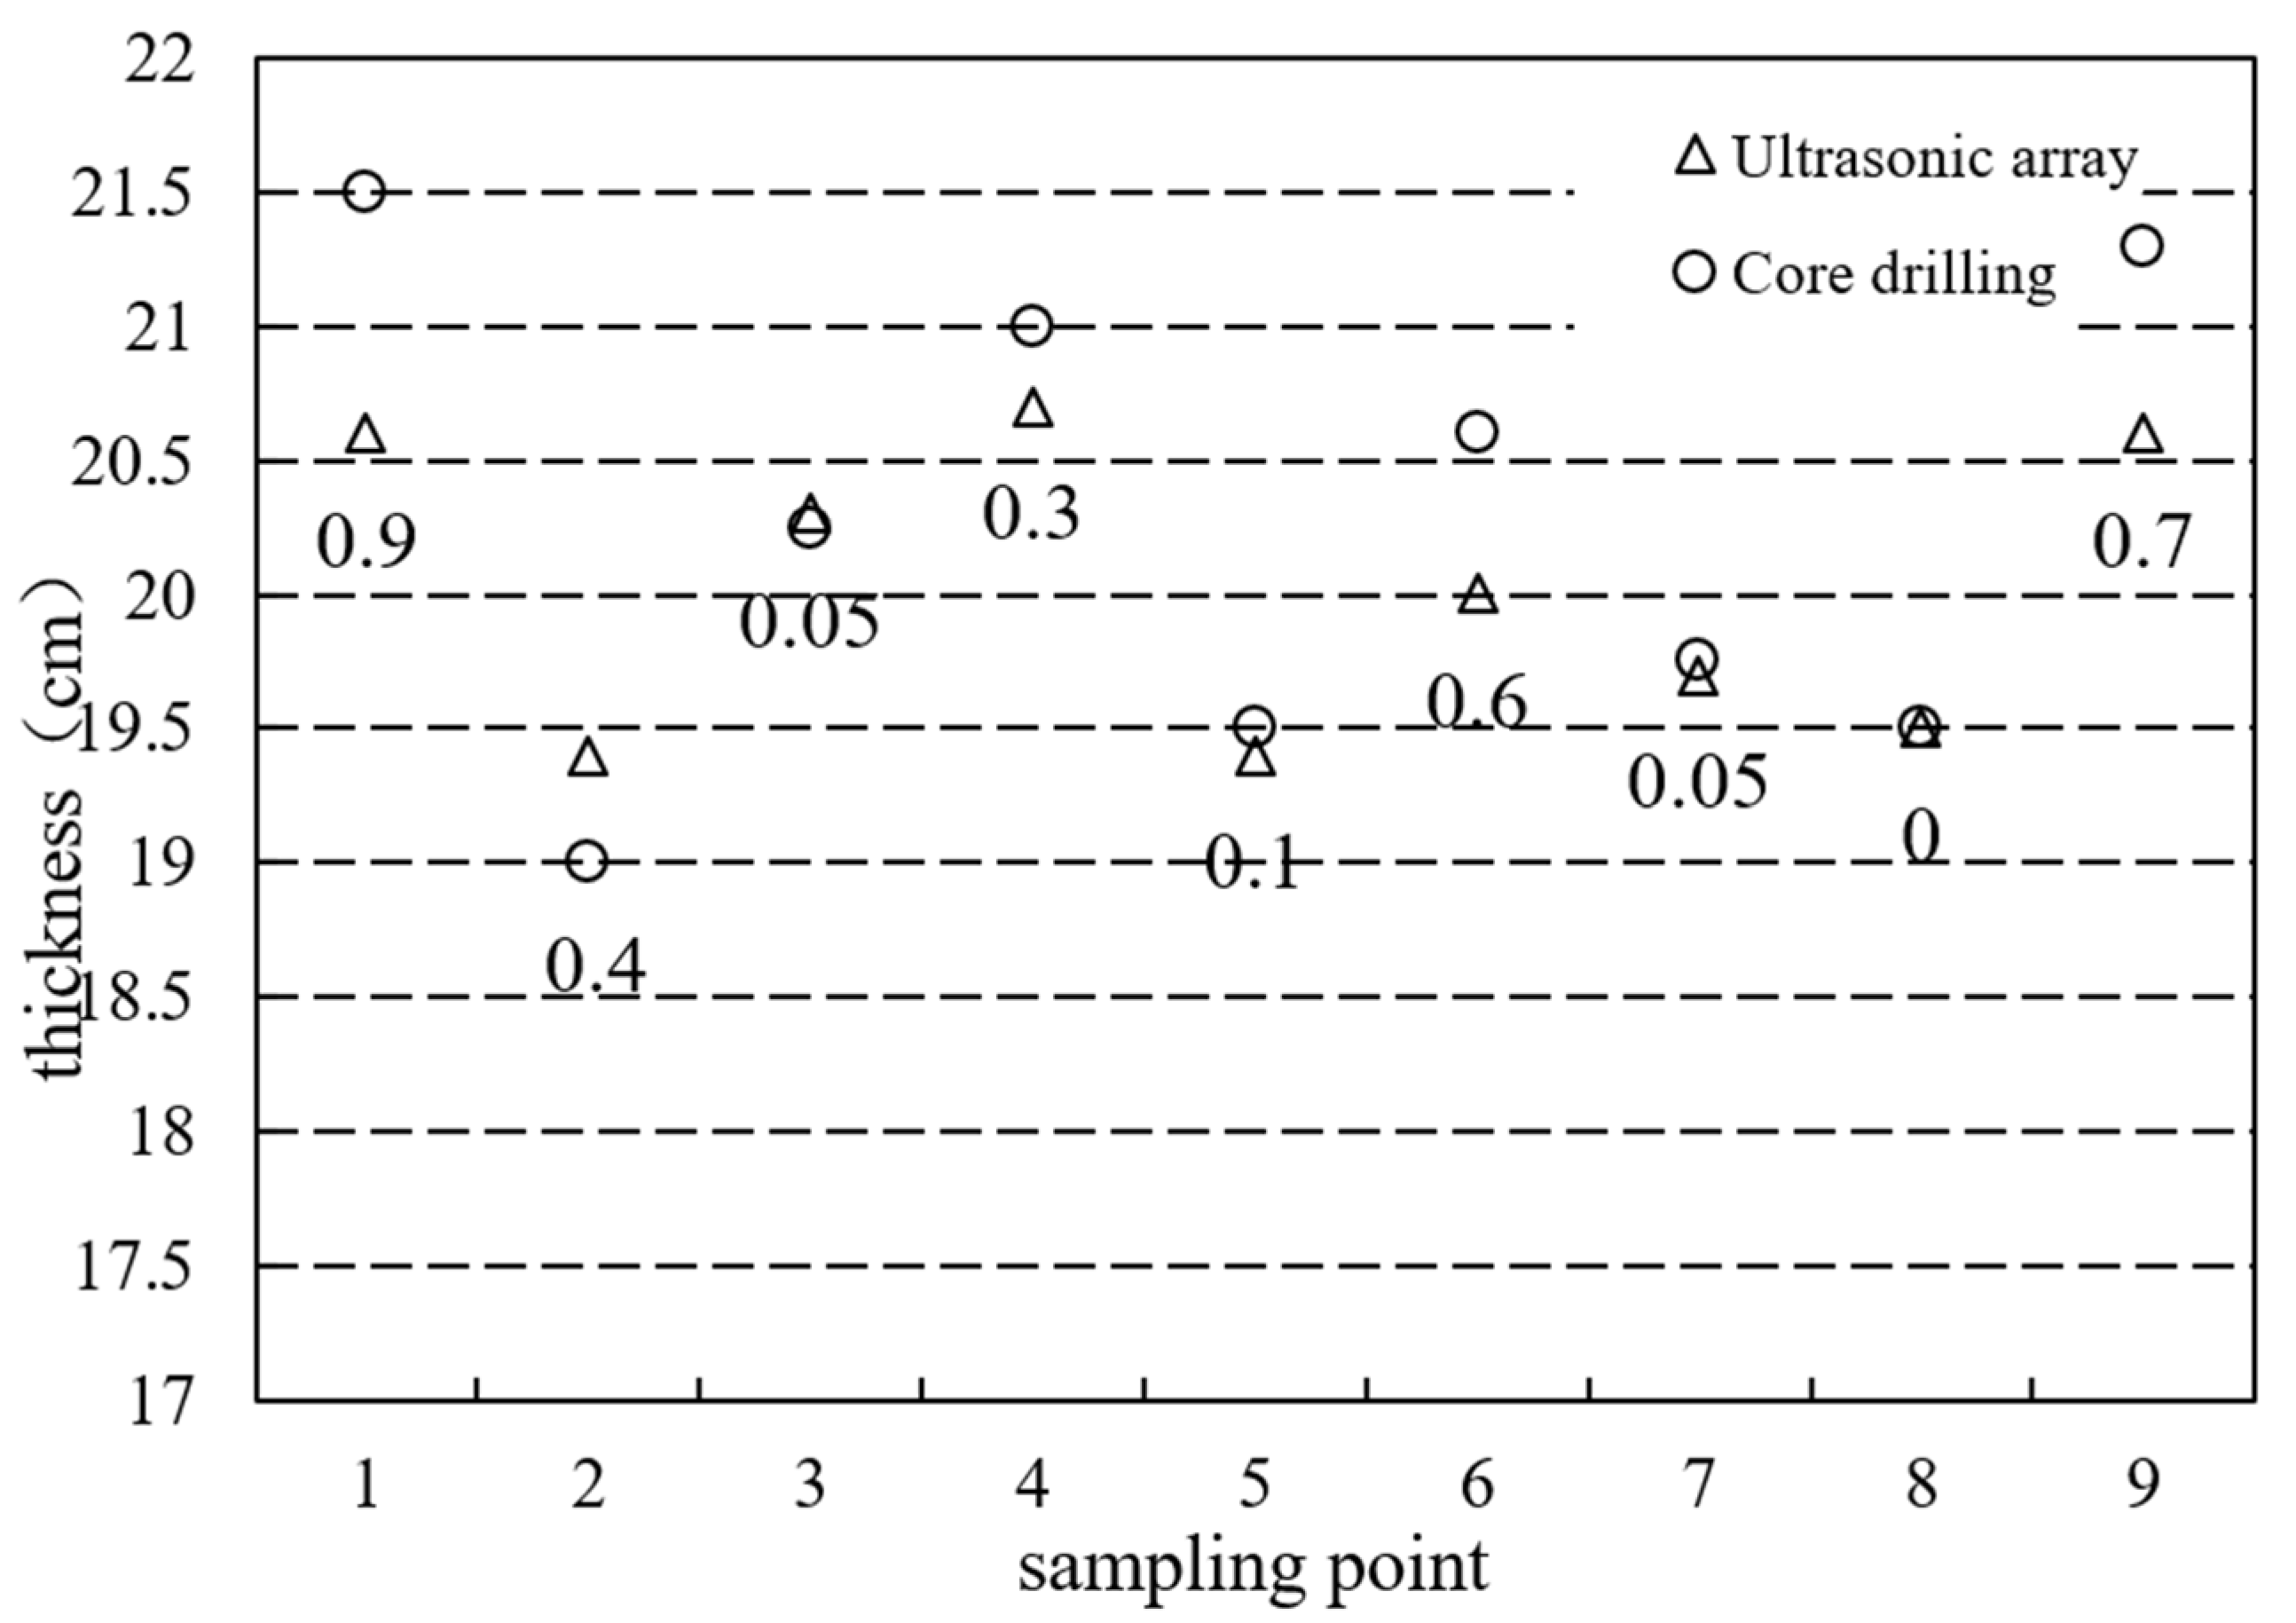
The maximum value of the correlation coefficient curve represents the take-off point of the interface reflection echo, which can be used to determine the propagation time T of the interface reflection echo. The thickness can then be calculated using Formula 1. Figure 23 and Figure 24 display the comparison between the results of ultrasonic array and core drilling methods. The numbers in the figures indicate the absolute difference between the core drilling and ultrasonic detection results.
The error at detection point 7 reached 17 mm due to machine damage during core drilling, which led to a significant discrepancy between the positions of core drilling and detection. Consequently, the thickness results of core drilling could not be accurately compared with the results of the ultrasonic array. After excluding the results of point 7, the mean absolute difference for slab 1 is 4.5 mm, with an average relative error of 2.1%.
For slab 2, the average value of the absolute difference is 3 mm, the maximum value is 9 mm, the minimum value is 0 mm, and the average relative error is 1.7%. Based on the above comparison results, it can be concluded that the evaluation method for surface layer thickness with large differences exhibits higher detection accuracy. This method is suitable for pavement structures with significant differences in acoustic impedance between the surface layer and the contact layer.

5. Conclusions

This study proposes a signal analysis and surface layer thickness calculation method based on ultrasonic array. The method preprocesses the raw signal using the Pearson correlation coefficient to eliminate the interference of abnormal signals and removes the surface direct wave using empirical mode decomposition. When the signal singularity is the discontinuity points of the first kind, an improved correlation coefficient method is used to determine the position of the echo start point; when the signal singularity is the discontinuity points of the second kind, the Mexh wavelet function is used as the wavelet transformation method to determine the position of the echo start point. As a result, the thickness of the surface layer can be calculated by obtaining the reflection echo of the interface propagation sound.
(1) Use the correlation coefficient method in indoor tests. For a concrete slab of 200 mm, the average absolute error of detected thickness for the type with a large difference in acoustic impedance was 7 mm, and the average absolute error for the type with a small difference in acoustic impedance is 20 mm.
(2) Use the wavelet transform modulus maximum method in indoor tests. For concrete slab of 200 mm, the average absolute error of detected thickness for the type with a large difference in acoustic impedance was 8 mm, which was not significantly different from correlation coefficient method. The average absolute error for the type with a small difference in acoustic impedance was 9 mm, which had great improvement in detection accuracy, indicating that wavelet transform modulus maximum method is more suitable for the type with a small difference in acoustic impedance.
(3) In the actual detection, compared with core drilling, the relative errors of the two methods are 1.7% and 1.9%, respectively, showcasing better accuracy.
However, because the actual value of the surface layer thickness fluctuates, if the distance of thickness detection spacing is too far, the actual thickness fluctuation will be lost. If the distance is too close, then it will need large amount of work. So, there is an optimal detection distance. In the future, the optimal sampling distance and veneer ranges can be further studied for practical engineering applications.

Author Contributions

Conceptualization, Y.T.; methodology, Y.T.; software, Y.T. and Y.Z.; validation, Y.Z., investigation, S.L.; data curation, J.W. and L.L.; writing—original draft preparation, J.W.; writing—review and editing, X.Z.; supervision, J.L. All authors have read and agreed to the published version of the manuscript.

Funding

Supported by the Fundamental Research Funds for the Central Universities. No. 2022-5-YB-11.

Institutional Review Board Statement

Not applicable.

Informed Consent Statement

Not applicable.

Data Availability Statement

The data presented in this study are available on request from the corresponding author.

Conflicts of Interest

The authors declare no conflict of interest.

References

  1. Ling, J.; Guan, S.; Zhao, H.; Gao, Z. Multi-hierarchy fuzzy decision-making model for PPM treatment selection of highway asphalt pavement. J. Highw. Transp. Res. Dev. 2008, 25, 25. [Google Scholar]
  2. Salton, M.; Terzi, S.; Terzi, O. Backcalculation of pavement layer thickness and moduli by the wavelet-neuro approach. In Proceedings of the International Conference on Transportation and Development, Houston, TX, USA, 26–29 June 2016. [Google Scholar]
  3. Bazi, G.; Saboundjian, S.; Ullidtz, P.; Briggs, R. Performance of an airfield flexible pavement and a novel PCN determination method. J. Transp. Eng. Part B-Pavements 2020, 146, 04020002. [Google Scholar] [CrossRef]
  4. Xiao, D. The development of road detection technology. In Proceedings of the 2nd International Conference on Civil, Architectural and Hydraulic Engineering (ICCAHE 2013), Zhuhai, China, 27–28 July 2013. [Google Scholar]
  5. Morcous, G.; Erdogmus, E. Accuracy of Ground-Penetrating Radar for Concrete Pavement Thickness Measurement. J. Perform. Constr. Facil. 2010, 24, 610–621. [Google Scholar] [CrossRef]
  6. Guo, Z. Application of ground penetrating radar to detect the thickness of road surface. Urban Geotech. Investig. Surv. 2017, 2–4. [Google Scholar]
  7. Wang, L.; Yuan, J.; Dai, N.; Wu, C.; Gao, G.; Xue, H. Analysis of interference signal of ground penetrating radar in road detection. J. Hubei Polytech. Univ. 2017, 33, 35–40. [Google Scholar]
  8. Williams, R.M.; Ray, L.E.; Lever, J.H.; Burzynski, A.M. Crevasse detection in ice sheets using ground penetrating radar and machine learning. IEEE J. Sel. Top. Appl. Earth Obs. Remote Sens. 2017, 7, 4836–4848. [Google Scholar] [CrossRef]
  9. Peters, L.; Daniels, J.J.; Young, J.D. Ground penetrating radar as a subsurface environmental sensing tool. Proc. IEEE 1994, 82, 1802–1822. [Google Scholar] [CrossRef]
  10. Plati, C.; Loizos, A.; Gkyrtis, K. Integration of non-destructive testing methods to assess asphalt pavement thickness. NDT E Int. 2020, 115, 102292. [Google Scholar] [CrossRef]
  11. Fengier, J.; Pożarycki, A.; Garbowski, T. Stiff-plate bearing test simulation based on FWD results. Procedia Eng. 2013, 57, 270–277. [Google Scholar] [CrossRef]
  12. Garbowski, T.; Pożarycki, A. Multi-level backcalculation algorithm for robust determination of pavement layers parameters. Inverse Probl. Sci. Eng. 2017, 25, 674–693. [Google Scholar] [CrossRef]
  13. Garbowski, T.; Gajewski, T. Semi-automatic Inspection Tool of Pavement Condition from Three-dimensional Profile Scans. Procedia Eng. 2017, 172, 310–318. [Google Scholar] [CrossRef]
  14. Edwards, L.; Mason, Q. Evaluation of nondestructive methods for determining pavement thickness. Concr. Pavements 2011. [Google Scholar] [CrossRef]
  15. Hoegh, K.E. Ultrasonic Linear Array Evaluation of Concrete Pavements. Ph.D. Thesis, University of Minnesota, Twin Cities, MN, USA, 2013. [Google Scholar]
  16. Vancura, M.; Khazanovich, L.; Barnes, R. Concrete Pavement Thickness Variation Assessment with Cores and Nondestructive Testing Measurements. Transp. Res. Rec. J. Transp. Res. Board 2013, 2347, 61–68. [Google Scholar] [CrossRef]
  17. Hoegh, K.; Khazanovich, L.; Ferraro, C.; Clayton, D. Ultrasonic linear array validation via concrete test blocks. AIP Conf. Proc. Am. Inst. Phys. 2015, 1650, 83–93. [Google Scholar]
  18. Wang, Z.J. Detecting Technique Research on Cement Concrete Slabs with Ultrasonic Method; Harbin Institute of Technology: Harbin, China, 2010. [Google Scholar]
  19. Fu, Z.W.; Hu, J.F.; Wen, Y.B.; Duan, Y.K.; Hu, Y.L.; Ge, S.Y.; Liao, X.J. Ultrasonic Modeling of Non-damaging Inspection to the Strength and Thickness of Concrete Highway Surface. J. Yunnan Univ. 2000, issue S1, 54–60. [Google Scholar]
  20. Wang, Z.J.; Tan, Y.Q.; Chen, F.C.; Wang, Q. Detecting compressive strength of pouring piles concrete by ultrasonic method. J. Harbin Inst. Technol. 2008, 40, 100–102. [Google Scholar]
  21. Zhang, G.H.; Chou, K.C. Viscosity model for fully liquid silicate melt. J. Min. Metall. Sect. B Metall. 2012, 48, 1–10. [Google Scholar] [CrossRef]
  22. Hoegh, K.; Khazanovich, L.; Yu, H.T. Ultrasonic tomography for evaluation of concrete pavements. Transp. Res. Rec. J. Transp. Res. Board 2011, 2232, 85–94. [Google Scholar] [CrossRef]
  23. Hoegh, K.; Khazanovich, L. Correlation analysis of 2D tomographic images for flaw detection in pavements. J. Test. Eval. 2012, 40, 9. [Google Scholar] [CrossRef]
  24. Pan, F.; Tang, D.L.; Guo, X.S.; Pan, S. Defect identification of pipeline ultrasonic inspection based on multi-feature fusion and multi-criteria feature evaluation. Int. J. Pattern Recognit. Artif. Intell. 2021, 35, 2150030. [Google Scholar] [CrossRef]
  25. Li, G.; Wang, X.W.; Shi, L.H. EMD denoising method and its application in lamb wave detection. Acta Metrol. Sin. 2006, 27, 149–152. [Google Scholar]
  26. Zhang, Q.; Chen, T.L.; Que, P.W.; Xing, Y. Compression of ultrasonic signals with the lifting scheme wavelet transform. Russ. J. Nondestruct. Test. 2008, 44, 490–495. [Google Scholar] [CrossRef]
  27. Trawinski, Z.; Wojcik, J. Comparison of methods used for ultrasonic examinations of IMT in the wall of the carotid artery model. Arch. Acoust. 2008, 33, 27–32. [Google Scholar]
Figure 1. Ultrasonic array detection equipment and detection principle.
Sustainability 15 08228 g001
Figure 2. Principle of ultrasonic detection surface layer thickness.
Sustainability 15 08228 g002
Figure 3. Structure scanning signal.
Sustainability 15 08228 g003
Figure 4. Structural composition of types of large and small difference in acoustic impedance of concrete pavement.
Sustainability 15 08228 g004
Figure 5. Empirical modal decomposition of ultrasound signals that contain surface direct waves.
Sustainability 15 08228 g005aSustainability 15 08228 g005b
Figure 6. Empirical modal decomposition (EMD) to remove surface direct wave signal.
Sustainability 15 08228 g006
Figure 7. Improved correlation coefficient method reference signal.
Sustainability 15 08228 g007
Figure 8. Improved correlation coefficient method to determine interface reflection echo propagation sound time T.
Sustainability 15 08228 g008
Figure 9. Different types of wavelet basis mode maxima distribution: (a) Sym3, (b) Mexh, (c) Haar, and (d) Gaus3.
Sustainability 15 08228 g009aSustainability 15 08228 g009b
Figure 10. Wavelet coefficient distribution of a signal.
Sustainability 15 08228 g010
Figure 11. Modal maxima distribution of a signal.
Sustainability 15 08228 g011
Figure 12. Mean values of modal maxima of a signal.
Sustainability 15 08228 g012
Figure 13. Diagram of runway structure at Nanjing Lukou Airport.
Sustainability 15 08228 g013
Figure 14. Runway core sampling thickness inspection results.
Sustainability 15 08228 g014
Figure 15. Wavelet coefficient distributions of detection points 1–6.
Sustainability 15 08228 g015
Figure 16. Wavelet mode maxima of detection points 1–6.
Sustainability 15 08228 g016
Figure 17. Mean values of wavelet mode maxima of detection points 1–6.
Sustainability 15 08228 g017
Figure 18. Absolute differences between ultrasonic and core sample thickness.
Sustainability 15 08228 g018
Figure 19. Detection points arrangement of slab1 and slab2.
Sustainability 15 08228 g019
Figure 20. Original signals of detection points 1–6.
Sustainability 15 08228 g020
Figure 21. The signals of detection points 1–6 after removing the surface wave signal.
Sustainability 15 08228 g021
Figure 22. Correlation coefficient value of detection points 1–6.
Sustainability 15 08228 g022
Figure 23. Results comparison between ultrasonic array and core drilling of slab 1.
Sustainability 15 08228 g023
Figure 24. Results comparison between ultrasonic array and core drilling of slab 2.
Sustainability 15 08228 g024
Table 1. Ultrasonic Array Thickness Statistics.
Detection Point NumberUltrasonic Propagation Time (μs)Ultrasonic
Detected Thickness (mm)
Core Sample Thickness
(mm)
Percentage Error (%)
13093853932.08
2300375366−2.40
32903633701.93
4334418405−3.11
5298372360−3.23
62893563652.53
72953693802.98
8283353345−2.27
93113883951.80
103254054050.00
113013763831.86
123083853952.60
13290362352−2.76
142813513510.00
152843533571.13
16277346338−2.31
172733413410.00
18291364350−3.85
192633293351.82
202983723750.81
21300375368−1.87
22299374361−3.48
23300375363−3.20
242723393451.77
253113883880.00
262813503530.86
273003753750.00
28300375365−2.67
Disclaimer/Publisher’s Note: The statements, opinions and data contained in all publications are solely those of the individual author(s) and contributor(s) and not of MDPI and/or the editor(s). MDPI and/or the editor(s) disclaim responsibility for any injury to people or property resulting from any ideas, methods, instructions or products referred to in the content.