Article

Study on Multi-Objective Optimization of Power System Parameters of Battery Electric Vehicles

1
School of Mechanical and Automotive, Guangxi University of Science and Technology, Liuzhou 545006, China
2
Guangxi Key Laboratory of Automobile Components and Vehicle Technology, Guangxi University of Science and Technology, Liuzhou 545006, China
3
Guangxi Automobile Tractor Research Institute, Liuzhou 545006, China
*
Author to whom correspondence should be addressed.
Sustainability 2023, 15(10), 8219; https://doi.org/10.3390/su15108219
Submission received: 23 April 2023 / Revised: 13 May 2023 / Accepted: 16 May 2023 / Published: 18 May 2023

Abstract

:
The optimization of power parameters is the key to the design of pure electric vehicles. Reasonable matching of the relationship between various parameters can effectively reduce energy consumption and achieve energy sustainability. In this paper, several vehicle performance indexes such as maximum vehicle speed, acceleration time and power consumption per 100 km were used as optimization target vectors, and transmission ratio was used as optimization variable to establish the optimization problem of parameter matching. Then, the feasible domain of the transmission ratio was obtained by taking the lowest performance index of the vehicle as the constraint condition. In the feasible domain, the multi-objective genetic algorithm is used to solve the optimization problem. The Pareto optimal solution set is obtained for fixed ratio transmission and two-gear transmission, which is used as an alternative solution set. The final parameter-matching scheme is determined by comparing the alternative scheme set of different motors comprehensively. The results show that the competition relationship between multiple optimizable indexes can be described effectively by solving the Pareto front. Specifically, the Pareto optimal solution set for the motor A + fixed transmission scheme is 1.33~1.85; the Pareto optimal solution set for the motor A + 2 transmission scheme is [1.72, 0.98]~[2.99, 1.57], and the Pareto optimal solution set for the motor B + 2 transmission scheme is [2.99, 1.40]~[2.99, 1.57]. The motor A + fixed transmission scheme does not require A clutch and does not require designing a shift algorithm. Therefore, after comprehensive consideration, the motor A + fixed transmission ratio transmission scheme is set as the final scheme.

1. Introduction

With the continuous increase in population and economic development, and the rapid growth of energy consumption, the human grab for energy has caused the energy crisis [1]. With the increasing energy consumption of human life and production year by year, countries around the world have frequently issued the call of “energy conservation, emission reduction and sustainable development”. As the main transportation tool of modern human travel [2], the automobile not only brings convenience to people, but also causes environmental pollution and energy crisis [3,4]. In order to solve this problem, most of the world’s automobile enterprises are conducting relevant research on new energy vehicles. In recent years, new energy vehicles have attracted more and more attention around the world [5], and have become a new star in the automotive field. They are the only way to achieve sustainable development in the future.
New powertrain vehicles have shown great potential in reducing the use of fossil fuels and greenhouse gas emissions, and are one of the solutions to the environmental and energy crisis. For a specific system configuration, its energy-saving and emission reduction potential depend on two aspects: (1) system parameter matching in the design stage; (2) control strategy design in the operation stage. The pure electric vehicle has only the energy source (power battery) and the sole driving actuator (motor). The driving strategy and braking feedback strategy in the running stage are relatively fixed [6], so parameter matching in the design stage is more significant for battery electric vehicles. However, the development of battery electric vehicles is limited by technical problems such as insufficient charge of power batteries [7], limited cycle life [8] and uncertainty of safety [9].
The system of a pure electric vehicle mainly includes the electric drive system [10], power supply system [11] and auxiliary system [12]. The electric drive system includes the electronic controller, power converter, motor, mechanical transmission device and wheel, whose function is to efficiently convert the electric energy stored in the battery into the kinetic energy of the wheel, and to charge the kinetic energy of the wheel into electric energy in the battery when the vehicle decelerates and brakes [13]. The power supply system includes the power supply, energy management system and charger, whose functions are mainly to provide driving electric energy to the motor, monitor the use of power supply and control the charger to charge the battery [14]. Auxiliary systems include the auxiliary power source, power steering system, navigation system, air conditioner, lighting and defrosting device, wiper and radio, etc. This auxiliary equipment helps to improve vehicle handling and occupant comfort [15].
The main research object of this paper is single-motor pure electric vehicles, and the power system parameter optimization can be divided into three levels, namely, the traditional parameter optimization method, single objective optimization and multi-objective optimization. The traditional parameter optimization method first determines the performance indicators of the vehicle, and then determines the parameters of the key components in the power system, respectively, according to the specific process, including parameters such as battery capacity, drive motor power and transmission ratio [16,17]. Wang et al. [18] discussed the design requirements of electric vehicles by analyzing the advantages and disadvantages of various drive motors, batteries and drive systems of electric vehicles; by selecting an appropriate drive motor, battery and drive system and designing the parameters of the power system, the maximum speed, climbing ability and acceleration time are significantly improved. In the process of parameter optimization, when a bottleneck index is difficult to achieve, such as climbing index, many other indicators often exceed the lowest performance index. Traditional parameter optimization methods focus only on the realization of the lowest performance index, not on the optimization of the performance index.
Single objective parameter optimization refers to the optimization of parameter matching in all feasible solutions with single performance optimization as the goal. Similar to traditional cars, three indexes of power performance, economy and smoothness are generally used when evaluating the performance of pure electric vehicles. In the parameter matching of the transmission system, it is often necessary to sacrifice other performance in order to achieve the optimal performance index; the result is a decline in the vehicle’s performance [19]. Xu et al. [20] take fuel cell vehicles as the research object, take the sum of fixed costs and operating costs as the optimization goal and optimize the transmission system parameters with a single goal. Murgovski et al. [21] take the manufacturing cost and maintenance cost of electric vehicles as the optimization goal, and use the convex optimization theory to conduct single target optimization for the parameter matching problem of key components of the transmission system. In traditional parameter matching, we usually only focus on whether the performance indicators meet the design requirements, rather than pursue the performance optimization. However, single target optimization selects specific optimization goals among all feasible schemes to meet the lowest performance indicators, and conducts parameter optimization through the optimization problem.
The vehicle performance evaluation of pure electric vehicles is multi-dimensional, and it is difficult to summarize with one index. The development of intelligent optimization algorithms makes multi-objective optimization become the mainstream method to solve the problem of power system parameter matching and optimization [22]. Omar Hegazy et al. [23] proposed a control strategy of using a particle swarm optimization algorithm to optimize power distribution and component size between power sources in hybrid electric vehicles, so as to optimize the vehicle so that it has high efficiency. Fu et al. [24] put forward a multi-target optimization based on a parameter matching optimization method, weight of fuel consumption and emissions of target optimization problem into a single target optimization problem, and then through the target function of AVL cruise and Matlab/Simulink joint simulation. Then, target optimization can significantly reduce vehicle fuel consumption and emissions to provide optimized vehicle configuration for energy management strategy research. However, none of the above multi-objective optimization methods describe the competitive relationship between multiple vehicle performance indicators, and the effectiveness of the optimization method lacks experimental validation.
The power system of pure electric vehicles is a very critical system in pure electric vehicles. The power system parameters determine the vehicle performance of pure electric vehicles, and they need to reasonably match the parameters of each component according to the mutual influence of the parameters of the power system [25,26]. Due to the characteristics of the drive motor for pure electric vehicles, it has the operating characteristics of constant torque below the base speed and constant power above the base speed, and the speed regulation range is wide [19]. Pure electric vehicle transmission systems generally only use the fixed speed ratio of the main reducer, which can reduce the volume, weight and energy loss of the transmission system [27]; however, the multi-gear transmission of pure electric vehicles can improve the maximum speed and the maximum climbing degree, improve the economy and reduce the volume of the drive motor advantages [28]. Compared with the pure mechanical structure of the traditional automobile transmission system, pure electric vehicles bring new challenges of mechanical and electrical coupling. The reasonable matching and layout of the drive motor and power battery with the mechanical structure is the biggest difference and difficulty between pure electric vehicles and fuel vehicles. The driving motor power selection is too large and will cause the motor to continue to run in a low-efficiency area, with huge energy consumption and reduced mileage. If the power is too small, the dynamic performance of the vehicle will be low, and the climbing performance and acceleration performance will be affected [29]. Too many power batteries will result in a large number of battery packs, increased vehicle weight and decreased power performance. If the number of power batteries is too small, they may not meet the demand for power and mileage [30].
A battery electric vehicle power system is a complex system involving multiple disciplines, mainly composed of the power battery, drive motor and transmission system [31,32]. The evaluation indexes of the power performance of battery electric vehicles include maximum speed, acceleration time and climbing ability, and the evaluation indexes of economy include energy consumption rate and endurance mileage [33]. The change of power system parameters has a great impact on the performance of pure electric vehicles. To improve the performance of the vehicle, the reasonable matching problem of the performance of power system parameters must be solved [34]. The power performance and economy of pure electric vehicles are susceptible to the speed and torque characteristics of their driving motors, the discharge characteristics of the power battery and the transmission system parameters. Therefore, the determination of parameters and the reasonable matching between them are crucial [35,36].
In the process of parameter matching, when a bottleneck index is difficult to achieve (such as 20% climbing index), many other indicators often exceed the lowest index to varying degrees. Some studies generally only discuss whether the “minimum index” is met [37,38], and rarely discuss the optimization of this part of the index beyond the minimum index.
In this paper, for a certain type of pure electric vehicle, the lowest index based on GB/T 28382 is the constraint condition [39]. Multiple indicators are selected for optimization to establish the multi-objective optimization problem, determine the feasible domain of the optimization variable through the lowest performance index, and solve the Pareto array surface to describe the competitive relationship between multiple optimization indexes, thus obtaining the Pareto optimal solution set, and solving the fixed transmission ratio and the two-gear transmission ratio. According to the specific requirements of the platform development, the final scheme is determined from the Pareto optimal solution set, and the performance of the developed power system is up to the standard through the drum test.

2. Numerical Method

2.1. Pure Electric Vehicle System Configuration

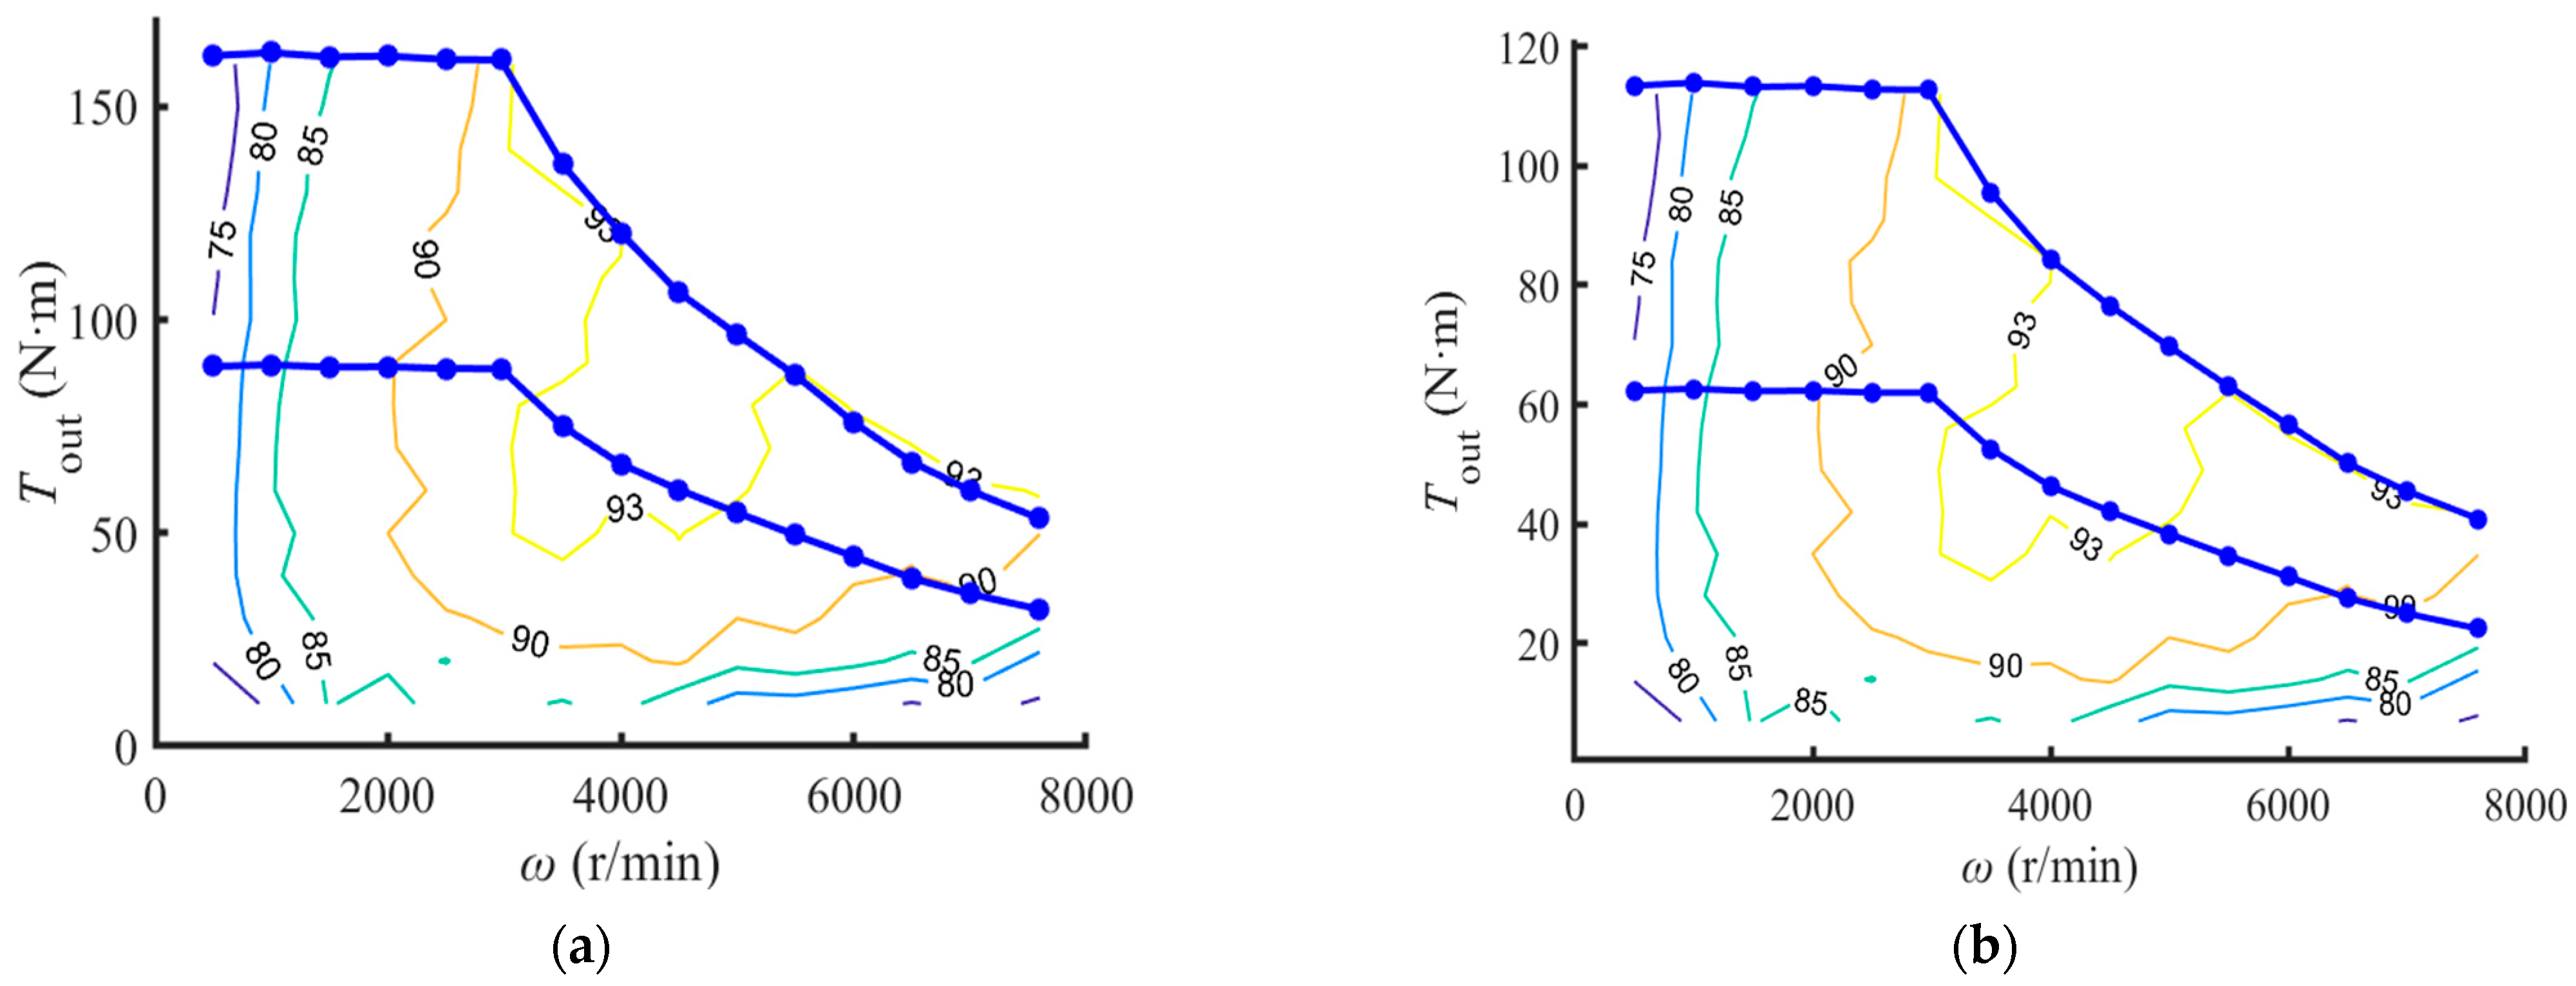
The main parameters of a certain rear-drive battery electric vehicle developed on the basis of the traditional diesel engine type are shown in Table 1. There are a variety of motors to choose from in this specific project. In the parameter matching case of this paper, only two typical permanent magnet synchronous motors of the same series are taken as examples [40,41]. The schematic diagram of the bench test setup is shown in Figure 1, which tests the efficiency characteristics of the drive motor by the bench test before the vehicle integration. The efficiency map of the two motors is shown in Figure 2. The maximum power of the motor A is 50 kW, rated power is 28 kW, rated speed 2970 rpm, maximum speed 7600 rpm, motor B maximum power 35 kW, rated power 15 kW, rated speed 2970 rpm and maximum speed 7600 rpm.

2.2. MATLAB Simulation Platform

This project builds a software simulation platform for the vehicle control algorithm, which can verify the reliability and integrity of the control logic before the development of the power system, and can also simulate dangerous driving or fault state of the real vehicle, so as to test the fault diagnosis and safety management module in the vehicle control algorithm.
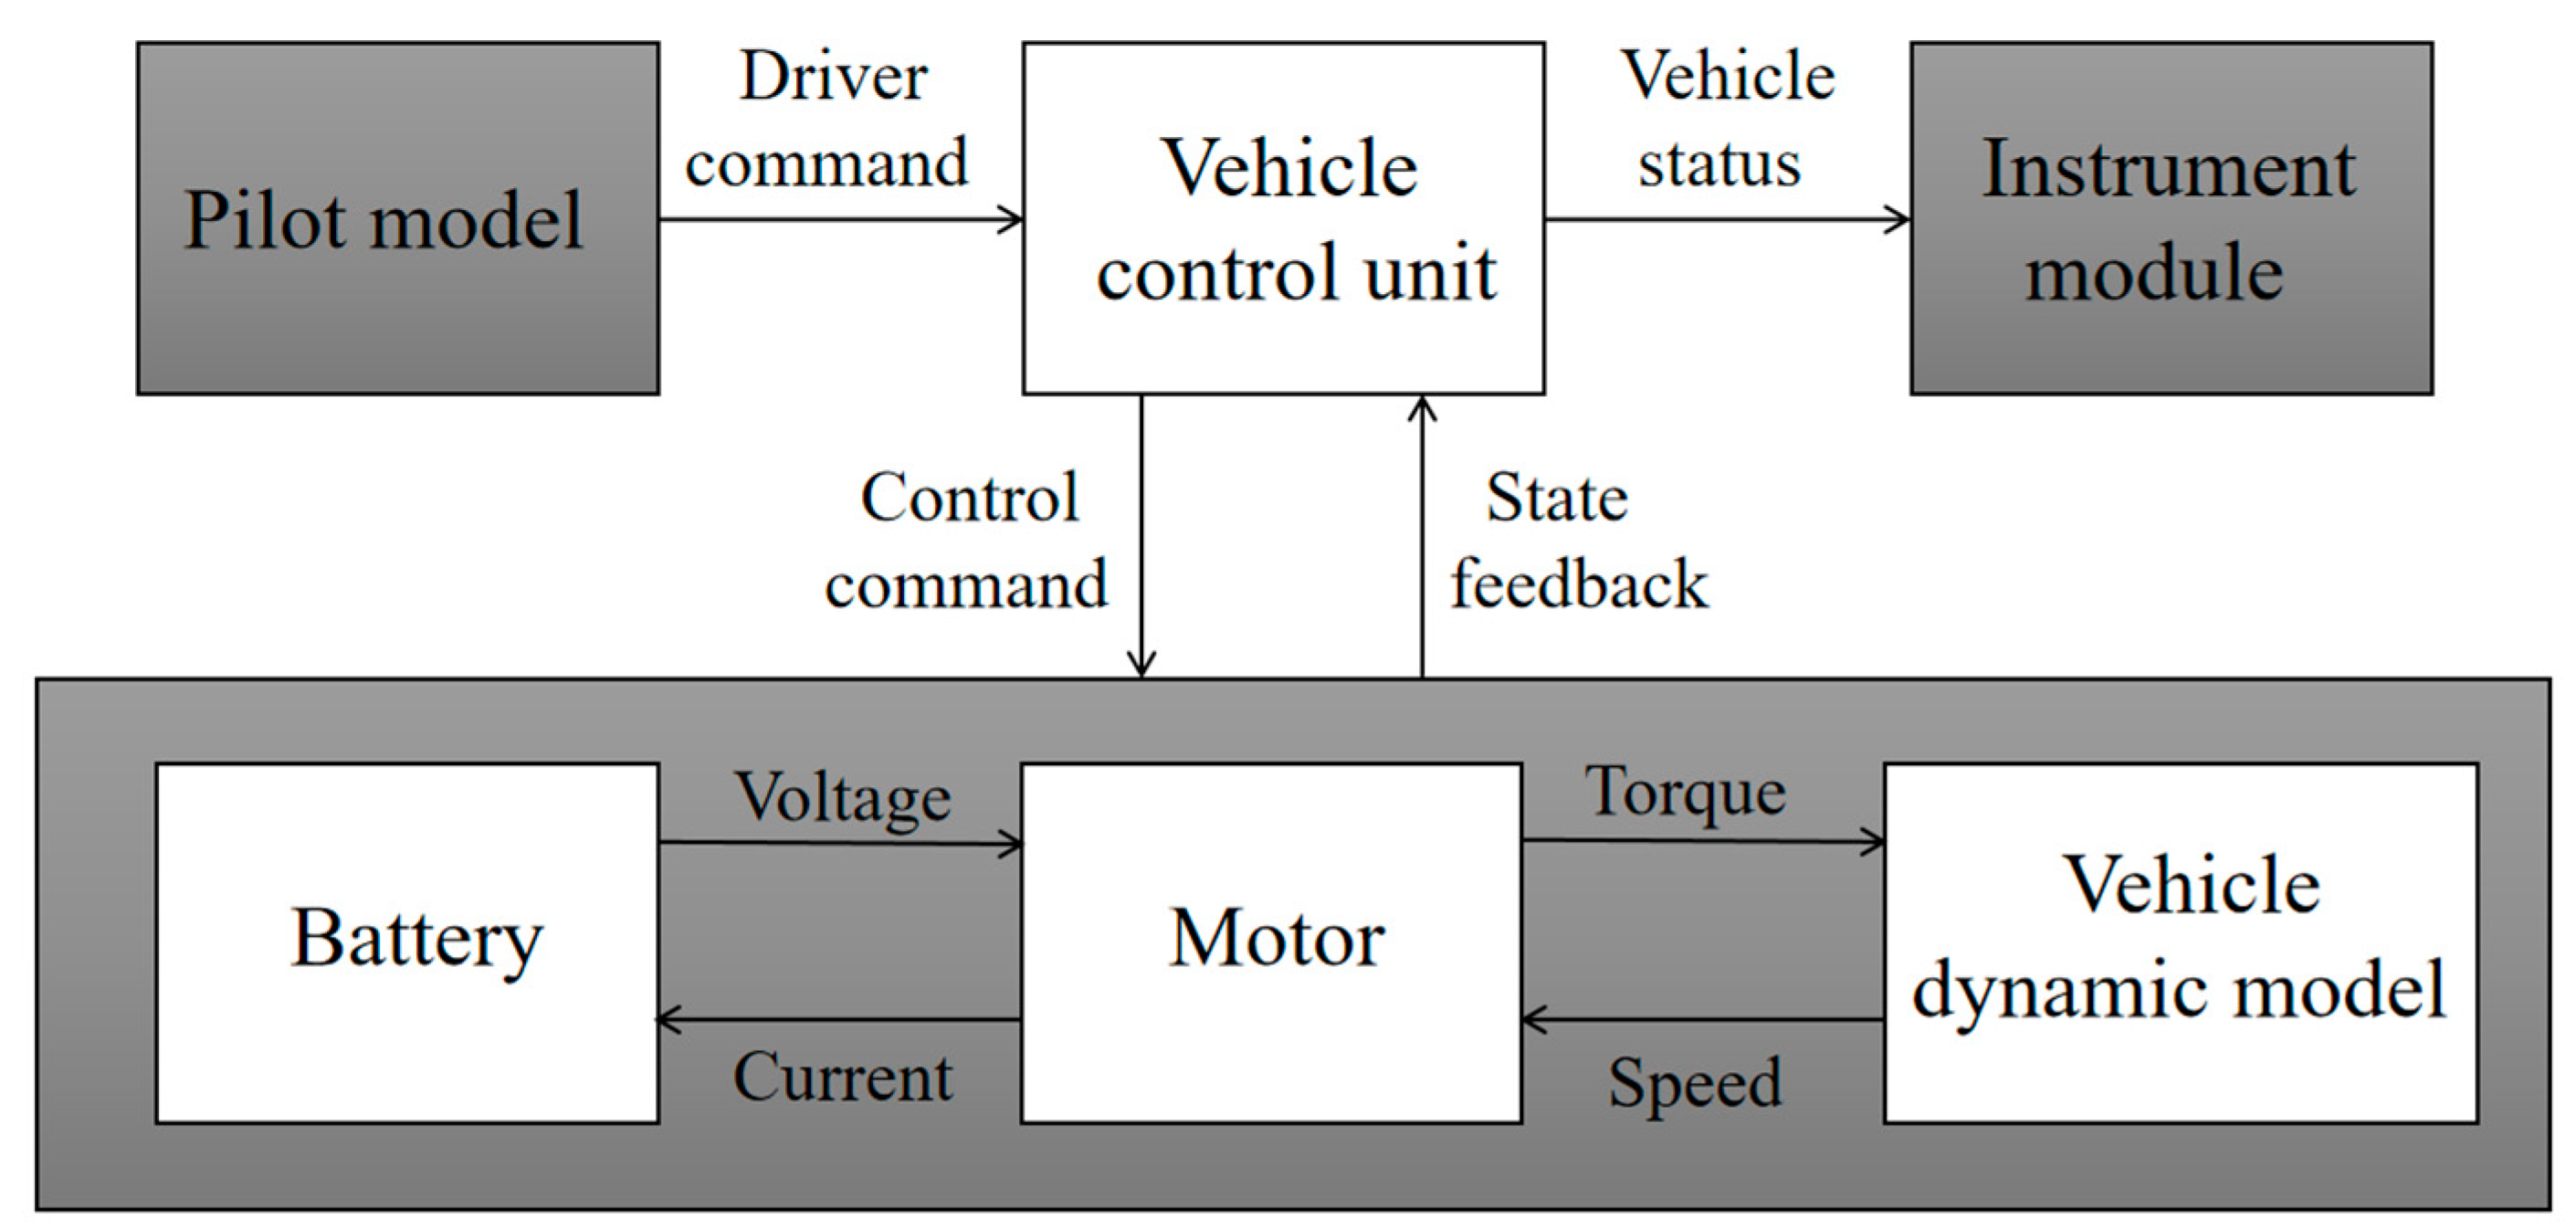
The vehicle control algorithm was tested and developed in MATLAB/Simulink, as shown in Figure 3. The software test platform module includes the driver model, instrument model, vehicle model, motor and controller model, battery and battery management system, charging machine model, distribution device model, etc. Each model is modeled according to the real physical interface and electrical interface, which can fully simulate the vehicle operating environment. All signal interfaces are consistent with the actual interface, and the control algorithm can be debugged efficiently. The debug algorithm model and the code generation model can be seamlessly switched through configuration. The driver module and instrument module are developed using MATLAB’s GUI toolbox to keep consistency with the real car interface as much as possible. The driver module is mainly used to simulate driver input, including various input signals, such as the accelerator pedal signal, brake pedal signal, gear signal, ignition key signal and air conditioning switch signal. There is an instrument module inside the simulation of the actual instrument to display the amount.

2.3. Performance Constraints of Pure Electric Vehicles

The lowest performance index refers to the performance index that must be achieved by the parameter matching scheme, which is divided into two aspects: power performance and economy. The power indicators include maximum speed, climbing performance and acceleration performance, and the economic indicators include range and power consumption of 100 km. GB/T 28382 is an important reference for the whole vehicle performance index of pure electric passenger vehicles in China. The lowest performance index of this paper is determined with GB/T 28382 as the reference, as shown in Table 2.
For a specific motor, the feasible domain solution of the transmission ratio constrained by the lowest performance index is similar to the parameter matching method in the existing studies, mainly through the vehicle longitudinal dynamics equation [42,43]:
m 1 d v d t = F d C D A ρ v 2 2 m 2 g sin α m 2 g f cos α
where: Fd is the driving force; CD is the air resistance coefficient; A is the windward area of the vehicle; ρ is the air density; v is the speed; α is the slope angle; and m2 is the test mass of the electric vehicle determined according to GB/T 18386 [44]. It is the sum of the preparation mass mv and the test additional mass mcap:
m 2 = m v + m c a p
Among them, the conditioning mass mv includes battery quality. During the parameter matching process, the battery quality sets a basic value in advance, and the rationality of the set value is verified after the matching. Meanwhile, m1 is the test mass of EV(electric vehicle) considering the rotating mass:
m 1 = δ m v + m c a p
where: δ is the conversion coefficient of the rotation mass.
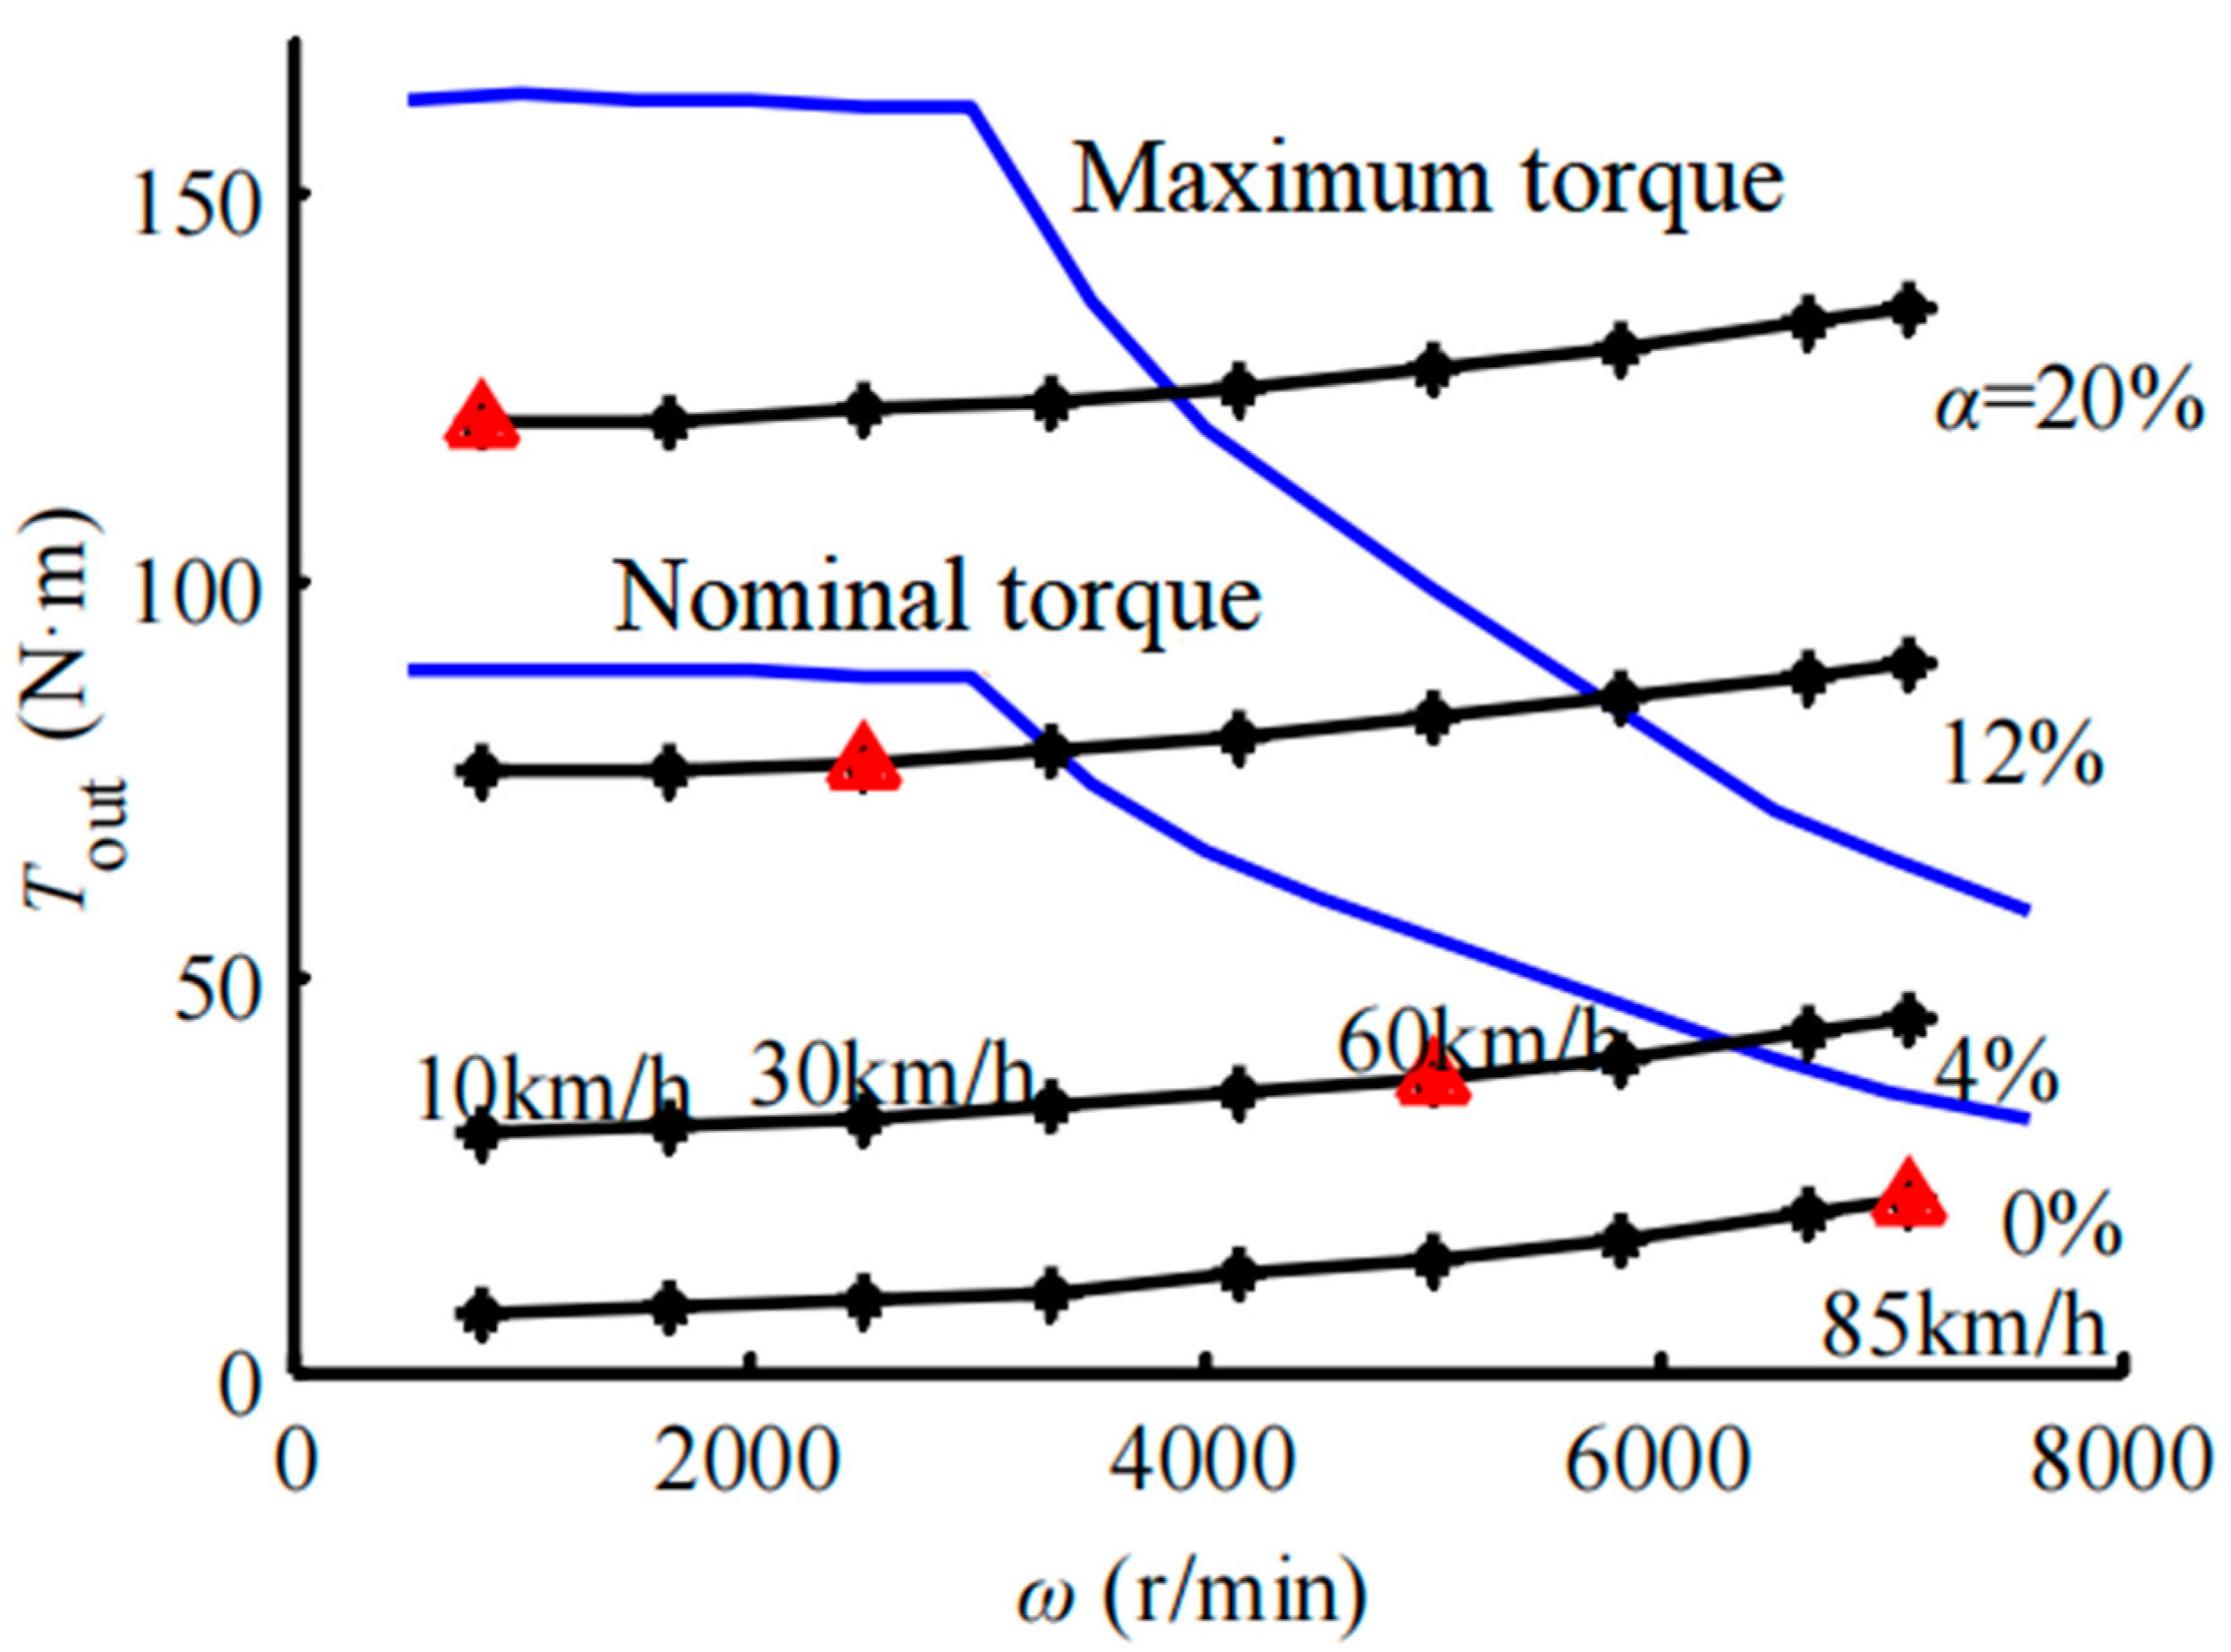
The vehicle dynamics equation of Equation (3) is usually expressed as the F-v diagram, but in the process of system matching, it is more convenient to express it through the T-ω diagram of the motor (Figure 4). This requires the following transformation:
{ T w = F d R i 0 i g η T ω = v i 0 i g R
Formula: Tm is the output torque of the motor; i0, and ig are the main deceleration ratio and the transmission deceleration ratio, respectively; ηT is the transmission efficiency of the transmission system; R is the wheel rolling radius; ω is the motor speed in rad/s; the motor speed is also represented by n, in rpm.
The maximum torque curve Tmax and rated torque curve Tmax,rate of the motor, which are usually expressed as a function of motor speed:
T m a x = T m a x ( ω )
T r a t e = T r a t e ( ω )

2.3.1. Maximum Speed Constraints and Climbing Performance Constraints

As shown in Figure 4, there are four vehicle cruise resistance curves at different slope angles (α = 0%, 4%, 12%, 20%). The (v,α) combination represented by the triangle in the figure corresponds to the top speed performance and climbing performance; for example, (60 km/h, 4%) corresponds to the climbing performance indicator “4% (60 km/h)” in Table 1 (approximately considered arctan (4%) ≈ 4%).
By determining whether the corresponding (v,α) combination is within the range of the maximum torque or rated speed constraint and speed constraint of the motor, we can determine whether the climbing performance index can be achieved. The constraint of climbing performance index on transmission ratio can be expressed as:
{ v c lim b i 0 i g R w ω m a x ( C D A v c h ρ v c lim b 2 2 + m 2 g f cos α c lim b + m 2 g f sin α c lim b ) R w i 0 i g η T T m a x ( v c lim b i 0 i g R w )
where: (vclimb,αclimb) is the combination of speed/slope angle corresponding to the climbing performance index; ωmax is the maximum speed of motor. The unit is rad/s; ωmax = of motor A and B is 796 rad/s.
The highest performance index is similar to a special case of slope angle α = 0. The difference is that when examining the maximum speed performance index, the torque constraint condition uses the motor rated torque rather than the maximum torque. Therefore, the constraints of the maximum speed performance index can be expressed as:
{ v m a x i 0 i g R w ω m a x ( C D A v e h ρ v m a x 2 2 + m 2 g f ) R w i 0 i g η T T r a t e ( v m a x i 0 i g R w )
where vmax is the maximum speed index.

2.3.2. Accelerated Performance Constraints

The time required for the vehicle to accelerate on the flat ground can be expressed as:
T v 1 v 2 = v 1 v 2 m 1 d v T o u t i 0 i g η T R w C D A v e h ρ v 2 2 m 2 g f
The constraints of the accelerated performance index can be expressed as:
T v 1 v 2 T t a g , v 1 v 2
where Ttagv1v2 is the acceleration performance index of v1 to v2. The 0~50 km/h and 50~80 km/h acceleration time T050(ig) and T5080(ig) curves under different transmission ratios are calculated by the formula, and the corresponding ig can be obtained.
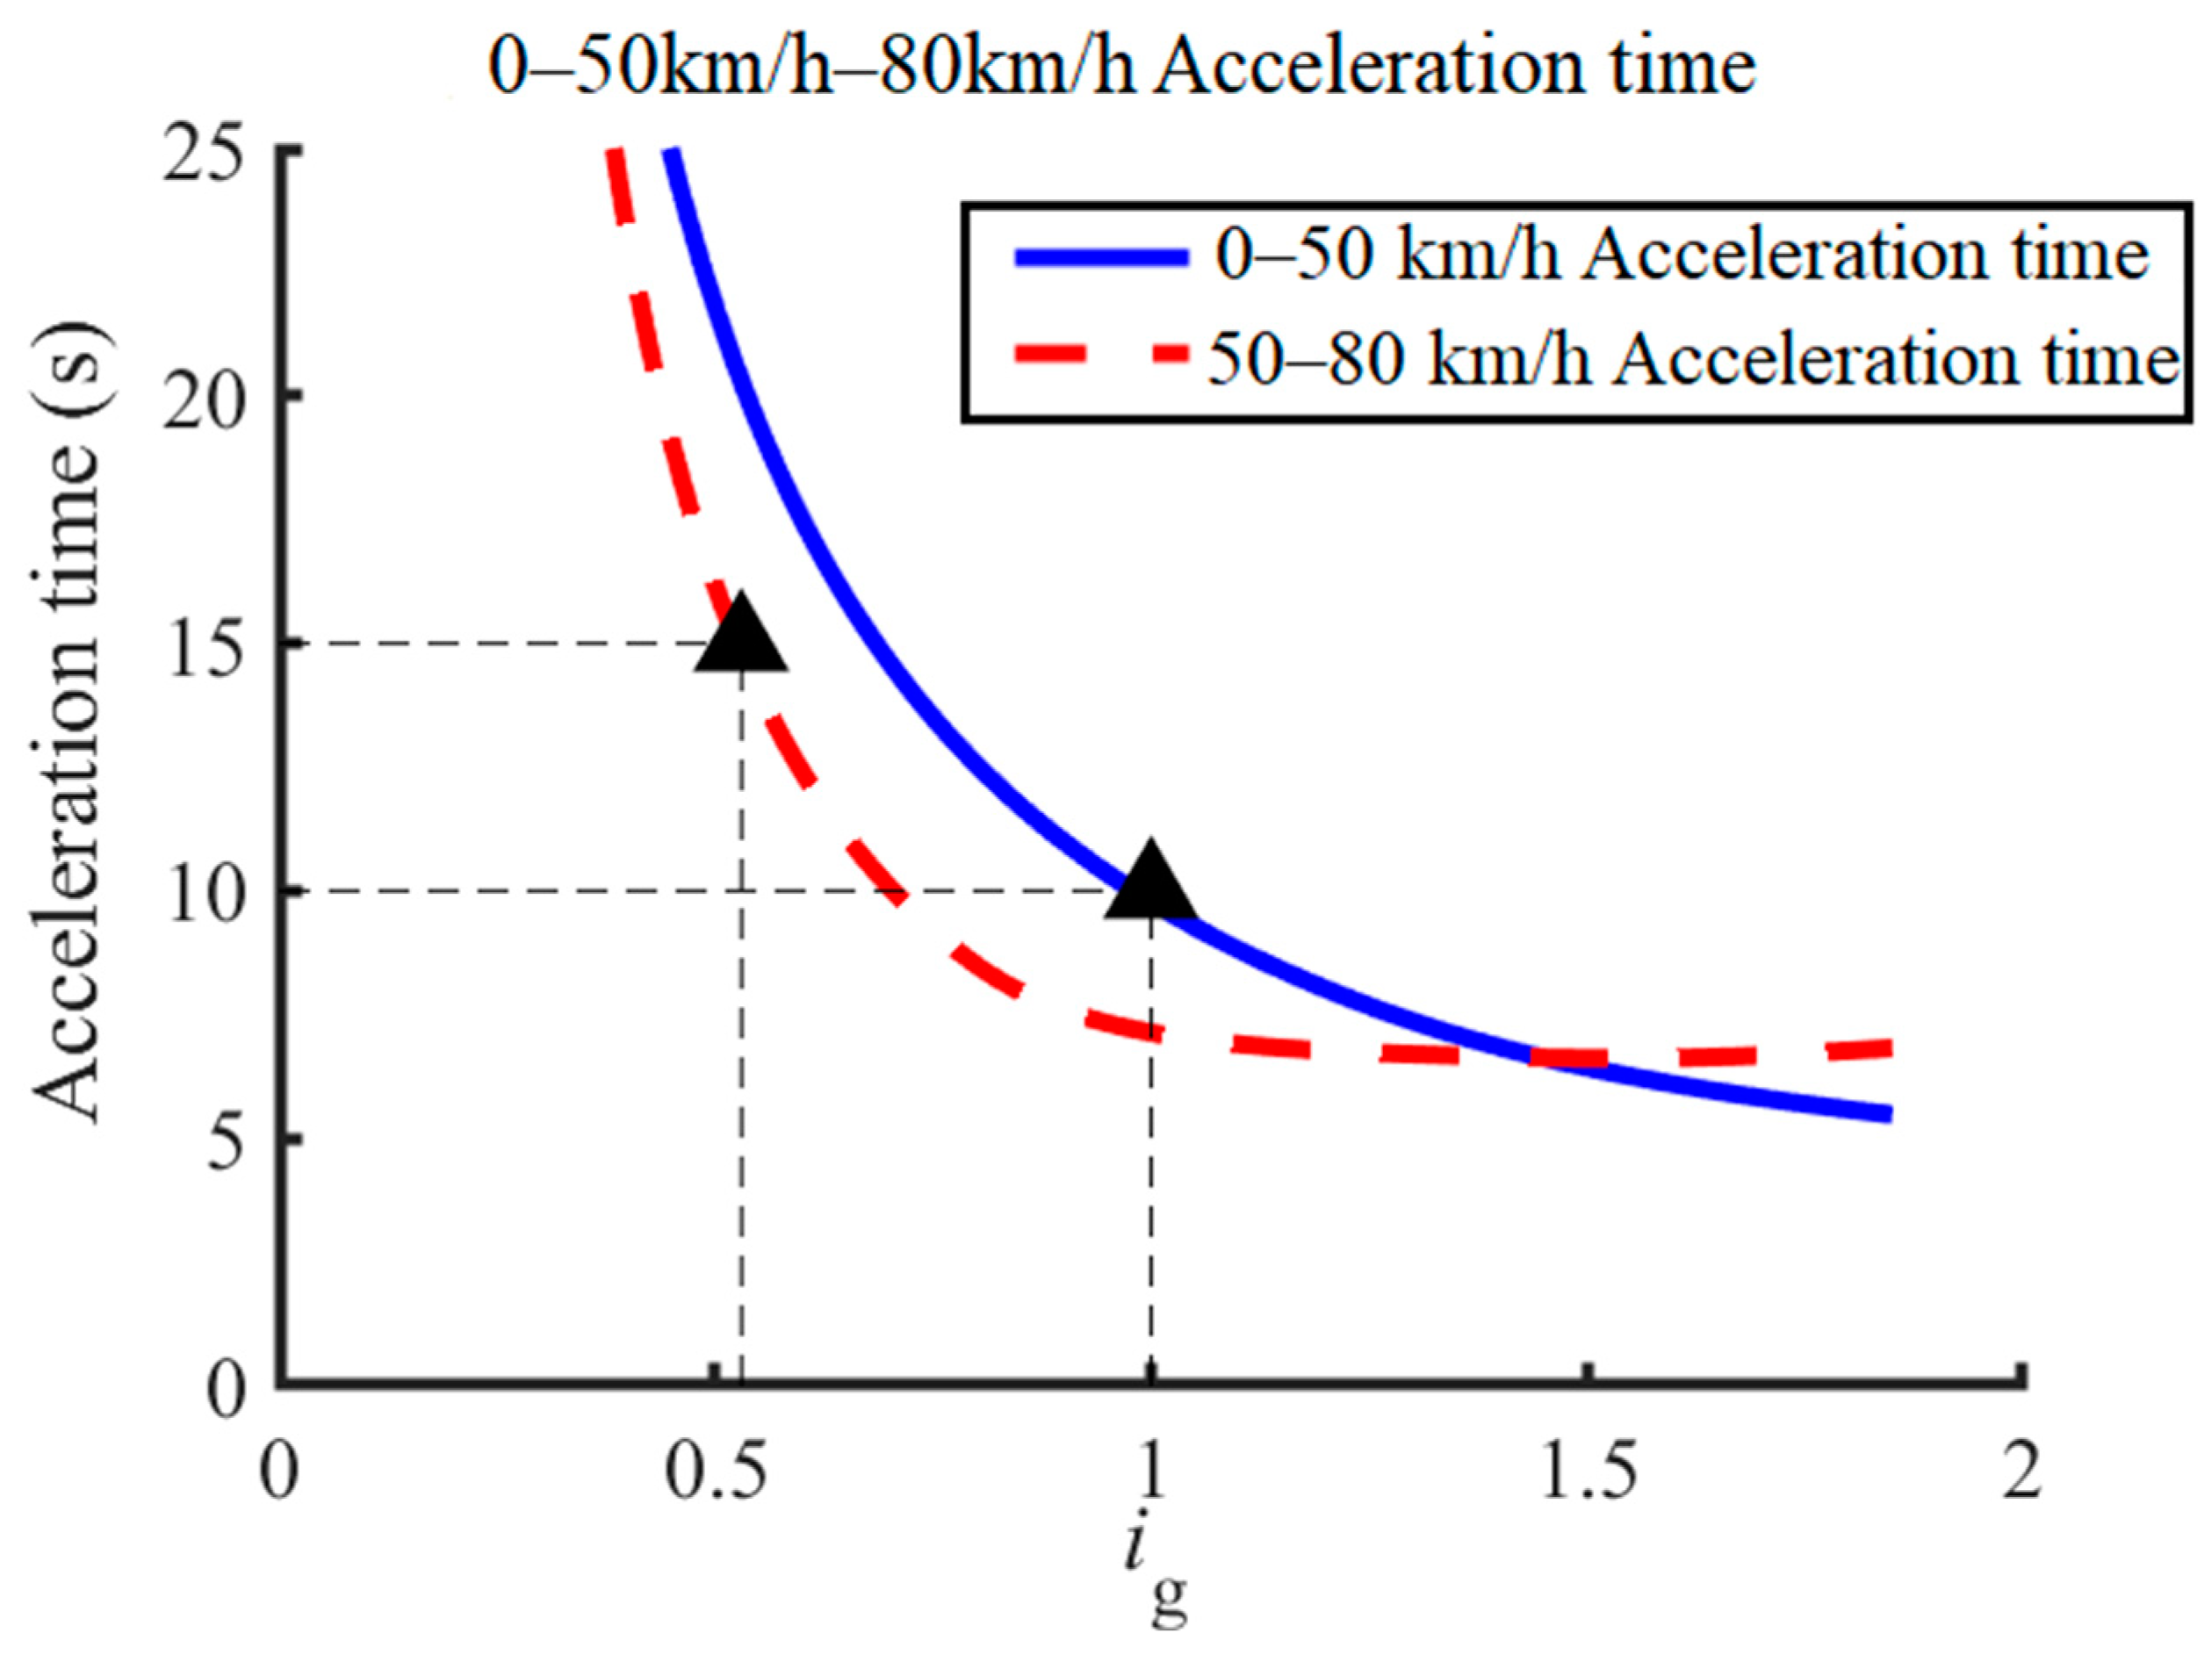
As shown in Figure 5, with the continuous increase of ig, the acceleration time of 0~50 km/h and 50~80 km/h gradually decreases, and the acceleration performance increases. The comprehensive analysis shows that when ig = 1.0~50 km/h acceleration is optimal, the acceleration time is 10 s; when ig = 0.53, 50~80 km/h acceleration is optimal, the acceleration time is 15 s.

2.3.3. Constraint Condition

Among the minimum performance indicators, including one top speed indicator, three climbing performance indicators and two acceleration performance indicators (Table 1) constitute the constraints on the transmission ratio, and the feasible field of transmission ratio under the constraint of each single index is recorded as:
S i = { i g | The   i g   that   meets   the   lowest   performance   index   i }
where the lower corner of the feasible domain Si i is the serial number of the individual index indicated in Table 1.
For the scheme of fixed transmission ratio transmission, the feasible domain of transmission ratio that meets the six individual indicators is:
S = i = 1 6 S i
For the two-gear transmission, the situation is more complicated. Define the set of individual performance indicators realized of gear I gear and II gear as M and N, respectively; then, the transmission ratio feasible fields of gear I gear and II gear are, respectively:
S I = i M S i
S II = i N S i
In order to meet the six individual minimum performance indicators, the sets M and N must meet:
M N = { 1 , 2 , 3 , 4 , 5 , 6 }

2.4. Parameter Optimization Method

A genetic algorithm is a computational model of biological evolutionary processes that simulate the natural selection and genetics mechanism of Darwinian biological evolution, and it is a method to search for optimal solutions by simulating natural evolutionary processes [45,46]. Its main characteristic is to operate on the structure object directly and there is no limitation of derivative and function continuity; it has inherent implicit parallelism and better global optimization ability. Using a probabilistic optimization method, it can automatically obtain and guide the optimized search space without determining rules, and adjust the search direction adaptively [47]. The optimization result variable is shown in Figure 6.
As shown in Figure 6, after several cross variations, the chromosome gradually tends to a trend or a point. The genetic algorithm starts with a population representing the possible potential solution set of the problem, while a population consists of a certain number of individuals that are genetically encoded [48]. Each individual is actually a chromosome with characteristic entities. As the main carrier of genetic material, that is, the collection of multiple genes, its internal performance (i.e., genotype) is a certain combination of genes, which determines the external performance of the individual shape. For example, the characteristics of black hair are determined by a certain combination of genes controlling this feature in the chromosome. Therefore, it is necessary to implement the mapping from the phenotype to the genotype. Due to the complexity of imitating gene coding, we tend to simplify, such as binary coding. After the first generation of population, according to the principles of survival of the fittest and evolution, generational evolution, according to the size of the problem domain of individual fitness selection and with the help of natural genetic operator combination cross and variation, produces a new solution set of population [49]. This process will lead to naturally evolved later populations being more adaptable than the previous ones, and the optimal individual in the last population being decoded as an approximate optimal solution to the problem [50].
At present, this paper takes multiple vehicle performance indicators such as maximum speed, acceleration speed and 100 km power consumption as the optimization target, and takes the transmission ratio as the optimization variable to establish the optimization problem of parameter matching, so as to improve the performance of pure electric vehicles to a certain extent.

2.5. Pareto Solution Set Solution Method

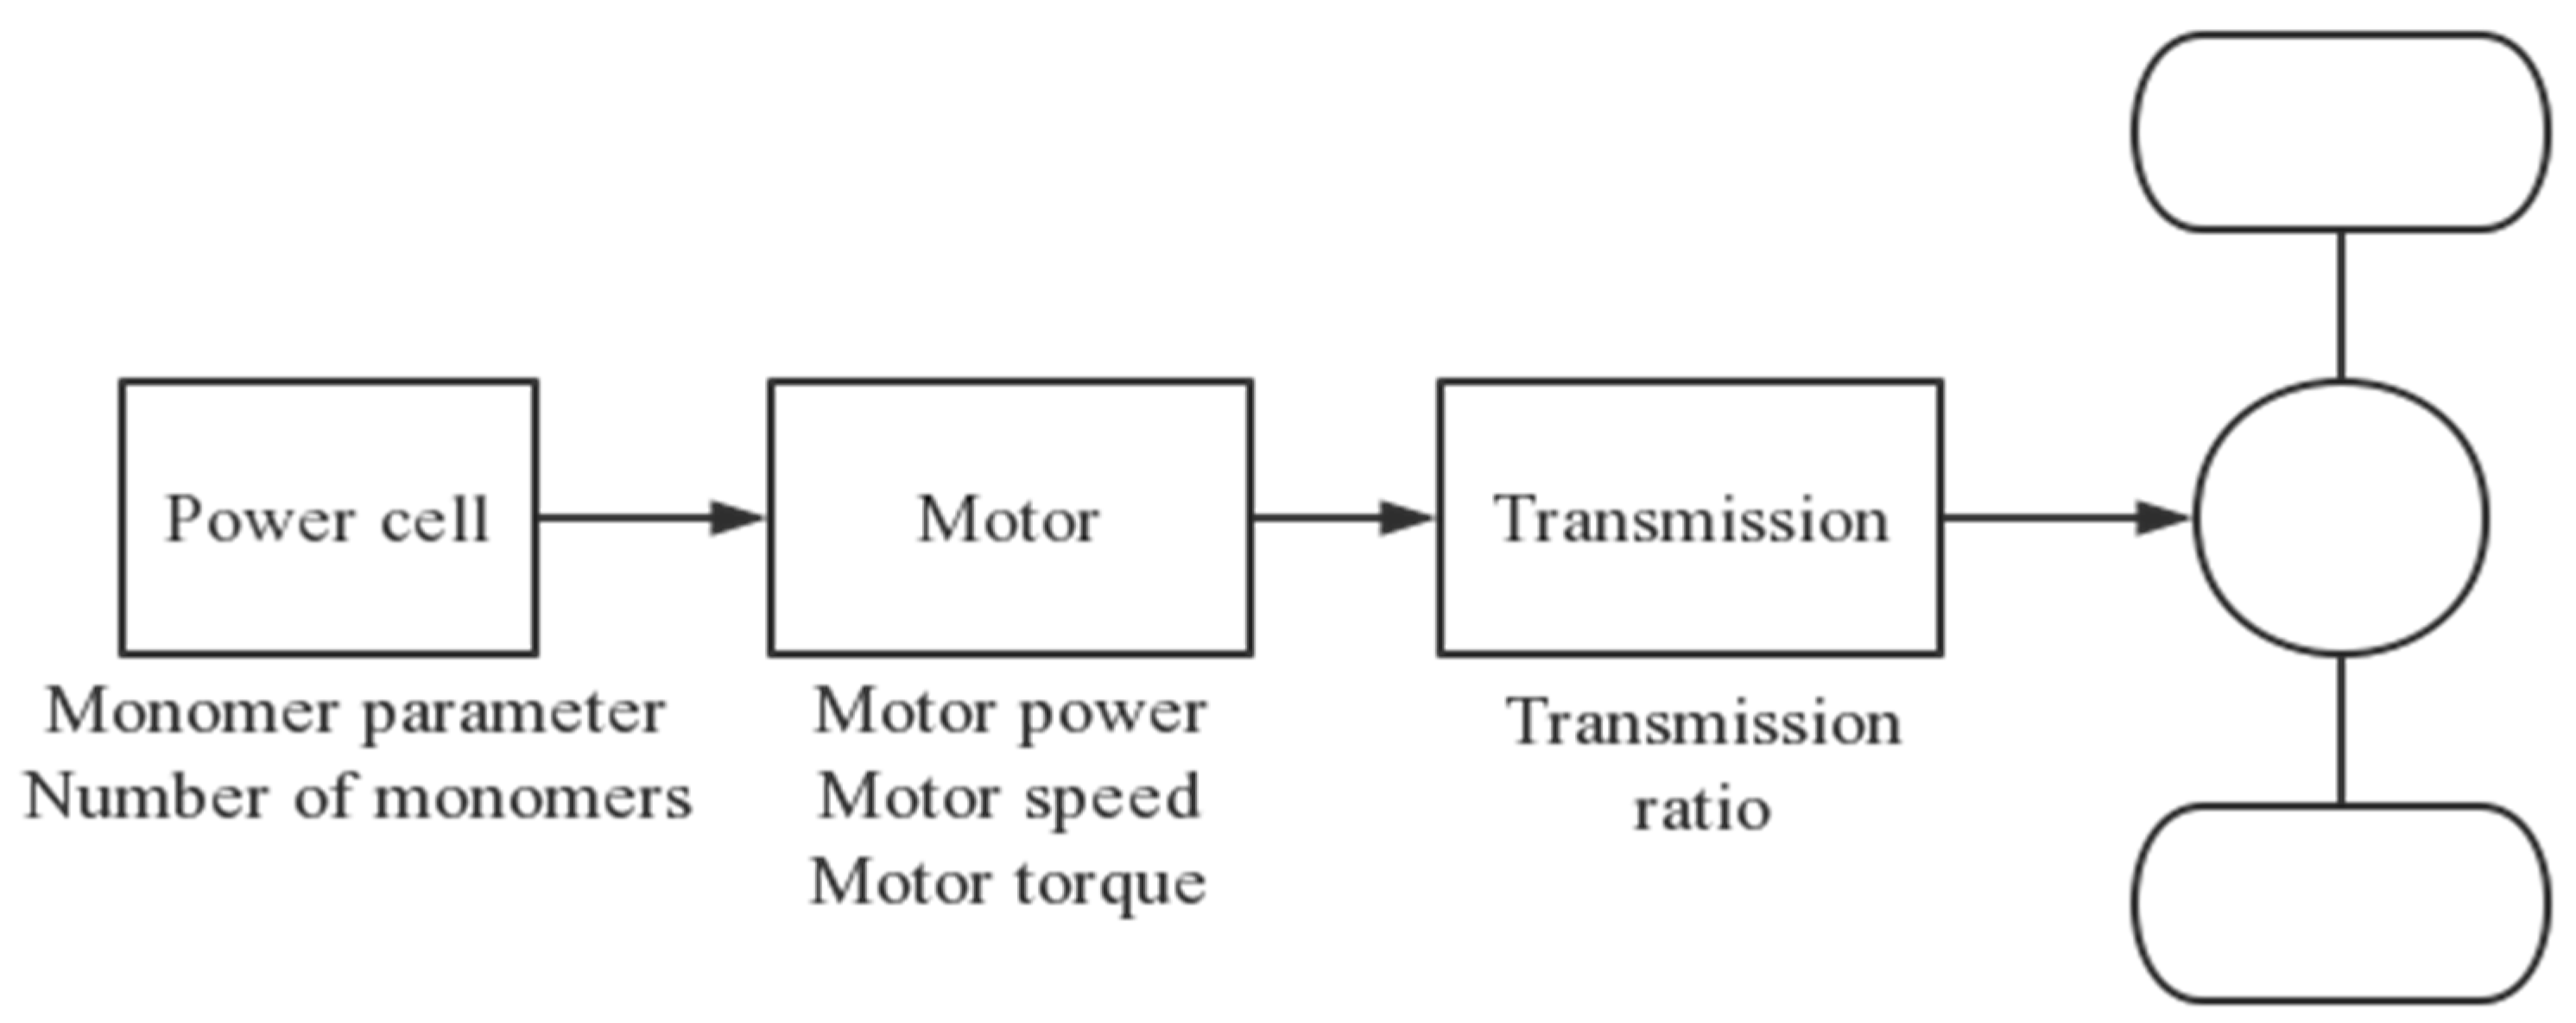
The power system of a battery electric vehicle has a unique energy source and power actuator, and the structure is relatively simple [19]. The structure of its dynamical system is shown in Figure 7. Parameter matching is conducted for the main links of the power system, including power battery, motor and transmission.
The parameters to be optimized of the power battery include the type and quantity of battery cell; the parameters to be optimized of transmission mainly refer to transmission ratio; the parameters to be optimized include maximum torque, rated torque, maximum speed, maximum power, etc. Therefore, in the process of parameter matching, only one parameter combination (that is, a certain type of motor) can be selected, rather than each motor parameter as an independent optimization variable.
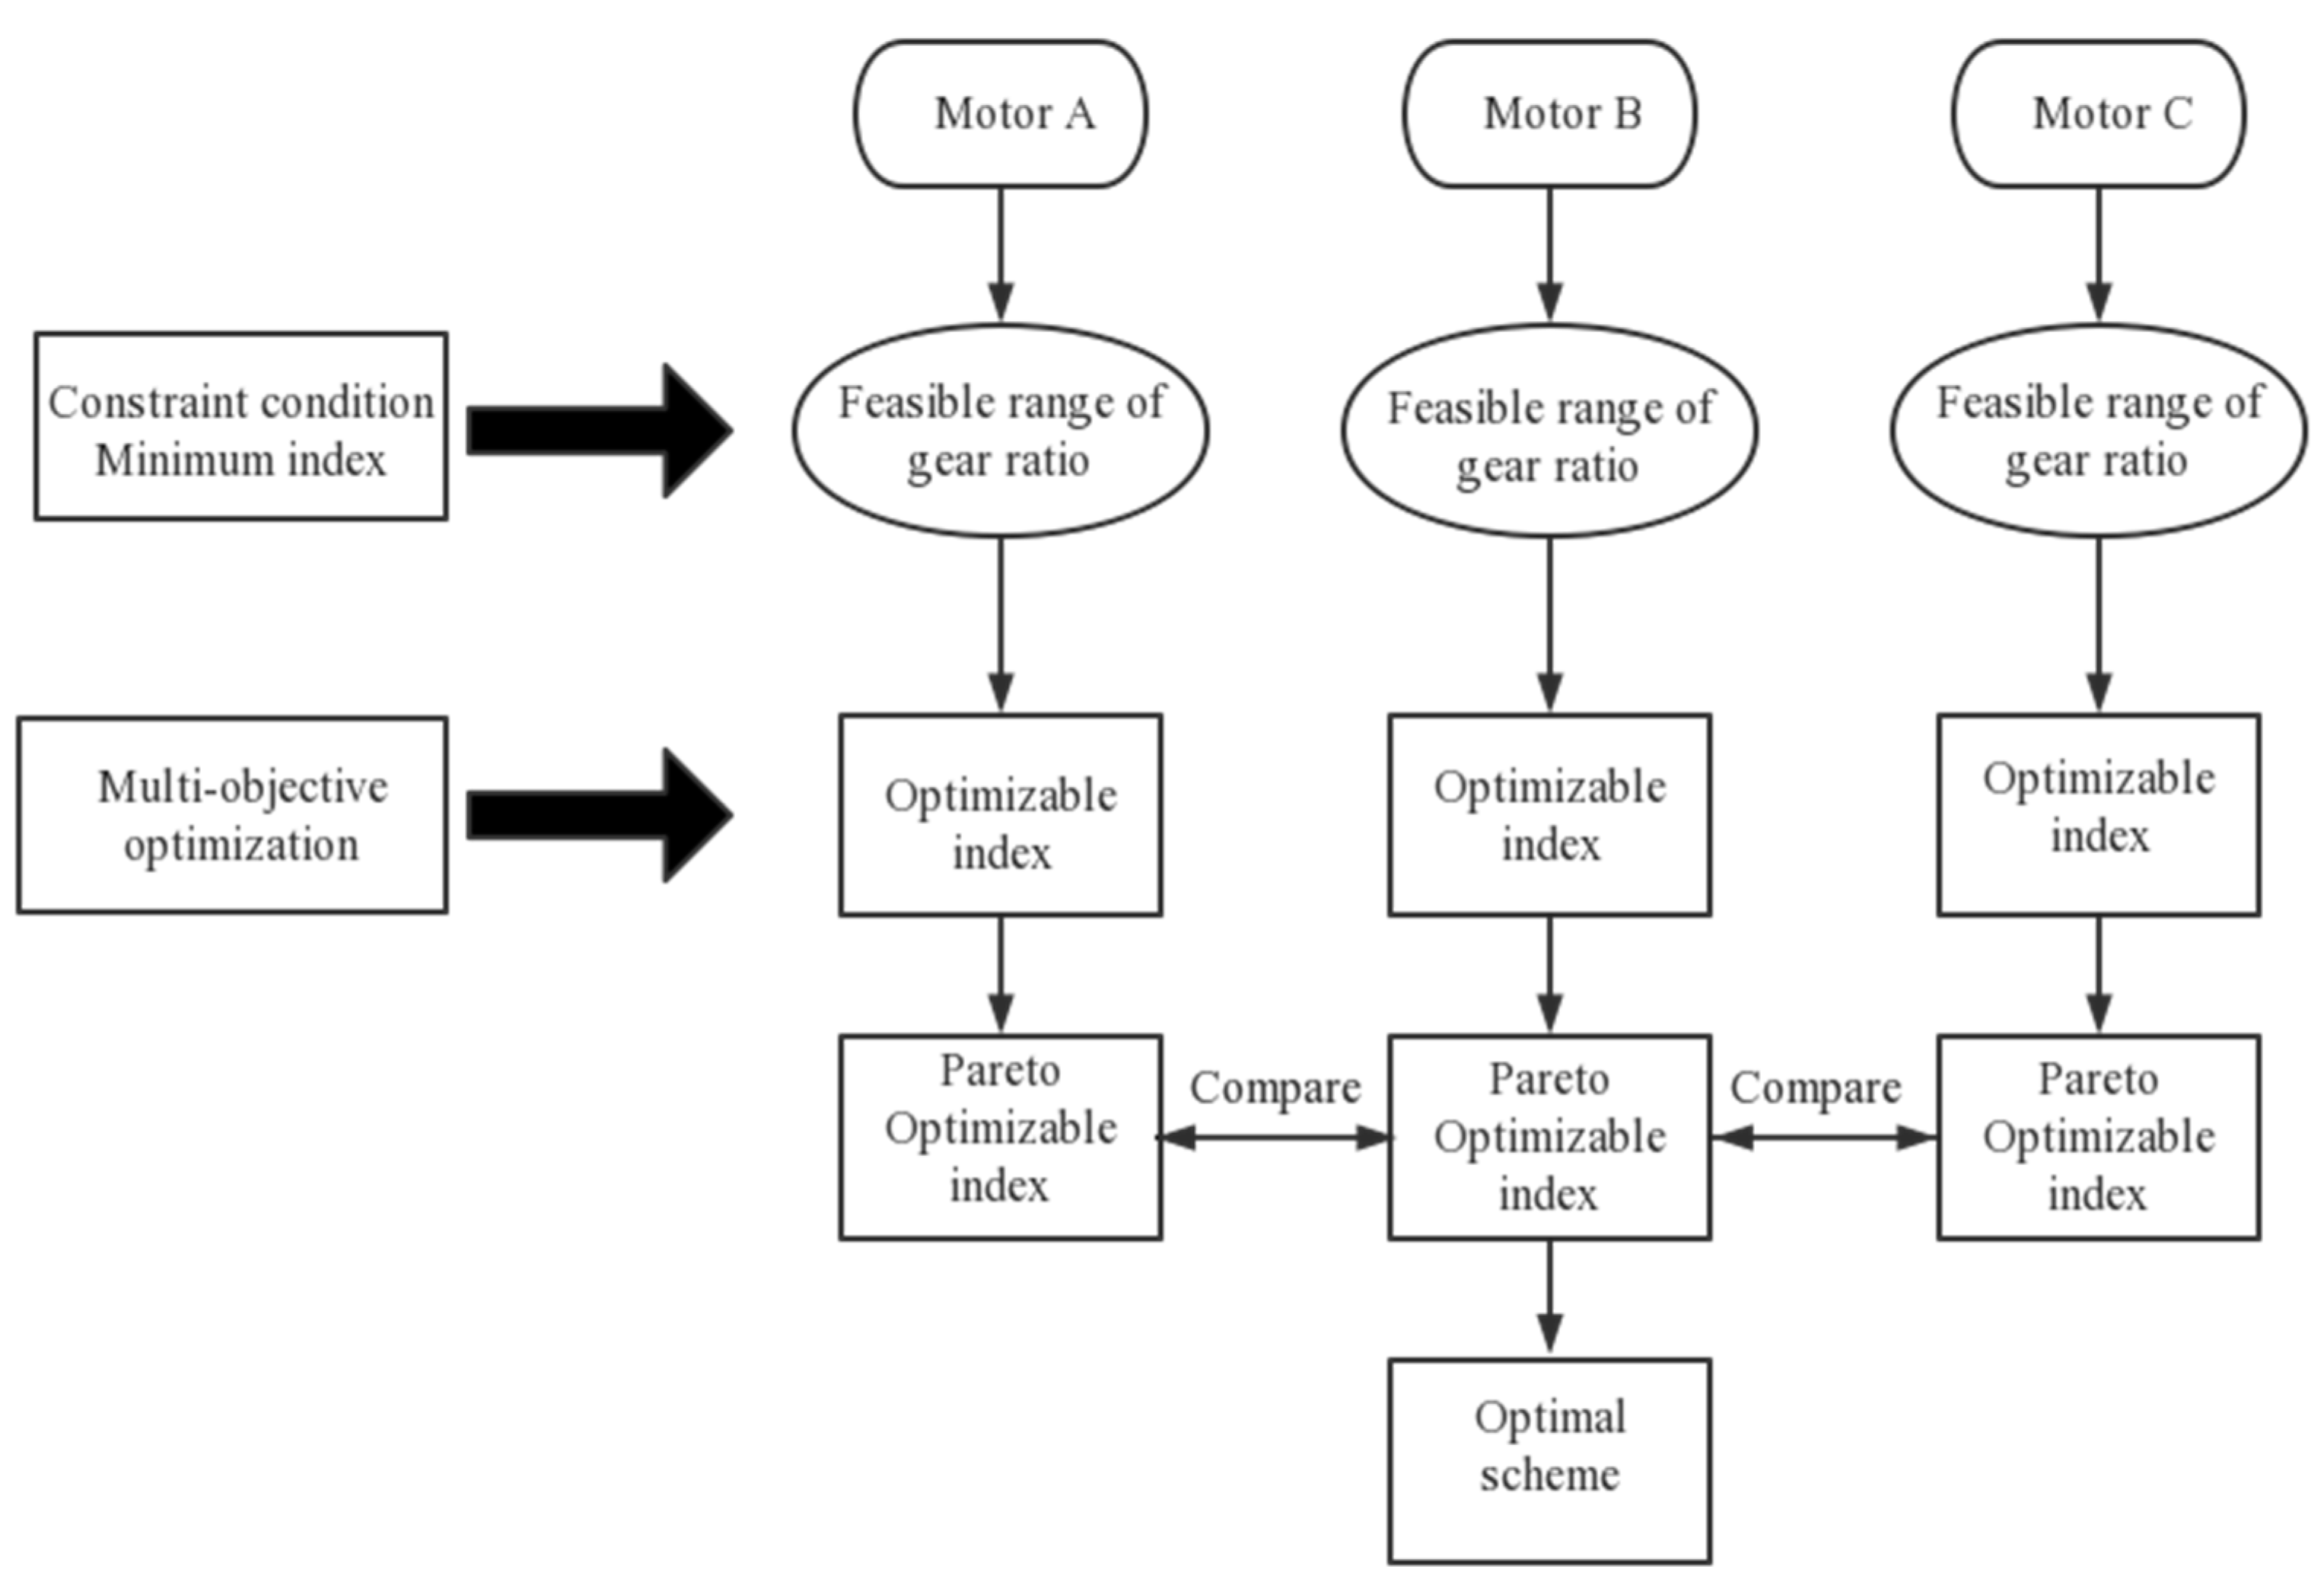
For this feature of the parameter matching problem, the research framework established in this study is shown in Figure 8 and is as follows. (1) First, take the transmission ratio as the optimization variable to construct the optimization problem of multiple optional motors. (2) Then, in the optimization problem corresponding to the specific motor, the minimum performance index of the vehicle determines the feasible domain of the optimization variable; then, in the feasible domain, perform multi-objective optimization of the optimized index to solve the set of alternative schemes. (3) Comprehensively compare the alternative schemes of different motors to determine the final parameter matching scheme.
Different motors are discrete optimization variables, and the transmission ratio is a continuous optimization variable. The parameter optimization design aims to solve the optimal motor and transmission ratio combination. The parameter design optimization problem for each motor can be expressed as:
min J i g = [ J 1 ( i g ) , J 2 ( i g ) , , J p ( i t g ) ] s . t . i g S
J is the optimization target vector composed of P indicators to be optimized, J1, J2, … Jp. The ig is the optimization variable vector. For a fixed transmission ratio gearbox, ig has only one element (transmission ratio), corresponding to a single-variable multi-objective optimization problem; for a two-gear transmission, ig corresponds to two optimization variables, consisting of one-gear and two-gear transmission ratio [ig, 1, ig, 2], corresponding to a multi-variable multi-objective optimization problem. S is the feasible domain of optimization variables constrained by the lowest performance index.
The index J to be optimized has three significant features: (1) Due to the difference of model positioning, the designer chooses the optimization index with strong subjectivity; (2) Multiple indicators to be optimized compete with each other and it is difficult to achieve the optimal at the same time; (3) Different units between multiple indicators to be optimized are not suitable for single target optimization by weighting. J in this study consists of three indicators to be optimized, namely, maximum speed Vmax; 0–50 km acceleration time T050; power consumption per 100 km E100km. That is, J = [−Vmax, T050, E100km], and the negative sign before the maximum speed and Vmax means to maximize Vmax by minimizing −Vmax.
First, the Pareto optimal solution is defined: for the feasible solution ig*, when there is no other feasible solution ig in the feasible domain S, the following inequality holds:
{ J i ( i g ) J i ( i g * ) , i = 1 , 2 , , p J j ( i g ) J j ( i g * ) , j = { 1 , 2 , , p }
Then, the ig* is the optimal solution of the optimization problem [51,52]. Optimizable indicators are usually competitive with each other, so the corresponding optimization problem usually does not have the solution that makes all the optimization objectives optimal, but only the Pareto optimal solution. When improving any single index in the performance index realized by Pareto optimal solution, several other individual indexes must be reduced. Therefore, the Pareto optimal solution set is suitable as the set of alternative schemes.
The set of objective functions corresponding to the Pareto optimal solution set is usually called the Pareto front. For the parameter matching problem, the Pareto front describes the competitive relationship between multiple optimizable metrics [53,54]. Zhang et al. [55] proposed a mechanism of resetting weight vectors for MOEA/D to solve problems with discontinuous Pareto front. Sato et al. [56] proposed an inverse PBI decomposition method to effectively solve MOP with a convex Pareto front. In the use of genetic algorithms to solve the constrained multi-objective optimization problem, due to the various characteristics of the constrained multi-objective optimization problem, most of the algorithms cannot deal with it well, and the Pareto front can effectively balance the constraint satisfaction and the objective function optimization [54,57].

3. Results and Discussion

3.1. The Establishment of Optimization Indicators

For any particular motor A or motor B, any ig in the feasible domain S meets the minimum performance index requirements. However, individual indicators usually do not “exactly” meet the indicators, but most indicators will exceed the lowest indicators to varying degrees. The existing parameter matching studies usually do not compare the advantages and disadvantages between the feasible schemes, that is, they do not discuss the optimization of this part of the vehicle index beyond the minimum index.
As shown in Figure 9, in this paper, the maximum speed vmax; 0~50 km/h acceleration performance T050; 100 km power consumption E100km is selected as the optimization index to meet the lowest performance by comparing the optimization scheme under the lowest performance. In the optimization problem expressed in the formula, the objective function is:
J = ( v m a x , T 0 50 , E 100 km )
where the minus sign before the top speed vmax means to maximize vmax by minimizing −vmax.
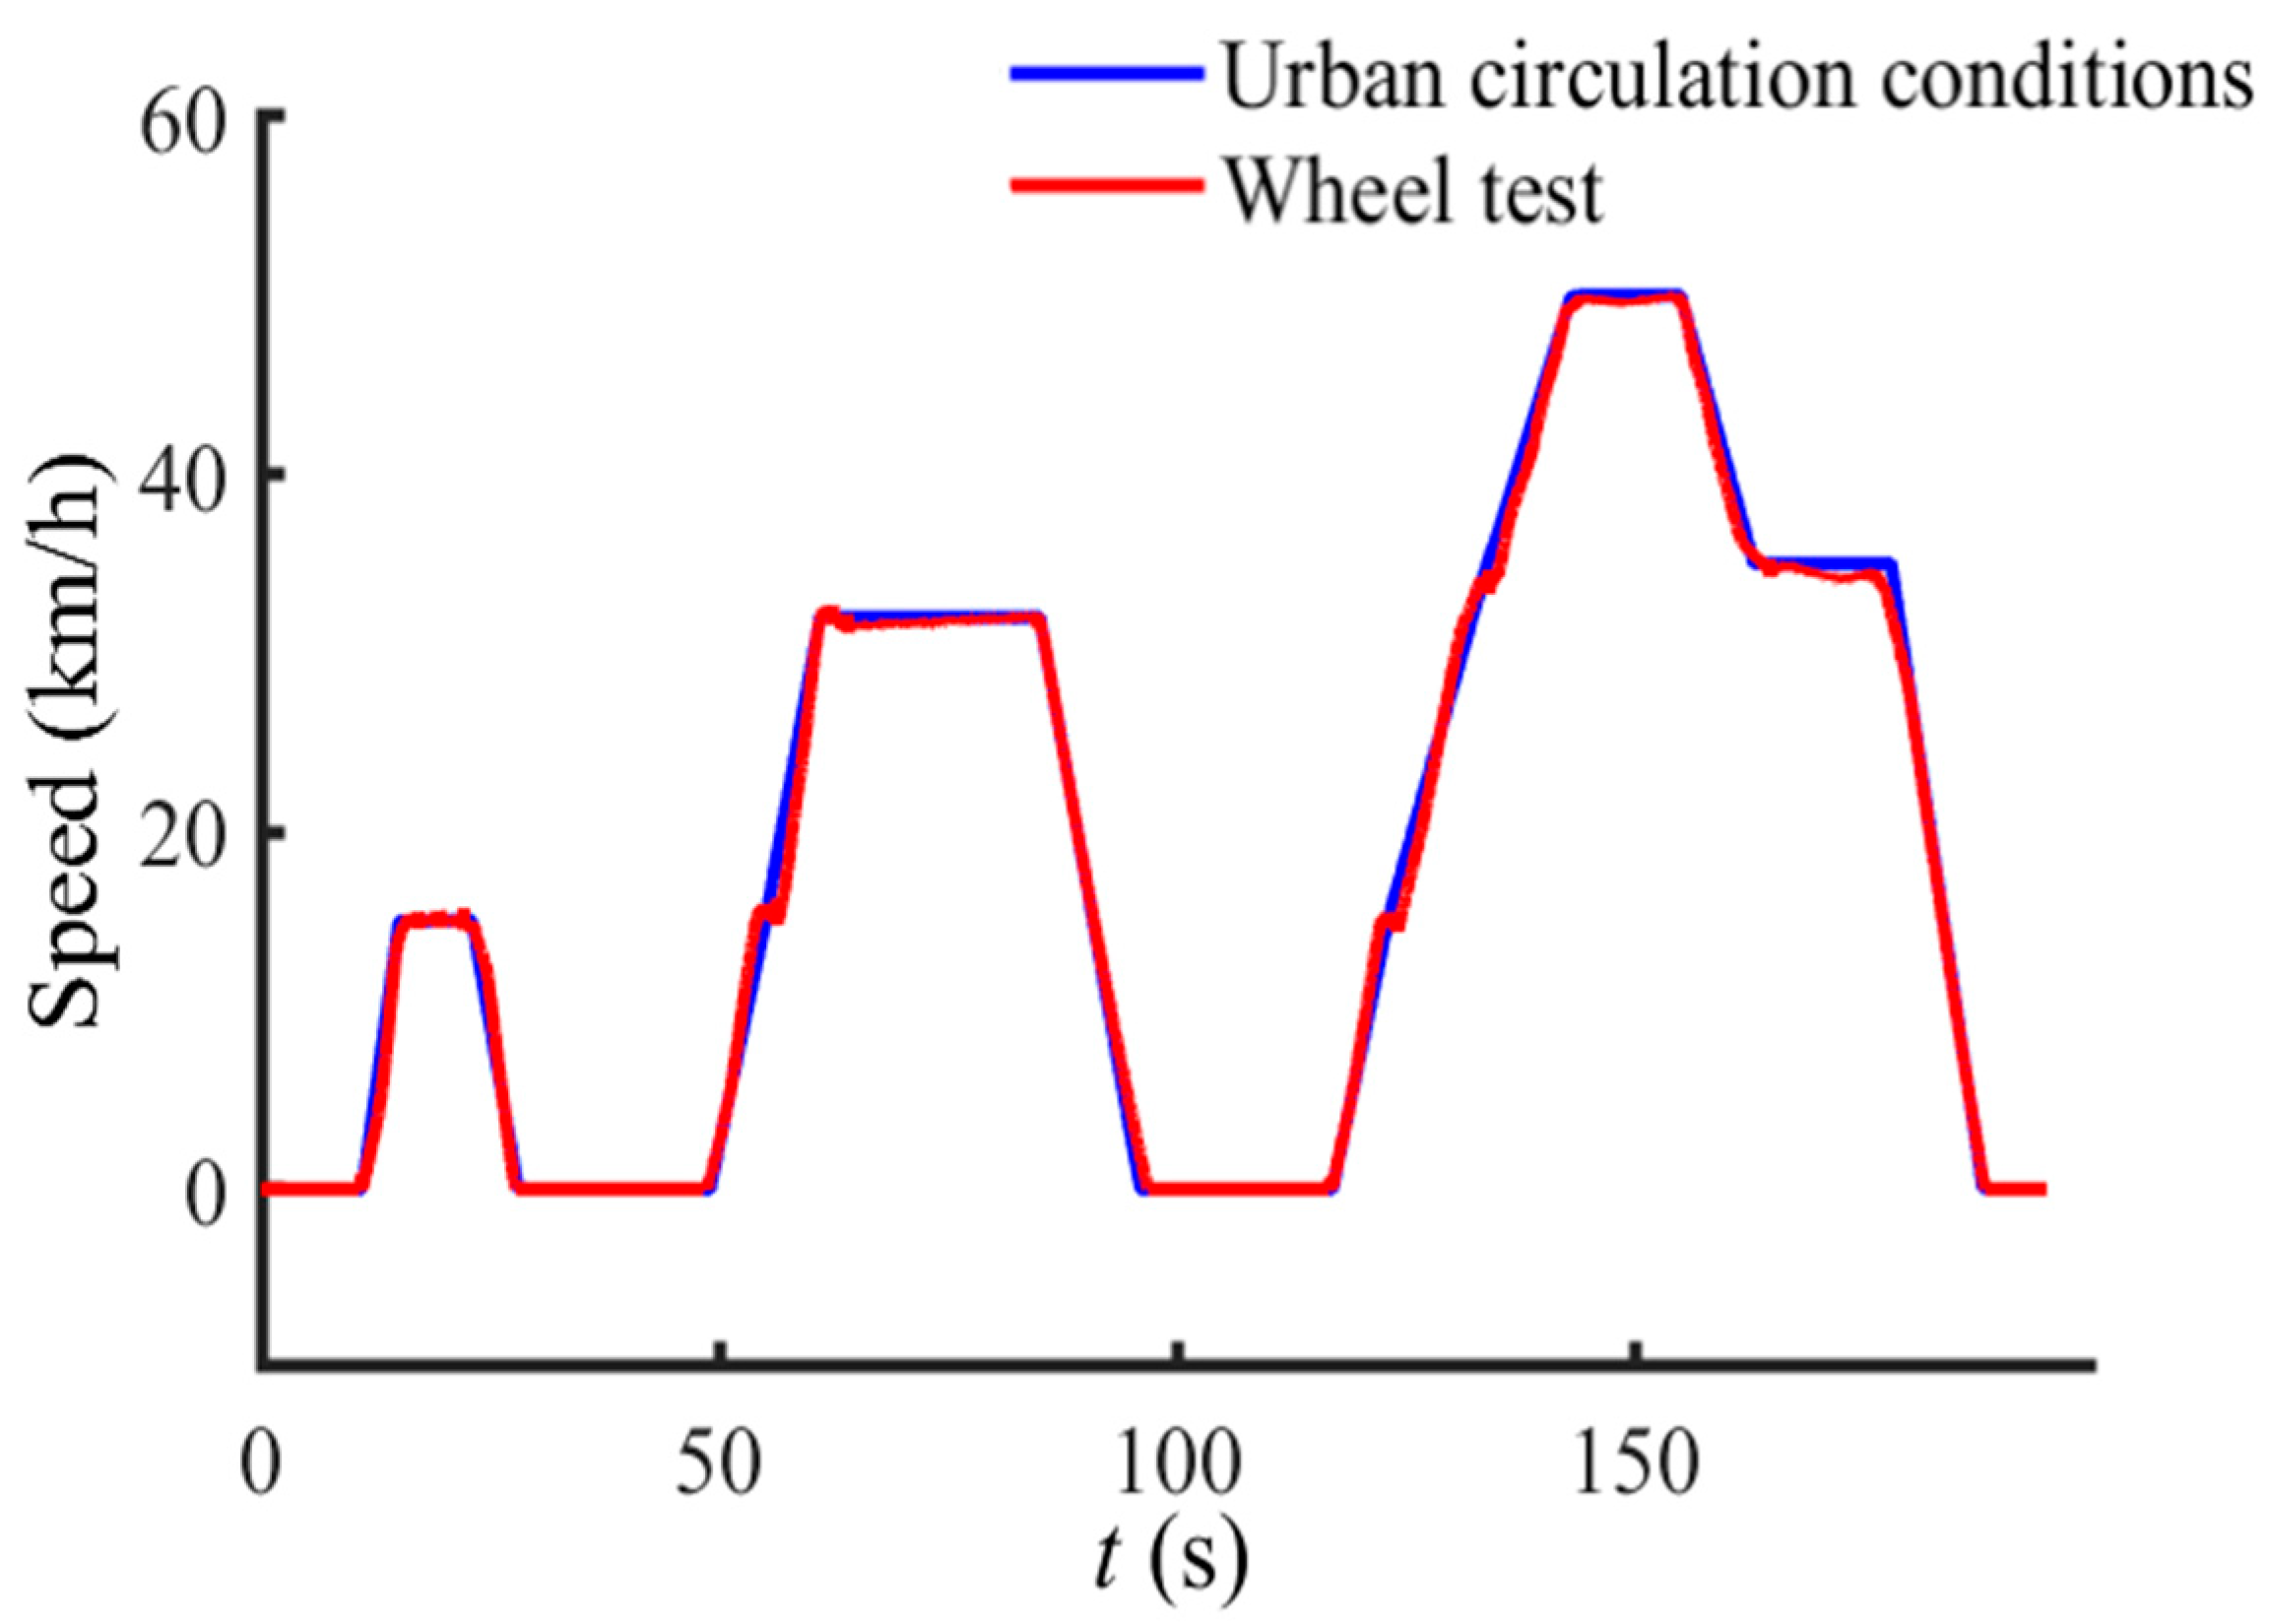
Hundreds of kilometers of electricity consumption E100km are determined according to the working condition method of GB/T 18386, including both the urban working conditions and the suburban working conditions. The maximum speed in the suburban working condition is 120 km/h, which greatly exceeds the minimum speed index by 85 km/h. Therefore, this study only calculates the power consumption of 100 km through the urban working condition (Figure 10).

3.2. Transmission Ratio and Gear Shift Logic

Transmission ratio matching is concerned with the total transmission ratio, that is, the product of the main deceleration ratio and the gearbox deceleration ratio. This study assumes that the main deceleration ratio i0 has been determined (Table 2), only the transmission speed ratio ig involves parameter matching, so that the effect is equivalent to the matching total transmission ratio. In the matching instance of this section, ig may be less than 1, and ig can be in a reasonable interval by adjusting the main deceleration ratio i0 after the matching is completed.
The shift logic needs to be considered when using a two-gear transmission. The effective working area of the motor is wide and the shift time is a large advantage of battery electric vehicles. In order to reflect this advantage, the required shift logic is as follows: (1) Use high speed gear II gear for testing the maximum speed index; (2) Use low speed gear I gear for 0~50 km/h acceleration performance index; Use gear I gear for the speed of 50 km/h; (3) Test the power consumption E100km of 100 km in gear I gear and II gears, respectively, and take the smaller value, while the shift is not allowed during the working condition test.

3.3. Determine the Feasible Domain of Transmission Ratio for Motor A and B

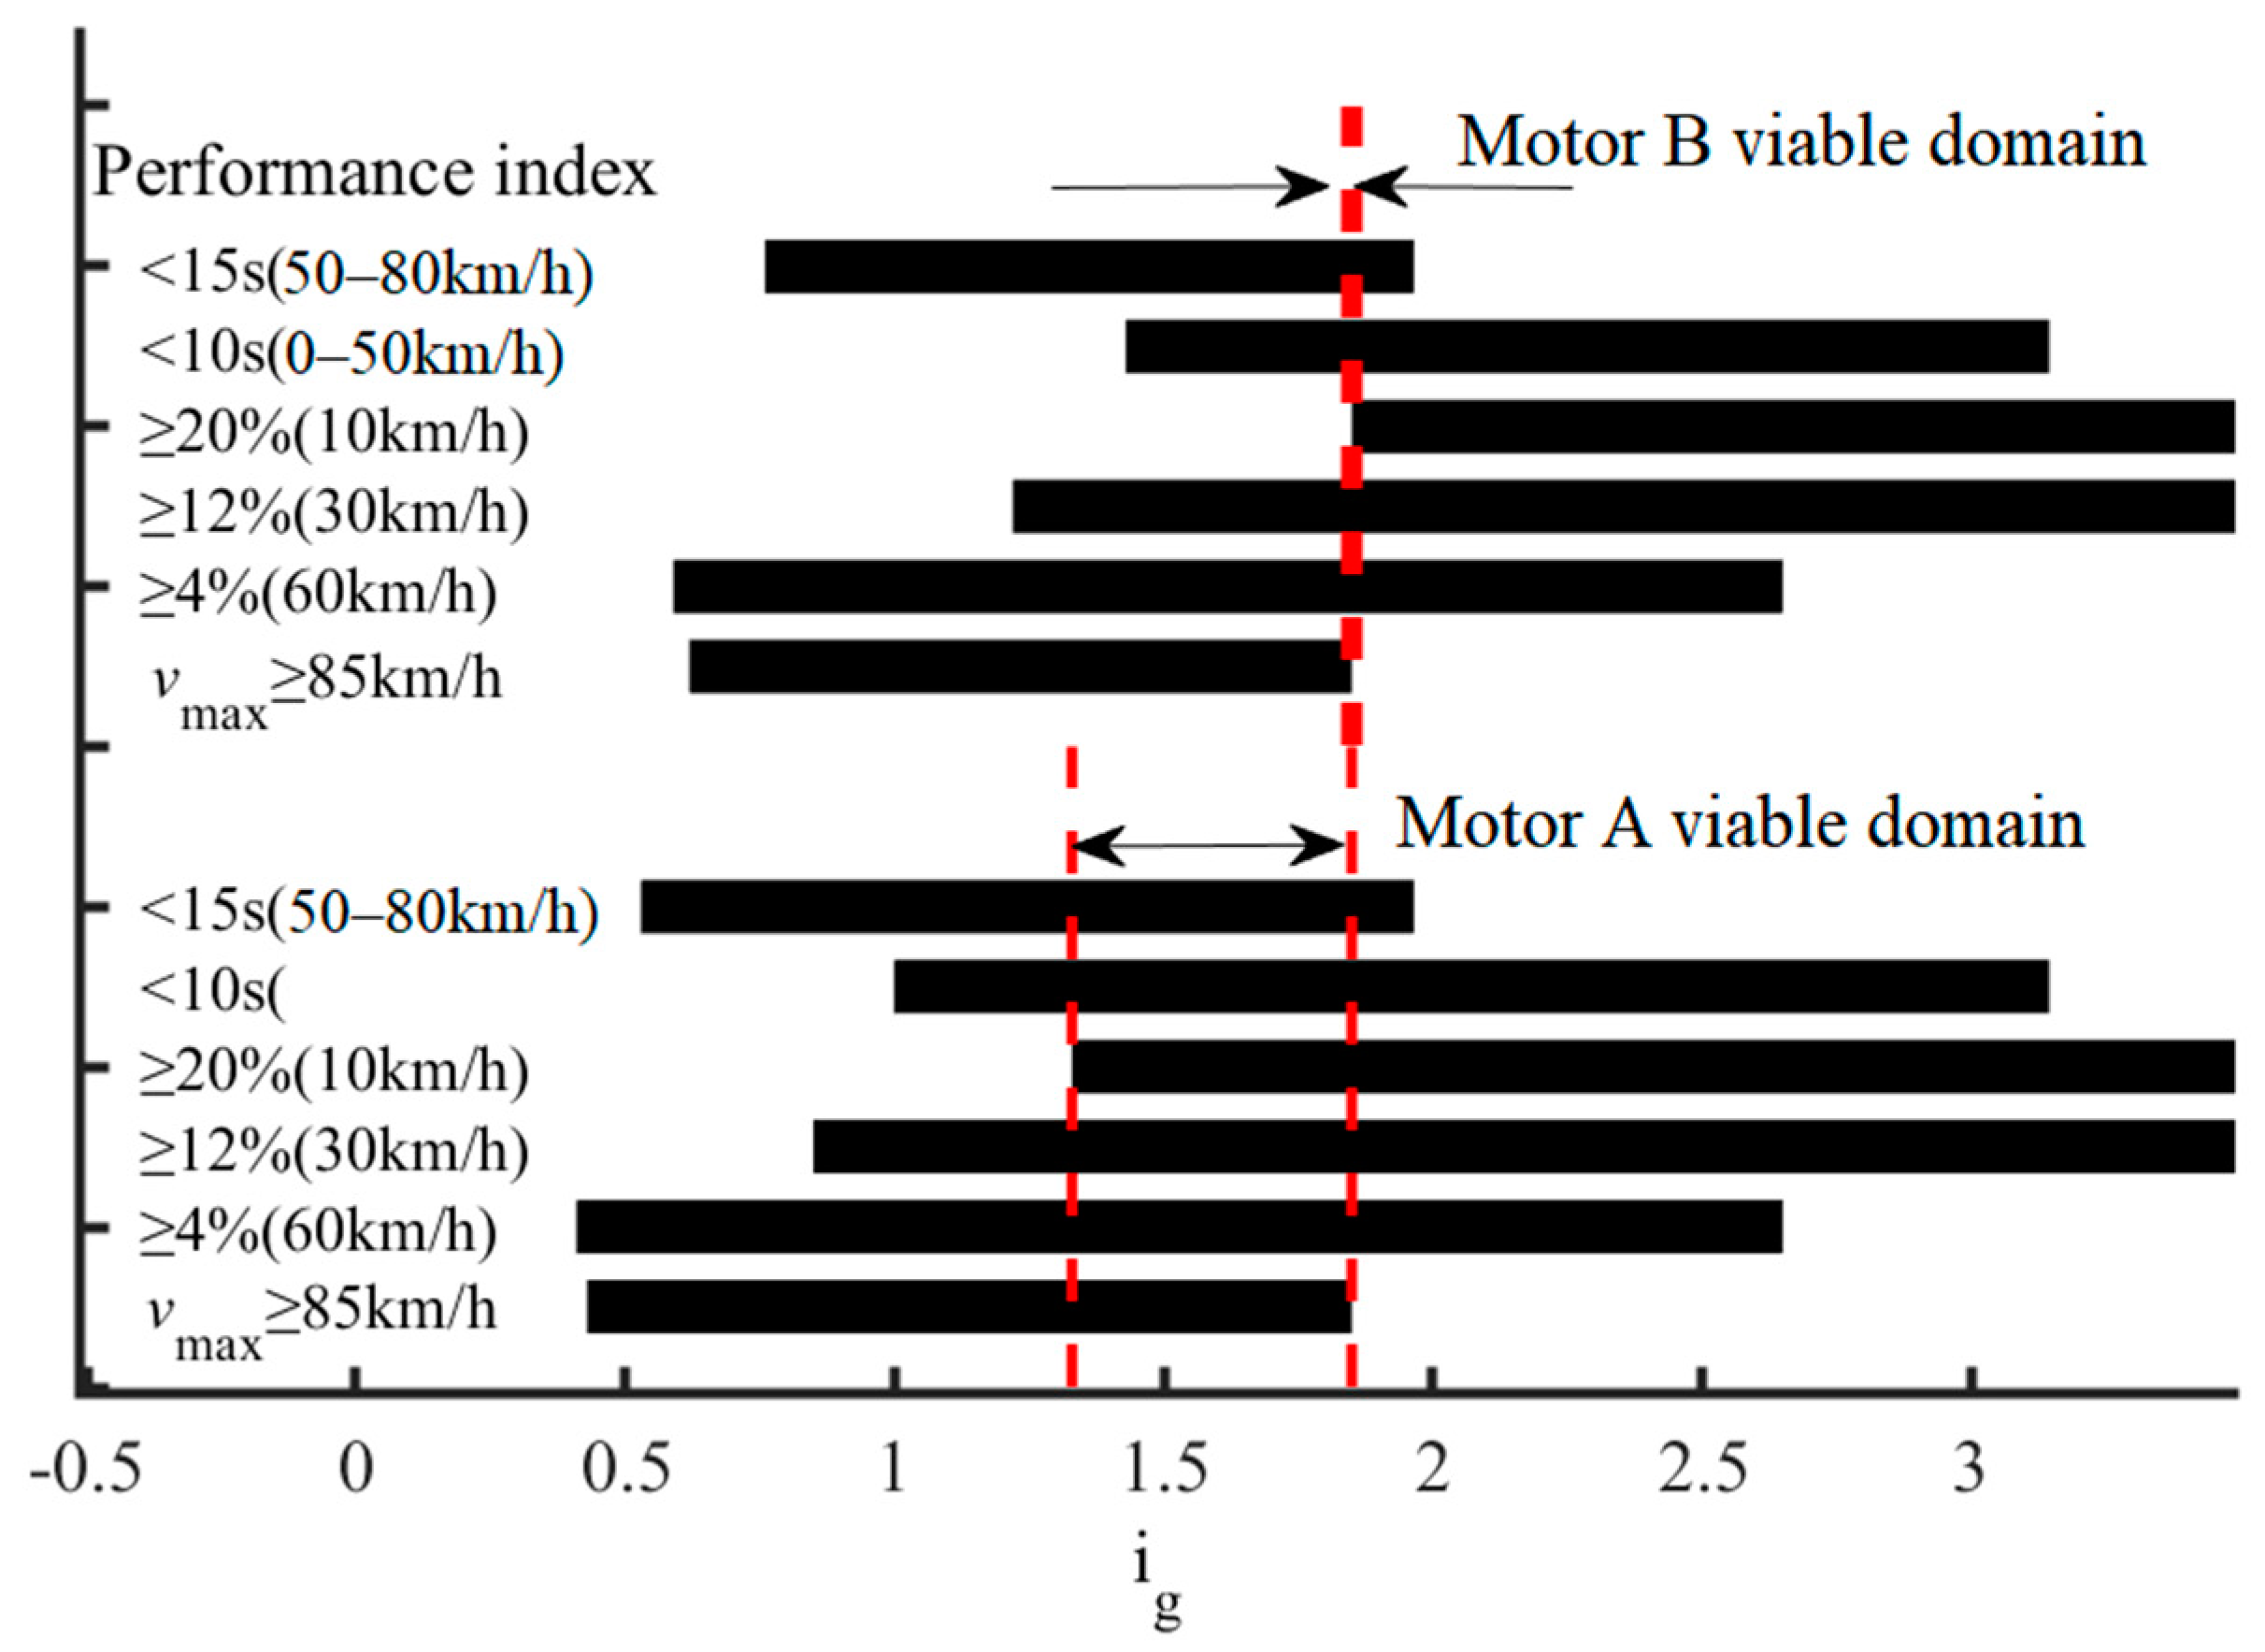
By solving the feasible domain of transmission ratio under the lowest index constraint, the solution results are summarized in Table 3.
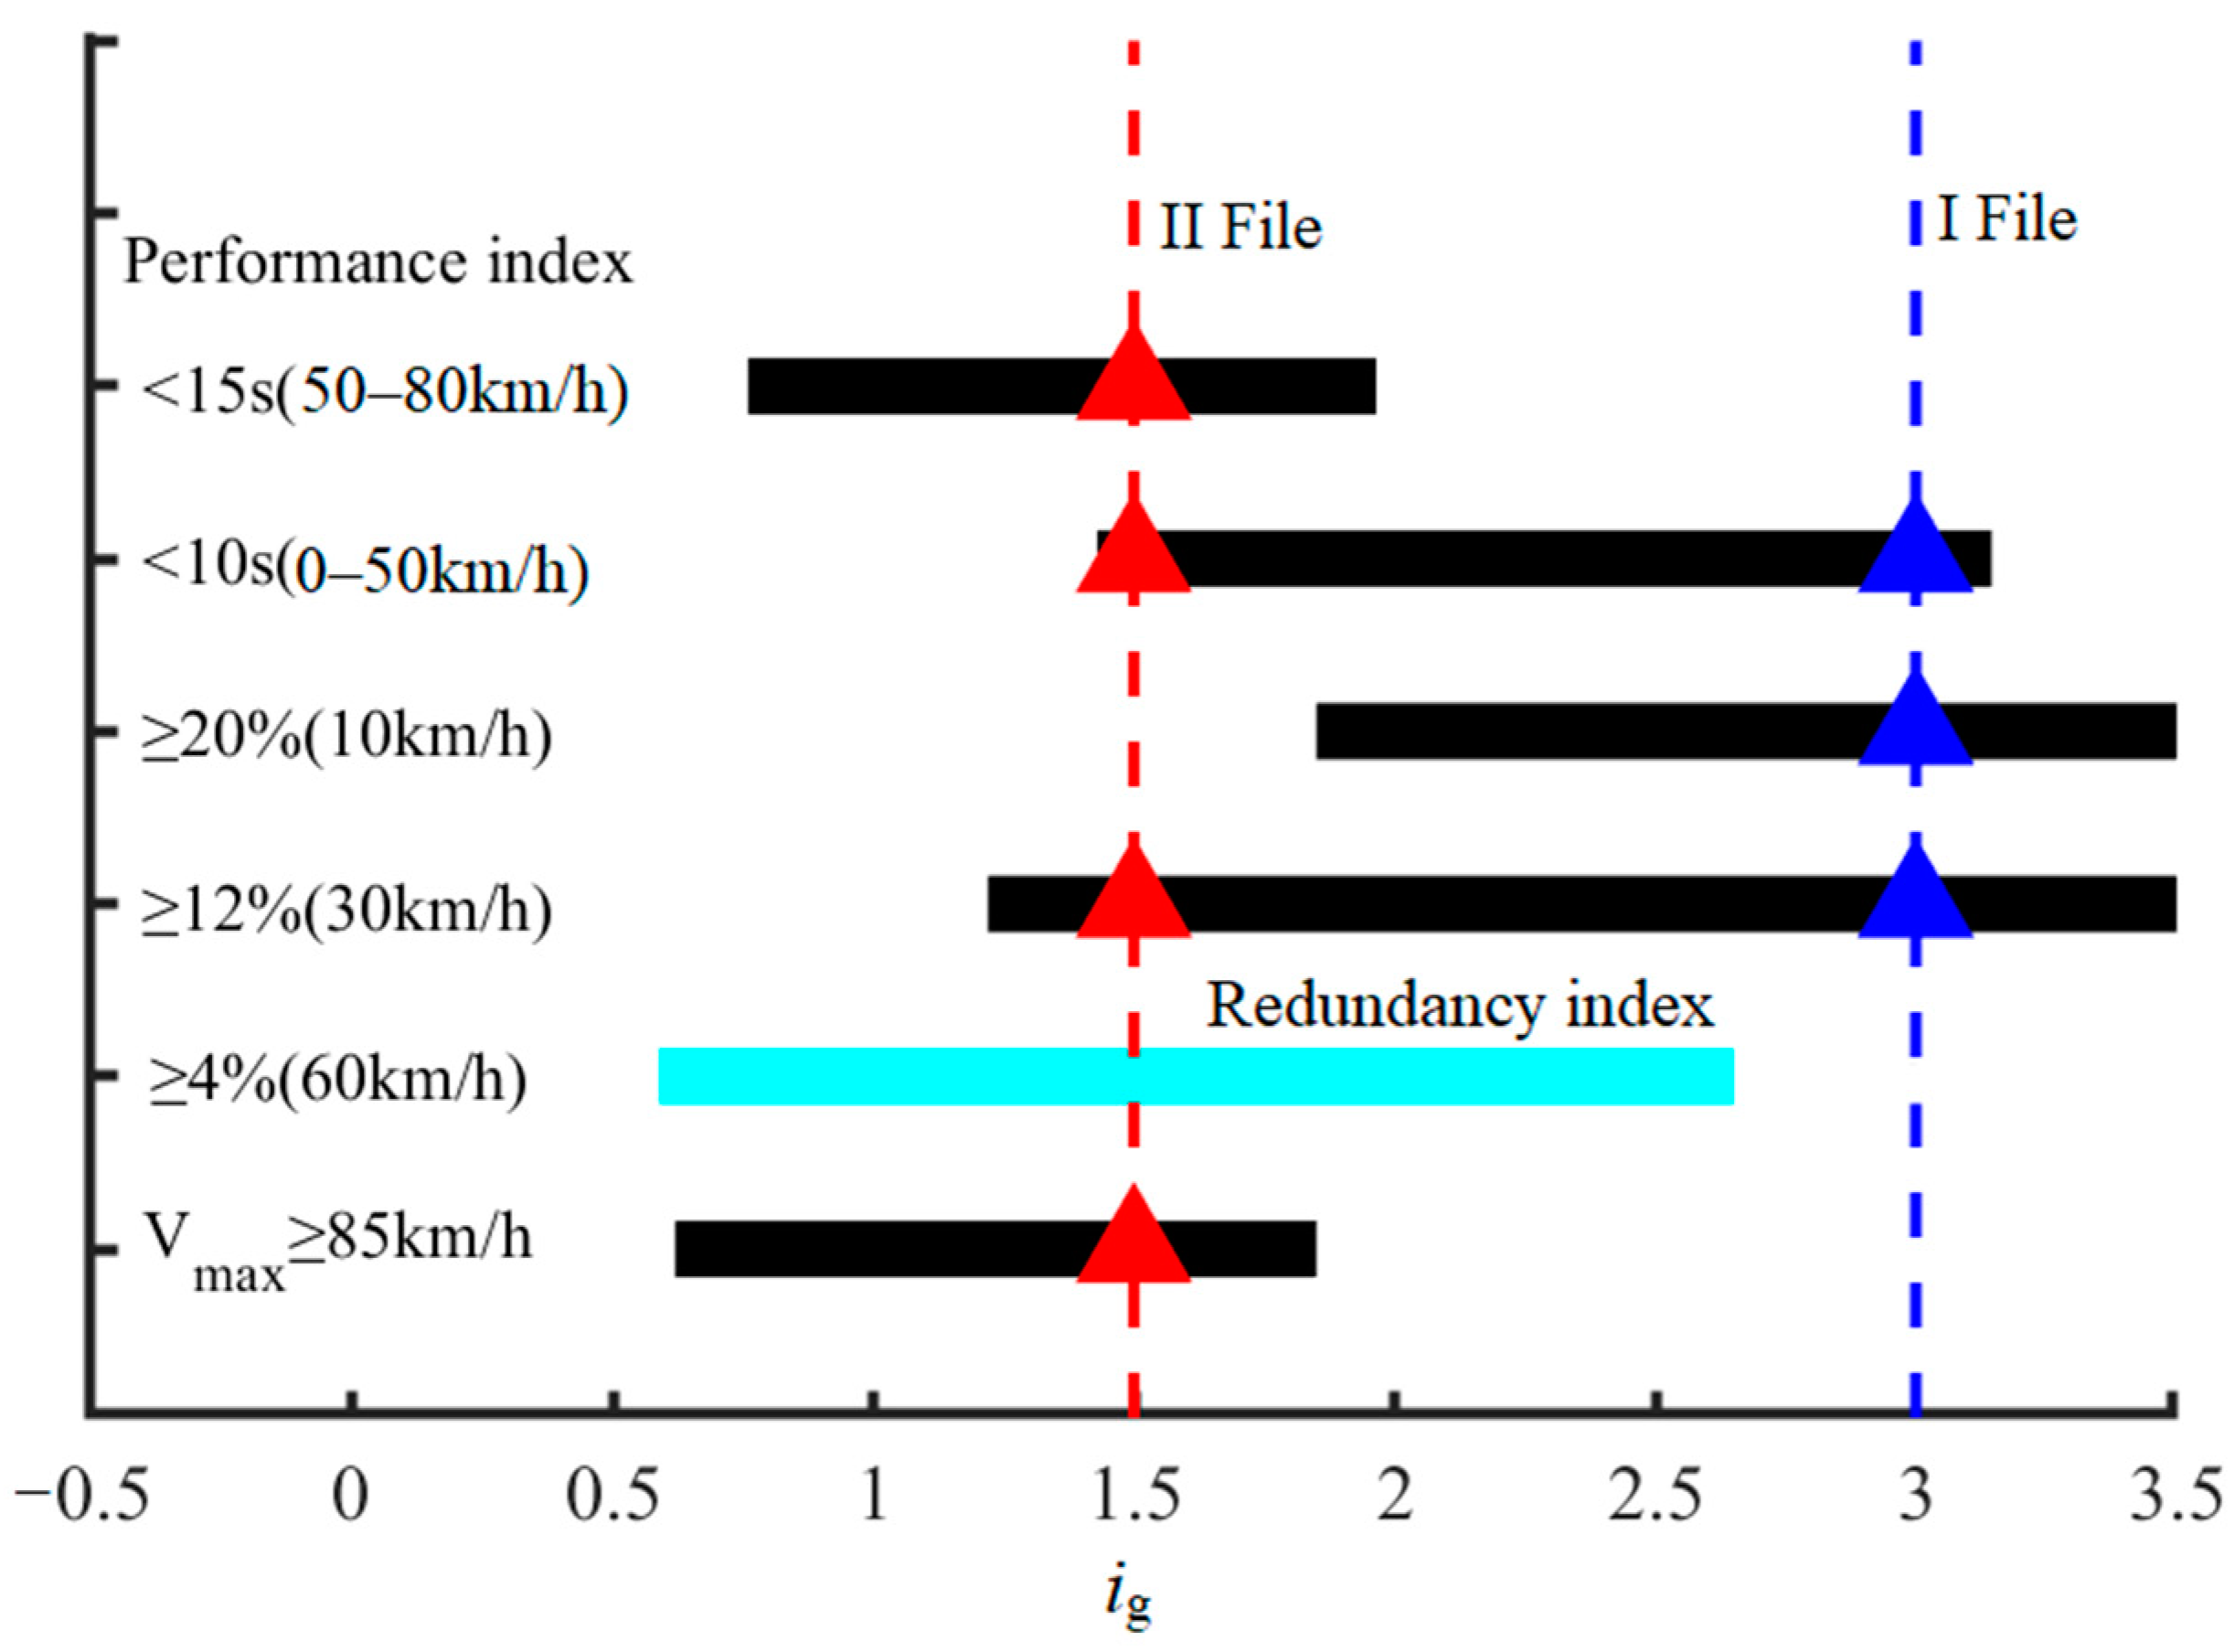
As shown in Table 3, the transmission ratio of motor A under maximum speed performance is 1.42; the transmission ratio of motor B is 1.23; the feasible range size of motor A is 2.24; the transmission ratio of motor B is 2.06; the feasibility ratio of motor A is 4.45, the transmission ratio of motor B is 4.45; the feasibility ratio of motor A is 14.67; the transmission ratio of motor B is 14.15. At 0–50 km/h acceleration, the feasibility ratio of motor A is 2.145, the transmission ratio of motor B is 2.145; 50–80 km/h, the feasibility range of motor A is 1.44 and the transmission ratio of motor B is 1.44. Through comparison, it can be found that the transmission ratio of motor A is 0.52, and the transmission ratio of motor B is 0. Therefore, motor A has a large feasible domain and has greater potential in the optimization process.
Figure 11 is a graphical expression of the feasible domain of the transmission ratio. In the case of using a fixed transmission ratio gearbox, the lower boundary of the transmission ratio feasible domain of motor A is determined by the climbing performance index “20% (10 km/h)” and the upper boundary is determined by the maximum speed index, and there is a wide enough range between the upper and lower boundaries to match the transmission ratio.
For motor B, the climbing performance index “20% (10 km/h)” and the highest speed index will limit the feasible domain limit to a very narrow range; the transmission ratio can only choose ig = 1.85. Therefore, motor B must use two-gear transmission in two-gear, respectively, different individual lowest index combinations M and N, so as to safely achieve the lowest performance index. Figure 12 shows an example of a gear selection scheme for a two-gear transmission.

3.4. Solving for the Multi-Objective Genetic Algorithm

Due to the discontinuity of the shift logic and the nonlinearity of the motor efficiency map diagram, the optimization problem expressed by the equation is a typical nonlinear multi-objective optimization problem, and the multi-objective genetic algorithm is an effective way to solve such problems. This section uses a multi-objective genetic algorithm to solve the parameter matching optimization problem in three scenarios, namely, (1) motor A + fixed transmission; (2) motor A + two-gear transmission; (3) motor B + two-gear transmission. The parameters of the multi-target genetic algorithm used in each scenario are shown in Table 4.

3.4.1. Motor A + Fixed Transmission Ratio Transmission

The Pareto front solved in scenario 1 is shown in Figure 13. Each point in the figure represents the combination of optimization indicators achieved by the most optimal solution of Pareto, describing the competitive relationship between the three optimizable indicators.
All solutions in the Pareto front are not dominated by solutions other than the Pareto front (and other solutions within the Pareto front curve), so these non-dominant solutions have fewer target conflicts than other solutions, and provide a better choice for the decision maker. However, it should be noted that while improving any objective function based on some non-dominant solution, it will inevitably weaken at least one other objective function.
For example, when the Pareto front moves down to the left along the upper arrow of Figure 13, the acceleration performance and 100 km power consumption performance increase but the top speed performance decreases; while moving in the direction of the lower arrow, the top speed performance and 100 km power consumption performance decrease and the acceleration performance increases.
A combination of three indicators from the Pareto front of Figure 13 is selected as the preferred scheme. The preferred scheme can realize the combination of “fast acceleration + low power consumption”, but it is difficult to take into account the maximum speed index.
Different designers may choose different preferred schemes, but necessarily in the Pareto front. Otherwise, at least one single indicator in the designed non-Parato front index combination can be improved without lowering the other indicators.

3.4.2. Motor A + 2-Gear Transmission

Figure 14 is the Pareto front solved under scenario 2. A, B and C are located on the front of Pareto as Pareto optimal solutions, but there is no dominant one or dominant relationship between the three; if there are multiple Pareto optimal solutions for a multi-objective optimization problem, multi-direction and global search can be realized by maintaining the population between generations and generations, solving the Pareto optimal solution in multi-objective optimization problem.
Compared to scenario 1, the overall acceleration performance in the Pareto front is greatly improved, and the combination of maximum speed indicators can be achieved. For example, area A in Figure 14 is A, combination of “high speed + low power consumption”; B, area of “high speed + fast acceleration” and C, area of “fast acceleration + low power consumption”.
Map a point on the Pareto front in Figure 14 of the indicator coordinate map to the variable coordinate map to obtain Figure 14. Move the Pareto optimal solution in Figure 15 to the right or down, lower each indicator without improving any single indicator and improve the acceleration performance indicator along with the 100 km and lower indicator. Thus, it can be explained that by moving the optimal Pareto solution in the neighborhood is impossible to improve one indicator without lowering other indicators. The multi-target genetic algorithm can eliminate the non-Pareto optimal solution, and ensure that the designer can further determine the optimal scheme in the Pareto optimal solution and the corresponding Pareto front.

3.4.3. Motor B + Two-Gear Transmission

Figure 16 is the Pareto front solved under scenario 3. Compared with scenario 2, because the power of motor B is lower than that of motor A, the maximum speed and acceleration performance decrease; compared with scenario 1, zone C of Figure 15 can realize the index combination of “low power consumption + fast acceleration” with performance comparable to scenario 1, and the index combination of “high speed + fast acceleration” in zone B, but the index combination of “high speed + low power consumption” cannot be realized.

3.5. Determination of the Final Protocol

Table 5 lists the preferred scheme for the three scenarios and the corresponding Pareto optimal solution ig*. As can be seen from the table, the more economical schemes are 1b, 2a, 2c and 3b.
The schemes 2a and 2c achieve lower power consumption of 100 km, but also achieve better maximum speed performance and acceleration performance, respectively. However, the dynamic indexes of 2a and 2c are far beyond the lowest indexes designed in Table 1, and are more suitable for the design indicators of sports battery electric vehicles, which is inconsistent with the positioning of battery electric vehicles involved in this study.
However, the performance indexes of 3b and 1b are similar to the lowest indexes designed in Table 1, and there are advantages and disadvantages among them. Scheme 1b does not need a clutch and does not need to design a shift algorithm, which has advantages over scheme 3b from the perspective of system integration and development. Therefore, after comprehensive consideration, 1b is defined as the final scheme, that is, the motor A + fixed transmission ratio transmission scheme.
In the transmission ratio, ig is determined as the closest 1.75 similar to 1.72. The total energy of the battery pack is determined as a more conservative value of 20 kWh.
From the determination process of the final scheme, it can be found that the parameter matching method proposed in this paper matches all the components simultaneously, rather than gradually matching a certain parameter of a single component.

4. Test Verification

4.1. Verification of Dynamic Performance Index

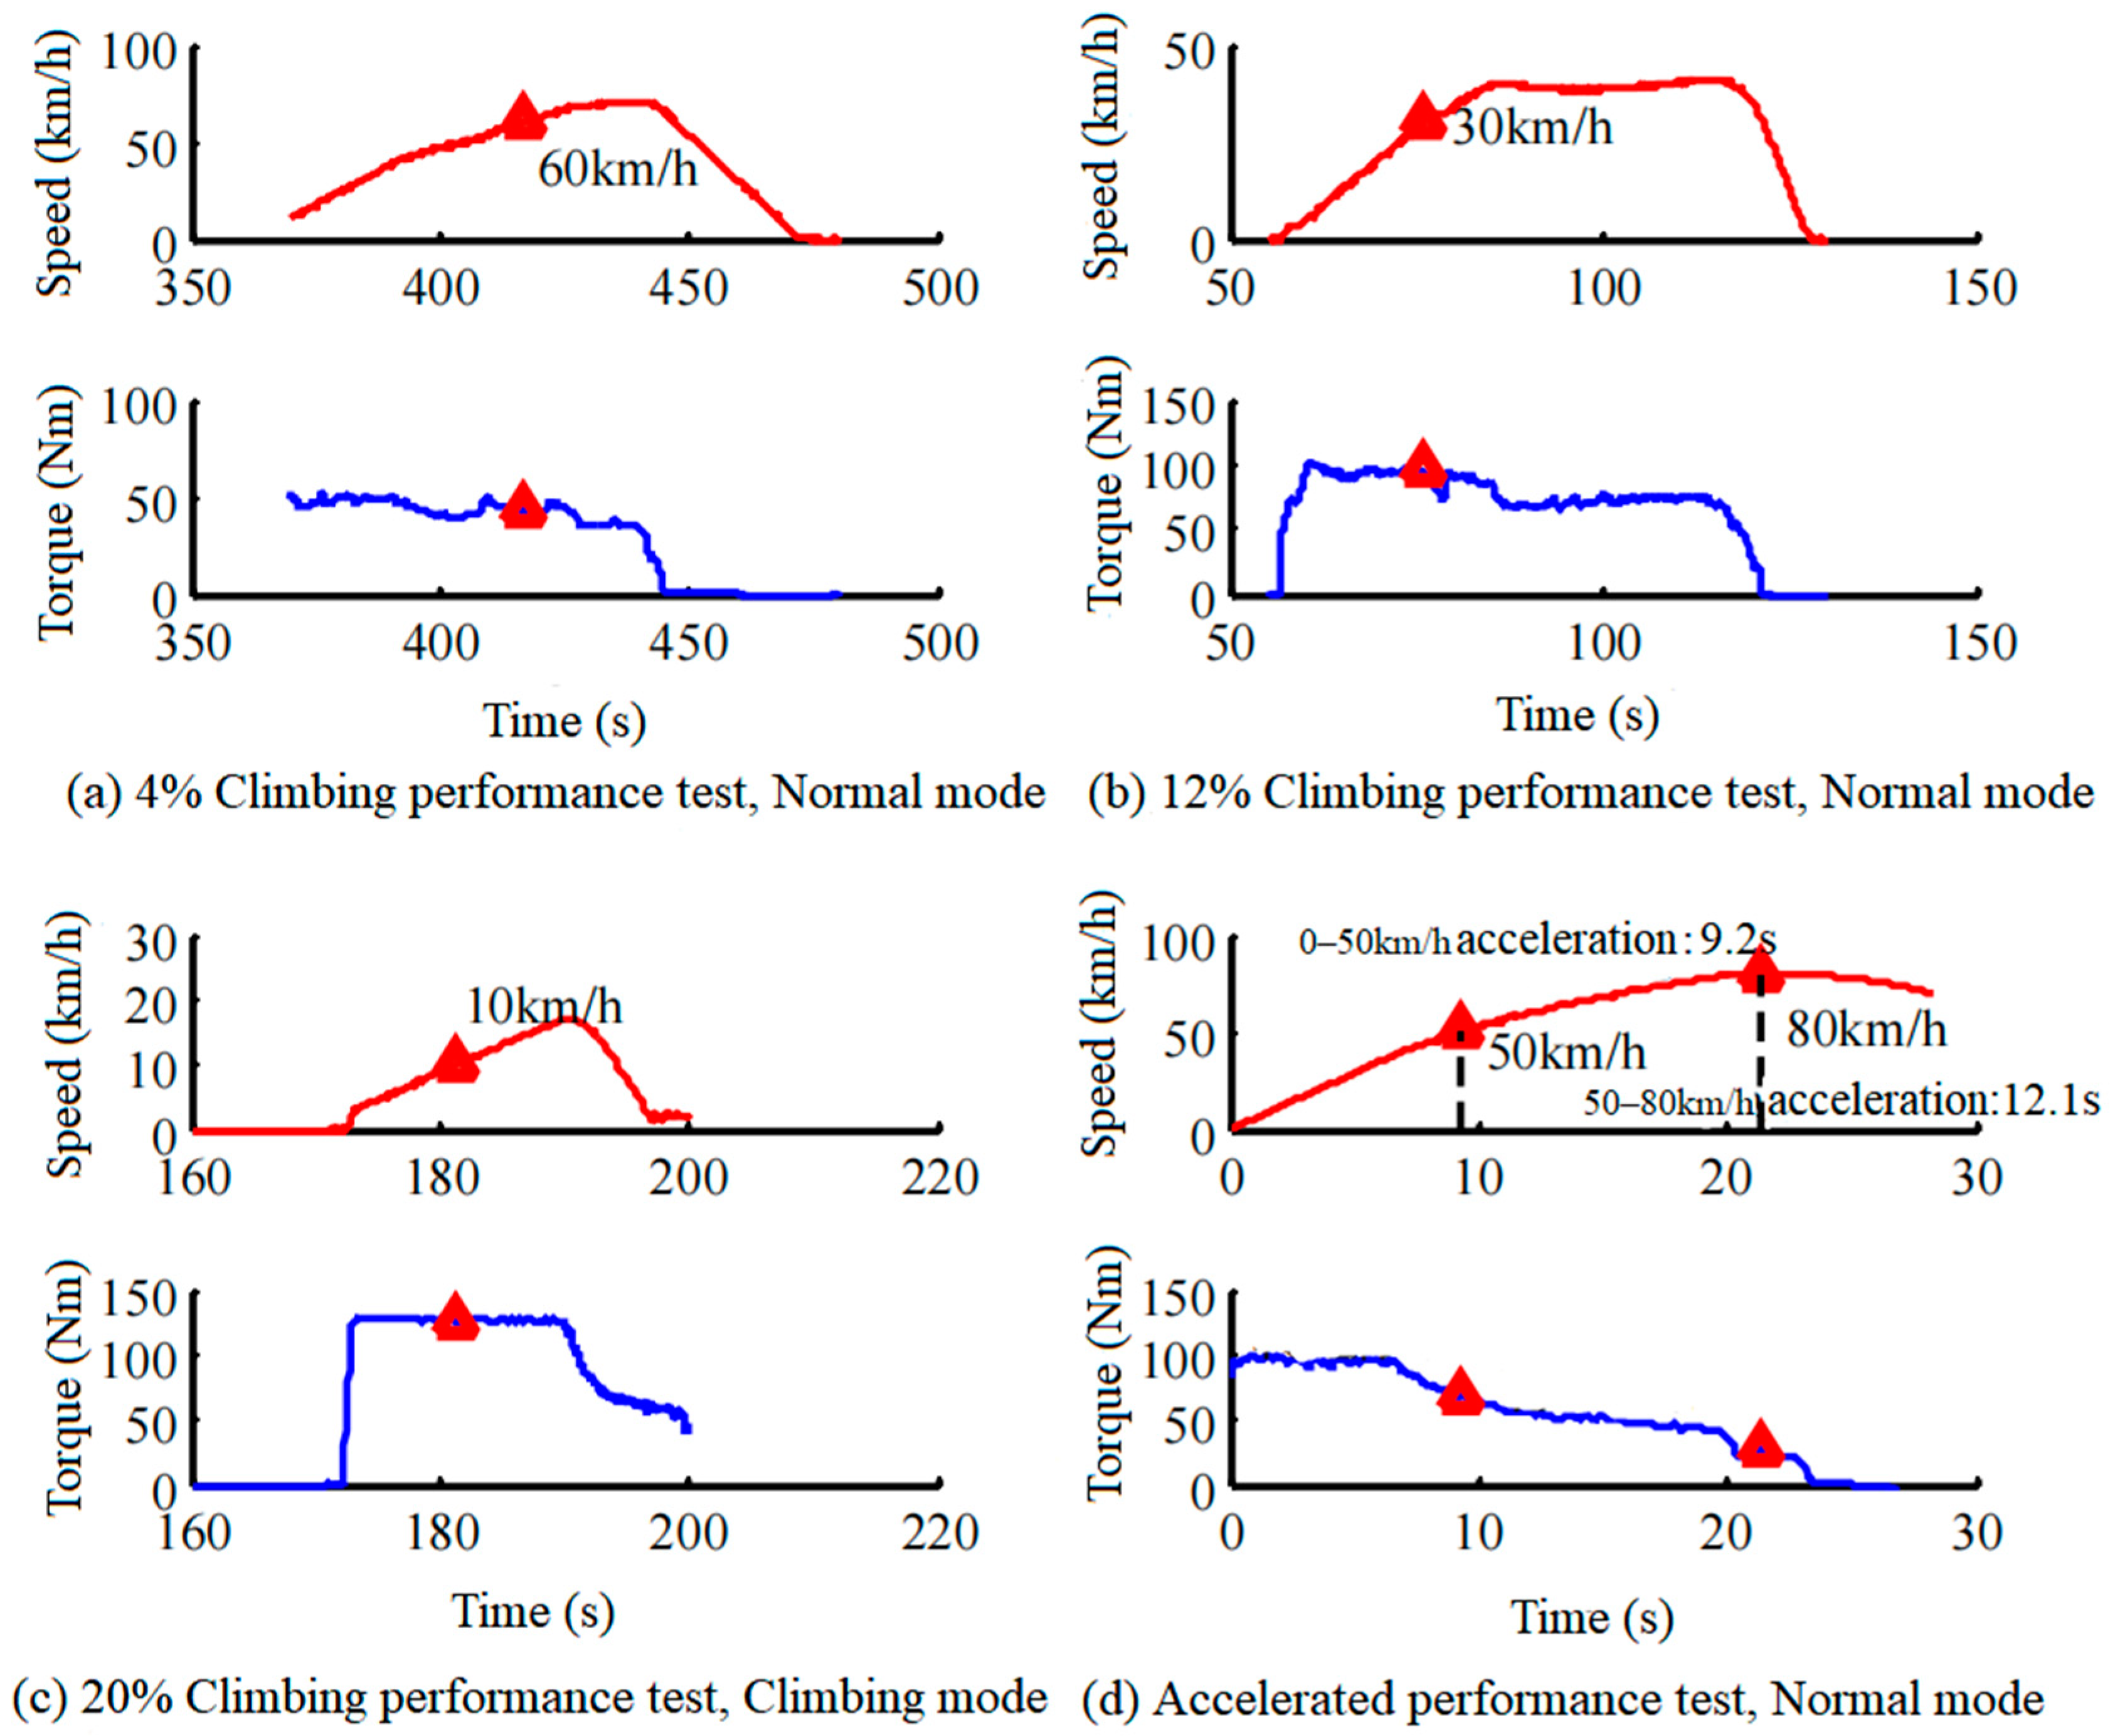
The verification of the dynamic index includes two aspects: (1) whether the three individual climbing performance indexes reach the minimum index; (2) whether the maximum speed performance and acceleration performance are consistent with the design value in Table 5. However, the developed battery electric vehicle is developed on the basis of the traditional internal combustion engine model, and the acceleration performance is much higher than the original traditional internal combustion engine vehicle. When the chassis is not redesigned and modified, too-high acceleration performance will bring safety risks. In order to cope with this problem, the torque limit of the motor is temporarily limited to 100 Nm (the torque limit of climbing mode is 130 Nm, only enabled at 20% climbing); the power limit of the motor is 30 kW and the speed limit of the motor is 7000 rpm.
In the case of limited power performance index verification, the maximum speed performance and acceleration performance must fail to reach the design value of Table 5. Therefore, only the drum test results are compared with the simulation results after limiting the torque power. If the two are consistent, it can be considered that the vehicle longitudinal dynamic model and the corresponding parameters are consistent with the real vehicle, and the performance of the prototype vehicle after the chassis modification can reach the design value in Table 5.
Figure 17 shows the specific process of the rotary drum test. From the test results in Table 6, the test value of the drum conforms well with the simulation value. From the deviation between the test value and the simulation value, the effective transmission ratio of the transmission is slightly larger than the nominal value of 1.75.

4.2. Verification of Economic Indicators

Drum test using the urban cycle in GB/T 18386. Figure 18 compares the working points of drum test and theoretical cycle on the motor map. Battery SOC from 100% to 10% of the whole process discharge is 16.5 kWh, driving range of 107.2 km.
The real available energy of the battery pack is related to its consistent state, ambient temperature, management algorithm and other factors. During the drum test, the battery pack used a conservative management algorithm, with less available energy than expected because the total capacity of the battery pack is a conservative design, which limits the range of the battery pack. The power consumption of 100 km is 15.39 kWh, which is basically consistent with the simulation result 15.23 kWh in the design stage.
The deviation between the test value of 100 km and the simulation value comes from many factors such as motor efficiency error and transmission efficiency error. In addition, parameter matching focuses mainly on condition point distribution on the motor map.
As shown in Figure 18, the size of the circle at the working condition point and the thickness of the line represent the size of the power, that is, the larger the circle, the thicker the line at the working condition point, and the greater the power. It can be seen from Figure 17 that the distribution of operating points of the drum test is in a good line with the urban cycle. Most of the high-power operating points (larger and thicker circles in the figure) are distributed in about 9 0% of the high efficiency area, realizing a lower power consumption index of 100 km, thus demonstrating the effectiveness of the proposed parameter matching method.

5. Conclusions

In recent years, energy shortages and environmental pollution have become the focus of the world’s attention [58,59]. Vigorously promoting energy conservation and emission reduction, low energy consumption, and low emissions marked by sustainable development [60,61,62] are becoming the common choices of all countries in the world. In this paper, the maximum speed, 0–50 km/h acceleration time and 100 km power consumption are taken as the optimization target vector, the transmission ratio as the optimization variable, and the lowest performance index as the constraint to establish the parameter matching optimization problem. For two motors of different power and fixed transmission and two-gear transmission, a multi-objective optimization genetic algorithm is used to solve a Pareto front as a set of preferred schemes. According to the positioning of the designed model, the final scheme is determined in the preferred scheme, and in the design and development of a sample car. The results of the drum test show that the developed model realizes the performance index of the parameter matching scheme, which verifies the effectiveness of the proposed parameter matching method.
(1) In the parameter matching optimization problem, multiple optimizable indicators compete with each other, and it is difficult to achieve the optimal problem simultaneously; it is also difficult to transform the original problem into a single target optimization problem through weighting. By solving the Pareto fronts of the optimization problem, we can effectively describe the competitive relationship between multiple optimizable indicators, and facilitate the further decision of designers.
(2) Scenario 1 mode Pareto optimal solution ig* ranges 1.33~1.85; scenario 2 mode Pareto optimal solution ig* range is [1.72, 0.98]~[2.99, 1.57]; and scenario 3 mode Pareto optimal solution ig* ranges [2.99, 1.40]~[2.99, 1.57].
(3) Choosing a motor A+ fixed transmission ratio transmission can achieve “fast acceleration + low power consumption”. The selection of motor A + two-gear transmission in zone A can achieve “high speed + low power consumption”; Zone B can realize “high speed + fast acceleration”; C can realize “fast acceleration + low power consumption”. The choice of motor B + two-gear transmission can achieve “low power consumption + fast acceleration” and “high speed + fast acceleration”, but cannot achieve “high speed + low power consumption”.
(4) Through the preferred scheme and the corresponding Pareto optimal solution set, it can be concluded that the schemes with better economy are 1b, 2a, 2c and 3b. The schemes 2a and 2c achieve lower power consumption of 100 km, but also achieve better maximum speed performance and acceleration performance, respectively. However, the performance indexes of 3b and 1b are similar to the designed lowest indexes, and there are advantages and disadvantages of each one. Scheme 1b does not need a clutch and does not need to design a shift algorithm, which has advantages over scheme 3b from the perspective of system integration and development. Therefore, after comprehensive consideration, 1b is defined as the final scheme, that is, the motor A + fixed transmission ratio transmission scheme.
(5) The multi-objective genetic algorithm is an effective method to solve nonlinear multi-objective optimization problems. Moreover, multi-target genetic algorithms are highly adaptable and can be solved for various kinds of optimized target combinations to meet the preferences of different designers.

Author Contributions

Conceptualization, J.H.; formal analysis, J.H., W.C. and J.Z.; software, L.H. and Q.C.; investigation, J.H., W.C., F.J., L.H., Q.C., W.Z. and J.Z.; resources, J.H.; writing—original draft preparation, J.H., W.C. and F.J.; writing—review and editing, J.H., W.C., F.J., L.H., Q.C., W.Z. and J.Z.; supervision, J.H.; funding acquisition, J.H. and Q.C. All authors have read and agreed to the published version of the manuscript.

Funding

This research was funded by the National Natural Science Foundation of China (grant number: 6196300006), the Innovation-Driven Development Special Fund Project of Guangxi (grant number: Guike AA22068060), the Science and Technology Planning Project of Liuzhou (grant number: 2021AAA0104, grant number: 2022AAA0104), the Liudong Science and Technology Project (grant number: 20210117), and the Independent research project of Guangxi Key Laboratory of automotive parts and vehicle technology (grant number: 2022GKLACVTZZ02, grant number: 2022GKLACVTZZ03).

Institutional Review Board Statement

Not applicable.

Informed Consent Statement

Written informed consent was obtained from all participants.

Data Availability Statement

All data used to support the findings of this study are included within the article.

Conflicts of Interest

The authors declare no conflict of interest.

References

  1. Zhang, Z.; Dong, R.; Tan, D.; Duan, L.; Jiang, F.; Yao, X.; Yang, D.; Hu, J.; Zhang, J.; Zhong, W.; et al. Effect of structural parameters on diesel particulate filter trapping performance of heavy-duty diesel engines based on gray correlation analysis. Energy 2023, 271, 127025. [Google Scholar] [CrossRef]
  2. Jiang, F.; Zhou, J.; Hu, J.; Tan, X.; Cao, W.; Tan, Z. Study on Performance of Locomotive Diesel Engine Fueled with Biodiesel Using Two Miller Cycle Technologies. Processes 2022, 10, 372. [Google Scholar] [CrossRef]
  3. Gao, C.; Na, H.; Song, K.; Xu, Q. Assessment of different methods in analyzing motor vehicle emission factors. Environ. Sci. Pollut. Res. Int. 2022, 29, 75441–75454. [Google Scholar] [CrossRef]
  4. Tan, D.; Meng, Y.; Tian, J.; Zhang, C.; Zhang, Z.; Yang, G.; Cui, S.; Hu, J.; Zhao, Z. Utilization of renewable and sustainable diesel/methanol/n-butanol (DMB) blends for reducing the engine emissions in a diesel engine with different pre-injection strategies. Energy 2023, 269, 126785. [Google Scholar] [CrossRef]
  5. Yeom, K. Model predictive control and deep reinforcement learning based energy efficient eco-driving for battery electric vehicles. Energy Rep. 2022, 8, 34–42. [Google Scholar] [CrossRef]
  6. Xiong, H.; Zhu, X.; Zhang, R. Energy recovery strategy numerical simulation for dual axle drive pure electric vehicle based on motor loss model and big data calculation. Complexity 2018, 10, 14–29. [Google Scholar] [CrossRef]
  7. Lu, M.; Zhang, X.; Ji, J.; Xu, X.; Zhang, Y. Research progress on power battery cooling technology for electric vehicles. J. Energy Storage 2020, 27, 101155. [Google Scholar] [CrossRef]
  8. Han, X.; Ouyang, M.; Lu, L.; Li, J. A comparative study of commercial lithium ion battery cycle life in electric vehicle: Capacity loss estimation. J. Power Sources 2014, 268, 658–669. [Google Scholar] [CrossRef]
  9. Gandoman, F.H.; Ahmadi, A.; Van den, B.P.; Mierlo, V.J.; Omar, N.; Nezhad, E.A.; Mavalizadeh, H.; Mayet, C. Status and future perspectives of reliability assessment for electric vehicles. Reliab. Eng. Syst. Saf. 2019, 183, 1–16. [Google Scholar] [CrossRef]
  10. Wang, Z.; Zhao, L.; Kong, Z.; Yu, J.; Yan, C. Development of accelerated reliability test cycle for electric drive system based on vehicle operating data. Eng. Fail. Anal. 2022, 141, 106696. [Google Scholar] [CrossRef]
  11. Guo, Y.; Wang, L.; Liao, C. Modeling and Analysis of Conducted Electromagnetic Interference in Electric Vehicle Power Supply System. Prog. Electromagn. Res. 2013, 139, 193–209. [Google Scholar] [CrossRef]
  12. Mustafa, U.; Ahmed, R.; Watson, A.; Wheeler, P.; Ahmed, N.; Dahele, P. A Comprehensive Review of Machine-Integrated Electric Vehicle Chargers. Energies 2022, 16, 129. [Google Scholar] [CrossRef]
  13. Venkata, G.; Kumar, M.; Goud, B.; Bajaj, M.; Abou, H.; Kamel, S. Design of a bidirectional DC/DC converter for a hybrid electric drive system with dual-battery storing energy. Front. Energy Res. 2022, 10, 1732. [Google Scholar]
  14. Andre, A.; Jose, A.; Giorgio, S.; Leonardo, A. Energy Management Fuzzy Logic Supervisory for Electric Vehicle Power Supplies System. IEEE Trans. Power Electron. 2008, 23, 107–115. [Google Scholar]
  15. Ahmad, A.; Khalid, M.; Ullah, Z.; Ahmad, N.; Aljaidi, M.; Malik, F.; Manzoor, U. Electric Vehicle Charging Modes, Technologies and Applications of Smart Charging. Energies 2022, 15, 9471. [Google Scholar] [CrossRef]
  16. Du, W.; Zhao, S.; Jin, L.; Gao, J.; Zheng, Z. Optimization design and performance comparison of different powertrains of electric vehicles. Mech. Mach. Theory 2021, 156, 104143. [Google Scholar] [CrossRef]
  17. Li, Z.; Khajepour, A.; Song, J. A comprehensive review of the key technologies for pure electric vehicles. Energy 2019, 182, 824–839. [Google Scholar] [CrossRef]
  18. Wang, W.; Liu, W.; Tao, B.; Ma, J. Parameter Design and Simulation Research of Power System for Electric Vehicle. Appl. Mech. Mater. 2014, 496, 969–973. [Google Scholar] [CrossRef]
  19. Wang, Z.; Zhou, J.; Rizzoni, G. A review of architectures and control strategies of dual-motor coupling powertrain systems for battery electric vehicles. Renew. Sustain. Energy Rev. 2022, 162, 112455. [Google Scholar] [CrossRef]
  20. Xu, L.; Ouyang, M.; Li, J.; Yang, F.; Lu, L.; Hua, J. Optimal sizing of plug-in fuel cell electric vehiclesusing models of vehicle performance and system cost. Appl. Energy 2013, 103, 477–487. [Google Scholar] [CrossRef]
  21. Murgovski, N.; Johannesson, L.; Sjöberg, J.; Egardt, B. Component sizing of a plug-in hybrid electric powertrain via convex optimization. Mechatronics 2012, 22, 106–120. [Google Scholar] [CrossRef]
  22. Zhang, M.; Wang, D.; Wang, M.; Yang, J. Several novel intelligent optimization algorithms for solving constrained engineering problems and their prospects. J. Comput. Appl. 2022, 42, 534–541. [Google Scholar]
  23. Omar, H.; Joeri, V.M. Optimal power management and powertrain components sizing of fuel cell/battery hybrid electric vehicles based on particle swarm optimisation. Veh. Des. 2012, 58, 200–222. [Google Scholar]
  24. Fu, X.; Zhang, Q.; Tang, J.; Wang, C. Parameter Matching Optimization of a Powertrain System of Hybrid Electric Vehicles Based on Multi-Objective Optimization. Electronics 2019, 8, 875. [Google Scholar] [CrossRef]
  25. Mo, T.; Li, Y.; Lau, K.; Poon, C.; Wu, Y.; Luo, Y. Trends and Emerging Technologies for the Development of Electric Vehicles. Energies 2022, 15, 6271. [Google Scholar] [CrossRef]
  26. Gao, J.; Wei, Y.; Liu, Z.; Qiao, H. Matching and Optimization for Powertrain System of Parallel Hybrid Electric Vehicle. Appl. Mech. Mater. 2013, 2516, 423–431. [Google Scholar] [CrossRef]
  27. Xue, Q.; Zhang, X.; Teng, T.; Yue, M. Dynamic coordinated control strategy of power on gear shifting for novel dual motor electric vehicle. Sustain. Energy Technol. Assess. 2023, 55, 102941. [Google Scholar] [CrossRef]
  28. Zhu, B.; Zhang, N.; Walker, P.; Zhou, X.; Zhan, W.; Wei, Y.; Ke, N. Gear shift schedule design for multi-speed pure electric vehicles. Proc. Inst. Mech. Eng. Part D J. Automob. Eng. 2015, 229, 70–82. [Google Scholar] [CrossRef]
  29. Roy, S.; Pandey, R. A Review on Motor and Drive System for Electric Vehicle. In Planning of Hybrid Renewable Energy Systems, Electric Vehicles and Microgrid: Modeling, Control and Optimization; Spring: Berlin/Heidelberg, Germany, 2022; pp. 601–628. [Google Scholar]
  30. Fichtner, M. Recent research and progress in batteries for electric vehicles. Batter. Supercaps 2022, 5, 202100224. [Google Scholar] [CrossRef]
  31. Husain, I. Electric and Hybrid Vehicles: Design Fundamentals; CRC Press: Boca Raton, FL, USA, 2021. [Google Scholar]
  32. El Hadraoui, H.; Zegrari, M.; Hammouch, F.E.; Guennouni, N.; Laayati, O.; Chebak, A. Design of a Customizable Test Bench of an Electric Vehicle Powertrain for Learning Purposes Using Model-Based System Engineering. Sustainability 2022, 14, 10923. [Google Scholar] [CrossRef]
  33. Mazali, I.; Daud, Z.; Hamid, M.; Tan, V.; Samin, P.; Jubair, A.; Ibrahim, K.; Kob, C.; Xinrui, W.; Talib, M. Review of the methods to optimize power flow in electric vehicle powertrains for efficiency and driving performance. Appl. Sci. 2022, 12, 1735. [Google Scholar] [CrossRef]
  34. Geng, J.; Chi, Q. Parameter matching and simulation analysis of power system of pure electric vehicle. In Journal of Physics: Conference Series; IOP Publishing: Bristol, UK, 2021; Volume 2076, p. 012091. [Google Scholar]
  35. Maheshwari, A.; Nageswari, S. Real-time state of charge estimation for electric vehicle power batteries using optimized filter. Energy 2022, 254, 124328. [Google Scholar] [CrossRef]
  36. Rousseau, A.; Pagerit, S.; Gao, W. Plug-In Hybrid Electric Vehicle Control Strategy Parameter Optimization. J. Asian Electr. Veh. 2008, 6, 1125–1133. [Google Scholar] [CrossRef]
  37. Zhu, K.; Li, T.; Qin, S.; Xu, G.; Fang, L. Simultaneous Optimization for Hybrid Electric Vehicle Parameters Based on Multi-Objective Genetic Algorithms. Energies 2011, 4, 532–544. [Google Scholar]
  38. Nguyen, C.; Nguyễn, B.; Trovao, J.; Ta, M. Optimal drivetrain design methodology for enhancing dynamic and energy performances of dual-motor electric vehicles. Energy Convers. Manag. 2022, 252, 115054. [Google Scholar] [CrossRef]
  39. GB/T 28382—2012; The National Technical Committee on Automobile Standardization. Technical Conditions of Pure Electric Passenger Vehicles. China Standards Press: Beijing, China, 2012.
  40. Foster, S.N. Condition Monitoring Accuracy in Inverter-Driven Permanent Magnet Synchronous Machines Based on Motor Voltage Signature Analysis. Energies 2023, 16, 1477. [Google Scholar]
  41. Boris, J.; Paolo, L.; Guido, M. Control of double-loop permanent magnet synchronous motor drives by optimized fractional and distributed-order PID controllers. Eur. J. Control 2020, 58, 232–244. [Google Scholar]
  42. Wang, S.; Hui, Y.; Sun, X.; Shi, D. Neural network sliding mode control of intelligent vehicle longitudinal dynamics. IEEE Access 2019, 7, 162333–162342. [Google Scholar] [CrossRef]
  43. Thomas, G. Fundamentals of Vehicle Dynamics; SAE International: Pittsburgh, PA, USA, 2021. [Google Scholar]
  44. GB/T 18385—2005; The National Technical Committee on Automobile Standardization. Test Method of Electric Vehicle. China Standards Press: Beijing, China, 2005.
  45. Indranil, D.; Kumar, R. A genetic algorithm based heuristic optimization technique for solving balanced allocation problem involving overall shipping cost minimization with restriction to the number of serving units as well as customer hubs. Results Control. Optim. 2023, 11, 100227. [Google Scholar]
  46. Lu, T.; Lu, Z.; Gao, Y.; Shi, L.; Wang, H.; Wang, T. Investigation on suitable swirl ratio and spray angle of a large-bore marine diesel engine using genetic algorithm. Fuel 2023, 345, 128187. [Google Scholar] [CrossRef]
  47. Xie, F.; Sun, Q.; Zhao, Y.; Du, H. An Improved Directed Crossover Genetic Algorithm Based on Multilayer Mutation. J. Control. Sci. Eng. 2022, 2022, 4398952. [Google Scholar] [CrossRef]
  48. John, P.; Vlad, S.; Hines, W. Neural Network Acceleration of Genetic Algorithms for the Optimization of a Coupled Fast/Thermal Nuclear Experiment. Front. Energy Res. 2022, 10, 874194. [Google Scholar]
  49. Antipina, E.; Mustafina, S.; Antipin, A. Algorithm of Solving a Multiobjective Optimization Problem on the Basis of a Kinetic Chemical Reaction Model. Optoelectron. Instrum. Data Process. 2022, 57, 668–674. [Google Scholar] [CrossRef]
  50. Brito, B.; Antónia, M.; Fernando, J. A diversity-based genetic algorithm for scenario generation. Eur. J. Oper. Res. 2022, 299, 1128–1141. [Google Scholar]
  51. Deb, K. Multi-objective optimization. In Search Methodologies; Springer: New Yore, NY, USA, 2014; pp. 403–449. [Google Scholar]
  52. Marler, R.; Arora, J. Survey of multi-objective optimization methods for engineering. Struct. Multidiscip. Optim. 2004, 26, 369–395. [Google Scholar] [CrossRef]
  53. Cao, J.; Yan, Z.; Chen, Z.; Zhang, J. A Pareto front estimation-based constrained multi-objective evolutionary algorithm. Appl. Intell. 2022, 1–37. [Google Scholar] [CrossRef]
  54. Xu, Y.; Zhang, H.; Huang, L.; Qu, R.; Nojima, Y. A Pareto Front Grid Guided Multi-Objective Evolutionary Algorithm. Appl. Soft Comput. 2023, 136, 110095. [Google Scholar] [CrossRef]
  55. Zhang, C.; Gao, L.; Li, X.; Shen, W.; Zhou, J.; Tan, K. Resetting Weight Vectors in MOEA/D for Multiobjective Optimization Problems with Discontinuous Pareto Front. IEEE Trans. Cybern. 2021, 59, 9770–9783. [Google Scholar] [CrossRef]
  56. Sato, H. Inverted PBI in MOEA/D and its impact on the search performance on multi and many-objective optimization. Genet. Evol. Comput. 2014, 645–652. [Google Scholar]
  57. Liang, J.; Qiao, K.; Yu, K.; Qu, B.; Yue, C.; Guo, W.; Wang, L. Utilizing the Relationship between Unconstrained and Constrained Pareto Fronts for Constrained Multiobjective Optimization. IEEE Trans. Cybern. 2022. [Google Scholar] [CrossRef]
  58. Jiang, F.; Cao, W.; Tan, X.; Hu, J.; Zhou, J.; Tan, Z. Optimization Analysis of Locomotive Diesel Engine Intake System Based on Matlab-Simulink and GT-Power. Processes 2022, 10, 157. [Google Scholar] [CrossRef]
  59. Jiang, F.; Zhou, J.; Hu, J.; Tan, X.; Mo, Q.; Cao, W. Performance Comparison and Optimization of 16V265H Diesel Engine Fueled with Biodiesel Based on Miller Cycle. Processes 2022, 10, 1412. [Google Scholar] [CrossRef]
  60. Tan, D.; Wu, Y.; Lv, J.; Li, J.; Ou, X.; Meng, Y.; Lan, G.; Chen, Y.; Zhang, Z. Performance optimization of a diesel engine fueled with hydrogen/biodiesel with water addition based on the response surface methodology. Energy 2023, 263, 125869. [Google Scholar] [CrossRef]
  61. Zhang, Z.; Dong, R.; Lan, G.; Yuan, T.; Tan, D. Diesel particulate filter regeneration mechanism of modern automobile engines and methods of reducing PM emissions: A review. Environ. Sci. Pollut. Res. 2023, 30, 39338–39376. [Google Scholar] [CrossRef] [PubMed]
  62. Zhang, Z.; Li, J.; Tian, J.; Dong, R.; Zou, Z.; Gao, S.; Tan, D. Performance, combustion and emission characteristics investigations on a diesel engine fueled with diesel/ethanol/n-butanol blends. Energy 2022, 249, 123733. [Google Scholar] [CrossRef]
Figure 1. Test drawing of the drive motor transmission assembly bench.
Sustainability 15 08219 g001
Figure 2. (a) Efficiency map of motor A, (b) Efficiency map of motor B.
Sustainability 15 08219 g002
Figure 3. Simulation platform structure.
Sustainability 15 08219 g003
Figure 4. Expression of the vehicle longitudinal dynamics equation in the motor T-ω diagram.
Sustainability 15 08219 g004
Figure 5. Analysis of transmission ratio under acceleration performance constraints.
Sustainability 15 08219 g005
Figure 6. (a) Plot of the initial position of the chromosomes, (b) Final position plots of the chromosomes.
Sustainability 15 08219 g006
Figure 7. Power system of battery electric vehicle.
Sustainability 15 08219 g007
Figure 8. Research framework for the parameter matching problem.
Sustainability 15 08219 g008
Figure 9. Schematic diagram of the scheme meeting the lowest performance indicators.
Sustainability 15 08219 g009
Figure 10. Testing the urban cycle of the range index.
Sustainability 15 08219 g010
Figure 11. Transmission ratio matching under fixed transmission ratio (motors A and B).
Sustainability 15 08219 g011
Figure 12. Example of transmission ratio matching under a two-gear transmission (Motor B).
Sustainability 15 08219 g012
Figure 13. Pareto front of motor A + fixed transmission ratio transmission.
Sustainability 15 08219 g013
Figure 14. The Pareto front of the motor A + two-gear transmission.
Sustainability 15 08219 g014
Figure 15. Pareto: The neighborhood of the optimal solution. Black indicates no change in performance, blue indicates worse performance, and red indicates better performance.
Sustainability 15 08219 g015
Figure 16. The Pareto front of the motor B + two-gear transmission.
Sustainability 15 08219 g016
Figure 17. Drum test results-motility index.
Sustainability 15 08219 g017
Figure 18. Mapping of urban cycle and drum test on the motor map.
Sustainability 15 08219 g018
Table 1. Main vehicle parameters of a certain type of rear-drive battery electric vehicle.
The Parameter NameNumerical Value
Curb weight mv (kg)1455
Main deceleration ratio i04.889
Additional quality of the test mcap (kg)180
Rolling resistance coefficient ƒ0.012
Wheel base l (mm)2490
Transmission efficiency ηT0.93
Rolling radius Rw (m)0.273
Front/rear axis charge ratio (%)36/64
Height of center of mass hg (mm)510
Front face area Aveh (m2)2.593
Air resistance coefficient CD0.456
The transmission system is used to rotation IT (kg·m2)0.0335
Wheel rotation inertia Iw (kg·m2)0.4
Motor rotation inertia Imot (kg·m2)0.0335
Table 2. Minimum vehicle performance indicators.
Sequence NumberVehicle Performance IndicatorsGB/28382Design Value
1Maximum speed≥80 km/h (30 min)≥85 km/h (30 min)
2Climbing performance I≥4% (60 km)≥4% (60 km)
3Climbing performance II≥12% (30 km)≥12% (30 km)
4Climbing performance III≥20%≥20% (10 km/h)
5Accelerating ability I0–50 km/h < 10 s0–50 km/h < 10 s
6Accelerating ability II50–80 km/h < 15 s50–80 km/h < 15 s
7Endurance mileage≥80 km≥80 km
8Hundreds of kilometers of electricity consumptionUnspecifiedUnspecified
Table 3. Six individual index constraints.
Sequence NumberPerformance Index
Name
Performance Index Setting
Counting
Transmission Ratio Viable Domain (Motor A)Transmission Ratio Viable Domain
(Motor B)
1Maximum speed≥85 km/h (30 min)S1 = [0.43, 1.85]S1 = [0.62, 1.85]
2Climbing performance≥4% (60 km)S2 = [0.41, 2.65]S2 = [0.59, 2.65]
3Climbing performance≥12% (30 km)S3 = [0.85, 5.3]S3 = [0.85, 5.3]
4Climbing performance≥20% (10 km/h)S4 = [1.33, 16]S4 = [1.85, 16]
5Accelerating ability0–50 km/h < 10 sS5 = [1.0, 3.145] *S5 = [1.0, 3.145] *
6Accelerating ability50–80 km/h < 15 sS6 = [0.53, 1.97] *S6 = [0.53, 1.97] *
-occur simultaneously-S = [1.33, 1.85]S = [1.85, 1.85]
* Note: The upper bound of the feasible domain of the accelerated performance constraint is determined according to the shift logic constraint.
Table 4. Parameters of the multiple-target genetic algorithm.
Algorithm ParametersScenario 1Scenario 2Scenario 3
Population size100300300
Maximum algebra100200200
Number of variables122
Selective ruleTournamentTournamentTournament
Mutation functionAdaptive feasibleAdaptive feasibleAdaptive feasible
Cross rulesIntermediateIntermediateIntermediate
Cross probability100%100%100%
Pareto front Scale35%35%35%
Stall Generation203030
Function Tolerance0.00010.00010.0001
Table 5. Comparison of the preferred schemes.
ScenarioPreferred SchemeMaximum Speed
Vmax (km/h)
Accelerating Ability T050 (S)Hundreds of Kilometers of Electricity Consumption E100kw (kW·h)Pareto Optimal Solution
ig*
Scenario 11a1166.8515.511.33
1b965.8115.231.72
1c885.4815.321.85
Scenario 22a1365.8015.23[1.72, 0.98]
2b1364.3915.81[2.99, 1.00]
2c1044.4715.29[2.81, 1.57]
Scenario 33a1166.4115.51[2.99, 1.40]
3b1046.4115.29[2.99, 1.57]
Table 6. Results of the drum test.
Performance Indicators to Be OptimizedThe Lowest IndexSimulation ValueTumbler Test
Maximum speed
vmax (kW/h)
8588.4287.35
0–50 kw/h Acceleration time T0→50 (S)109.49.2
50–80 kw/h Acceleration time T50→80 (S)1512.612.1
Hundreds of kilometers of electricity consumption
E100kw (kW·h)
It is not
stipulated
15.2615.39
Endurance mileage
(kW)
100108.3107.2
60 kw/h hill climbing>4%>4%>4%
30 kw/h hill climbing>12%>12%>12%
10 kw/h hill climbing>20%>12%>12%
Disclaimer/Publisher’s Note: The statements, opinions and data contained in all publications are solely those of the individual author(s) and contributor(s) and not of MDPI and/or the editor(s). MDPI and/or the editor(s) disclaim responsibility for any injury to people or property resulting from any ideas, methods, instructions or products referred to in the content.