Article

Spatiotemporal Characteristics and Factors Influencing Urban Tourism Market Network in Western China: Taking Chengdu as an Example

1
College of Geography and Environmental Science, Northwest Normal University, Lanzhou 730070, China
2
College of management, Northwest Minzu University, Lanzhou 730030, China
*
Author to whom correspondence should be addressed.
Sustainability 2023, 15(10), 8135; https://doi.org/10.3390/su15108135
Submission received: 30 March 2023 / Revised: 14 May 2023 / Accepted: 16 May 2023 / Published: 17 May 2023
(This article belongs to the Special Issue Sustainable Marketing and Strategy Management for Tourism)

Abstract

:
Urban tourism network attention is important for measuring the competitiveness of the urban tourism industry, tourism attraction, and cultural soft power. In this study, we explored the spatiotemporal patterns and factors influencing network attention in the tourist source market and discussed how tourism cities can increase network attention, thus improving the competitiveness of urban cyberspace and developing soft power. Taking Chengdu as a research case, we obtained data on its tourism network attention from 31 provinces (autonomous regions and municipalities) between 2011 and 2021. We measured the spatiotemporal characteristics of network attention using the inter-annual change index, seasonal concentration index, potential tourists’ concentration coefficient, and ESDA model and analyzed the factors affecting spatiotemporal changes in network attention using the geographic weighted regression (GWR) model. The results revealed that from 2011 to 2021, the network attention of Chengdu tourism showed an overall “M”-type fluctuation trend, with significant seasonal differences and disequilibrium and significant differences in space, signifying an overall “∩”-shaped distribution trend. This suggested a weak negative spatial correlation. Further, the number of mobile Internet users, people in higher education per 100,000 people, per capita gross domestic product, urbanization rate, and passenger throughput are important factors that affect the network attention of Chengdu tourism. Thus, these results can be used by cities in western China to optimize the network attention rating system of urban tourism, strengthen the promotion of urban image, build a sustainable city, and transform network traffic into effective economic growth.

1. Introduction

The tourist source market is the key factor that determines the survival and sustainable development of tourism destinations and tourism development competition among tourism destinations. Research on tourist destination source markets is quite prevalent in the fields of tourism geography, tourism management, and marketing [1,2]; tourism destination branding based on tourists’ perceived image and potential tourist attention have been widely proved to be effective as a common choice of marketing strategy in many places [3,4,5,6,7,8]. This research focused on the spatial structure and evolution characteristics of the tourist source market. Analyzing the spatial characteristics, seasonal changes, and long-term trends of potential tourists and exploring the important factors that affect the potential concerns of the tourist source market are significant for enhancing the network attention of the source market, formulating tourist cities’ tourism development policies, enhancing destination attractiveness, and promoting the sustainable development of tourism industries [9,10,11,12]. Scholars have examined the spatial characteristics of tourist cities source market from three perspectives: the spatial distribution of tourist cities sources, the spatiotemporal evolution of tourist source markets, and mathematical models [13,14,15]. The corresponding research methods mainly include the tourist source radius, seasonal index, geographical concentration index, reliability function, time series model, spatial use curve, network analysis, and tourism background trend line model [16,17,18,19,20,21].
In the era of the Internet, changes in the spatial structure of the tourist source market have become an important issue for scholars. Öörni studied the impact of Internet tourism and the tourism market on the way tourists search before they consume products; the research hypotheses were constructed by discussing the amount of search and consumer objectives related to direct sales channels. He observed that the impact of the Internet-based leisure tourism market on pre-order consumer searching was smaller than it was expected to be, and most consumers extend their searches to electronic markets to improve the search process, not necessarily the quality of their purchase decision [22]. Rodríguez developed and implemented a hierarchical clustering method using smartphone geographic location data to segment the tourism market and verified it in the Netherlands [23]. Xu analyzed the discrepancy between actual and expected flows in scenic spots in an urban destination at different distance ranges based on individual travel tips data extracted from online sources [24]. Tourism information searching has become more convenient and flexible owing to economic, scientific, and technological developments, such as the popularity of smartphones; this has not only altered people’s lifestyles and concepts, but also, channels of information dissemination. Before traveling, tourists usually searched on the Internet to obtain traffic, weather, accommodation, scenic spot tickets, and other information. These search processes are retained by the Internet in the form of search traces called “network attention” or a “search index” [25]. As a statistical measure of urban information dissemination and the recognition index of netizens, the network attention of tourism cities has important practical implications for promoting the virtual IP creation of city business cards, the value-added network of data information, and the promotion of city characteristics.
Network attention indicators, such as Google Trends and the Baidu Index, can reflect Internet users’ behavior preferences and public opinion recognition based on big data from online searches. They can also reflect Internet users’ attitudes, feelings, and judgments about real events and can comprehensively measure the attention and spatial differences and content preferences of Internet users across the country in special urban areas [26,27,28]. There is also a positive correlation between city or scenic spot passenger flows and network attention [29,30,31]. With the help of network attention data, the distribution of tourist destinations can be clarified, the spatial pattern of tourism flow can be clarified, innovative marketing methods for scenic spots can be innovated, and precise marketing promotion can be implemented [32,33,34,35,36]. Chinese scholars use the Baidu index and other network search data to predict the tourist flow of scenic spots, research tourism security network concerns, the passenger flow using different client data, and the spatial pattern of scenic spots’ concerns [37,38,39,40,41,42,43,44]. In addition to the Baidu Index, the network attention data of different network platforms and social media data, such as Sina Weibo, user-generated content, social network members, and users’ short video data have also been used to examine tourist source markets [45,46,47,48,49,50,51].
At present, research on the spatial structure and dynamic change in network attention in the tourist source market is limited to the dynamic change in the spatial structure of the tourist source market in Nanjing and the characteristics and factors influencing the change in the tourist source market structure in Zhangjiajie over recent years [52,53]. There are a few relevant studies on its medium- and long-term inter-annual evolution and corresponding influencing factors. Additionally, only a few studies have examined the network attention of the tourist source market in western cities in China, such as Chengdu. As an important indicator of the precursor effect of actual passenger flow, assessing the case of Chengdu can reflect the travel tendency of potential tourists and provide new ideas for studying its tourist source market’s space–time characteristics.
In the era of mass tourism and the information technology revolution, the Internet has become the primary source of obtaining information regarding a tourist’s destination. Tourism cities and scenic spots also use big data to analyze changes in tourists’ attention in the source market to improve their marketing effectiveness. Therefore, based on time series change, spatial structure change, and time section change in the Baidu Index’s network attention of Chengdu’s tourist market, this study reveals the spatiotemporal characteristics and changes within the network attention of the tourist market and analyzes the factors influencing change and provides a reference for the marketing and cultural soft power construction of Chengdu’s customer source market. This study enriches the research on the urban tourism source market and network attention and provides a useful reference for western cities in China to formulate tourism sustainable development policies. In the second part of this article, an overview of the research area, research methods, and research data sources are introduced. The third and fourth parts analyze the spatiotemporal characteristics and influencing factors of Chengdu’s tourism network attention. Finally, the influencing mechanism is explored in depth, and suggestions for urban tourism marketing strategies are proposed.

2. Materials and Methods

2.1. Study Area

Chengdu (102°54′–104°53′ E longitude; 30°05′–31°26′ N latitude), located in the central part of Sichuan Province, is the capital of Sichuan Province and one of the first famous national historical and cultural cities in China (Figure 1). It was estimated that, in 2022, the city’s gross domestic product (GDP) would be CNY 20818 trillion, an increase of 2.80% over that of the previous year. By the end of 2022, Chengdu had 92 national A-level scenic spots, including 2 5A scenic spots and 50 4A scenic spots. (A grade A scenic spot is the quality level of China’s tourist attraction, which is divided into five levels. Among them, 5A is the highest level of China’s tourist attraction, representing China’s world-class tourist attractions.) From 2016 to 2020, Chengdu’s Globalization and World Cities Research Network’s world city ranking jumped from 188 to 59, and it won the titles of “World’s Best Tourism Destination”, “China’s Tourism and Leisure Demonstration City”, and so on. In 2019 (before the outbreak of COVID-19), Chengdu’s total tourism revenue was CNY 466.4 billion, including CNY 455.11 billion of domestic tourism revenue and 276.42 million domestic tourists.

2.2. Methods

2.2.1. Inter-Annual Variation Index and Seasonal Concentration Index

The inter-annual variation index is used to reflect the relative amount of inter-annual variation in tourism network attention; its calculation formula is as follows:
Y = N i 1 n i = 1 n N i
where Y is the inter-annual change index, and Ni is the concern index of the i th year. Generally, the inter-annual change in the tourist source network of a tourist destination shows a slowly growing trend. The more the value of Y deviates from 100%, the greater the inter-annual change in the tourist source network of Chengdu is, and the more unstable the degree of concern is.
The seasonal concentration index reflects the time concentration of tourists in Chengdu; its calculation formula is as follows:
R = i = 1 12 x i 8.33 2 ÷ 12
where xi is the proportion of network attention in each month of Chengdu throughout the year; R is the seasonal concentration index of tourists in Chengdu. R is close to 0, which means that the more uniform the distribution in each month of the next year is, the greater R is. This implies that the distribution of tourist’s network attention to Chengdu is large and seasonal.

2.2.2. Concentration Coefficient of Potential Tourists

Referring to Zhu’s improvement of the geographical concentration index [54], the concentration coefficient of potential tourists’ attention was adopted to measure the concentration of potential tourists in the tourist source market in Chengdu. This measure is more reasonable and scientific than the geographical concentration index (G) is, which reflects deviation from the complete average distribution. The formula is as follows:
G = Δ G / G ¯ × 100
where G refers to the concentration coefficient of potential tourists’ attention in Chengdu’s tourist source market. The larger the value is, the more concentrated the tourists’ attention is, and vice versa. The general geographical concentration index used is as follows:
G = 100 × i = 1 n X i / T 2
where n is the total number of tourist sources, Xi is the network focus index of the i th tourist source, and T is the total focus of the destination. This value is affected by both the uniform distribution of tourist sources and the number of tourist sources. Therefore, before the influence of n is excluded, G is the only variable reflecting the concentration of tourists, which requires comparison. G ¯ It is the concentration index that calculates the complete average situation of n regions based on the assumption that potential tourists are evenly distributed among n destinations or come from n source markets:
G ¯ = 100 × i = 1 n 1 / n 2
Then, we introduce Δ G to eliminate the impact of n:
Δ G = 100 i = 1 n X i / T 2 i = 1 n 1 / n 2
Δ G is the difference between G and G ¯ , and the ratio of this difference with G ¯ reflects the concentration of potential tourists.

2.2.3. ESDA Model

ESDA (Exploratory Spatial Data Analysis) is a method used to explore the spatial distribution pattern and spatial interaction mechanism of regional things or phenomena [55]. The common methods include global autocorrelation and local autocorrelation. See the literature [56] for a specific formulaic expression.

2.2.4. GWR Model

The GWR model embeds the spatial location of research data into the regression parameters and uses the locally weighted least squares method to estimate point-by-point parameters. The weight is the distance function between the geographical/spatial location of the study area unit and the geographical/spatial location of other units. This model can better reveal the spatial correlation between research variables [57]. The calculation formula is as follows:
y i = a i 0 u i , v i + i = 1 p a i k u i , v i x i k + ε i
where u i , v i is the spatial location of the ith study area, x i k is the independent variable of the ith study area, a i 0 u i , v i and i = 1 p a i k u i , v i x i k are the estimated values of constant terms and parameters of the ith study area, respectively, and P is the number of independent variables of the ith sample point; ε i is the error correction term.

2.3. Data Source

When the urban tourist source market is studied, a lack of comprehensive survey data on provincial tourist source statistics can be replaced with network focus data [58]. By the end of 2021, Baidu accounted for 85.48% of the domestic search engine market in China, making it the largest Chinese search engine in the world (data are from the Statcounter: https://gs.statcounter.com/search-engine-market-share/all/china/#monthly-202101-202112, accessed on 27 February 2023). The Baidu Index is a data-sharing platform embodying behavior data from a large number of Internet users. We used certain keywords to find changes in network attention that occurred over the past week, month, year, or even longer. The following keywords were used to collect the network attention data of 31 provinces (municipality and autonomous regions) in Chengdu from 1 January 2011 to 31 December 2021: “Chengdu Tourism”, “Chengdu Scenic Spot”, and “Chengdu Strategy”. Since network attention data from tourist source markets in Chengdu are sparse, such as Hong Kong, Macao, and Taiwan, these were not included in the study. Further, data from the China Statistical Yearbook, the Chengdu Statistical Yearbook, the provincial statistical yearbook and statistical bulletin, and the civil aviation airport production statistical bulletin from 2011 to 2021 were used to determine the factors influencing urban tourism market networks.

2.4. Selection of Indexes

Network attention reflects tourists’ demand for destination information. Consequently, the main factors influencing network attention are the indicators that affect tourists’ demand and information acquisition. This paper analyzes the factors that affect the space–time difference in Chengdu’s tourism network attention using the following: (1) population size—the larger the population size of the tourist source area is, the more potential tourists there are who are willing to travel to Chengdu, and the more common the generated online information search behavior is, which is represented by the population at the end of the year; (2) economic development level—the better the economic development level of the potential tourist location is, the higher the per capita GDP is, and the stronger the willingness to travel is, which is expressed by the per capita GDP indicator; (3) the level of network development, which directly affects the degree of online attention of tourists, wherein an increasing amount of potential tourists conduct online searches via the mobile internet, and this is expressed by the number of mobile internet users; (4) the education level of potential tourists is an important factor that affects their online search, which is expressed by the number of people in higher education per 100,000 people; (5) the urbanization development level, wherein urbanization has an important impact on the number of people who desire to travel in the city, which is expressed by the urbanization rate indicator; (6) travel population—the travel population of the tourist source area reflects the number of people traveling in the area, which is represented, to a certain extent, by the passenger throughput index of each province (Table 1).

3. Results

3.1. Time Characteristics of Chengdu Tourism’s Network Attention

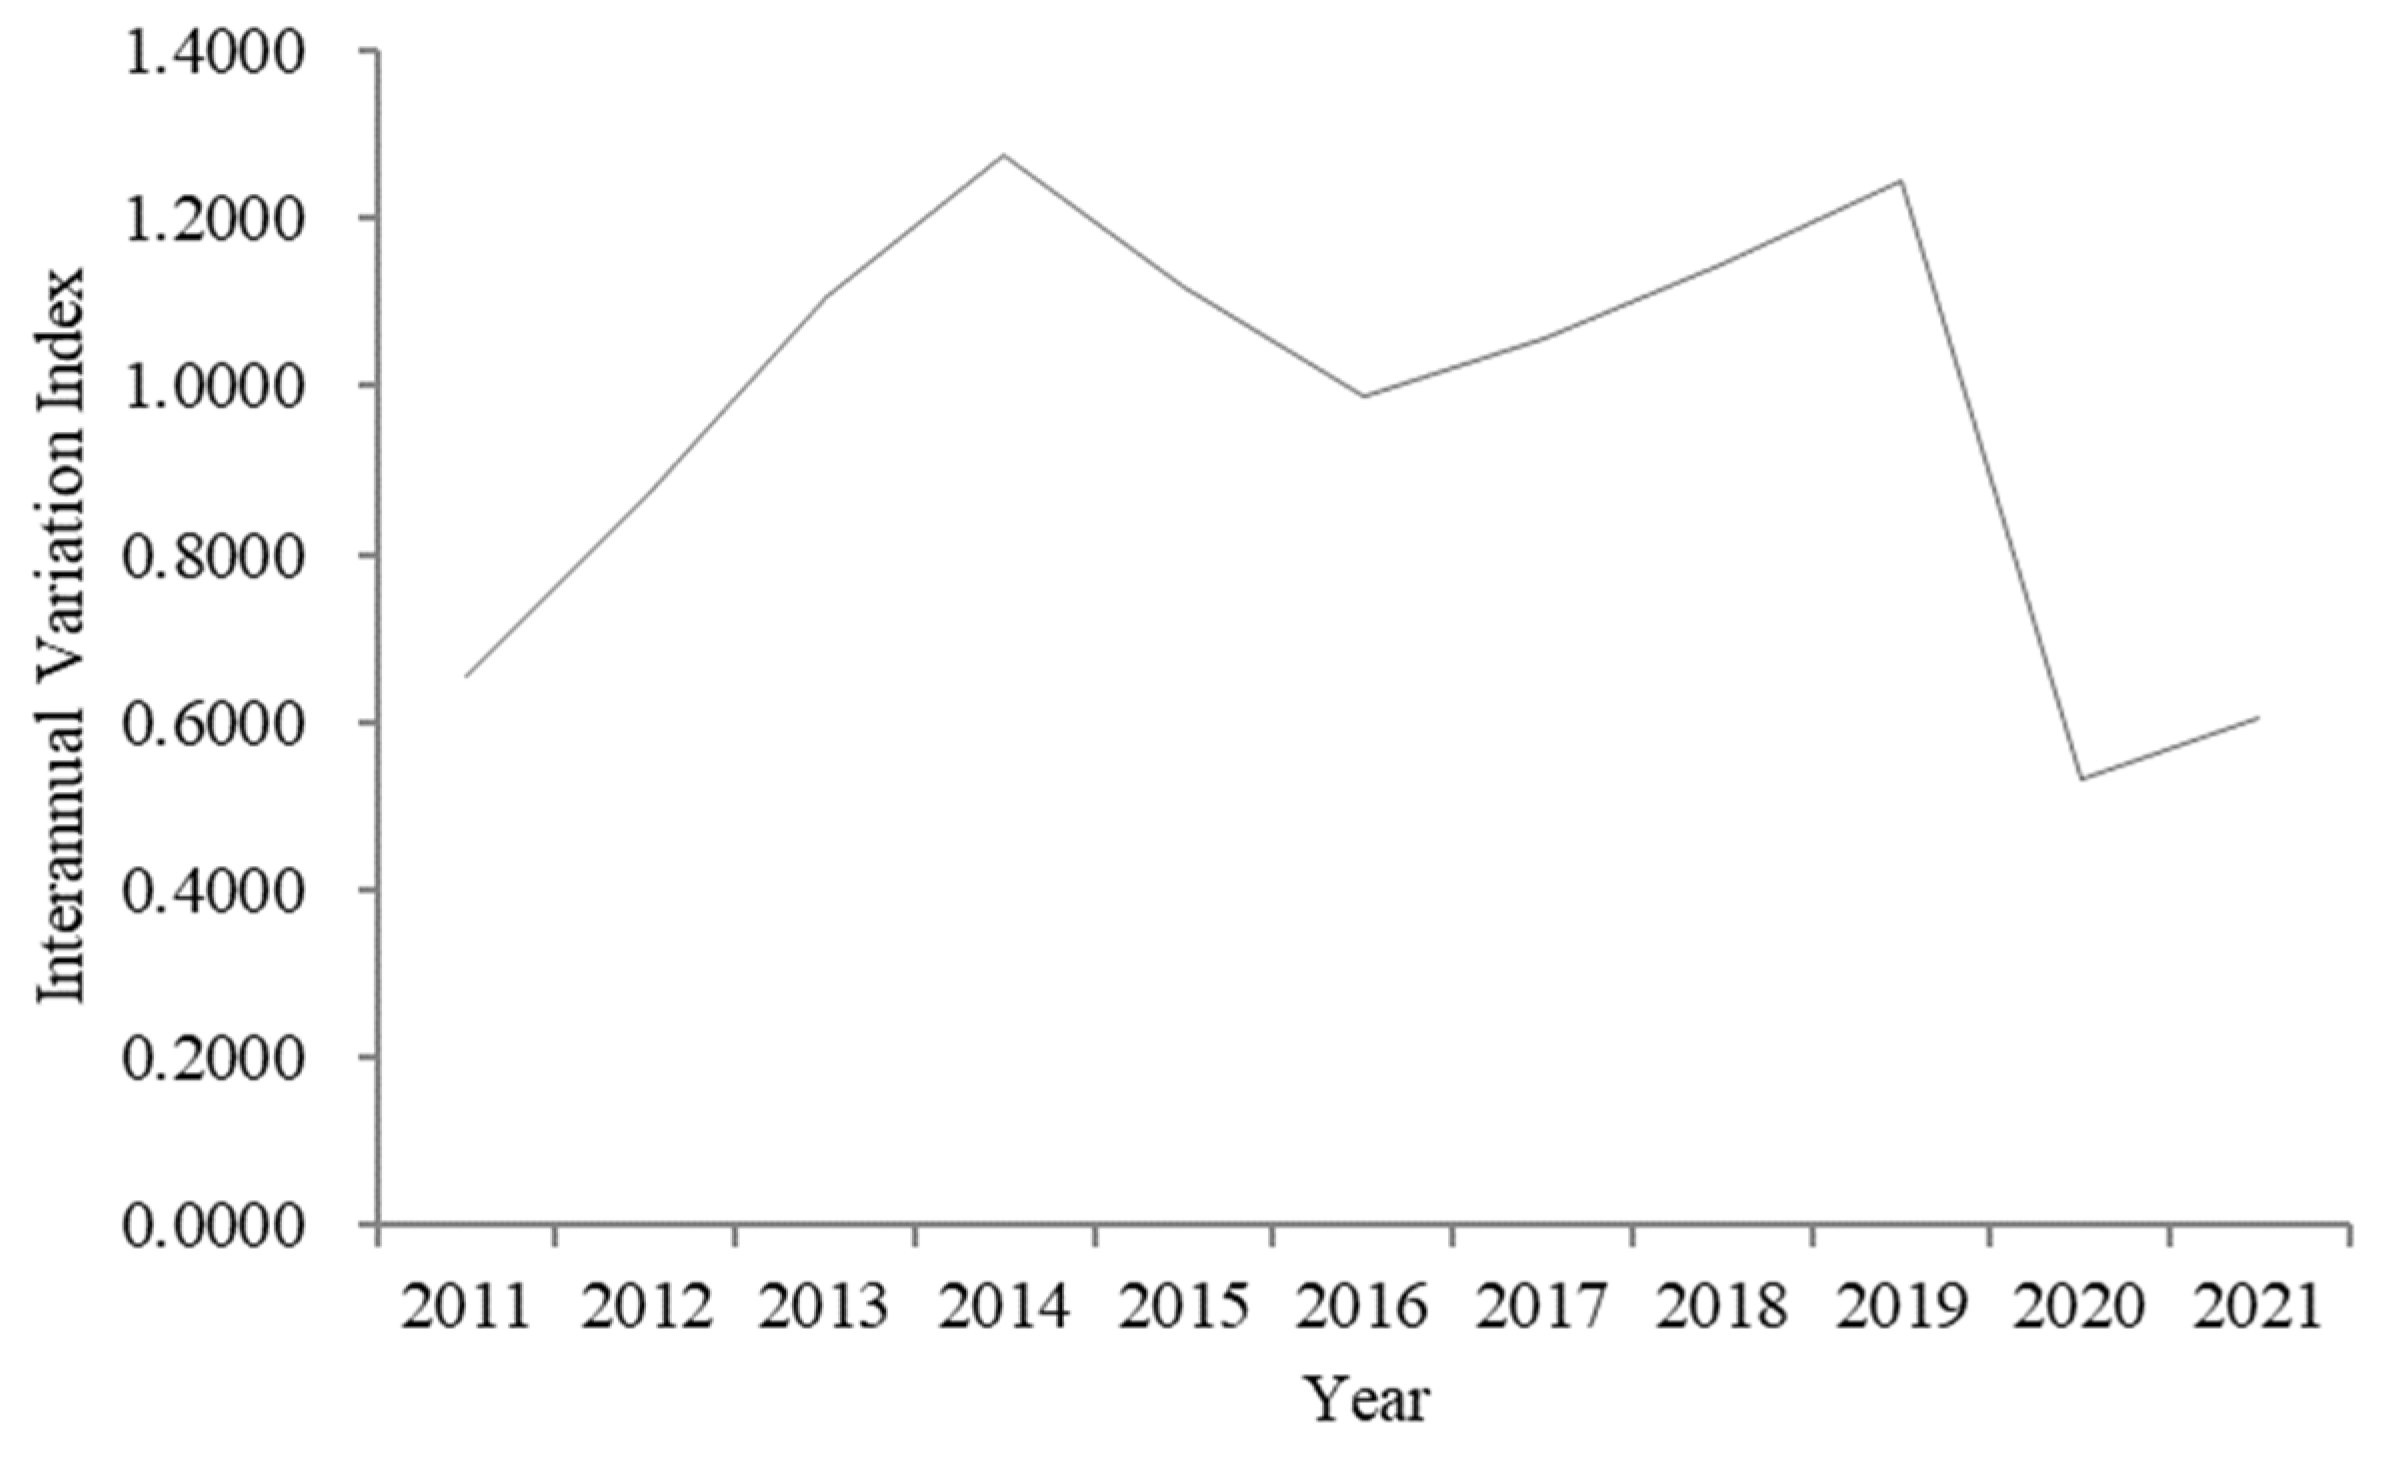
3.1.1. Inter-Annual Characteristics

According to the calculation of the inter-annual change index, the attention network of Chengdu’s tourism shows an overall “M”-type fluctuation in terms of its development trend (Figure 2). Here, an upward trend was observed in the periods of 2011–2014 and 2017–2019, whereas 2015–2016 and 2019–2020 showed a declining trend; 2020–2021 was the recovery period. The inter-annual change index increased from 0.66 in 2011 to 1.28 in 2014, decreased to 0.99 in 2016, and was followed by an increase to 1.25 in 2019. Owing to the impact of the COVID-19 pandemic, in 2020, the inter-annual change index of network attention decreased to 0.53 and recovered to 0.60 in 2021. From 2015 to 2016, although the numbers of domestic tourists remained high at 189 million and 200 million, the growth rates fell to 2.59% and 4.71%, respectively. From 2017 to 2019, the number of domestic tourists who arrived in Chengdu increased from 211 million to 276 million, and the annual growth rate increased to 4.88%, 15.81%, and 15.20% per year, respectively. Due to COVID-19, it is estimated that the annual average numbers of domestic tourists in Chengdu during 2020 and 2021 would have been 204 million and 205 million, respectively.

3.1.2. Seasonal Characteristics

The seasonal concentration index used to measure Chengdu’s tourism network attention index during 2011–2021 was 8.38, 6.80, 8.15, 6.55, 5.25, 3.46, 4.18, 4.55, 12.73, 14.25, and 11.21 per year, respectively, which fluctuated from high (2011–2015) to low (2016–2018) and back to high (2019–2021), indicating that the seasonal difference in Chengdu’s tourism network attention was significant. (A greater value implies that the distribution of tourist’s network attention in Chengdu is large and seasonal (Figure 3).) The largest seasonal difference was observed in 2020. The highest value of the seasonal concentration index in most years from 2011 to 2021 was distributed from August to October. From 2011 to 2015, the high value of the seasonal concentration index was concentrated around the New Year’s Day, National Day, and summer vacation, which corresponded with the traditional tourist peak season. From 2016 to 2018, the seasonal concentration index was evenly distributed, with a maximum value of 8.64 in June 2018. From 2019 to 2021, the seasonal difference significantly increased. Further, in 2019, the period from April to June constituted the peak of the entire year; in 2020, the period from February to March 2020 constituted the first peak of the entire year, and in September, it attained the highest level of 59.79 in a decade.

3.1.3. Characteristics of Holidays

Chengdu tourism’s network attention data were selected from 1 January 2021 to 31 December 2021 (Figure 4). In 2021, the data revealed three peaks around “legal holidays” and summer vacation. Specifically, since 12 February 2021 (Spring Festival), Chengdu tourism’s network attention level gradually increased, and until 18 April, it showed a fluctuation and rising trend of a “high intra-week index and low weekend index”. After a small peak from 29 March to 2 April, there was a trough from 3 to 5 April (Qingming holiday, which is the Pure Brightness Festival). This, along with the results of previous studies, demonstrates that the search behavior of potential tourists in the source market before they travelled led to an increase in network attention before the festival [48]. Similar laws also appeared before and after the “May Day” holiday (International Labor Day). From 19 April to 5 May, network attention peaked during the “May Day” holiday, with the highest value appearing on 2 May. From 28 June to 30 July, Chengdu tourism’s network attention remained high, which was consistent with the summer passenger flow peak. Influenced by the resurgence of the local COVID-19 pandemic in Chengdu toward the end of July 2021, network attention decreased significantly in August. Since 5 November, Chengdu tourism’s network attention has remained low.

3.2. Spatial Characteristics of Chengdu Tourism Network Attention

3.2.1. Spatial Concentration Trend

According to the calculation of the geographical concentration index (G) of Chengdu tourism’s network attention and the potential tourist concentration coefficient ( G ' ) (Table 2), we observed a disequilibrium in space. Further, the potential tourist concentration coefficient can reflect the deviation degree of the network attention concentration better than the geographical concentration index can. According to the geographical concentration index, the G value of Chengdu tourism’s network attention fluctuated between 20.12 and 26.63 from 2011 to 2021, and the maximum fluctuation range was 1.93 between 2011 and 2019. However, G value in 2020 was 6.51 times higher than the minimum value was (2019), indicating that in 2020, the geographical concentration of Chengdu tourism’s network attention level was higher than it had been in the previous years. However, according to the concentration coefficient of potential tourists’ attention, the fluctuation range of G value from 2011 to 2021 was 12.01 to 48.27, and the maximum fluctuation range between 2011 and 2019 was 10.79. In 2020, the G value was 36.26 higher than the minimum value was (2019). As indicated by similar calculation results in the relevant literature [48], the potential tourist concentration coefficient, G , can better explain the concentration degree of tourists and more sensitively reflect the degree of deviation than the G value can. The concentration coefficient of potential tourists’ attention in each year demonstrates that the actual distribution of network attention deviates more from the average geographical concentration index. This indicates that the spatial distribution of network attention is relatively concentrated.

3.2.2. Differences in Provincial Distribution

From 2011 to 2021, the inter-provincial differences in Chengdu tourism’s network attention were significant, showing a rough “∩”-shaped distribution trend. The network attention level in most regions peaked in 2014, 2018, and 2019, and fell from 2020 to 2021 (Figure 5). At the national scale, the network attention level of the eastern, western, and central regions showed a decreasing trend. Network users from the eastern region, Beijing, Jiangsu, and Guangdong paid the most attention to Chengdu tourism, whereas the amount of network attention given to Hainan Province was the lowest in the eastern region, which was equivalent to the values in Qinghai and Ningxia. The network attention level for Henan and Hubei in the central region is significantly higher than those of other regions, while the western region has an increased average value due to the high degree of attention paid to Sichuan Province. Chongqing and Shaanxi are also at the forefront in the western region in terms of network attention. However, the average value of the western region was still lower than that of the central region, excluding data for Sichuan Province.

3.2.3. Spatial Correlation

We used the global Moran’s I index to examine the spatial autocorrelation of Chengdu tourism’s network attention from 31 provinces (autonomous regions and municipalities) (Figure 6). We found that this value between 2011 to 2020 was negative, with the highest value of 0.08 appearing in 2011, and the lowest value of 0.14 appearing in 2019. This indicates that Chengdu tourism’s network attention from 31 provinces (autonomous regions and municipalities) presents a weak spatial negative correlation; that is, the higher the dispersion of the spatial distribution position (distance) is, the greater the spatial difference in network attention is. Specifically, provinces (autonomous regions and municipalities) that pay lots of attention to Chengdu tourism tend to be scattered in space (Sichuan, Beijing, Guangdong, and Jiangsu). In other words, network attention is not highly concentrated. From the perspective of time evolution, Moran’s I index demonstrated a fluctuating downward trend, with values of 0.10 in 2016 and 0.14 in 2021, with a gradual increase in spatial dispersion.
The local Moran’s I indexes of Chengdu tourism’s network attention for 2011, 2014, 2018, and 2021 indicate that the number of provinces (autonomous regions and municipalities) located in the first quadrant (HH quadrant) is gradually increasing (Figure 7). This indicates that the number of provinces paying lots of attention to Chengdu tourism is increasing, and these provinces are gradually forming clusters in space. In 2021, the provinces formed a local aggregation state in the eastern and central regions, and the local Moran’s I index is in the third quadrant (LL quadrant). Most of them are in north-east China, Inner Mongolia, and Xinjiang. These concentrated provinces account for the lowest amount of attention being paid toward Chengdu tourism. The fourth quadrant (HL quadrant) belongs to the region itself, which pays a lot of attention to Chengdu tourism, but the surrounding provinces account for a low level of attention. The spatial difference between them is large from Beijing, Liaoning, Shandong, Sichuan, Jiangsu, and Guangdong in 2011 to Liaoning, Sichuan, and Guangdong in 2021. The second quadrant (LH quadrant) demonstrates that the region itself pays less attention to Chengdu tourism, but the surrounding areas pay a lot of attention to it. The spatial difference between them is large and widely distributed in the north-west and south-west regions. The local Moran’s I index reveals that the network attention level of 31 provinces (autonomous regions and municipalities) toward Chengdu tourism has gradually increased, but the network attention levels of each province (autonomous regions and municipalities) differ significantly and have various characteristics.

3.3. Impact Characteristics of Geographically Weighted Regression (GWR) Variables on Network Attention

3.3.1. Model Construction and Inspection

Multiple linear regression and GWR were used to determine the factors influencing spatiotemporal differentiation. The network attention of the source market is linked to multiple factors. The multiple linear regression model is a classic model for analyzing the factors that influence dependent variables. These are estimated using an optimal combination of multiple independent variables. The analysis of spatial characteristics demonstrated that Chengdu tourism’s network attention has a certain spatial correlation and regional differences. Among the factors influencing the network attention of the tourist source market, the mutual independence between regions required by the linear regression model is no longer present [55,56,57]. Considering that the estimation results of the multivariate linear regression model may not be accurate, the GWR model was introduced to analyze the impact indicators of Chengdu tourism’s network attention from 31 provinces (autonomous regions and municipalities) between 2011 and 2021. This method facilitated the exploration of spatial variation characteristics and the laws of impact factors in different geographical locations. Due to space limitations, in this study, we only compared the cross-sectional data of 2018 (before the pandemic) with those of 2021 (after the normalization of pandemic prevention and control) and used the GWR model to present the analysis.
We obtained information on various variables that affected the evolution of spatial and temporal patterns of Chengdu tourism’s network attention in 2018 and 2021 using the GWR tool in ArcGIS10.2 and AICc information criterion method (Table 3). It can be seen that the adjusted goodness-of-fit (R2Adjusted) of the model is above 79%, except for the population size index. Therefore, excluding the population index at the end of the year, the GWR estimation model can better simulate the impact of other variables on the development of Chengdu tourism’s network attention from 31 provinces (autonomous regions and municipalities).

3.3.2. Impact of Various Variables on Network Attention

The regression results of the GWR model (Figure 8) show that the regression coefficients of five explanatory variables are different in each province (autonomous regions and municipalities). This indicates spatial differences in the impact of each explanatory variable on Chengdu tourism’s network attention. The influence of five explanatory variables on Chengdu tourism’s network attention can be explained as follows: the number of mobile Internet users > the number of people in higher education per 100,000 people > GDP per capita > the urbanization rate > passenger throughput.
(1)
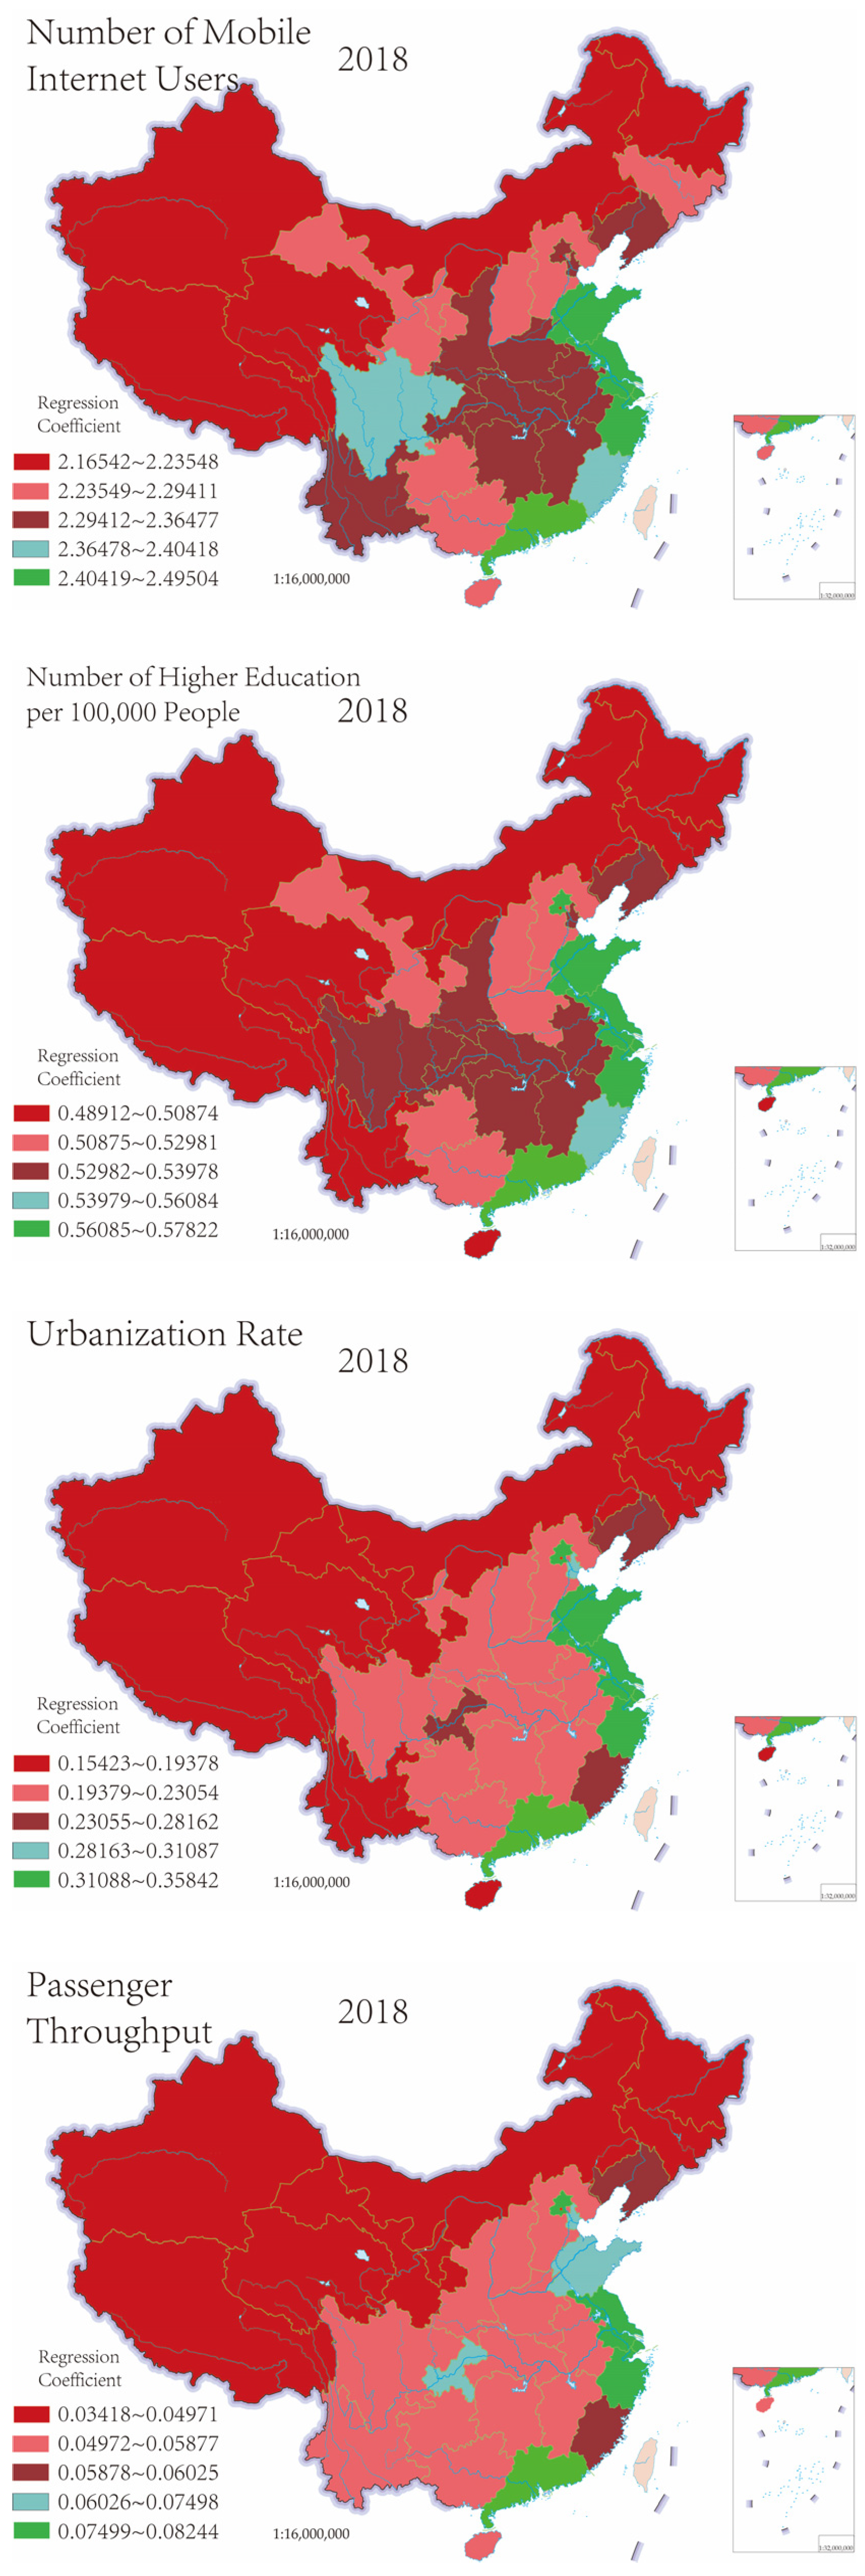
The number of mobile Internet users has the most significant and positive impact on Chengdu tourism’s network attention in all the provinces (autonomous regions and municipalities). In 2018, high values were observed in Shandong, Jiangsu, Shanghai, Zhejiang, Guangdong, Fujian, and Sichuan, whereas low values were observed in the north-west region, Tibet, inner Mongolia, and Heilongjiang. In 2021, the coefficients of Sichuan, Shaanxi, Hebei, and Henan increased, while those of Fujian and Yunnan decreased. From the perspective of time, the regression coefficient of the number of mobile Internet users also increased, and the impact intensity gradually increased.
(2)
The number of people in higher education per 100,000 people also has a significant impact on Chengdu tourism’s network attention in all the provinces (autonomous regions and municipalities). In 2018, high values were observed in Beijing, Shandong, Jiangsu, Shanghai, Zhejiang, Guangdong, and Fujian, whereas low values were observed in north-west China, Tibet, inner Mongolia, and Heilongjiang. In 2021, the coefficients for Sichuan, Chongqing, Shaanxi, and Hubei increased. Provinces (autonomous regions and municipalities) with high regression coefficients comprised abundant higher education resources and a large number of college students. From the perspective of time, the extreme value of the regression coefficient expanded by 2.30 times over the three years, indicating that the spatial difference in the impact of education level in various provinces (autonomous regions and municipalities) has widened further.
(3)
Per capita GDP has a significant and positive impact on the attention given to Chengdu tourism’s network attention in all provinces (autonomous regions and municipalities). In 2018, high values were observed in Beijing, Jiangsu, Shanghai, Zhejiang, and Guangdong, whereas low values were observed in the north-west region, Tibet, inner Mongolia, and Heilongjiang. The coefficient of the “Hu Line” in the south-east area is significantly higher than that in the north-west region. From the perspective of time, the impact intensity of GDP per capita gradually increased. In 2021, the regression coefficient of Chongqing was higher than it was in 2018, while that in other regions remained unchanged.
(4)
The urbanization rate also has a significant impact on Chengdu tourism’s network attention in each province (autonomous regions and municipalities). However, its regression coefficient is smaller than those of GDP per capita, the number of mobile Internet users, and the number of people in higher education per 100,000 people. In 2018, high values were observed in Beijing, Shandong, Jiangsu, Shanghai, Zhejiang, Guangdong, and Tianjin, while low values were observed in the north-west region, Tibet, and Heilongjiang. In 2021, the value increased in Liaoning, Hubei, and Fujian.
(5)
Passenger throughput had the lowest impact on Chengdu tourism’s network attention in all provinces (autonomous regions and municipalities). In 2018, high values were observed in Beijing, Jiangsu, Shanghai, Zhejiang, and Guangdong, whereas low values were observed in the north-west, south-west, north-east, and central regions. In 2021, the regression coefficients for Tianjin, Chongqing, Yunnan, and Hainan decreased, while that of Shandong increased. From the perspective of time, the extreme value of the regression coefficient of passenger throughput reduced, and the impact intensity gradually weakened. A high regression coefficient value appeared in economically developed regions and the main tourist source markets in Chengdu.

4. Discussion

4.1. Analysis of Driving Mechanism

To create opportunities for China’s digital technology development and encourage the construction of a new double-cycle development pattern, exploring the allocation effect of public Internet attention and its role in stimulating consumption and other economic performance is crucial for promoting the high-quality transformation and sustainable development of China’s urban economy [59,60]. The new means of achieving Internet transmission have become essential for tourist cities and scenic spots to attract network attention. Attracting network attention has a positive effect on improving a city’s popularity and promoting offline traffic agglomeration. Relevant literature shows that cities with high degrees of network attention are often accompanied by significant tourism popularity and traffic agglomeration [61].
The Internet attracts urban tourist traffic because some exclusive information and characteristic resources of the city are highly consistent with the attention and interests of tourists. Potential tourists from source cities are usually attracted to food, scenic spots, climate, and other factors that are indigenous to the destination city [62,63]. This attraction drives potential tourists to retrieve information from the Internet. This search usually uses the combination of “city + tourism/strategy/food/scenic spots/weather” as keywords. The search behavior of a large number of potential tourists in each source city constitutes the Baidu index of the source city to the tourist destination.
According to the above analysis, network attention in Chengdu tourism is significantly affected by the level of Internet development, higher education, economic development, urbanization development, and the travel population size. The research conclusions are similar to previous research results [29,31,53]. The level of Internet development has the most significant impact on the network attention given to Chengdu in all provinces (autonomous regions and municipalities). Regions with high levels of Internet users have a high corresponding search index and high level of network popularity. As they were affected by COVID-19, an increasing number of potential tourists searched for strategies to avail Chengdu tourism and visit related scenic spots. The use of the mobile Internet to experience VR tourism has ensured a continued increase in network popularity. The number of people in higher education also had a significant impact on the network attention given to Chengdu tourism in each province (autonomous regions and municipalities). Relevant research demonstrates that education level is the main demographic feature that affects tourists’ perception and decision making [64]. Regions with rich higher education resources and a large number of college students had a high degree of network attention given to Chengdu tourism. College students groups are using tourist sources more; they use the Internet to search for tourism destinations, which is one of the reasons for the increase in network attention.
The level of economic development also has a significant impact on network attention given to Chengdu tourism for all provinces (autonomous regions and municipalities). Simultaneously, the level of economic development is also an important factor affecting the travel potential of tourist sources [65]. The more potential tourists there are in economically developed regions, the more attention is paid to Chengdu tourism. As a world-renowned tourism destination, Chengdu attracts the attention of potential tourists in the country, especially, in economically developed regions, which are the main tourist sources in Chengdu. There are many potential tourists and high-level network attention regions. Further, the level of urbanization also has a significant impact on the network attention given to Chengdu tourism for all provinces (autonomous regions and municipalities). The urbanization rate has a linear trend with the domestic travel rate and per capita tourism expenditure of residents [66]. Urbanization is the developmental trend of modern civilization, and the generation and development of tourism cannot be separated from cities. With the improvement of urbanization, the disposable income of residents will increase, the domestic travel rate of residents will increase significantly, and the corresponding network attention given to tourism destinations will also increase. The scale of the travel population had a relatively low impact on network attention given to Chengdu tourism for each province (autonomous regions and municipalities). Passenger throughput is an important indicator of the degree of regional economic development and the number of outbound tourists. Since the outbreak of the COVID-19 pandemic, both the tourism industry and the air transport industry have been affected. The number of tourists traveling via air has declined year-on-year. In addition, the Chengdu–Chongqing Passenger Dedicated Line and the Chengdu–Guiyang–Kunming High-speed Railway were successively opened. As a result, the regression coefficient of passenger throughput in some regions decreased, and the impact intensity of indicators gradually decreased.
To summarize the findings presented in this work, tourist cities should transform network traffic into effective economic growth. Tourism effectively promotes economic growth in economically underdeveloped areas, which is in line with the goal to “reduce inequality within and among countries“ as part of the Sustainable Development Goals (SDGs). The development of Internet technology and the popularization of new social platforms have accelerated the transmission of the concept of urban tourism marketing and fueled the comprehensive development of cities. Western cities can spread urban tourism marketing to second- and third-tier cities in China, and also, they have a certain reference significance according to other cities in the world. City managers should solve the key problem of the transformation from “network attention dividend” to “development power”, pay attention to the dynamic development of cities for a long time, avoid short-sightedness and policies that seek to achieve quick success and instant benefits, and reduce the unsustainable risks of tourism development, constantly improve the city’s competitiveness and the supply capacity of tourism public services, transform the focus of urban tourism network into the growth of the tourism population, and drive the growth of per capita tourism consumption with the flow effect.

4.2. Limitations

As we were limited to focusing on the source of network attention, this study only discussed Chengdu tourism network attention data based on the Baidu index from 2011 to 2021, and data from short video platforms and social networks were not included. There was also no statistical analysis of the spatiotemporal characteristics of more detailed administrative units (prefecture level) on Chengdu tourism network. In addition, this paper used “Chengdu Tourism”, “Chengdu Scenic Spot”, and “Chengdu Strategy” as keywords for the online search. Although it has some representativeness, it cannot fully cover potential tourists’ attention given to Chengdu’s tourism network. Along with the retrieved data, the dynamic change in the proportion of data from PC and mobile networks and the characteristics of potential tourists behind them need to be further described in detail.

5. Conclusions

Based on network attention data and related analysis methods, this study verifies the spatial and temporal patterns of network attention from 31 provinces (autonomous regions and municipalities) in China given to a single tourism city and examines the factors that affect network attention. (1) From 2011 to 2021, Chengdu tourism’s network from 31 provinces (autonomous regions and municipalities) in China showed an overall “M”-type fluctuation trend, with significant seasonal differences. (2) Chengdu tourism’s network attention from 31 provinces (autonomous regions and municipalities) was in a state of disequilibrium and significantly differed in terms of space, with the overall trend of an “∩”-shaped distribution. The trend decreased from eastern to western to central regions. The network attention value of users in the eastern region given to Chengdu tourism was the highest, and those of the 31 provinces (autonomous regions and municipalities) showed a weak spatial negative correlation. (3) The number of mobile Internet users, the number of people in higher education per 100,000 people, GDP per capita, the urbanization rate, and passenger throughput are important factors that affect the network attention given to Chengdu tourism. The regression coefficient of each index is generally low in the west and high in the east, and the coefficient of the south-east region of the “Hu Line” is significantly higher than that of the north-west region.
Urban tourism network attention is an important scale for measuring the competitiveness of the urban tourism industry, tourism attraction, and cultural soft power, and it is an important dimension of urban brand building and cyberspace governance. Improving network attention, and thus, improving the competitiveness of urban cyberspace and developing soft power is an aspect that decision makers in many cities, especially tourism cities, have been considering [25,67,68,69,70]. Therefore, cities in western China should strengthen the following two aspects in the process of enhancing tourism attraction, soft power of cyberspace and urban brand communication.
First, decision makers in cities should optimize the network attention rating system for urban tourism. As they are influenced by factors such as the economic development level, network communication level, education level, urbanization rate, and tourist population, the Yangtze River Delta, Beijing–Tianjin–Hebei, and Guangdong–Hong Kong–Macao Bay Area have formed growth poles of urban tourism network attention in the western region. However, the results indicate that in addition to the relatively high level of network attention from economically developed regions, the urban tourism network attention level in the central and western regions was low and did not form an agglomeration effect.
Second, they should strengthen publicity and promote the city’s image. Tourism is the main driving force for building a city’s image, cultural IP, and brand. A city’s image is more vibrant and sustainable than economic industries are. From the perspective of city image publicity, developed cities, characteristic cities, cultural cities, or tourist cities can ensure the rapid dissemination of the city’s image over a certain period or through a certain event in the Internet era. For example, during the Spring Festival and National Day in Beijing, “Tavern” in Chengdu, “8D Chongqing”, and “Dingzhen’s hometown” (Litang County, Ganzi Tibetan Autonomous Prefecture, etc.), the city’s network attention and tourism activities are rapidly combined. In fact, the city’s business development, urban renewal, cultural and tourism integration, and other in-depth integrations create opportunities for the Internet economy and tourism economy. Western cities should seize the geometric diffusion effect of the Internet, strengthen the publicity and promotion of urban characteristics, build up the city’s brand, encourage tourism industry development, and determine a new advantage for the development of western cities in the Internet era.

Author Contributions

C.-H.X. was responsible for data collection and writing: Y.-P.B. proposed the research ideas and methods of the manuscript; C.-H.X. and Y.-P.B. were responsible for creating the figures and forms. All authors have read and agreed to the published version of the manuscript.

Funding

This research was funded by the Project of the National Natural Science Foundation of China (40771054), Foundation of Gansu Philosophy and Social Science Planning Project (2021YB025).

Institutional Review Board Statement

Not applicable.

Informed Consent Statement

Not applicable.

Data Availability Statement

Not applicable.

Acknowledgments

Thanks to the hard-working editors and valuable comments from reviewers.

Conflicts of Interest

The authors declare no conflict of interest.

References

  1. Plog, S. Why destination areas rise and fall in popularity: An update of a Cornell Quarterly classic. Cornell Hotel. Restaur. Adm. Q. 1974, 14, 55–58. [Google Scholar] [CrossRef]
  2. Wu, B.; Tang, J.; Huang, A.; Zhao, R.; Qiu, F.; Fang, F. A study on the choice behavior of Chinese urban residents’ tourist destination. Acta Geogr. Sin. 1997, 63, 3–9. [Google Scholar]
  3. Zhang, H.; Ying, S.; Wu, M. Topic identification and asymmetry effects of tourists’ perceived image of cultural tourism destinations: A case of canal city Shaoxing. Sci. Geogr. Sin. 2022, 42, 2131–2140. [Google Scholar]
  4. Jia, Y.; Zhu, M.; Zhang, J.; Sun, F. Effect of tourism destination perception on tourist citizenship behaviors An empirical study from Shandong and Qinghai provinces. J. Arid Land Resour. Environ. 2023, 37, 186–193. [Google Scholar]
  5. Long, C.; Shan, J.; Chai, X. Antecedents of Residents’Brand Ambassadorial Behavior for Tourism Destination:An Empirical Study Based on MOA Model. Econ. Probl. 2023, 96–105. [Google Scholar] [CrossRef]
  6. Wang, M.; Chen, X.; Lin, Y.; Zhu, L. Study on the influence of sports event experience on tourism destination brand: A case of Guangzhou Marathon. Tour. Trib. 2022, 37, 39–51. [Google Scholar]
  7. Huang, G.I.; Wang, X.; Wong, I.A. A Research on the Evolution of Destination Research Themes, Hot Topics and Trends: A Scientific Knowledge Mapping Study. Tour. Sci. 2022, 36, 106–124. [Google Scholar]
  8. Zheng, P.; Liu, Z.; Chen, J.; Xi, J.; Li, J. Evaluation of tourist destination competitiveness on Qinghai–Tibet Plateau: An county perspective and obstacle analysis. J. Arid Land Resour. Environ. 2023, 37, 177–185. [Google Scholar]
  9. Hui, T.-K.; Chi, C.Y. A study in the seasonal variation of Japanese tourist arrivals in Singapore. Tour. Manag. 2002, 23, 127–131. [Google Scholar] [CrossRef]
  10. Christine, L. The major determinants of Korean outbound travelto Australia. Math. Comput. Simul. 2004, 64, 477–485. [Google Scholar]
  11. Tang, J.C.; Sriboonchitta, S.S.; Yuan, X.Y. Forecasting inbound tourism demand to China using timeseries models and belief functions. Econom. Risk 2014, 583, 329–341. [Google Scholar]
  12. Reitsamer, B.F.; Brunner-Sperdin, A.; Stokburger-Sauer, N.E. Destination attractiveness and destination attachment: The mediating role of tourists’ attitude. Tour. Manag. Perspect. 2016, 19, 93–101. [Google Scholar] [CrossRef]
  13. Kotus, J.; Rzeszewski, M.; Ewertowski, W. Tourists in the spatial structures of a big Polish city: Development of an uncontrolled patchwork or concentric spheres? Tour. Manag. 2015, 50, 98–110. [Google Scholar] [CrossRef]
  14. Jin, C.; Lu, Y.; Fan, L. Research on spatial structure of domestic tourism source markets of Jiangsu. Econ. Geogr. 2010, 30, 2104–2108. [Google Scholar]
  15. Yang, X.; Ma, X. A spatial analysis and construction of domestic tourism of “Big Xi’an Tourism Circle”. Geogr. Res. 2004, 22, 695–704. [Google Scholar]
  16. Wei, G.; Yixue, L.; Hong, G. Research on inbound tourism market of Liaoning province based on tourism background trend line. Inf. Comput. Appl. 2012, 307, 783–788. [Google Scholar]
  17. Soshiroda, A.K. Inbound tourism policies in Japan from 1859 to 2003. Ann. Tour. Res. 2005, 32, 1100–1120. [Google Scholar] [CrossRef]
  18. Erdogan, K.; Galip, A. An analysis of seasonality in monthly per person tourist spending in Turkish inbound tourism from a market segmentation perspective. Tour. Manag. 2007, 28, 227–237. [Google Scholar]
  19. Lu, L. On the regional structure of Huangshan’s domestic tourist source market. Hum. Geogr. 1989, 3, 70–72. [Google Scholar]
  20. Liu, Z.; Gu, Z.; Wang, N.; Li, H.; Gu, J. The influence of leisure time constraint on spatial structure of domestic tourist market of Dr. Sun Yat-sen’s Mausoleum. Geogr. Res. 2013, 32, 1737–1746. [Google Scholar]
  21. Shao, Y.; Huang, S.; Wang, Y.; Li, Z.; Luo, M. Evolution of international tourist flows from 1995 to 2018: A network analysis perspective. Tour. Manag. Perspect. 2020, 36, 100752. [Google Scholar] [CrossRef]
  22. Öörni, A. Consumer Objectives and the Amount of Search in Electronic Travel and Tourism Markets. J. Travel Tour. Mark. 2004, 17, 3–13. [Google Scholar] [CrossRef]
  23. Rodríguez, J.; Semanjski, I.; Gautama, S.; Van de Weghe, N.; Ochoa, D. Unsupervised Hierarchical Clustering Approach for Tourism Market Segmentation Based on Crowdsourced Mobile Phone Data. Sensors 2018, 18, 2972. [Google Scholar] [CrossRef]
  24. Jing, X.; Yang, Y.; Cheng, J. Tracking discrepancies between expected and actual flows of tourists in an urban destination: An application of user-generated data. J. Hosp. Tour. Manag. 2022, 52, 29–38. [Google Scholar]
  25. Ding, Z.; Ma, F.; Zhang, G. Spatial differences and influencing factors of urban network attention by Douyin fans in China. Geogr. Res. 2022, 41, 2548–2567. [Google Scholar]
  26. Zhao, C.; Yang, Y.; Wu, S.; Wu, W.; Xue, H.; An, K.; Zhen, Q. Search trends and prediction of human brucellosis using Baidu index data from 2011 to 2018 in China. Sci. Rep. 2020, 10, 5896. [Google Scholar] [CrossRef]
  27. Flanagan, R.; Kuo, B.; Staller, K. Utilizing Google Trends to assess worldwide interest in irritable bowel syndrome and commonly associated treatments. Dig. Dis. Sci. 2021, 66, 814–822. [Google Scholar] [CrossRef] [PubMed]
  28. Aaronson, D.; Brave, S.A.; Butters, R.A.; Fogarty, M.; Sacks, D.W.; Seo, B. Forecasting unemployment insurance claims in realtime with Google Trends. Int. J. Forecast. 2022, 38, 567–581. [Google Scholar] [CrossRef]
  29. Ma, L.; Sun, G.; Huang, Y.; Zhou, R. Temporal and spatial correlation analysis of urban domestic passenger flow and tourist network attention. Econ. Geogr. 2011, 31, 680–685. [Google Scholar]
  30. Huang, X.; Zhang, L.; Ding, Y. Research on the relationship and prediction between Baidu index and tourist volume in tourist attractions––taking the Forbidden City of Beijing as an example. Tour. Trib. 2013, 28, 93–100. [Google Scholar]
  31. Zhang, G.; Yuan, H. Spatio-Temporal Evolution Characteristics and Spatial Differences in Urban Tourism Network Attention in China: Based on the Baidu Index. Sustainability 2022, 14, 13252. [Google Scholar] [CrossRef]
  32. Lai, J. The Development Path of Classic Red Tourism Scenic Spots: From the Perspective of the Evolution of Network Attention in Time and Space. Soc. Sci. 2022, 37, 44–51. [Google Scholar]
  33. Yuan, L.; Sun, G. Research on the spatial-temporal dynamic evolution and influencing factors of outbound tourism network attention: A case study on Thailand. J. Zhejiang Univ. 2023, 50, 1–15. [Google Scholar]
  34. Han, J.; Yang, Y.; Zhen, L. Research on the factors influencing network attention to Pingyao Ancient City under the impact of COVID-19. J. Arid Land Resour. Environ. 2023, 37, 203–208. [Google Scholar]
  35. Luo, W.; Wang, F.; Ding, Z. Spatial Difference and Influencing Factors of Douyin’s Network Attention of Red Scenic Spots in China. Econ. Geogr. 2023, 43, 198–210. [Google Scholar]
  36. Liang, X.; Ma, L. The Spatial Pattern and Formation Mechanism of Domestic Tourist Flow Circulations—Analysis Based on Network Attention Data. Tour. Trib. 2023, 38, 1–12. [Google Scholar]
  37. Sun, Y.; Zhang, H.; Liu, P.; Zhang, J. Research on the daily tourist volume forecast of tourist attractions based on tourists’ network attention–taking Baidu index of different clients as an example. Hum. Geogr. 2017, 32, 152–160. [Google Scholar]
  38. Li, H.; Li, D.; Dong, X.; Xu, N. Research on the spatial pattern of distribution and network attention of 5A scenic spots in China. J. Arid Land Resour. Environ. 2019, 33, 178–184. [Google Scholar]
  39. Zou, Y.; Lin, W.; Zheng, X. Spatial and temporal characteristics of tourism security network attention and its influencing factors. Tour. Trib. 2015, 30, 101–109. [Google Scholar]
  40. Liang, L.; Fu, H.; Li, J.; Li, B. Research on the spatiotemporal dynamic evolution and influencing factors of the network attention of the online celebrity city: Taking Xi’an as an example. Sci. Geogr. Sin. 2022, 42, 1566–1576. [Google Scholar]
  41. Wang, C.; Lu, C.; Ba, D.; Ma, B.; Qin, Z. The spatiotemporal evolution and influencing factors of the network attention of China’s representative ski resorts. J. Nat. Resour. 2022, 37, 2367–2386. [Google Scholar]
  42. Liu, H.; Hu, J.; Lv, L.; Zhang, H.; Cao, T. The impact of the COVID-19 on the spatial and temporal pattern of Wuhan tourism based on online attention. J. Arid Land Resour. Environ. 2023, 37, 194–202. [Google Scholar]
  43. Zhang, Y.; Ren, Y.; Liang, L. The temporal and spatial differences and influencing factors of the attention of China’s ice and snow tourism networkbased on the empirical data of Baidu Index 2011–2020. World Geogr. Res. 2023, 33, 1–15. [Google Scholar]
  44. Xu, J.; Wang, W.; Du, J. The spatial and temporal differences of red tourism network attention patterns and influencing factors in the six central provinces. J. Chongqing Univ. 2023, 29, 1–16. [Google Scholar]
  45. Jing, E.; Guo, F.; Li, R.; Zhang, J.; Fu, X. Research on the network attention of Hebei A-level scenic spots based on Sina Travel Blog. Geogr. Geo-Inf. Sci. 2015, 31, 118–122. [Google Scholar]
  46. Li, Y.; Gong, G.; Zhang, F. Network Structure Features and Influencing Factors of Tourism Flow in Rural Areas: Evidence from China. Sustainability 2022, 14, 9623. [Google Scholar] [CrossRef]
  47. Wang, K.; Guo, F.; Li, R.; Fu, X. International attention and spatial pattern of Chinese tourist destinations based on Tripadvisor. Prog. Geogr. 2014, 33, 1462–1473. [Google Scholar]
  48. Gao, N.; Zhang, X.; Wang, L. Spatial and temporal characteristics and influencing factors of China’s red tourism network attention. J. Nat. Resour. 2020, 35, 1068–1089. [Google Scholar]
  49. Chen, J.; Becken, S.; Stantic, B. Harnessing social media to understand tourist travel patterns in muti-destinations. Ann. Tour. Res. Empir. Insights 2022, 3, 100079. [Google Scholar] [CrossRef]
  50. Pan, X.; Rasouli, S.; Timmermans, H. Investigating tourist destination choice: Effect of destination image from social network members. Tour. Manag. 2021, 83, 32–43. [Google Scholar] [CrossRef]
  51. Liu, P.; Xiao, X.; Zhang, J. Spatial Configuration and Online Attention: A Space Syntax Perspective. Sustainability 2018, 10, 221. [Google Scholar] [CrossRef]
  52. Wang, X.; Zhang, J.; Liu, P.; Wang, X.; Ding, L. A dynamic study on the spatial structure of urban tourist market from the perspective of big data: Taking Nanjing as an example. Resour. Dev. Mark. 2018, 34, 77–82. [Google Scholar]
  53. Ma, L.; Hu, R. Dynamic analysis of Zhangjiajie’s domestic tourist market structure: Based on network attention data. Yunnan Geogr. Environ. Res. 2018, 30, 49–56. [Google Scholar]
  54. Zhu, Q.; Li, Z.; Yang, X. An Improvement of Evaluating Method on Tourist Concentration Degree with Geographic Concentration Index. Tour. Trib. 2011, 26, 26–29. [Google Scholar]
  55. Liu, S.; Tian, J.; Lu, L. A case study of Shanghai Disneyland on spatial structure forecast for proposed scenic spot market: Modification and its application of gravity model. Acta Geogr. Sin. 2016, 71, 304–321. [Google Scholar]
  56. Fang, Y.; Xie, M. The Effect of Innovation Elements Agglomeration on Regional Innovation Output: Based on Chinese Provinces and Cities’s ESDA-GWR Analysis. Econ. Geogr. 2012, 32, 8–14. [Google Scholar]
  57. Zhang, Y.; Jin, H.; Gu, X.; Ye, L.; Shao, Q. The evolution of economic spatial pattern based on the impact of ESDA-GWR multivariate: Taking the urban agglomeration in the middle reaches of the Yangtze River as an example. Econ. Geogr. 2015, 35, 28–35. [Google Scholar]
  58. Ma, L.; Xiao, Y. The structure characteristics of domestic tourist flow network in typical urban dweller. Econ. Geogr. 2018, 38, 197–205. [Google Scholar]
  59. Singhal, K.; Feng, Q.; Ganeshan, R.; Sanders, N.R.; Shanthikumar, J.G. Introduction to the special issue on perspectives on big data. Prod. Oper. Manag. 2018, 27, 1639–1641. [Google Scholar] [CrossRef]
  60. Chen, X. The development trend and practical innovation of smart cities under the integration of new technologies. Front. Eng. Manag. 2019, 6, 485–502. [Google Scholar] [CrossRef]
  61. Xu, X.; Pratt, S. Social media influencers as endorsers to promote travel destinations: An application of self-congruence theory to the Chinese Generation Y. J. Travel Tour. Mark. 2018, 35, 958–972. [Google Scholar]
  62. Prayag, G.; Ryan, C. The relationship between the ‘push’ and ‘pull’ factors of a tourist destination: The role of nationality-an analytical qualitative research approach. Curr. Issues Tour. 2011, 14, 121–143. [Google Scholar] [CrossRef]
  63. Li, X.R.; Lai, C.; Harrill, R.; Kline, S.; Wang, L. When east meets west: An exploratory study on Chinese outbound tourists’ travel expectations. Tour. Manag. 2011, 32, 741–749. [Google Scholar] [CrossRef]
  64. Zhang, Z.; Rob, L.; Liu, T. Tourism importance perception, tourism motivation and demographic characteristics: An empirical study based on Hong Kong resident survey data. Tour. Sci. 2012, 26, 76–84. [Google Scholar]
  65. Yang, Y.; Sui, X.; Liu, Z. Research on the spatial evolution characteristics of China’s inter-provincial virtual tourism flow network structure. Prog. Geogr. 2022, 41, 1349–1363. [Google Scholar] [CrossRef]
  66. Yang, Y.; Sun, G. Spatial and temporal dynamic analysis of urbanization promoting China’s domestic tourism development. Econ. Geogr. 2013, 33, 169–175. [Google Scholar]
  67. Chen, X.; Li, Y.; Wang, Y.; Cai, S. Online popular city, traffic effect and tourism development. J. Manag. Sci. China 2022, 25, 1–22. [Google Scholar]
  68. Zhang, H.; Fu, X.; Cai, L.A.; Lu, L. Destination image and tourist loyalty: A meta–analysis. Tour. Manag. 2014, 40, 213–223. [Google Scholar] [CrossRef]
  69. Bloch, P.H.; Bruce, G.D. The leisure experience and consumer products: An investigation of underlying satisfactions. J. Leis. Res. 1984, 16, 74–88. [Google Scholar] [CrossRef]
  70. Hew, E.Y.T.; Jahari, S.A. Destination image as a mediator between perceived risks and revisit intention: A case of post–disaster Japan. Tour. Manag. 2014, 40, 382–393. [Google Scholar]
Figure 1. Location of Chengdu, Sichuan Province, China.
Sustainability 15 08135 g001
Figure 2. The annual change index of Chengdu tourism network attention in 2011–2021.
Sustainability 15 08135 g002
Figure 3. Seasonal concentration index of Chengdu tourism network attention from 2011 to 2021.
Sustainability 15 08135 g003
Figure 4. Chengdu tourism network attention index in 2021.
Sustainability 15 08135 g004
Figure 5. Network attention of Chengdu tourism in 31 provinces (autonomous regions and cities) in China from 2011 to 2021. Regional division: the eastern region includes 11 provinces (municipalities), including Beijing, Tianjin, Hebei, Liaoning, Shanghai, Jiangsu, Zhejiang, Fujian, Shandong, Guangdong and Hainan; the central region includes Heilongjiang, Jilin, Shanxi, Anhui, Jiangxi, Henan, Hubei and Hunan; the western region includes Inner Mongolia, Guangxi, Chongqing, Sichuan, Guizhou, Yunnan, Tibet, Shaanxi, Gansu, Qinghai, Ningxia Xinjiang and has 12 provinces (autonomous regions and municipalities).
Sustainability 15 08135 g005
Figure 6. Moran’s I index of Chengdu tourism network attention from 2011 to 2021.
Sustainability 15 08135 g006
Figure 7. (ad) Local Moran’s index of Chengdu tourism network attention in 31 provinces (autonomous regions and municipalities) in 2011, 2014, 2018, and 2021.
Sustainability 15 08135 g007
Figure 8. Spatial distribution of regression coefficients of GWR model to Chengdu tourism network attention in 31 provinces (autonomous regions and municipalities) in 2018 and 2021.
Sustainability 15 08135 g008aSustainability 15 08135 g008bSustainability 15 08135 g008cSustainability 15 08135 g008d
Table 1. The serial number and name of each factor.
Number X1 X2 X3 X4 X5 X6
NamePopulation at the end of the yearGDP per capitaNumber of mobile internet usersNumber of higher education per 100,000 peopleUrbanization ratePassenger throughput
connotationPopulation sizeEconomic development levelNetwork development levelEducationUrbanization development levelTraveling population
Table 2. Tourist concentration coefficient of Chengdu tourism network attention.
20112012201320142015201620172018201920202021
G21.1820.8521.3222.0521.1520.6720.5920.1820.1226.6326.12
G ¯ 17.96
ΔG3.222.883.364.093.192.712.632.222.168.678.16
G 17.9516.0618.6822.8017.7715.0914.6212.3512.0148.2745.43
Table 3. GWR model results in 2018 and 2021.
IndexX1 X2 X3 X4 X5 X6
2018AICc420.45−23.47−158.73−77.2636.6659.79
R20.500.870.900.820.800.80
R2Adjusted0.490.850.890.800.800.80
2021AICc513.8212.79−84.89−47.65−15.9845.84
R20.510.820.880.860.810.82
R2Adjusted0.500.810.860.840.810.82
Disclaimer/Publisher’s Note: The statements, opinions and data contained in all publications are solely those of the individual author(s) and contributor(s) and not of MDPI and/or the editor(s). MDPI and/or the editor(s) disclaim responsibility for any injury to people or property resulting from any ideas, methods, instructions or products referred to in the content.

