Article

The Sorption Behaviors of Barium during Reinjection of Gas Field Produced Water into Sandstone Reservoir: An Experimental Water-Rock Interaction Study

1
CNPC Research Institute of Safety and Environment Technology Co., Ltd., Beijing 102206, China
2
State Key Laboratory of Petroleum Pollution Control, Beijing 102206, China
3
CNPC Quality and HSE Department, Beijing 100007, China
4
School of Water Resources and Environment, China University of Geosciences, Beijing 100086, China
*
Author to whom correspondence should be addressed.
Sustainability 2023, 15(10), 8132; https://doi.org/10.3390/su15108132
Submission received: 16 March 2023 / Revised: 27 April 2023 / Accepted: 8 May 2023 / Published: 17 May 2023
(This article belongs to the Special Issue Sustainable Groundwater Management Adapted to the Global Challenges)

Abstract

:
Identifying the fate of contaminants (such as barium) during gas field produced water reinjection could be a feasible method to evaluate the environmental risks of the reinjection project and thus improve its sustainability. To assess the barium sorption behaviors during gas field produced water reinjected into sandstone reservoirs, a series of water–rock interactions experiments were conducted to systematically investigate the effects of brine/rock ratio (5:1~500:1), pH (3~10), temperature (20, 50 and 80 °C), brine salinity (NaCl solution, 0~100 g/L), competitive cations (Sr and Mg, 0.5 g/L), and organic compound (methanol, 0~5 g/L) on the sorption of barium in sandstone. The rock samples were collected from the Triassic formation of the Yanchang Group in the northern Ordos Basin, China. The results indicated that the sorption of barium in sandstone strongly depends on the brine/rock ratio. Under the same brine/rock ratio, the severity of the impact on the barium sorption from high to low was competitive cation, salinity, pH, temperature, and methanol concentration. The sorption process of barium onto the sandstone could be well fitted by a pseudo-second-order kinetics model. The presence of competitive cations would restrain the sorption of barium, while the existence of methanol hardly affects the barium sorption. The chloro-complexation reaction and the reduction of rock surface electrical potential are mainly responsible for the inhibition effects of NaCl salinity on barium sorption, and the corresponding relationship can be characterized by an exponential function. Barium sorption in sandstone decreases with increasing temperature, while it is positively correlated to the initial pH of the solution. The water-rock system is weakly alkaline with a value of 7.7–8.5 when the barium sorption reaches an equilibrium state, regardless of the initial pH of the reactive solution. The results are meaningful in understanding and predicting the fate of barium after the gas field produced water was reinjected into the underground.

1. Introduction

Natural gas plays an important role in meeting global energy needs. Particularly, there is continuously increasing demand for natural gas worldwide to achieve carbon peaking and carbon neutrality goals, which leads to the rapid increase of natural gas production [1,2,3,4]. However, water challenges are closely associated with natural gas development [5,6]. On the one hand, hydraulic fracturing would consume large amounts of water resources. On the other hand, large and unavoidable wastewater produced from gas reservoirs would pose a potential threat to the surface water, groundwater and soil [7]. Wastewater, also known as gas field produced water, consists of hydraulic fracturing flowback fluid, drilling fluid, and formation brine [8]. Water quality analysis shows that the produced water has high salinity and different concentrations of organic pollutants, bacteria, suspended solids, natural radioactive material (U), and toxic metals [1,9,10]. Managing the produced water poses a significant challenge for the natural gas industry [5,8,11].
Considering the high cost of produced water treatment on the surface, underground injection has become a widely used disposal method in the oil and gas industry [5,12,13]. In some regions of the United States, most wastewater produced from conventional gas production (>95%) is disposed of through underground injection [8]. Meanwhile, approximately 70~80% of produced water from shale oil and gas production in the Permian Basin in the United States is disposed of in subsurface geological units [10]. Although underground injection has been proven to be an effective disposal method, environmental risks such as shallow groundwater contamination still exist because of the complex geological conditions [14,15,16,17]. To ensure security, the environmental risk analyses of produced water reinjection have led to numerous investigations. For example, Yin et al. established a regional hydrogeological model and then conducted a numerical modeling investigation to analyze the influences of the reinjection of produced water on the groundwater system [14]. Huang et al. proposed a framework to determine inorganic monitoring indicators for identifying groundwater contamination by produced water [15]. Rahm and Riha comprehensively analyzed the regional and collective impacts of shale gas development on water resources [16]. Silva et al. provide an overview of the environmental implications of unconventional gas sources, which shows that toxic and concerning pollutants, including dissolved salts, metals, organics, or even naturally occurring radioactive species, are found in produced water, thus requiring effective and cost-efficient solutions to minimize environmental impacts and concerns with public health [18]. In addition, the development of coalbed methane is also accompanied by the production of a large amount of water, posing a great threat to the ecological environment and human health [19].
The migration and sorption behaviors of heavy metals (such as Ba, Pb, Cd, Cr, and Sr et al.) in produced water reinjection formation are hot topics of concern among hydrogeologists and environmentalists [20,21,22]. The concentrations of heavy metals are usually hundreds or thousands of times over the drinking water standards, which would induce great environmental risk to shallow groundwater resources if the reinjected produced water leakages occur. Among these toxic metals, barium has gotten more attention due to its wide distribution, high concentration (usually ranging from 2300 mg/L to 4700 mg/L in western Pennsylvania), high toxicity, and high health risks [5,23,24]. Fard et al. conducted research on barium removal from synthetic natural and produced water using MXene as two dimensional (2-D) nanosheet adsorbent, which proves that MXene showed a large sorption capacity, fast kinetics, enormous trace barium removal, and reversible adsorption properties [23]. Underwood et al. investigated the relationship between Ba and SO4 and its application to anomalously high Ba concentrations found in the formation [24]. Ebrahimi and Vilcaez investigated the effect of brine salinity and guar gum on the sorption and migration of barium through dolomite rocks [25]. Their results show that brine salinity is a controlling factor of barium sorption on dolomite, and the transport of barium increases with an increase in brine salinity. In contrast, the presence of guar gum has little influence on the transport of barium. Additionally, Ebrahimi and Vilcaez performed research on the mobility and transport of barium in sandstone and dolomite rocks [26]. The results indicate that (1) the presence of NaCl, Ca, and Mg would inhibit sorption of barium, (2) temperature, guar gum, and dissolution of dolomite play an important role in barium sorption, (3) barium sorption inhibition in dolomite is higher than in sandstone. The experimental results from Ye and Prigiobbe showed that the sorption of barium on FeO(OH) decreases with NaCl solution salinity and increases with pH. In contrast, no significant changes in barium sorption were observed between 25 °C and 65 °C [27].
The difficult in conducting barium sorption and core-flooding experiments for a long time in the laboratory has resulted in the development of the reactive transport modeling. Ye and Prigiobbe proposed the triple-layer surface complexation model coupled with the Pitzer activity coefficient method and a reactive transport model to investigate the migration characteristics of barium through a porous medium containing FeO(OH) [27]. Based on the TOUGHREACT reactive transport simulator, Ebrahimi and Vilcaez performed reactive transport simulations to illustrate the chemical and mechanical retardation of barium migration in fractured sandstones and dolomites [28]. Vilcaez introduced a new reactive transport model using TOUGHREACT as a framework to determine the effect of pH and formation water/produced water compositions on the migration of barium in dolomite. The model includes sorption, dissolution/precipitation reactions of minerals, as well as complexation and acid-base reactions [29].
Although many works have been carried out on barium sorption behaviors at different conditions, the roles of brine/rock ratio and methanol concentrations are rarely reported. The data of barium sorption kinetic parameters at various pH, temperatures, and solution salinities are still limited, which is of great importance for reactive transport modeling. The relationships between barium sorption and pH, temperature, and solution salinity have not been established. Moreover, the relative importance of various influencing factors on barium sorption in sandstone requires further elucidation.
The abovementioned highlights the importance and necessity of further investigating the barium sorption behaviors in sandstone. In this work, sandstone samples and various barium chloride solutions were used to investigate the barium sorption characteristics. Sandstone was selected because it is the most common geological formation used to dispose of the produced water. Water–rock interaction experiments were conducted under different brine/rock ratios, pH, temperatures, salinities, competitive cations, and methanol concentrations. The pH and barium concentration were analyzed under specific time intervals for all the water–rock interaction experiments. The partition coefficients, equilibrium sorption capacity, and sorption kinetics fitting parameters at different experimental conditions were obtained. The effects of influencing factors on barium sorption were discussed. The relationships between barium sorption ratio/capacity and initial pH of solution, temperature, and solution salinity were established. The research results presented in this study could provide insight into the environmental risk evaluations associated with gas filed produced water underground injection.

2. Materials and Methods

2.1. Rock Samples

Sandstone samples used in this work were collected from the Triassic formation of the Yanchang Group in the northern Ordos Basin, China. The Ordos Basin is the second largest sedimentary basin and is one of the most important oil/gas supply bases in China [30]. The Basin is characterized by multiple layers of storage formations and sealing caprock and has a stable and simple geological structure even after several times of crustal movements [30,31].
The mineral composition of the sandstone sample was determined by quantitative X-ray diffraction (XRD) analysis. As presented in Table 1, the sandstone sample was dominated by plagioclase (39%) and quartz (38%), with low amounts of microcline (11%) and traces of chlorite, mica, and calcite. The major and minor element content obtained from X-ray fluorescence (XRF) analysis are shown in Table 2. The analysis results indicate that SiO2 and Al2O3 are the major elements in the experimental sample.
The high-pressure mercury intrusion method was performed to determine the pore size distribution and pore structure parameters of the sandstone sample. As presented in Figure 1, the most probable pore diameter is about 1.4 μm and the proportions of pores with diameters ranging from 0.1 to ~10 μm account for 73.5% of the total pore volume. According to the measurement results, the initial porosity and cumulative specific surface area of the sample are 12.8% and 1.17 m2/g, respectively. Given that wettability plays an important role in fluid–rock interactions and multi-phase fluid flow behaviors, the contact angles of deionized water on the sandstone surface were also measured [33,34]. As shown in Figure 2, the measured left and right contact angles are 30.13° and 28.56°, respectively, indicating that the sandstone sample was hydrophilic [35].
Based on the core flooding experimental apparatus, the brine permeability (200 mg/L BaCl2 solution) of the sample was measured using the steady-state method. The dimensions of the tested sample were 25.12 mm in diameter and 15.30 mm in length. The permeability experiments were conducted at room temperature and at a constant effective pressure (difference between the confining pressure and injecting pressure) of 4 MPa as well as at a constant injecting flow rate of 0.11 mL/min. When the movement of brine reached a steady state, the permeability was obtained according to Darcy’s law [36]. The calculated results indicate that the permeability of the experimental sample is 0.24 mD (2.4 × 10⁻¹⁶ m2).
The zeta potential, a measure of the electrical potential of the mineral surfaces, determines the thickness of the electrical double layer (EDL) at the rock surface and controls the electrostatic interactions between mineral surfaces and polar species in an aqueous solution [37,38]. Furthermore, zeta potential is a significant regulator of rock wettability as well as the cation exchange capacity of the rock surface [39,40]. The zeta potential is influenced by several critical parameters, including rock mineralogy, temperature, pressure, brine composition and salinity, and the pH value [37,38,41,42]. Considering its importance and complexity, a zeta potential analyzer was used to determine the zeta potential of the sandstone sample at room temperature and atmospheric pressure. The sample was crushed to 75 μm. The rock/water mixture was obtained by adding 1 g of rock powder to the 100 mL of deionized water. Following the procedure presented by Shehata et al., three times of measurements were conducted after the rock/water solution was shaken and remained for about 15 min [42]. The average value was taken as the zeta potential of the sandstone sample, which is −20.9 mV (see Table 3).

2.2. Water-Rock Interactions Experiments

Thirty groups of water–rock interaction experiments were performed in the Pyrex bottle to investigate the effects of the brine/rock ratio, pH, temperature, NaCl solution salinity, competitive cations, and methanol concentration on barium sorption onto sandstones at atmospheric pressure. Methanol was selected because it represents the common organic constituents presented in the gas field produced water. The sorption experiments were first conducted at different brine/rock ratios to determine the optimum brine/rock ratio for the following experiments. Detailed information on the experimental conditions is presented in Table 4.
Before the experiments, the bottle was cleaned three times with deionized water. After the bottle was dried, the powdered sandstone sample and the saline solutions were put into the bottle. The saline solutions were made by dissolving high-purity salts of BaCl2.2H2O (99.5%) in deionized water. For the influencing experiments of salinity, competitive cations, and methanol, the high-purity salts of NaCl (99.5%), SrCl2 (99%), or MgCl2.6H2O (98%), or methanol were added to the solution. For comparison, all experiments were performed at an initial barium concentration of ~200 mg/L, as presented in Table 4. The Pyrex bottles were placed in a constant temperature shaker, and the reactive time was 24 h under different brine/rock ratios, pH, temperatures, salinities, competitive cations, and methanol concentrations. To determine the relationship between barium concentration and time, brine samples were collected periodically, with time intervals of 0 h, 0.5 h, 1 h, 1.5 h, 2 h, 3 h, 5 h, 12 h, and 24 h. The sampled fluid (about 3 mL) was filtered using a 0.45 μm filter, diluted, and acidified with 2% HNO3. The concentration of barium in the sampled fluid was then measured by inductively coupled plasma-optical emission spectrometry (ICP-OES) analysis. Considering that pH plays an important role in the sorption of heavy metals, the pH value of the sample fluid was also measured for all the water–rock interaction experiments.

3. Experimental Result and Discussion

3.1. The Variations of pH and Barium Concentration with Time

The relationships between barium concentration and time presented in Figure 3a indicate that the brine/rock ratio is of essential importance to barium sorption on sandstone. The barium concentration at the sorption equilibrium state increases with increasing brine/rock ratio. When the brine/rock ratios are 5:1 and 10:1, the barium concentrations at equilibrium state are 46 mg/L and 126 mg/L, respectively. The equilibrium concentration of barium shows a small change when the brine/rock ratio changes from 20:1 to 500:1.
Under the same brine/rock ratio, the influences of pH, temperature, salinity, competitive cations, and methanol concentration on barium sorption present different variation trends. As shown in Figure 4, the salinity of NaCl solution (1~100 g/L), as well as competitive cations (Sr and Mg), have an important effect on the barium sorption onto sandstone. The pH (3.1~10.1) shows some influence, and the temperature (20–80 °C) shows little influence in barium sorption. By comparison, the methanol concentration (1–5 g/L) shows little influence in barium sorption onto sandstone, regardless of the initial pH (3.5 or 8.5) (Figure 5). The effects of different influencing factors on barium sorption are further discussed in Section 3.3.
From Figure 3, Figure 4 and Figure 5, it can be seen that when the reactive time is less than 5 h, the barium concentration decreases rapidly. The barium concentration remained almost unchanged when the reactive time was greater than 5 h. The results indicate that regardless of the experimental conditions, most of the barium sorption happened in the first 5 h. In addition, an interesting experimental phenomenon can be found in Figure 3, Figure 4 and Figure 5; that is, the pH value increases with the reactive time when the initial pH of the solution is less than 7.1, while the pH value decreases with the reactive time when the initial pH of the solution is bigger than 8.6. The water-rock system is weakly alkaline with a value of 7.7–8.5 when the barium sorption reaction reaches an equilibrium state, regardless of the initial pH of the reactive solution. This may be attributed to the fact that the minerals in sandstone have a pH-buffering effect; namely, the reactive process is accompanied by the dissolution of rock minerals [43,44].

3.2. Sorption Kinetics Fitting

To better understand the sorption process, the pseudo-first-order kinetics model and pseudo-second-order kinetics model were adopted to fit the sorption amount of barium on sandstone at different times. The expression of the pseudo-first-order kinetics model is as follows [45]:
q t = q e 1 e K 1 t
The pseudo-second-order kinetics model is expressed as [45]:
q t = q e 2 K 2 t 1 + q e K 2 t
where the q e is the equilibrium sorption capacity, q t is the sorption amount at the time of t, K 1 and K 2 is the reaction rate constant of the pseudo-first-order kinetics model and pseudo-second-order kinetics model, respectively. The equilibrium sorption capacity and reaction rate constant are crucial parameters to characterize the barium sorption process, which is closely related to sorption conditions.
To intuitively reveal the fitting results, the combination of experimental data and fitting results was plotted, which depicts the sorption amount as a function of time (Figure 6). For simplicity, this work only presents the fitting results of barium sorption under different salinities. The sorption kinetics fitting results for other influencing factors are summarized in Table 5. Analysis of sorption kinetics showed that the sorption of barium in sandstone is well-fitted by both the pseudo-first-order kinetics model and the pseudo-second-order kinetics model. By contrast, as presented in Table 5, the R-squared (R2) obtained from the pseudo-second-order kinetics model fitting is bigger than the value of the R2 fitted from the pseudo-first-order kinetics model. Thus, in Section 3.3, the equilibrium sorption capacity (qe) and reaction rate constant (K2) obtained from the pseudo-second-order kinetics model were used to discuss further the effects of various influencing factors on barium sorption in sandstone.

3.3. Discussion

In order to quantitatively characterize the effects of experimental variables on barium sorption in sandstone samples, the sorption ratio and partition coefficient were calculated. The sorption ratio of barium ( S r b ) was obtained according to the following equation [25]:
S r b = C i C e C i × 100 %
where the C i is the initial concentration of barium, C e is the concentration of barium at the reaction equilibrium state. The partition coefficients (Kd, L/kg) between the solid and solution were calculated following the equation [46,47]:
K d = C i C e C e × V m
where V is the volume of solution (L), and m is the mass of rock powder (kg).

3.3.1. The Effect of the Brine/Rock Ratio

Figure 7 illustrates the variations of the barium sorption ratio, partition coefficient, barium equilibrium sorption capacity, and reaction rate constant with brine/rock ratio. It can be seen that the brine/rock ratio plays a significant role in barium sorption under experimental conditions. Both the barium sorption ratio and reaction rate constant are negatively correlated to the brine/rock ratio. The barium sorption ratio at a brine/rock ratio of 5:1 is as high as 80%, whereas the value is 1.3% at a brine/rock ratio of 500:1. Comparably, there is no pronounced relationship between the partition coefficient/barium equilibrium sorption capacity and brine/rock ratio. Thus, choosing an appropriate brine/rock ratio is the premise for investigating the effects of various influencing factors on barium sorption. For barium to be adsorbed by sandstone sample as much as possible, as presented in Table 3, the brine/rock ratio of 5:1 was used in this work. Considering that methanol is liquid, a brine/rock ratio of 10:1 is adopted for barium sorption at different methanol concentrations. From the literature that has been reported, a brine/rock ratio of 10:1 was also adopted by Lu et al. to conduct geochemical interaction investigations of shale/sandstone and brine in an autoclave [48].

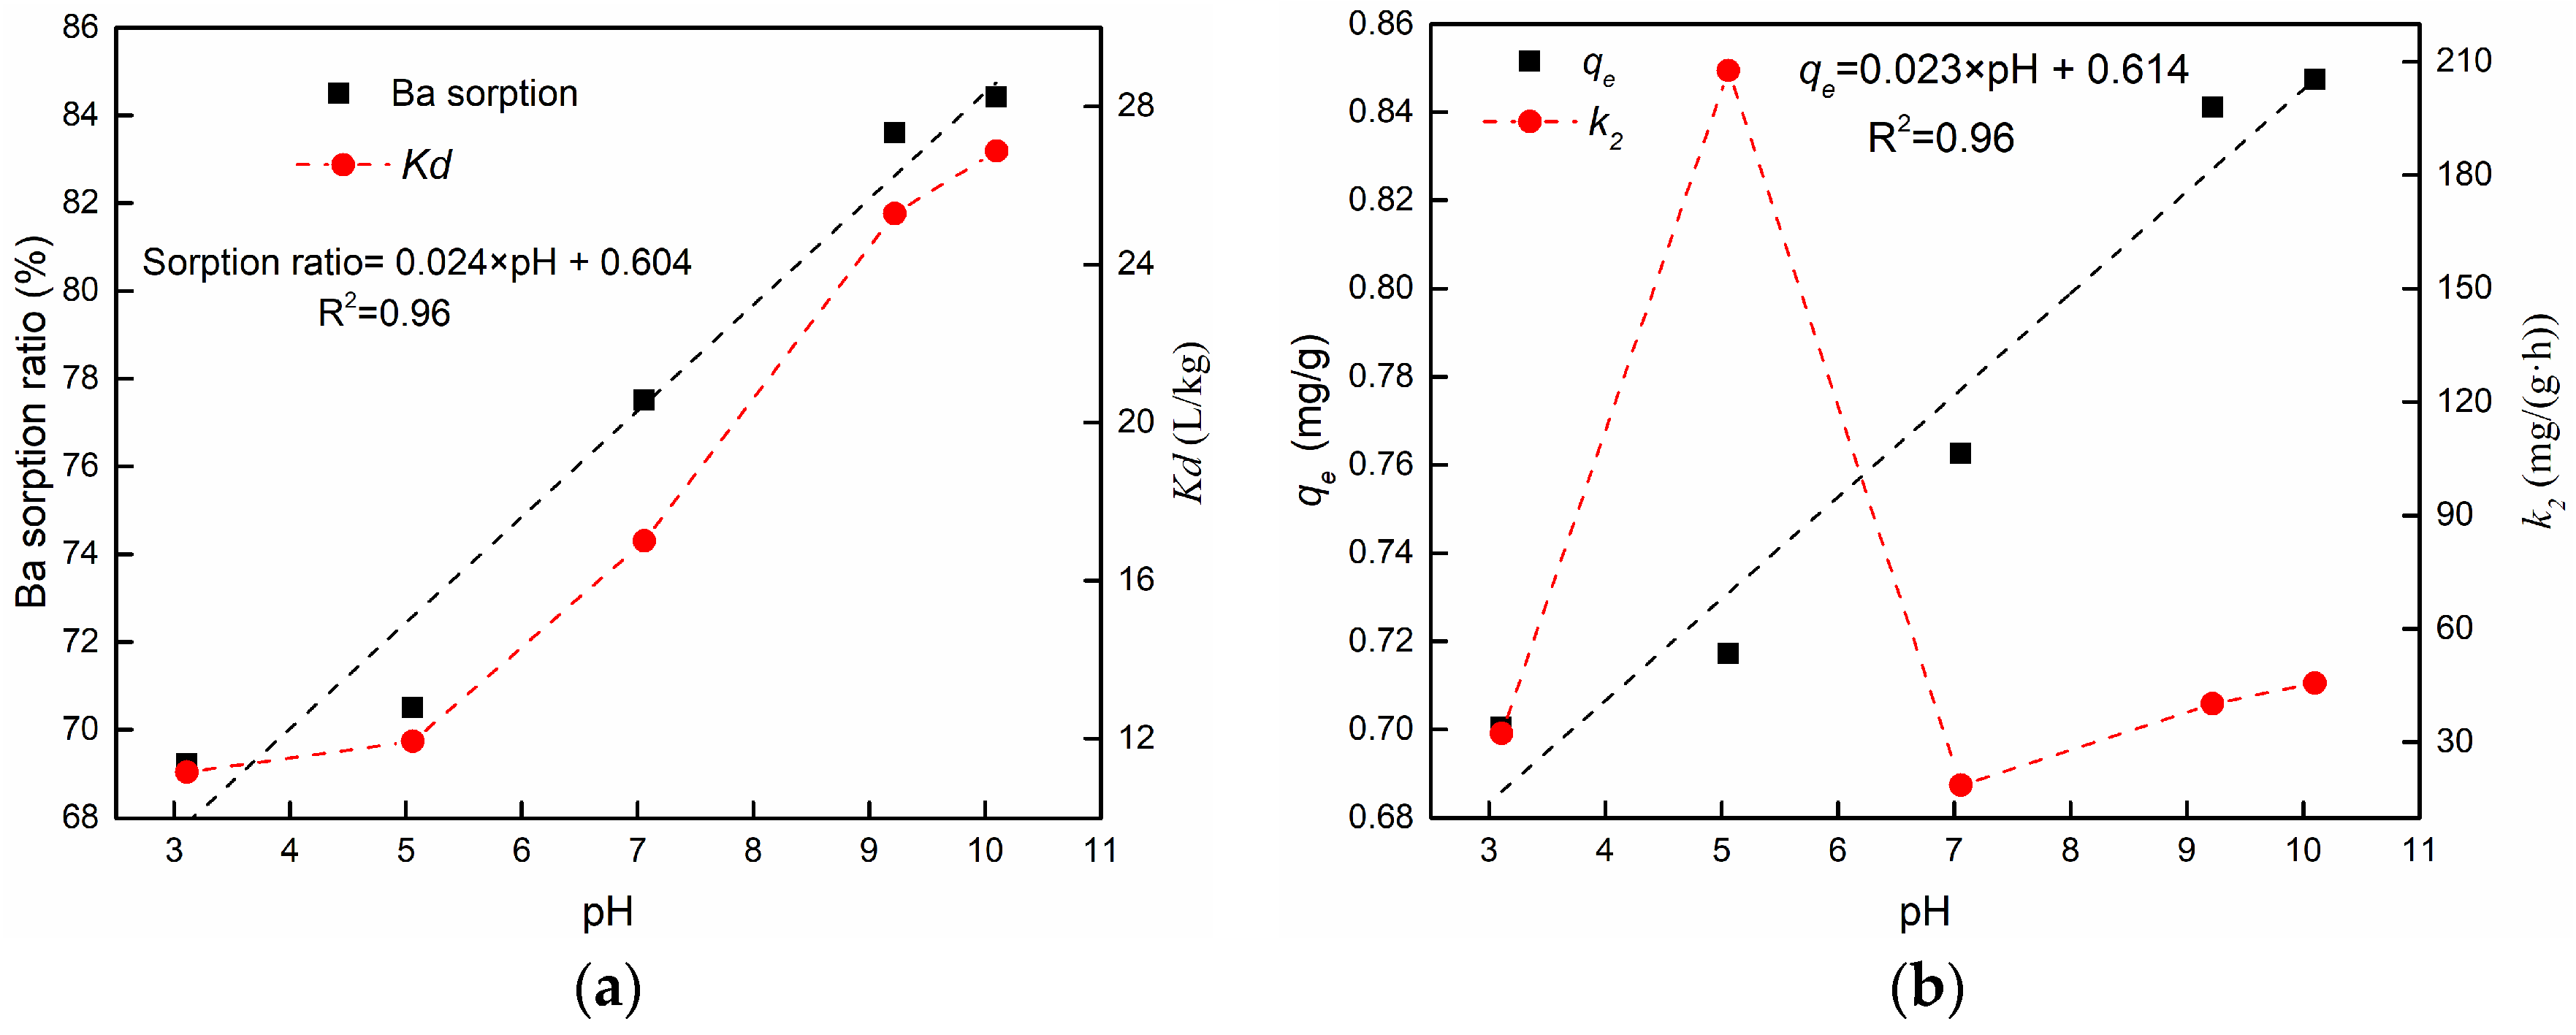
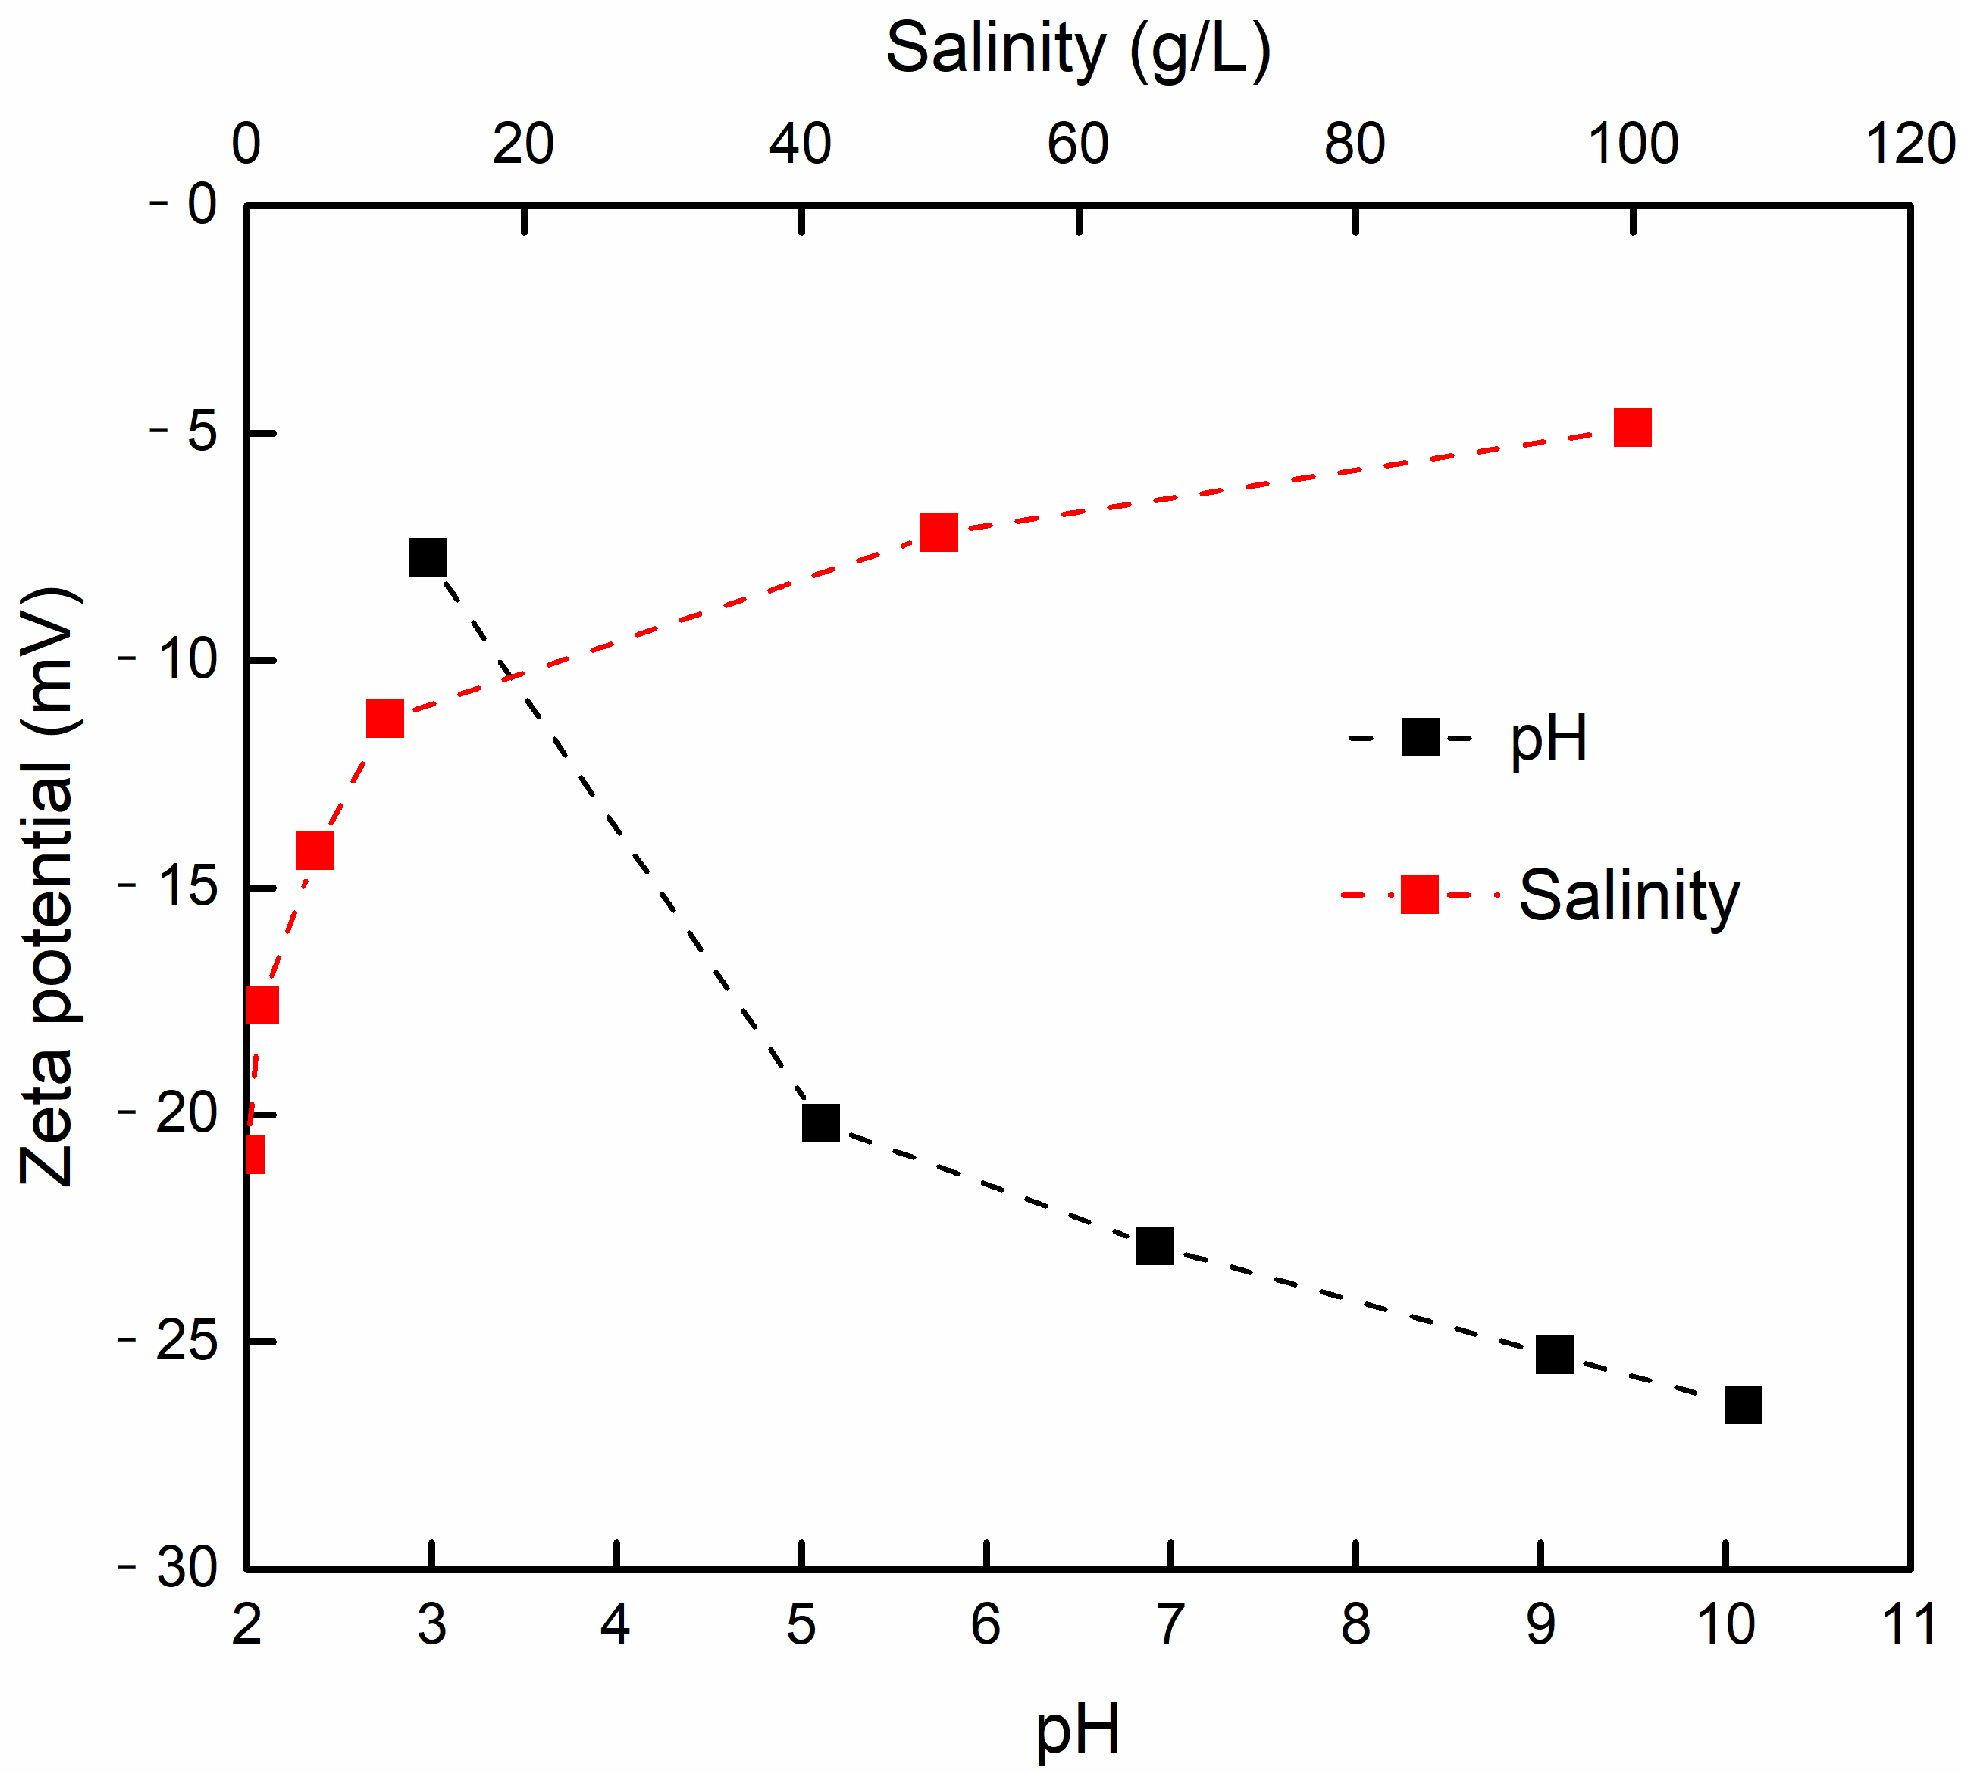
3.3.2. The Effect of pH

Barium sorption in sandstone does not only rely on the brine/rock ratios but also on the solution pH. In order to quantitatively clarify the variation trends in sorption ratio and equilibrium sorption capacity with pH, fitting curves were plotted. As illustrated in Figure 8, both the sorption ratio and equilibrium sorption capacity are positively correlated to the initial pH of the solution, and the corresponding increase proportions are 21.96% and 20.95%, respectively, while the pH increases from 3 to 10. The changes in sorption ratio ( S r b ) and equilibrium sorption capacity ( q e ) with the pH can be characterized by:
S r b / q e = γ 1 × p H + β 1
where the γ 1 and β 1 are the fitting parameters. Compared with the sorption ratio, partition coefficient, and equilibrium sorption capacity, there is no obvious relationship between the reaction rate constant and pH.
There is a higher concentration of H+ when the brine solution is acidic. The rock surface is preferred to adsorb H+ rather than Ba2+. The sorption of H+ would lead to a rapid decay in the rock surface electrical potential and surface polarity, causing lower barium sorption capacity. Moreover, higher equilibrium sorption capacity at higher pH also can be attributed to the dissolution of minerals, which increases the negatively charged surface sorption sites of rock minerals [26,43,49].
Additionally, the increase (more negative) of zeta potential with increasing pH also increases the barium sorption. The existing studies have shown that the testing results of the zeta potential of sandstones are highly sensitive to the pH of the solution, shown as zeta potential increases (more negative) with an increase in the pH value [37,42,50]. For the sandstone sample used in this work, the variation of the zeta potential with the initial pH of the solution is presented in Figure 9. During the measurement, the pH of the solution was adjusted using either hydrochloric acid (HCl) or sodium hydroxide solution (NaOH). As illustrated in Figure 9, a small change in solution pH can lead to a significant change in the zeta potential, which changes from −7.74 mV to −26.4 mV when the pH increases from 2.98 to 10.1. The increased zeta potential means that electrostatic interactions between mineral surfaces and polar species in an aqueous solution become more intense, thus causing an increase in barium sorption.

3.3.3. The Effect of Temperature

Temperature variations also affect the sorption of heavy metals on solid surfaces [51,52,53]. The barium sorption in sandstone under different temperatures indicate that the sorption ratio, partition coefficient, and equilibrium sorption capacity reduced with increasing temperature (Figure 10). In contrast, the reaction rate constant increased with an increase in temperature. When the temperature increases from 20 °C to 80 °C, the sorption ratio and equilibrium sorption capacity decrease by 5.73% and 3.30%, respectively. By fitting the experimental results, the variation of the sorption ratio ( S r b ) and equilibrium sorption capacity ( q e ) with temperature can be described by a linear function, shown as follows:
S r b / q e = γ 2 × T e m p e r a t u r e + β 2
where the γ 2 and β 2 are the fitting parameters. Compared with γ 1 , the γ 2 is two orders of magnitude smaller, which reveals that the influence of pH on the barium sorption in sandstone is much bigger than that of temperature. Although the sorption ratio of barium in the sandstone sample decreases with increasing temperature, the reduced proportion indicates that over the temperature range studied (20~80 °C), the temperature variation would not significantly influence the barium sorption.
The batch sorption experiments performed by Ebrahimi and Vilcaez also found that equilibrium barium sorption on sandstone decreased from 22.2% to 20.2% by increasing temperature from 22 °C to 60 °C [19]. The barium sorption on magnesite follows the same variation trend [52]. Similar experimental results have been reported on the sorption of zinc (Zn) on kaolin clay minerals, where the adsorption amount of zinc metal ions decreases with an increase in the temperature of the system [53]. The aforementioned experimental results are probably attributed to the fact that the sorption reaction is exothermic. Increasing the system temperature will reduce the sorption capacity of rocks. However, completely opposite research results were found in the sorption of Ni (II) in Na-attapulgite. Fan et al. showed that the sorption of Ni (II) in Na-attapulgite increase with increasing temperature [54]. The results calculated from the temperature-dependent sorption isotherms suggest that Ni’s sorption process is endothermic, leading to different experimental phenomena.

3.3.4. The Effect of Salinity

Figure 11 shows barium sorption in sandstone as a function of NaCl solution salinity, which reveals that the sorption ratio decreases from 84.42% to 11.46% and equilibrium sorption capacity decreases from 0.85 mg/g to 0.10 mg/g by increasing the salinity from 0 g/L to 100 g/L. The reduction ranges are as high as 86.42% and 88.03%, respectively. These characteristics are consistent with the previous studies reported by Ebrahimi and Vilcaez, where the barium sorption on dolomite decreased with an increase in brine salinity [25]. Increasing brine salinity would greatly reduce barium sorption, denoting that salinity plays an important role in barium sorption on sandstone. Lower barium sorption amount at higher brine salinity suggests higher mobility of barium in sandstone. In other words, the increase in salinity would lead to an increase in barium mobilization. The conclusion also applies to the mobility of heavy metals, where the salinity would increase heavy metal mobilization in soils [55]. The curves illustrated in Figure 11 show that both the sorption ratio ( S r b ) and equilibrium sorption capacity ( q e ) have an exponential function relation with salinity. The relationships can be described as follows:
S r b / q e = γ 3 × exp β 3 × S a l i n i t y
where the γ 3 and β 3 are the fitting parameters. Furthermore, the results indicated that the sorption of barium on sandstone did not dramatically change with increasing NaCl solution salinity from 50 g/L to 100 g/L. The barium sorption ratio at a brine salinity of 50 g/L is 17.91%, whereas the barium sorption is 11.46% at a brine salinity of 100 g/L. Similar conclusions also apply to the sorption of Ba, Sr, Se, and As on dolomite, where the sorption does not substantially change with increasing salinity from 18 g/L to 90 g/L [56].
The influence of brine salinity on reducing barium sorption onto sandstone can be attributed to two aspects. On the one hand, the chloro-complexation reaction, shown in Equation (8), exerts a significant effect on the sorption of barium [25,55,57].
B a 2 + + C l B a C l +
The formed complexes ( B a C l + ) in solution tend to be less electrostatically attracted than barium ion (Ba2+) by negatively charged sorption sites of sandstone. The conclusions obtained by Vilcaez revealed that at typical C l concentrations in produced water, the formation of B a C l + complexes would reduce the availability of B a 2 + to form surface complexes with hydration sites of dolomite [29]. Similarly, this explanation also can be applied to the barium sorption on sandstone at high concentrations of NaCl solution.
On the other hand, the reason influencing barium sorption on sandstone at different NaCl salinities is the change in the zeta potential of sandstone with salinity. The zeta potential of sandstone becomes more negative when the salinity of the brine decreases [42,58]. Conversely, the absolute value of zeta potential becomes smaller with increasing brine salinity. For the sandstone sample used in this work, the zeta potential decreases from −20.9 mV to −4.9 mV when the brine salinity increases from 0 to 100 g/L (Figure 9). The reduction magnitude is up to 76.56%. Moreover, it can be seen from Figure 11 that the variations of sorption ratio/equilibrium sorption capacity with brine salinity are consistent with the change of the zeta potential with brine salinity presented in Figure 9. When the brine salinity is larger than 50 g/L, the zeta potential, sorption ratio, and equilibrium sorption capacity change slightly. The reduction of zeta potential leads to the weakening of electrostatic interactions between cations (Ba2+) in the brine and rock surface. Consequently, the barium sorption on sandstone was reduced with increased brine salinity.

3.3.5. The Effect of Cations Competition

When the concentration of NaCl equals 0 g/L, the presence of competitive cations, such as magnesium (Mg) and strontium (Sr), would also reduce the barium sorption on sandstone. As presented in Figure 12, the presence of Mg and Sr leads to a reduction of the sorption ratio from 84.42% to 47.20% and 42.49%, respectively, and the equilibrium sorption capacity decreases from 0.85 mg/g to 0.48 mg/g and 0.42 mg/g, respectively. Apart from the Sr and Mg, the existence of Ca in produced water would also inhibit the sorption of barium on sandstone or dolomite [26,29]. The decreasing sorption ratio/capacity due to the presence of Sr, Mg, and Ca results from competition sorption among cations for negatively charged sorption sites of sandstone.
The competition of cations for hydration sites of sandstone plays an important role in the sorption of barium [29]. The dependency of barium sorption in sandstone on the competition of cations for hydration sites can be expressed by the surface complexation model (SCM) proposed by Van Cappellen et al. [59]. Based on this model, the formation of complexes with Ca2+, Mg2+, and Sr2+ at sandstone surfaces would reduce hydration sites for Ba2+, thus reducing barium sorption.
Compared with the salinity, Ebrahimi and Vilcaez found that the brine salinity controls barium sorption rather than competitive cations [25]. However, it can be seen in Figure 12 that when the concentrations of Sr2+ and Mg2+ equal 500 mg/L, the corresponding barium sorption ratios are 42.5% and 47.2%, respectively. Comparably, the barium sorption ratio is 46.6% when the concentration of NaCl solution is as high as 10,000 mg/L. Thus, the effects of competition cations (Sr and Mg) on barium sorption are greater than that of NaCl solution salinity under the experimental conditions.

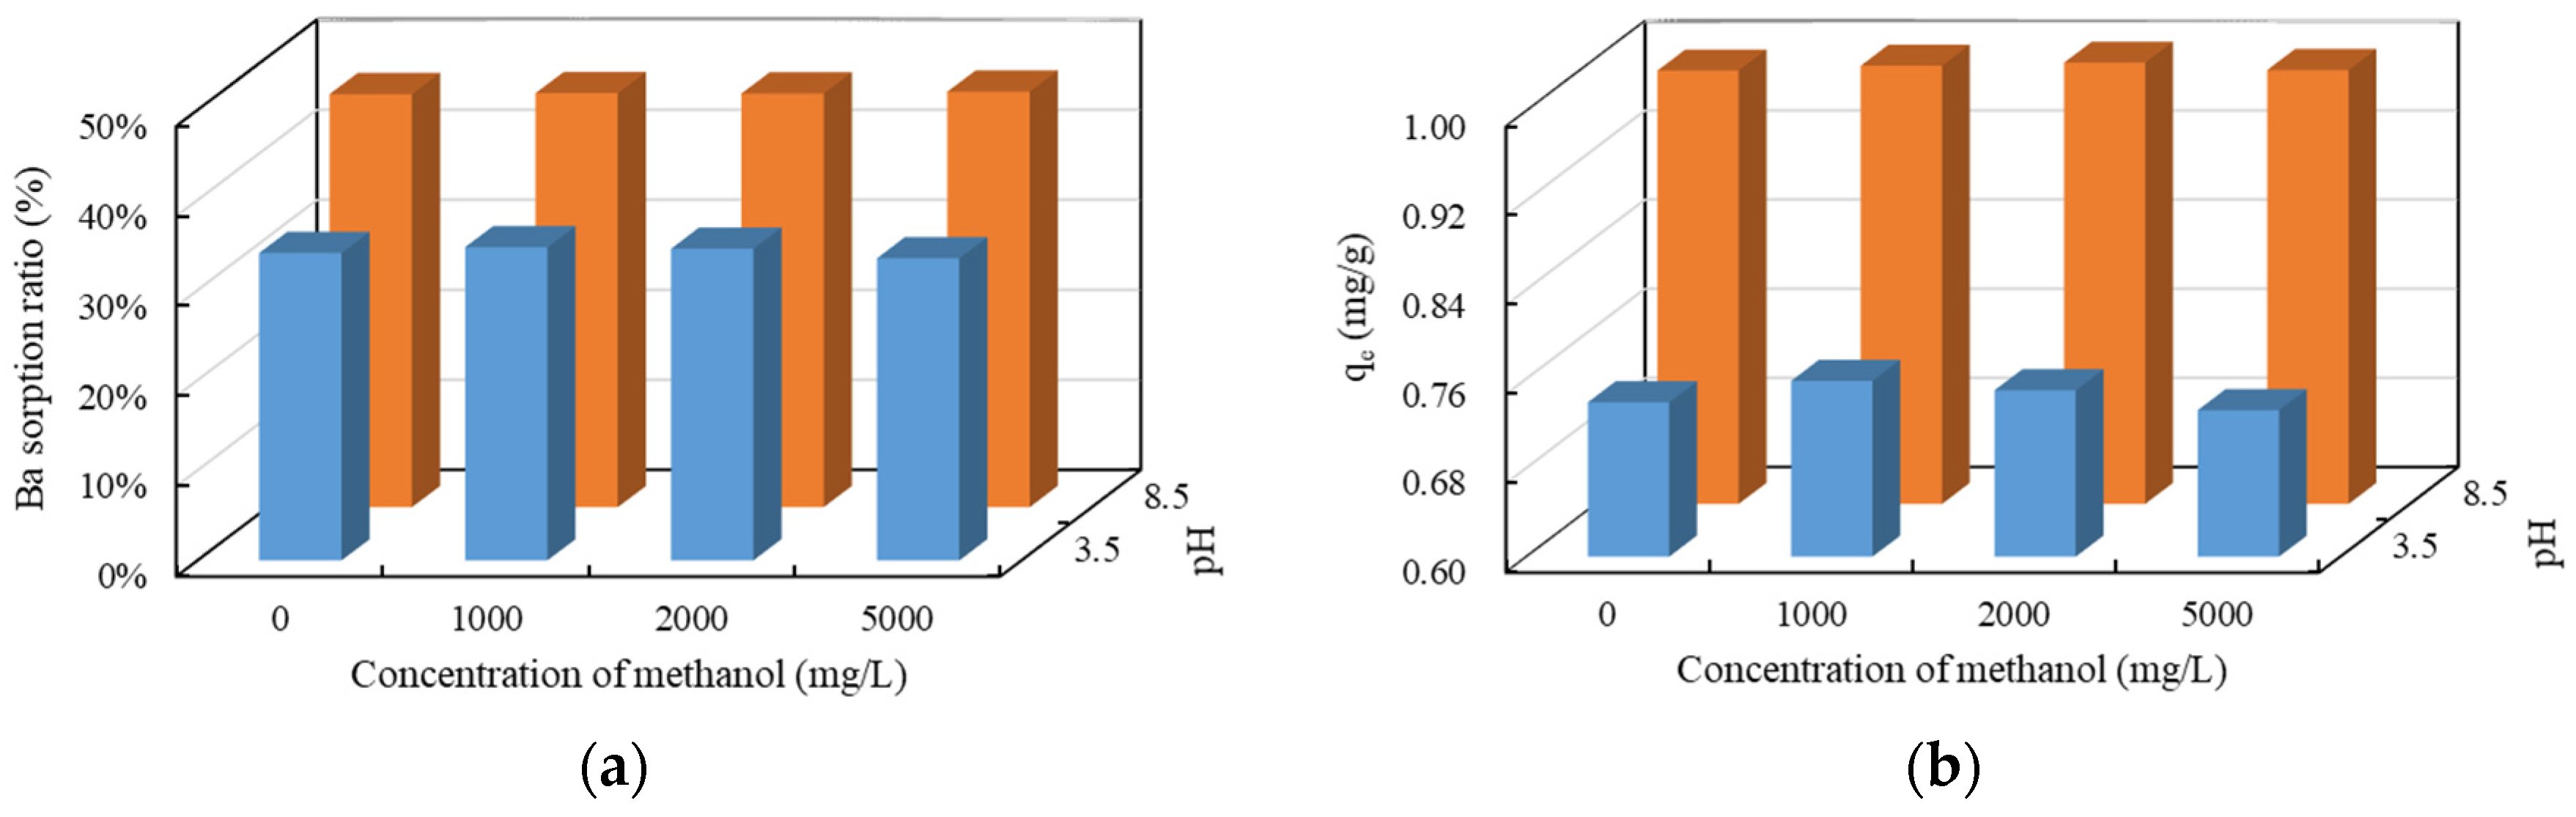
3.3.6. The Effect of Methanol

The sorption ratio and equilibrium sorption capacity of barium at different methanol concentrations are presented in Figure 13. When the methanol concentrations increased from 0 mg/L to 5000 mg/L, the fluctuations of the sorption ratio and equilibrium sorption capacity were within 1.2% and 0.026 mg/g, respectively. Therefore, it can be inferred that the methanol concentrations hardly affect the barium sorption under the experimental conditions, whether the pH is 3.5 or 8.5. The limited influence of methanol on barium sorption in sandstone may be attributed to the fact that the existence of methanol would neither weaken the electrical potential of sandstone surfaces nor compete with barium sorption.
Apart from the methanol, the results obtained from Ebrahimi and Vilcaez also indicated that the concentrations of guar gum (50~500 mg/L) have little effect on the sorption and transport of barium in dolomite rocks with high permeability [25,26]. However, the presence of guar gum can attenuate the migration of barium in tight dolomite rocks by blocking the pore throats. Comparably, soil organic matter (SOM) plays a crucial role in slowing down desorption reactions of lead (Pb) from the soil materials. The results presented by Strawn and Sparks showed that the rate of Pb sorption decreases with increasing SOM content, and the fraction of Pb desorbed from the soil decreases with an increase in the amount of SOM in the soil [60]. Therefore, it can be inferred that different organic compounds have different effects on the sorption behaviors of heavy metals. The results presented in this work and in Ebrahimi and Vilcaez have demonstrated that the methanol and guar gum have a small effect on barium sorption on sandstone and dolomite [25,26]. Future investigations could focus on the effects of benzene, toluene, or other organic matter commonly found in produced water on the barium sorption in formation rocks.
The above analyses show that the presence of methanol hardly affects the barium sorption, and a higher pH value will promote the removal of barium from produced water. In contrast, higher temperature and salinity and more competitive cations will inhibit the sorption of barium in sandstone, exhibiting negative effects on the removal of barium. The experimental results indicate that choosing the reinjection formation with higher pH and lower temperature and salinity will contribute to the removal of barium and other heavy metal ions, thus reducing the environmental risks when reinjected produced water leakage occurs.

4. Conclusions

The barium sorption onto the sandstone strongly depends on the brine/rock ratio behavior, as the sorption ratio is negatively correlated to the brine/rock ratio. Under the same brine/rock ratio, the competitive cations play a major role, and the brine salinity plays a secondary role, followed by pH and temperature. Methanol hardly affects the sorption of barium. The sorption process can be well-fitted by a pseudo-second-order kinetics model.
The sorption ratio ( S r b ) and equilibrium sorption capacity ( q e ) have an exponential function relation with salinity, which can be described as follows: S r b / q e = γ × exp β × S a l i n i t y , where the γ and β are fitting parameters. When the salinity increases from 0 g/L to 100 g/L, the S r b and q e decreases from 84.42% to 11.46% and 0.85 mg/g to 0.10 mg/g, respectively. The chloro-complexation reaction and the reduction of rock surface electrical potential are primarily responsible for the inhibition effects of NaCl salinity on barium sorption. The effects of competitive cations on barium sorption mainly result from competition for negatively charged sorption sites of sandstone, causing a decrease in the sorption ratio and equilibrium sorption capacity.
The changes in barium sorption with pH or temperature can be characterized by a linear function, shown as: S r b / q e = γ 1 × p H / t e m p e r a t u r t e + β 1 , where γ 1 and β 1 are fitting parameters. When the pH increases from 3 to 10, the increases in the sorption ratio and equilibrium sorption capacity are 21.96% and 20.95%, respectively. For the temperature increasing from 20 °C to 80 °C, the sorption ratio and equilibrium sorption capacity decreased by 5.73% and 3.30%, respectively.

Author Contributions

Conceptualization, S.Y. and S.L.; methodology, S.Y.; investigation, S.Y., K.Z., M.C. and C.C.; writing—original draft, S.Y.; writing—review and editing, S.Y. and S.L.; funding acquisition, S.Y., K.Z. and S.L.; supervision, K.Z. and X.Z. All authors have read and agreed to the published version of the manuscript.

Funding

The work was supported by the Scientific Research and Technology Development Project of CNPC (Grant Nos. 2021DQ03-A2, 2021DJ6602 and RISE2022KY06).

Institutional Review Board Statement

Not applicable.

Informed Consent Statement

Not applicable.

Data Availability Statement

The data used in this study are available online: https://doi.org/10.6084/m9.figshare.22640197.v1 (accessed on 15 March 2023).

Acknowledgments

We thank anonymous reviewers for their comments and suggestions that greatly improved the manuscript.

Conflicts of Interest

The authors declare no conflict of interest.

References

  1. Gao, J.; Zou, C.; Li, W.; Ni, Y.; Liao, F.; Yao, L.; Sui, J.; Vengosh, A. Hydrochemistry of flowback water from Changning shale gas field and associated shallow groundwater in Southern Sichuan Basin, China: Implications for the possible impact of shale gas development on groundwater quality. Sci. Total Environ. 2020, 713, 136591. [Google Scholar] [CrossRef] [PubMed]
  2. Hafezi, R.; Akhavan, A.; Pakseresht, S.; Wood, D.A. Global natural gas demand to 2025: A learning scenario development model. Energy 2021, 224, 120167. [Google Scholar] [CrossRef]
  3. Yang, S.; Yu, Q. The coupling effects of pore structure and rock mineralogy on the pre-Darcy behaviors in tight sandstone and shale. J. Petrol. Sci. Eng. 2022, 218, 110945. [Google Scholar] [CrossRef]
  4. Yang, S.; Yu, Q. Experimental investigation on the movability of water in shale nanopores: A case study of Carboniferous shale from the Qaidam Basin, China. Water Resour. Res. 2020, 56, e2019WR026973. [Google Scholar] [CrossRef]
  5. Gregory, K.B.; Vidic, R.D.; Dzombak, D.A. Water Management Challenges Associated with the Production of Shale Gas by Hydraulic Fracturing. Elements 2011, 7, 181–186. [Google Scholar] [CrossRef]
  6. Wang, C.; Su, Y.; Wang, W.; Li, L.; Zhang, L.; Wang, T. Water blocking damage evaluation and mitigation method in tight gas reservoirs. Energy Fuels 2022, 36, 10934–10944. [Google Scholar] [CrossRef]
  7. Kang, M.; Jackson, R.B. Salinity of deep groundwater in California: Water quantity, quality, and protection. Proc. Natl. Acad. Sci. USA 2016, 113, 7768–7773. [Google Scholar] [CrossRef]
  8. Lutz, B.D.; Lewis, A.N.; Doyle, M.W. Generation, transport, and disposal of wastewater associated with Marcellus shale gas development. Water Resour. Res. 2013, 49, 647–656. [Google Scholar] [CrossRef]
  9. Abdelrazeq, H.; Khraisheh, M.; Ashraf, H.M.; Ebrahimi, P.; Kunju, A. Sustainable innovation in membrane technologies for produced water treatment: Challenges and limitations. Sustainability 2021, 13, 6759. [Google Scholar] [CrossRef]
  10. Scanlon, B.R.; Reedy, R.C.; Wolaver, B.D. Assessing cumulative water impacts from shale oil and gas production: Permian Basin case study. Sci. Total Environ. 2022, 811, 152306. [Google Scholar] [CrossRef]
  11. Cui, X.; Zheng, Z.; Zhang, H.; Zhang, C.; Li, X.; Zhu, P.; Chen, Z. Impact of water-rock interactions on indicators of hydraulic fracturing flowback fluids produced from the Jurassic shale of Qaidam Basin, NW China. J. Hydrol. 2020, 590, 125541. [Google Scholar] [CrossRef]
  12. Grant, F. Deep injection of waste water in the western Canada sedimentary basin. Groundwater 2014, 53, 187–194. [Google Scholar] [CrossRef]
  13. Waly, M.M.; Mickovski, S.B.; Thomson, C. Application of circular economy in oil and gas producedwater treatment. Sustainability 2023, 15, 2132. [Google Scholar] [CrossRef]
  14. Yin, W.; Hu, L.; Yao, L.; Teng, Y. Numerical investigation of the influence of underground water injection on the groundwater system in a shale gas reservoir in Southwestern China. Environ. Earth Sci. 2016, 75, 1092. [Google Scholar] [CrossRef]
  15. Huang, T.; Pang, Z.; Li, Z. A framework to determine sensitive inorganic monitoring indicators for tracing groundwater contamination by produced formation water from shale gas development in the Fuling Gasfield, SW China. J. Hydrol. 2020, 581, 124403. [Google Scholar] [CrossRef]
  16. Rahm, B.G.; Riha, S.J. Toward strategic management of shale gas development: Regional, collective impacts on water resources. Environ. Sci. Policy 2012, 17, 12–23. [Google Scholar] [CrossRef]
  17. Pearce, J.K.; Khan, C.; Golding, S.D.; Rudolph, V.; Underschultz, J. Geological storage of CO2 and acid gases dissolved at surface in production water. J. Petrol. Sci. Eng. 2022, 210, 110052. [Google Scholar] [CrossRef]
  18. Silva, T.L.S.; Morales-Torres, S.; Castro-Silva, S.; Figueiredo, J.L.; Silva, A.M. An overview on exploration and environmental impact of unconventional gas sources and treatment options for produced water. J. Environ. Manag. 2017, 200, 511–529. [Google Scholar] [CrossRef] [PubMed]
  19. Peng, X.-L.; Wang, C.-W.; Chen, X.-F.; Jia, C.-S.; Chen, Z.; Zhou, F.-F.; Zhu, S.-Y. New insights into the beneficial use of coalbed-associated water: A feasibility study of co-produced water reinjection to coalbeds. J. Nat. Gas Sci. Eng. 2022, 103, 104622. [Google Scholar] [CrossRef]
  20. Frota, R.; Tanscheit, R.; Vellasco, M. Fuzzy logic for control of injector wells flow rates under produced water reinjection. J. Petrol. Sci. Eng. 2022, 215, 110574. [Google Scholar] [CrossRef]
  21. Kose, B.; Ozgun, H.; Ersahin, M.E.; Dizge, N.; Koseoglu-Imer, D.Y.; Atay, B.; Kaya, R.; Altınbas, M.; Sayılı, S.; Hoshan, P.; et al. Performance evaluation of a submerged membrane bioreactor for the treatment of brackish oil and natural gas field produced water. Desalination 2012, 285, 295–300. [Google Scholar] [CrossRef]
  22. Tan, B.; He, Z.; Fang, Y.; Zhu, L. Removal of organic pollutants in shale gas fracturing flowback and produced water: A review. Sci. Total Environ. 2023, 883, 163478. [Google Scholar] [CrossRef] [PubMed]
  23. Fard, A.K.; Mckay, G.; Chamoun, R.; Rhadfi, T.; Preud’Homme, H.; Atieh, M.A. Barium removal from synthetic natural and produced water using MXene as two dimensional (2-D) nanosheet adsorbent. Chem. Eng. J. 2017, 317, 331–342. [Google Scholar] [CrossRef]
  24. Underwood, E.C.; Ferguson, G.A.; Betcher, R.; Phipps, G. Elevated Ba concentrations in a sandstone aquifer. J. Hydrol. 2009, 376, 126–131. [Google Scholar] [CrossRef]
  25. Ebrahimi, P.; Vilcáez, J. Effect of brine salinity and guar gum on the transport of barium through dolomite rocks: Implications for unconventional oil and gas wastewater disposal. J. Environ. Manag. 2018, 214, 370–378. [Google Scholar] [CrossRef]
  26. Ebrahimi, P.; Vilcáez, J. Petroleum produced water disposal: Mobility and transport of barium in sandstone and dolomite rocks. Sci. Total Environ. 2018, 634, 1054–1063. [Google Scholar] [CrossRef]
  27. Ye, Z.; Prigiobbe, V. Effect of ionic strength on barium transport in porous media. J. Contam. Hydrol. 2018, 209, 24–32. [Google Scholar] [CrossRef]
  28. Ebrahimi, P.; Vilcaez, J. Transport of barium in fractured dolomite and sandstone saline aquifers. Sci. Total Environ. 2019, 647, 323–333. [Google Scholar] [CrossRef]
  29. Vilcaez, J. Reactive transport modeling of produced water disposal into dolomite saline aquifers: Controls of barium transport. J. Contam. Hydrol. 2020, 233, 103600. [Google Scholar] [CrossRef]
  30. Zhao, Y.; Yu, Q. CO2 breakthrough pressure and permeability for unsaturated low-permeability sandstone of the Ordos Basin. J. Hydrol. 2017, 550, 331–342. [Google Scholar] [CrossRef]
  31. Liu, H.; Hou, Z.; Were, P.; Gou, Y.; Sun, X. Simulation of CO2 plume movement in multilayered saline formations through multilayer injection technology in the Ordos Basin, China. Environ. Earth Sci. 2014, 71, 4447–4462. [Google Scholar] [CrossRef]
  32. Bhuiyan, M.H.; Agofack, N.; Gawel, K.M.; Cerasi, P.R. Micro-and macroscale consequences of interactions between CO2 and shale rocks. Energies 2020, 13, 1167. [Google Scholar] [CrossRef]
  33. Sharma, H.; Mohanty, K.K. An experimental and modeling study to investigate brine-rock interactions during low salinity water flooding in carbonates. J. Petrol. Sci. Eng. 2018, 165, 1021–1039. [Google Scholar] [CrossRef]
  34. Yang, S.; Yu, Q. The role of fluid-rock interactions in permeability behavior of shale with different pore fluids. Int. J. Rock Mech. Min. Sci. 2022, 150, 105023. [Google Scholar] [CrossRef]
  35. Zhang, X.; Ge, J.; Kamali, F.; Othman, F.; Wang, Y.; Le-Hussain, F. Wettability of sandstone rocks and their mineral components during CO2 injection in aquifers: Implications for fines migration. J. Nat. Gas Sci. Eng. 2019, 73, 103050. [Google Scholar] [CrossRef]
  36. Tanikawa, W.; Shimamoto, T. Comparison of Klinkenberg-corrected gas permeability and water permeability in sedimentary rocks. Int. J. Rock Mech. Min. Sci. 2009, 46, 229–238. [Google Scholar] [CrossRef]
  37. Vinogradov, J.; Jackson, M.D. Zeta potential in intact natural sandstones at elevated temperatures. Geophys. Res. Lett. 2015, 42, 6287–6294. [Google Scholar] [CrossRef]
  38. Awan, F.U.R.; Al-Yaseri, A.; Akhondzadeh, H.; Iglauer, S.; Keshavarz, A. Influence of mineralogy and surfactant concentration on zeta potential in intact sandstone at high pressure. J. Colloid Interface Sci. 2022, 607, 401–411. [Google Scholar] [CrossRef]
  39. Arif, M.; Abu-Khamsin, S.; Iglauer, S. Wettability of rock/CO2/brine and rock/oil/CO2-enriched-brine systems: Critical parametric analysis and future outlook. Adv. Colloid Interface Sci. 2019, 268, 91–113. [Google Scholar] [CrossRef]
  40. Fauziah, C.A.; Al-Yaseri, A.Z.; Beloborodov, R.; Siddiqui, M.A.Q.; Lebedev, M.; Parsons, D.F.; Roshan, H.; Barifcani, A.; Iglauer, S. Carbon dioxide/brine, nitrogen/brine and oil/brine wettability of montmorillonite, illite and kaolinite at elevated pressure and temperature. Energy Fuels 2019, 33, 441–448. [Google Scholar] [CrossRef]
  41. Mirchi, V.; Saraji, S.; Goual, L.; Piri, M. Dynamic interfacial tension and wettability of shale in the presence of surfactants at reservoir conditions. Fuel 2015, 148, 127–138. [Google Scholar] [CrossRef]
  42. Shehata, A.M.; Nasr-El-Din, H.A. Zeta Potential Measurements: Impact of Salinity on Sandstone Minerals. In Proceedings of the SPE International Symposium on Oilfield Chemistry, The Woodlands, TX, USA, 13–15 April 2015; SPE-173763-MS. pp. 1–17. [Google Scholar] [CrossRef]
  43. Kazempour, M.; Sundstrom, E.; Alvarado, V. Geochemical modeling and experimental evaluation of high-pH floods: Impact of water–rock interactions in sandstone. Fuel 2012, 92, 216–230. [Google Scholar] [CrossRef]
  44. Zhang, L.; Wang, Y.; Miao, X.; Gan, M.; Li, X. Geochemistry in geologic CO2 utilization and storage: A brief review. Adv. Geo-Energy Res. 2019, 3, 304–313. [Google Scholar] [CrossRef]
  45. Kango, S.; Kumar, R. Low-cost magnetic adsorbent for As (III) removal from water: Adsorption kinetics and isotherms. Environ. Monit. Assess. 2016, 188, 60. [Google Scholar] [CrossRef] [PubMed]
  46. Sauve, S.; Hendershot, W.; Allen, H.E. Solid-solution partitioning of metals in contaminated soils: Dependence on pH, total metal burden, and organic matter. Environ. Sci. Technol. 2000, 34, 1125–1131. [Google Scholar] [CrossRef]
  47. Wissocq, A.; Beaucaire, C.; Latrille, C. Application of the multi-site ion exchanger model to the sorption of Sr and Cs on natural clayey sandstone. Appl. Geochem. 2017, 98, 167–177. [Google Scholar] [CrossRef]
  48. Lu, J.; Mickler, P.J.; Nicot, J.P.; Choi, W.; Esch, W.L.; Darvari, R. Geochemical interactions of shale and brine in autoclave experiments-Understanding mineral reactions during hydraulic fracturing of Marcellus and Eagle Ford Shales. AAPG Bull. 2017, 101, 1567–1597. [Google Scholar] [CrossRef]
  49. Tessier, A.; Carignan, R.; Dubreuil, B.; Rapin, F. Partitioning of zinc between the water column and the oxic sediments in lakes. Geochim. Cosmochim. Acta 1989, 53, 1511–1522. [Google Scholar] [CrossRef]
  50. Walker, E.; Glover, P. Measurements of the relationship between microstructure, pH, and the streaming and zeta potentials of sandstones. Transp. Porous Med. 2018, 121, 183–206. [Google Scholar] [CrossRef]
  51. Johnson, B.B. Effect of pH, temperature, and concentration on the adsorption of cadmium on goethite. Environ. Sci. Technol. 1990, 24, 112–118. [Google Scholar] [CrossRef]
  52. Shahwan, T.; Suzer, S.; Erten, H.N. Sorption of Cs+ and Ba2+ cations on magnesite. Appl. Radiat. Isot. 1998, 49, 915–921. [Google Scholar] [CrossRef]
  53. Arias, F.; Sen, T.K. Removal of zinc metal ion (Zn2+) from its aqueous solution by kaolin clay mineral: A kinetic and equilibrium study. Colloid Surface A 2009, 348, 100–108. [Google Scholar] [CrossRef]
  54. Fan, Q.; Shao, D.; Lu, Y.; Wu, W.; Wang, X. Effect of pH, ionic strength, temperature and humic substances on the sorption of Ni (II) to Na-attapulgite. Chem. Eng. J. 2009, 150, 188–195. [Google Scholar] [CrossRef]
  55. Acosta, J.A.; Jansen, B.; Kalbitz, K.; Faz, A.; Martínez-Martínez, S. Salinity increases mobility of heavy metals in soils. Chemosphere 2011, 85, 1318–1324. [Google Scholar] [CrossRef] [PubMed]
  56. Ebrahimi, P.; Borrok, D.M. Mobility of Ba, Sr, Se and as under simulated conditions of produced water injection in dolomite. Appl. Geochem. 2020, 118, 104640. [Google Scholar] [CrossRef]
  57. Hatje, V.; Payne, T.; Hill, D.; McOrist, G.; Birch, G.; Szymczak, R. Kinetics of trace element uptake and release by particles in estuarine waters: Effects of pH, salinity, and particle loading. Environ. Int. 2003, 29, 619–629. [Google Scholar] [CrossRef]
  58. Vinogradov, J.; Jaafar, M.Z.; Jackson, M.D. Measurement of streaming potential coupling coefficient in sandstones saturated with natural and artificial brines at high salinity. J. Geophys. Res. 2010, 115, B12204. [Google Scholar] [CrossRef]
  59. Van Cappellen, P.; Charlet, L.; Stumm, W.; Wersin, P. A surface complexation model of the carbonate mineral-aqueous solution interface. Geochim. Cosmochim. Acta 1993, 57, 3505–3518. [Google Scholar] [CrossRef]
  60. Strawn, D.G.; Sparks, D.L. Effects of soil organic matter on the kinetics and mechanisms of Pb (II) sorption and desorption in soil. Soil Sci. Soc. Am. J. 2000, 64, 144–156. [Google Scholar] [CrossRef]
Figure 1. Pore size distribution of the sandstone sample.
Sustainability 15 08132 g001
Figure 2. Measured contact angles on the sandstone surface at atmospheric pressure and room temperature.
Sustainability 15 08132 g002
Figure 3. The concentrations of Ba (a) and pH (b) as a function of time at different brine/rock ratio conditions.
Sustainability 15 08132 g003
Figure 4. Changes in the pH and concentrations of Ba with the time at different initial pH (a), temperatures (b), brine salinities (c), and in the presence of competitive cations (d).
Sustainability 15 08132 g004
Figure 5. The variation of pH and Ba concentrations with time at different methanol concentrations, (a) initial pH = 3.5, and (b) initial pH = 8.5.
Sustainability 15 08132 g005
Figure 6. The experimental data fitted by (a) pseudo-first-order kinetics model and (b) pseudo-second-order kinetics model, using the sorption amount under different salinities as an example.
Sustainability 15 08132 g006
Figure 7. Dependence of the sorption ratio and partition coefficient (a) and equilibrium sorption capacity and reaction rate constant (b) on the brine/rock ratio.
Sustainability 15 08132 g007
Figure 8. The relationships between the sorption ratio/partition coefficient (a), equilibrium sorption capacity/reaction rate constant (b), and pH.
Sustainability 15 08132 g008
Figure 9. The zeta potentials of sandstone samples at different pH and NaCl solution salinity.
Sustainability 15 08132 g009
Figure 10. The sorption ratio and partition coefficient (a) and equilibrium sorption capacity and reaction rate constant (b) at different temperatures.
Sustainability 15 08132 g010
Figure 11. Dependence of sorption ratio and partition coefficient (a) and equilibrium sorption capacity and reaction rate constant (b) on brine salinity.
Sustainability 15 08132 g011
Figure 12. The measured sorption ratio and partition coefficients (a) and equilibrium sorption capacity and reaction rate constant (b) in the presence of competitive cations.
Sustainability 15 08132 g012
Figure 13. The measured barium sorption ratio (a) and equilibrium sorption capacity (b) at different pH (blue 3.5, orange 8.5) and methanol concentrations.
Sustainability 15 08132 g013
Table 1. Mineral composition of the sandstone sample from XRD analysis.
TypesQuartzPlagioclaseMicroclineChloriteMicaCalcite
Chemical formula (a)SiO2(Na, Ca), Al(Al, Si)Si2O8KAlSi3O8(Fe, Mg)5Al2Si3O10(OH)8KAl2(AlSi3O10)(OH)2CaCO3
Content38%39%11%4%4%4%
Note: (a) Bhuiyan et al. [32].
Table 2. Major elements in the sandstone sample as percentage oxides from XRF analysis.
TypesSiO2Al2O3CO2Fe2O3Na2OCaOK2OMgOTiO2P2O5BaOOther
Content (%)56.115.57.94.94.13.93.43.10.620.190.10.19
Table 3. The pore structure parameters, wettability, permeability, and zeta potential of sandstone sample.
TypesMost Probable
Pore Diameter
Cumulative Specific
Surface Area
PorosityAverage Contact AngleWater
Permeability
Zeta Potential
Value1.4 μm1.17 m2/g12.8%29.35°0.24 mD−20.9 mV
Table 4. Conditions of the water–rock interaction experiments.
NO.PurposeRock
(g)
Brine
(mL)
Brine/Rock RatioBrine Composition
(K = 1000 mg/L)
pHTemperature
(°C)
1Effect of Brine/rock ratio201005:10.2 K BaCl26.2120
22020010:10.2 K BaCl26.2120
31020020:10.2 K BaCl26.2120
4420050:10.2 K BaCl26.2120
52200100:10.2 K BaCl26.2120
61200200:10.2 K BaCl26.2120
71500500:10.2 K BaCl26.2120
8Effect of pH201005:10.2 K BaCl23.1120
9201005:10.2 K BaCl25.0620
10201005:10.2 K BaCl27.0620
11201005:10.2 K BaCl29.2220
12201005:10.2 K BaCl210.120
13Effect of Temperature201005:10.2 K BaCl210.2520
14201005:10.2 K BaCl210.2550
15201005:10.2 K BaCl210.2580
16Effect of Cations competition201005:10.2 K BaCl2 + 0.5 K MgCl210.0520
17201005:10.2 K BaCl2 + 0.5 K SrCl210.0520
18Effect of Salinity201005:10.2 K BaCl2 + 1 K NaCl10.0520
19201005:10.2 K BaCl2 + 5 K NaCl10.0520
20201005:10.2 K BaCl2 + 10 K NaCl10.0520
21201005:10.2 K BaCl2 + 50 K NaCl10.0520
22201005:10.2 K BaCl2 + 100 K NaCl10.0520
23Effect of Methanol2020010:10.2 K BaCl23.530
242020010:10.2 K BaCl2 + 1 K methanol3.530
252020010:10.2 K BaCl2 + 2 K methanol3.530
262020010:10.2 K BaCl2 + 5 K methanol3.530
272020010:10.2 K BaCl28.530
282020010:10.2 K BaCl2 + 1 K methanol8.530
292020010:10.2 K BaCl2 + 2 K methanol8.530
302020010:10.2 K BaCl2 + 5 K methanol8.530
Table 5. The sorption kinetics fitting parameters of all the experiments.
NO.ExperimentsPseudo-First-Order Kinetics Model ParametersPseudo-Second-Order Kinetics Model Parameters
qe
(mg/g)
K1
(1/h)
R2qe
(mg/g)
K2
(mg/(g·h))
R2
1Effect of brine/rock ratio5:10.927811.1090.99990.9290354.9260.9999
210:11.05807.2010.99981.063758.6220.9999
320:10.83777.8000.99810.844562.8130.9988
450:11.37137.3510.99821.383932.7200.9991
5100:12.13265.8320.99152.17289.7680.9951
6200:12.25184.8520.99532.29817.1780.9984
7500:11.45120.7510.96471.59920.6710.9824
8Effect of pH3.110.69005.5900.99740.700632.2980.9994
95.060.71539.3860.99980.7172207.7110.9999
107.060.74364.8210.99050.762618.6110.9967
119.220.83106.6870.99720.841040.1440.9987
1210.10.83906.7820.99790.847445.6810.9990
13Effect of temperature200.75524.8920.99290.772719.9800.9978
14500.74425.5680.99740.755830.4550.9995
15800.73966.2320.99890.747246.0410.9997
16Effect of cations competition0.2 K BaCl2 + 0.5 K MgCl20.46384.6860.99290.475130.0060.9981
170.2 K BaCl2 + 0.5 K SrCl20.41746.0730.99800.422867.6070.9996
18Effect of salinity0.2 K BaCl2 + 1 K NaCl0.63724.6570.99660.649525.1500.9981
190.2 K BaCl2 + 5 K NaCl0.47045.1770.99420.479937.1880.9979
200.2 K BaCl2 + 10 K NaCl0.40654.7290.99290.416235.0270.9979
210.2 K BaCl2 + 50 K NaCl0.16061.9130.95210.173217.0350.9876
220.2 K BaCl2 + 100 K NaCl0.09322.4090.88880.101428.5070.9327
23Effect of methanol
(pH = 3.5)
0.2 K BaCl20.72594.5880.99660.738521.8630.9998
240.2 K BaCl2 + 1 K methanol0.74284.4770.99460.757818.9360.9950
250.2 K BaCl2 + 2 K methanol0.73364.4960.99260.749318.4990.9992
260.2 K BaCl2 + 5 K methanol0.71844.4710.99630.731520.8370.9998
27Effect of methanol
(pH = 8.5)
0.2 K BaCl20.98337.4320.99940.988859.7080.9999
280.2 K BaCl2 + 1 K methanol0.98506.0280.99940.993135.7300.9998
290.2 K BaCl2 + 2 K methanol0.98896.9740.99920.995947.2740.9999
300.2 K BaCl2 + 5 K methanol0.98377.3510.99940.989358.0630.9999
Disclaimer/Publisher’s Note: The statements, opinions and data contained in all publications are solely those of the individual author(s) and contributor(s) and not of MDPI and/or the editor(s). MDPI and/or the editor(s) disclaim responsibility for any injury to people or property resulting from any ideas, methods, instructions or products referred to in the content.

