
Socio-Environmental Vulnerability to Drought Conditions and Land Degradation: An Assessment in Two Northeastern Brazilian River Basins

 , ,
, ,  , , , and
Abstract
1. Introduction
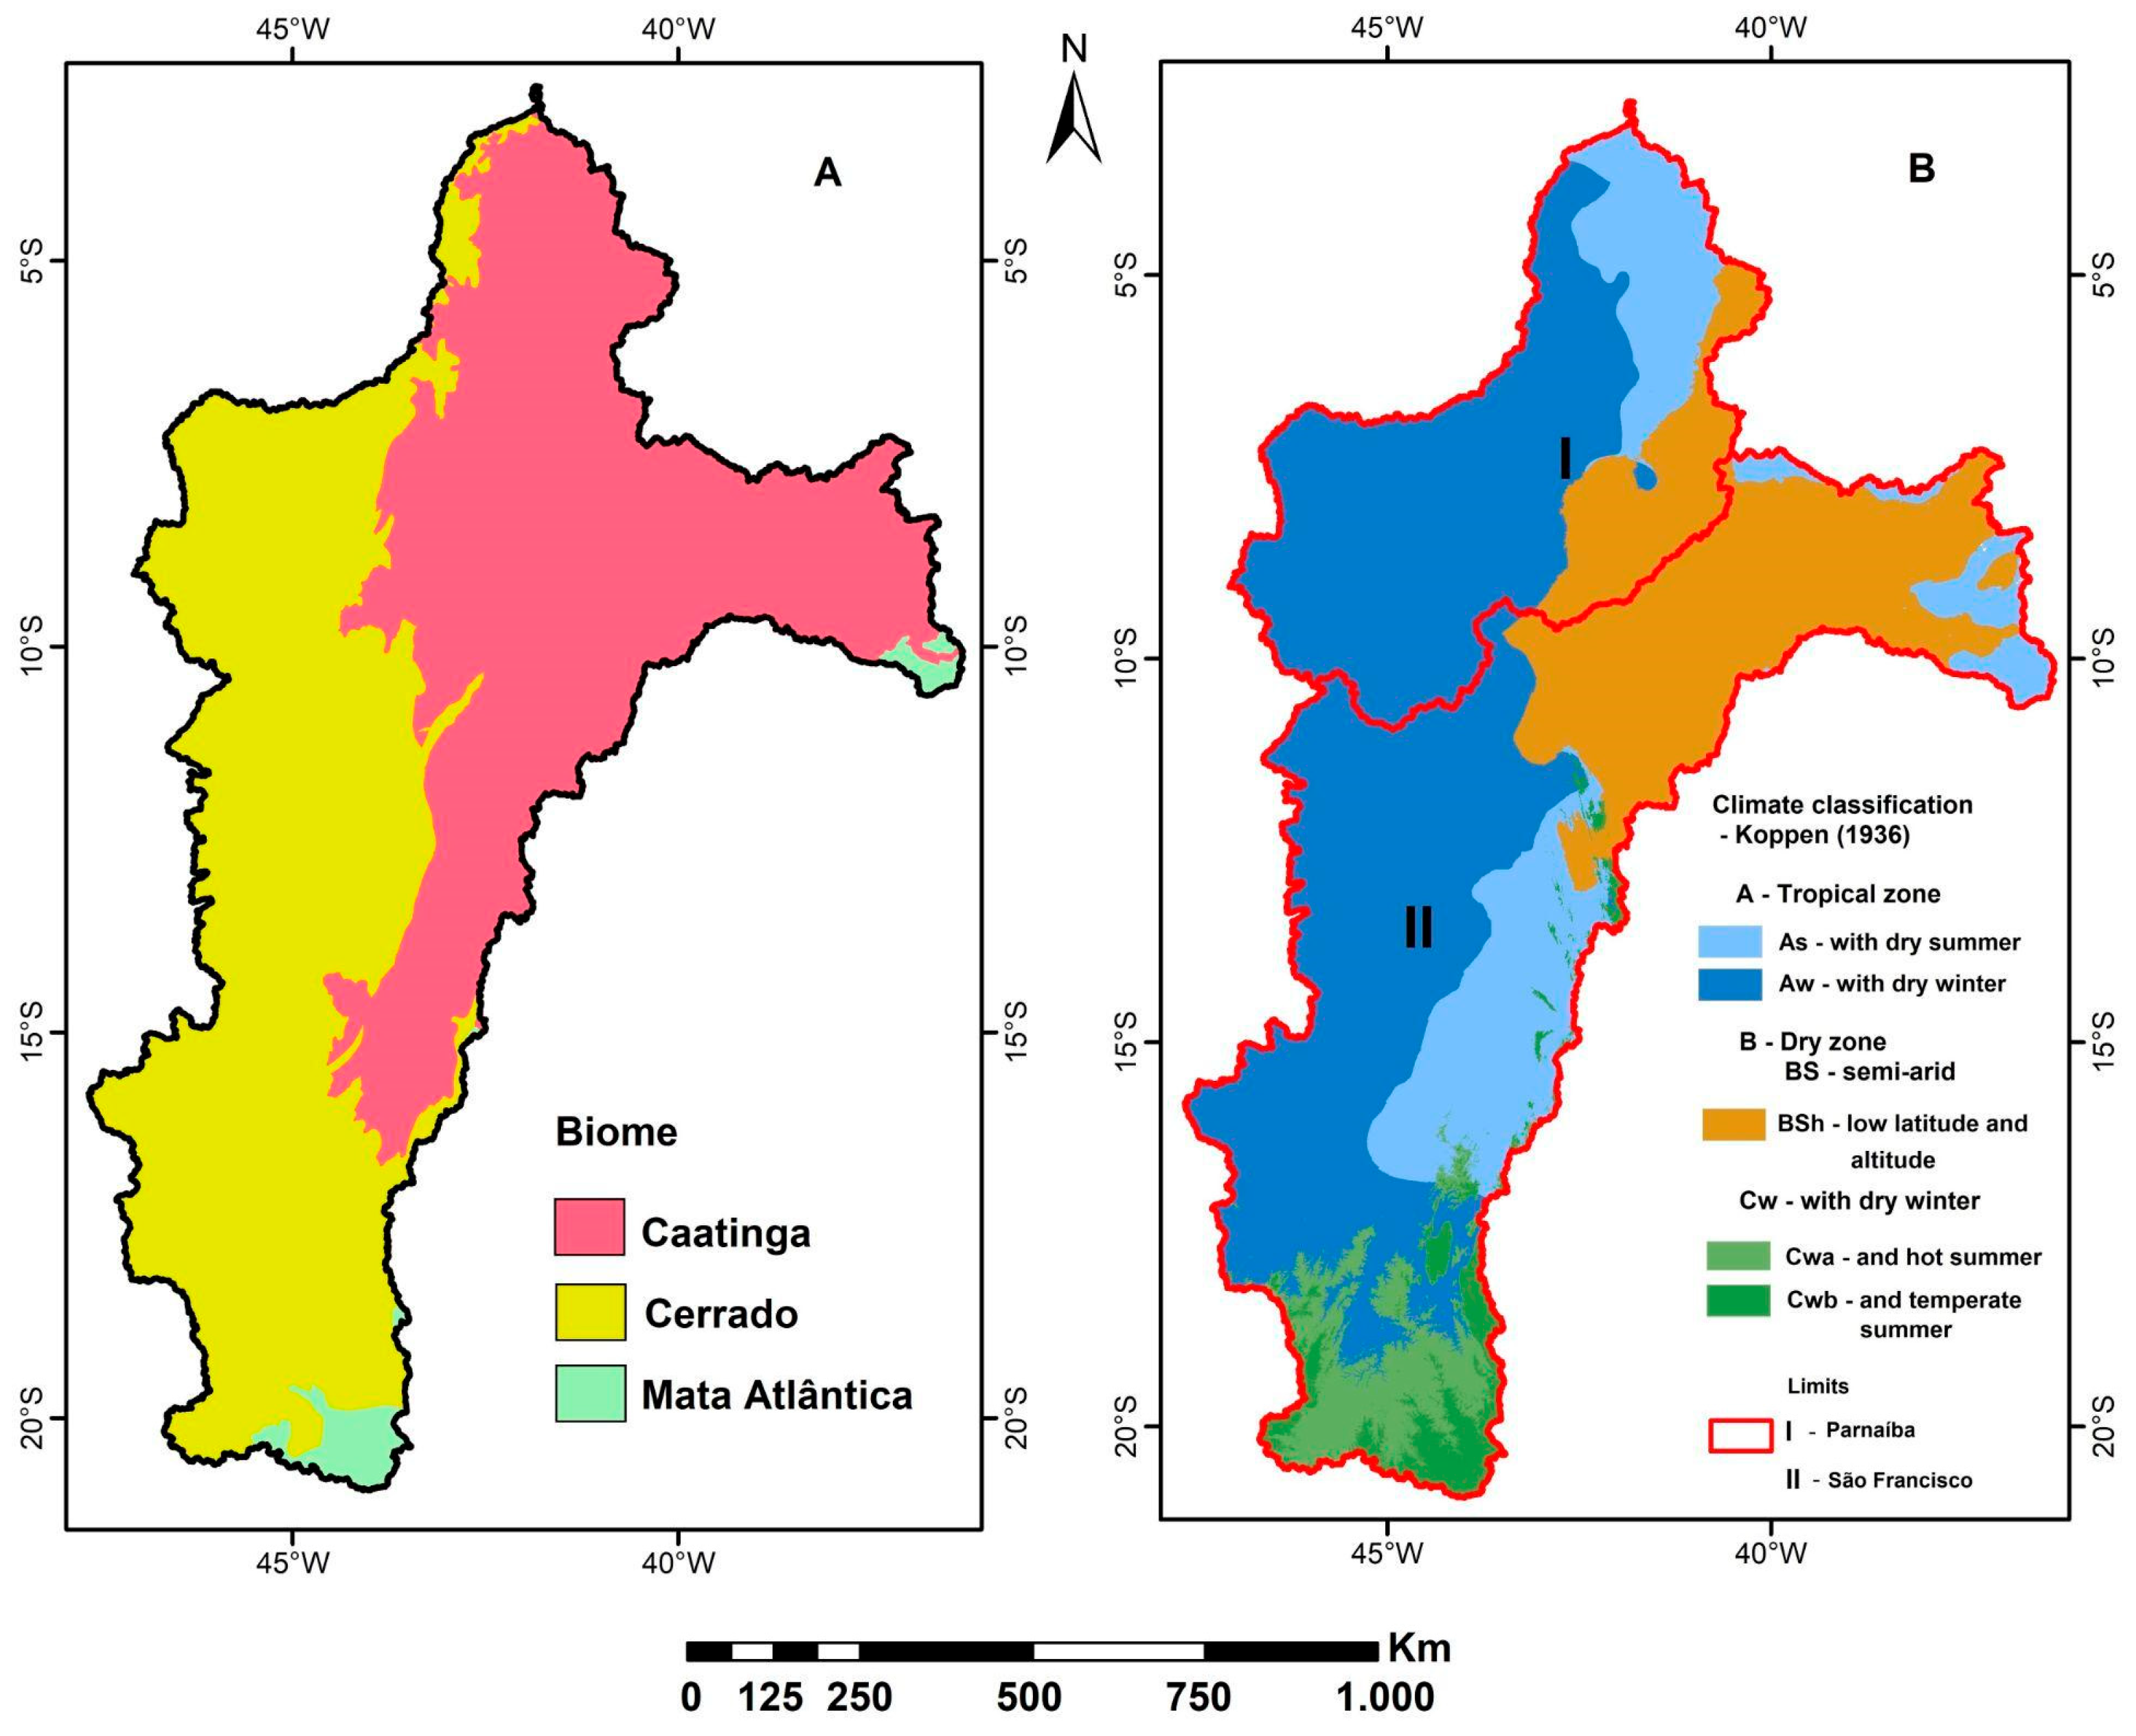
2. Study Area

3. Material and Methods
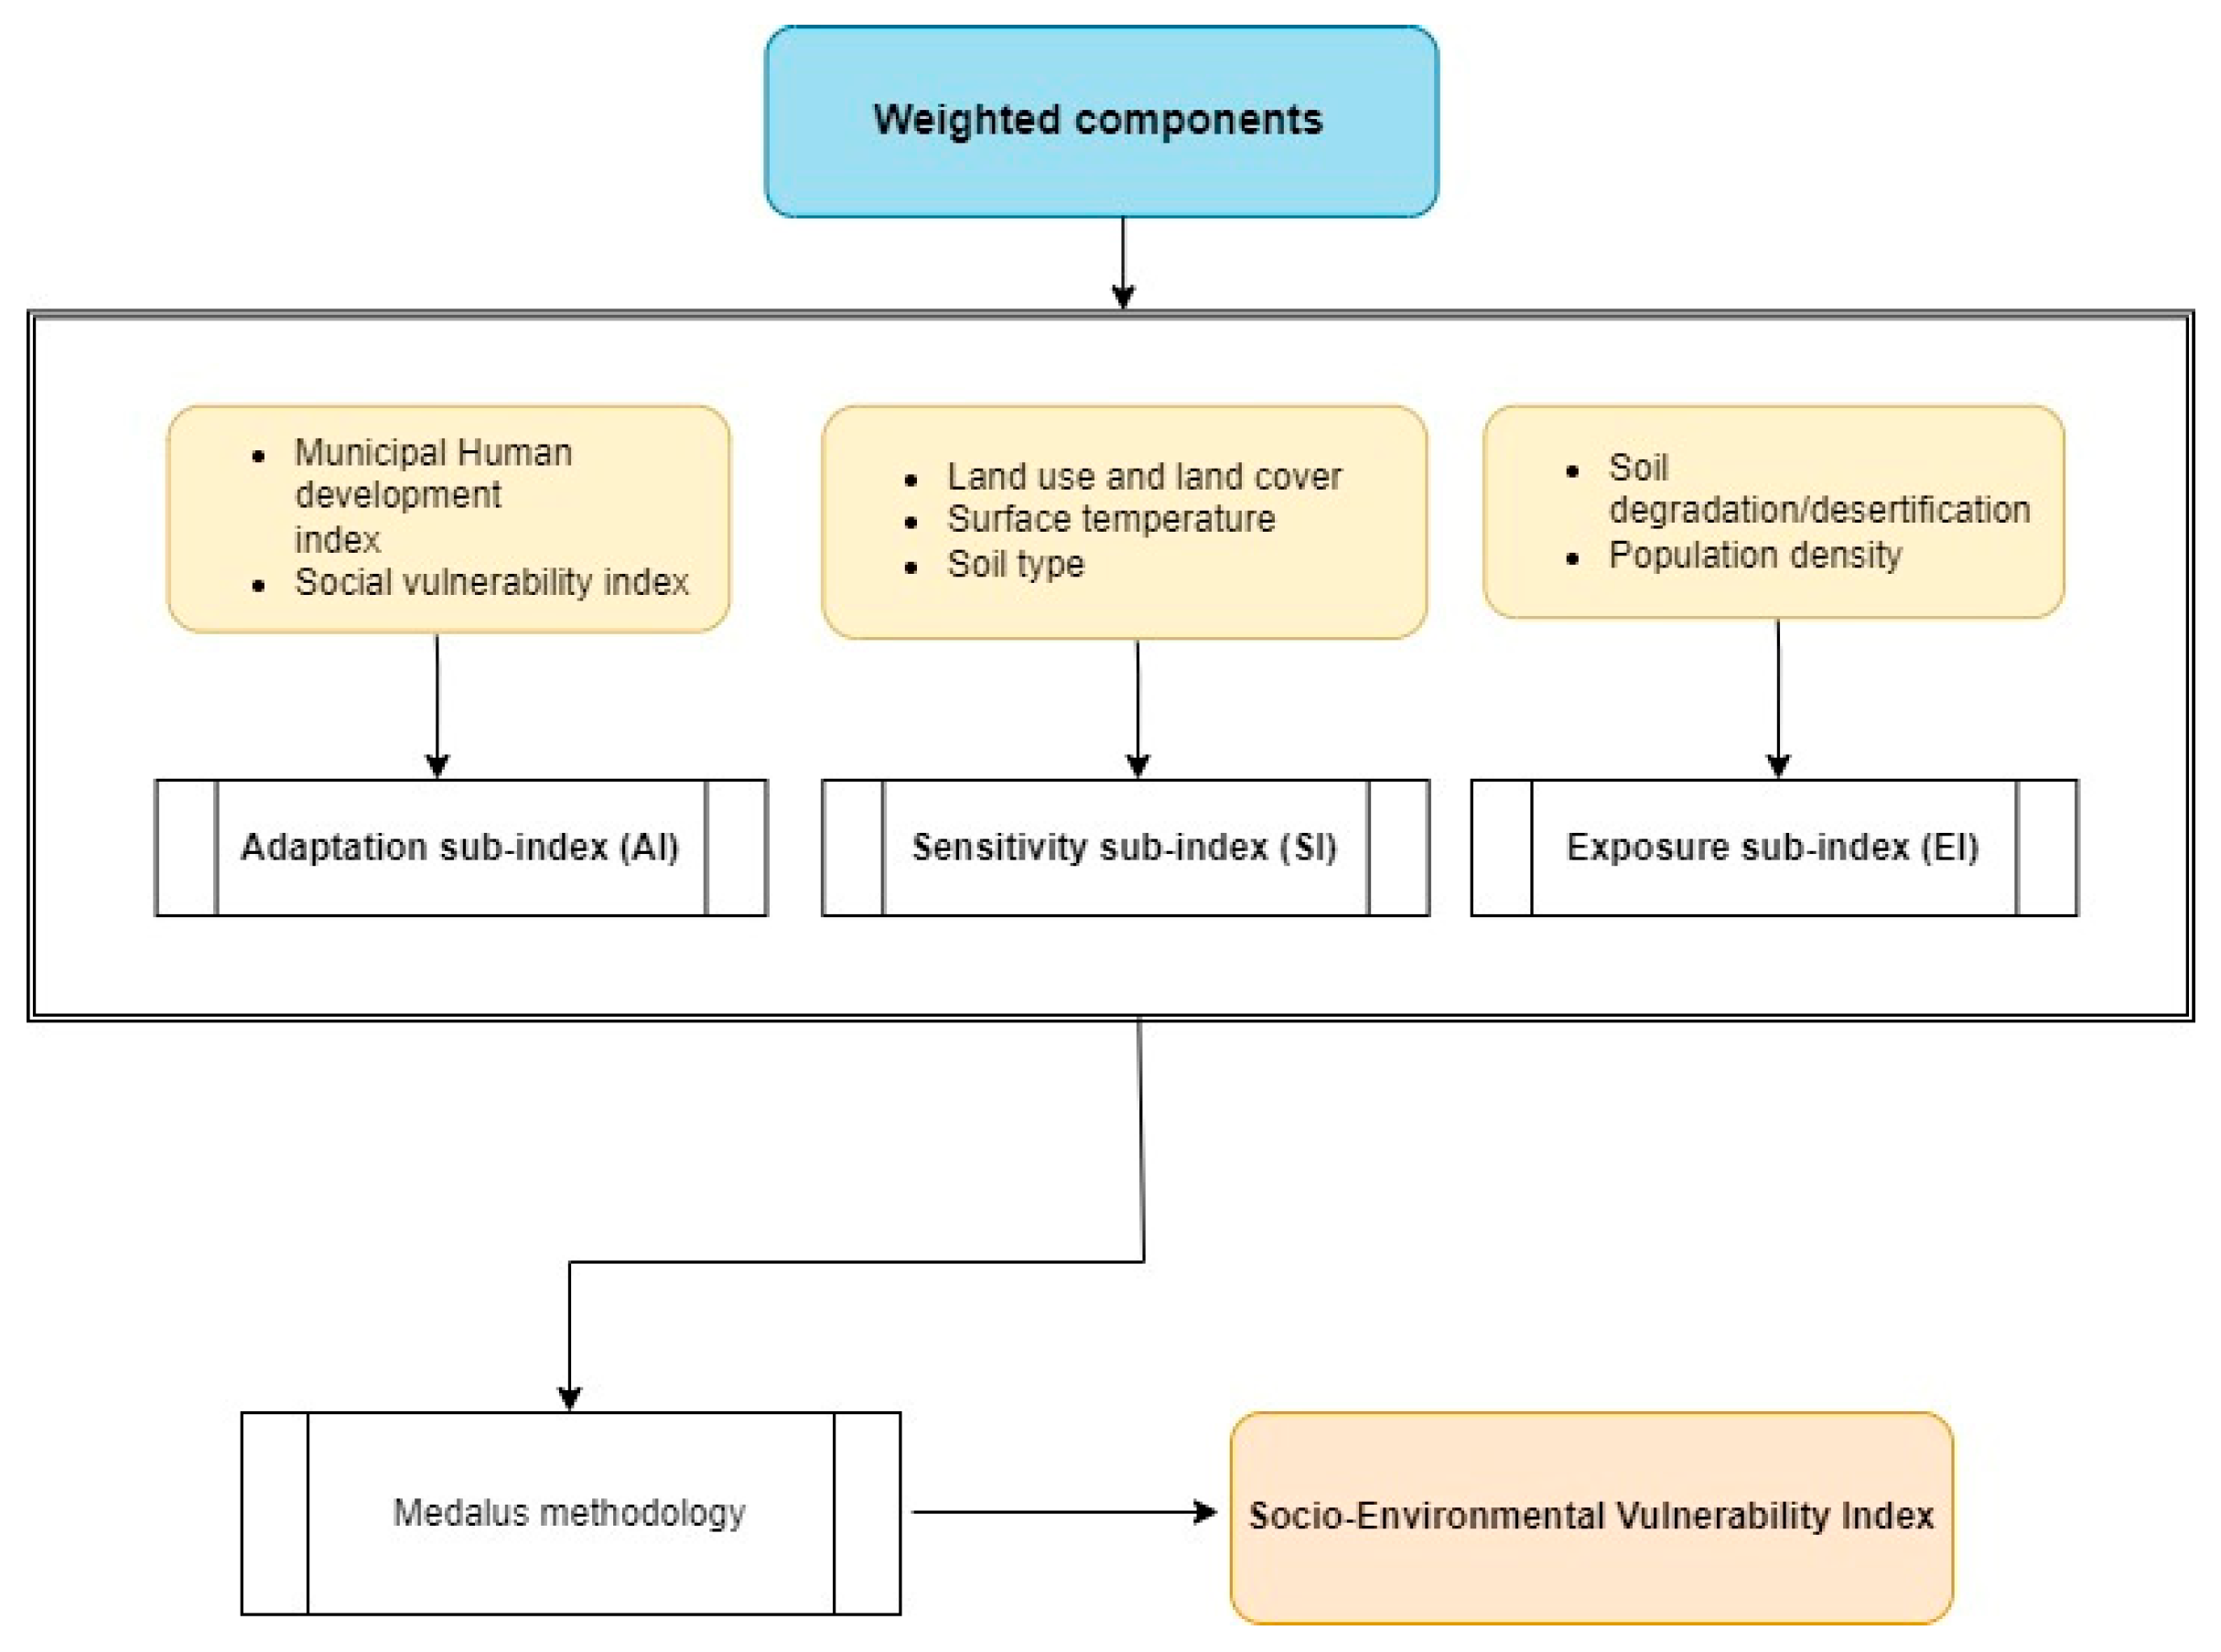
3.1. Socio-Environmental Vulnerability Index (SEVI)
3.2. Analysis of the Contribution of the Indicators
3.3. Spatial Analysis of Socio-Environmental Vulnerability on Conservation Units and in Rural Properties
4. Results and Discussion
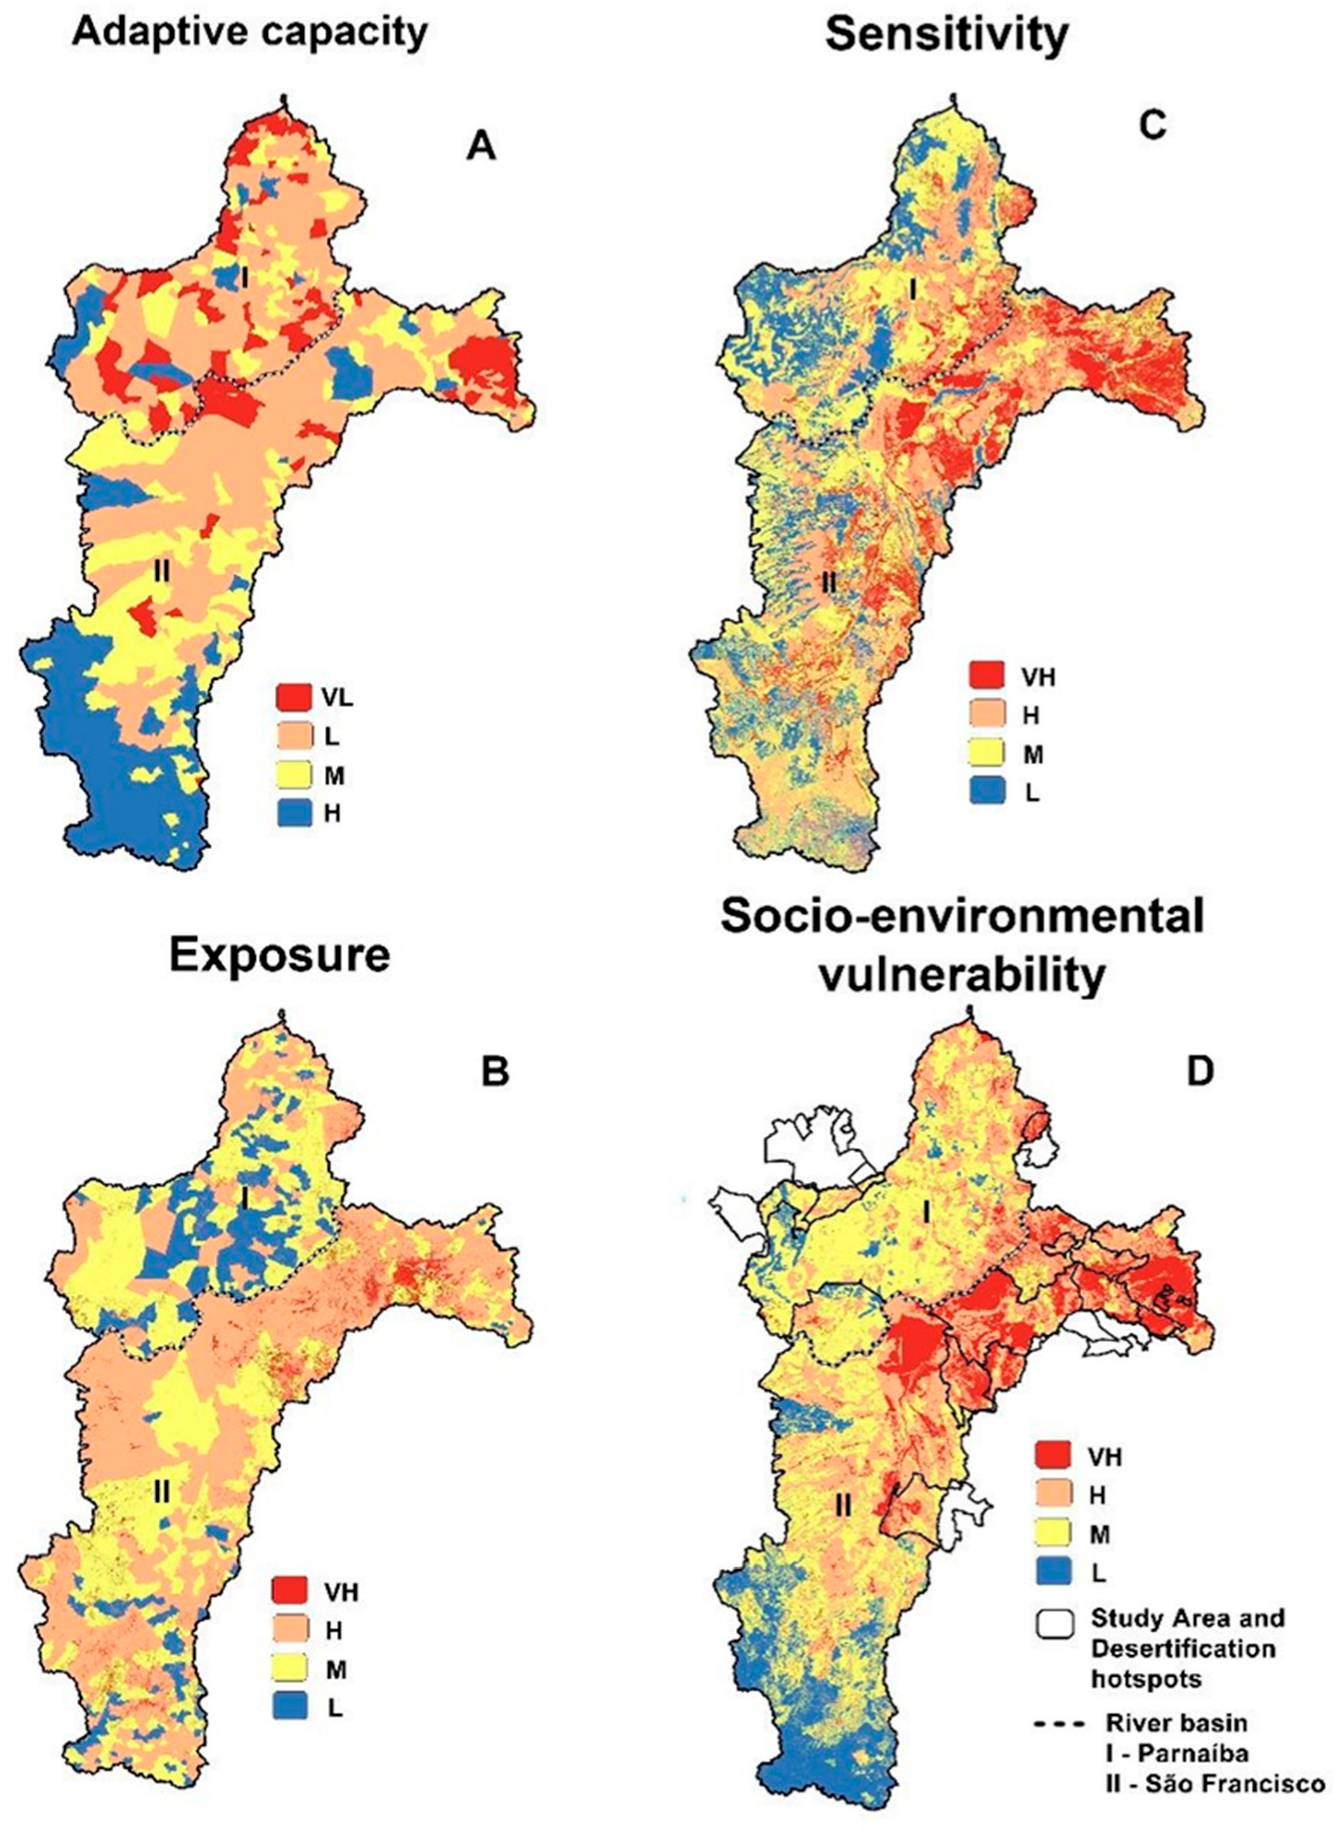
4.1. Adaptive Capacity Analysis
4.2. Exposure Analysis
4.3. Sensitivity Analysis
4.4. SEVI Analysis
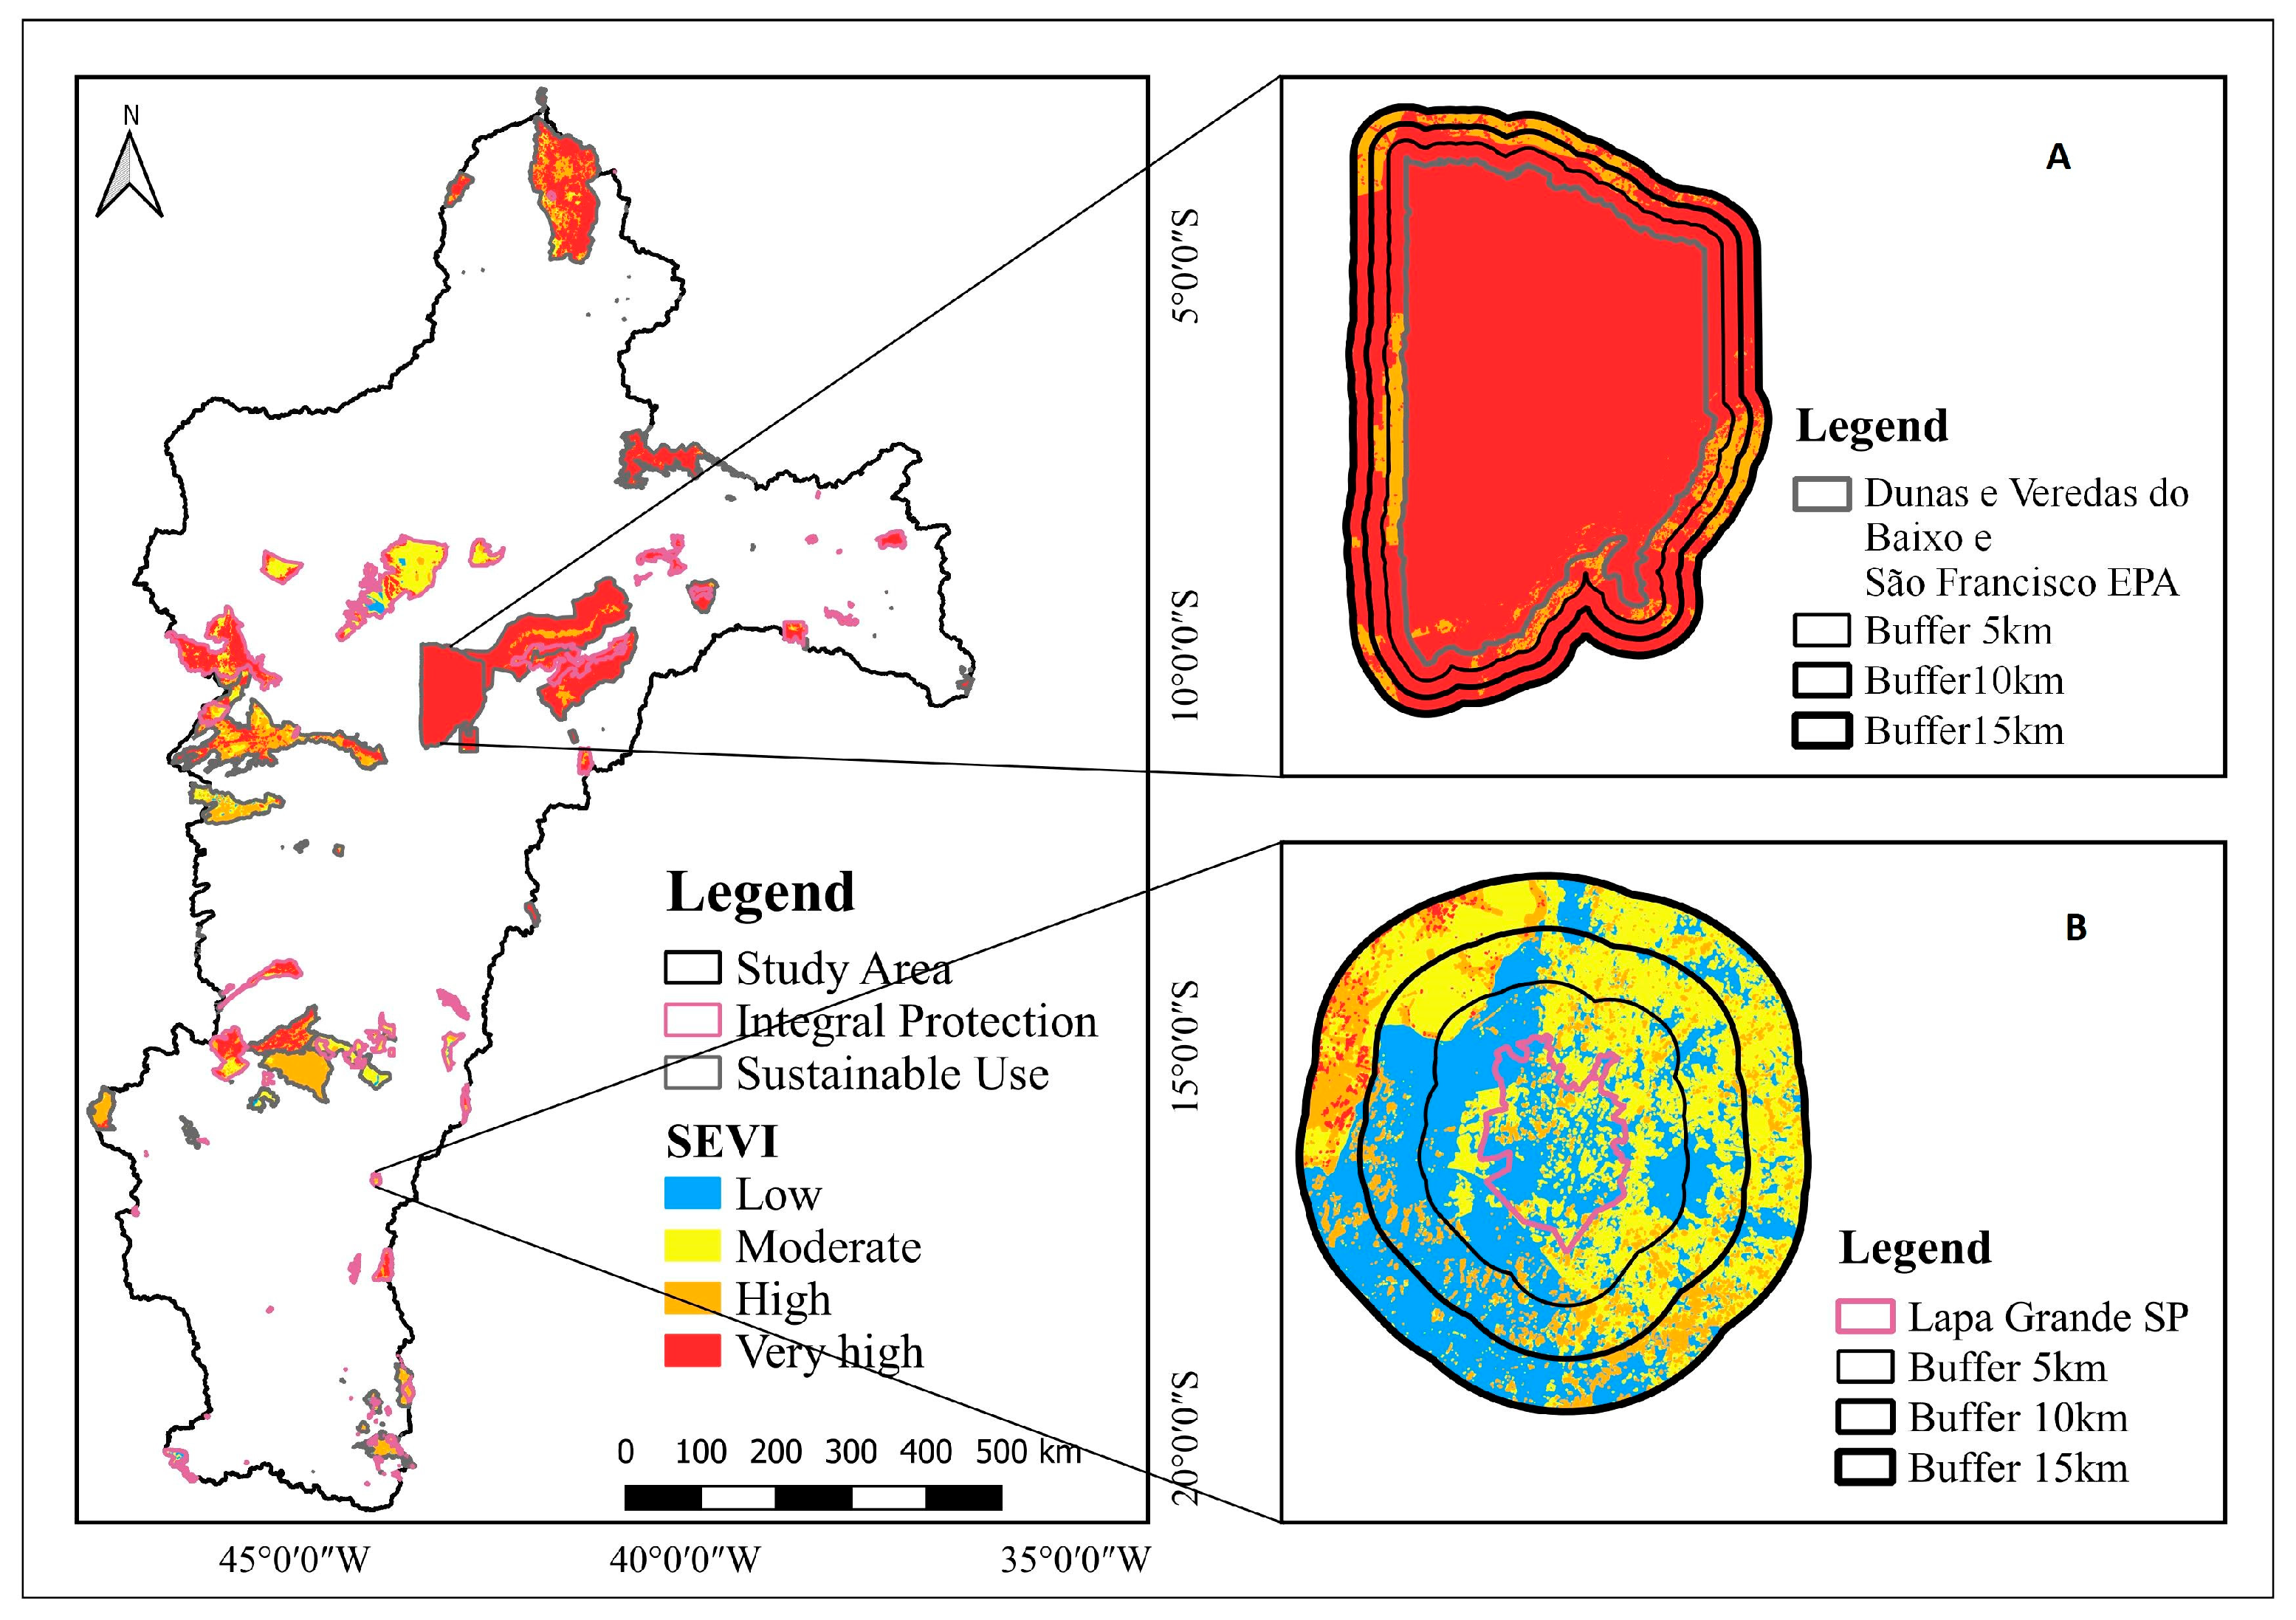
4.5. Analysis of SEVI in the Conservation Units and Buffer Zones
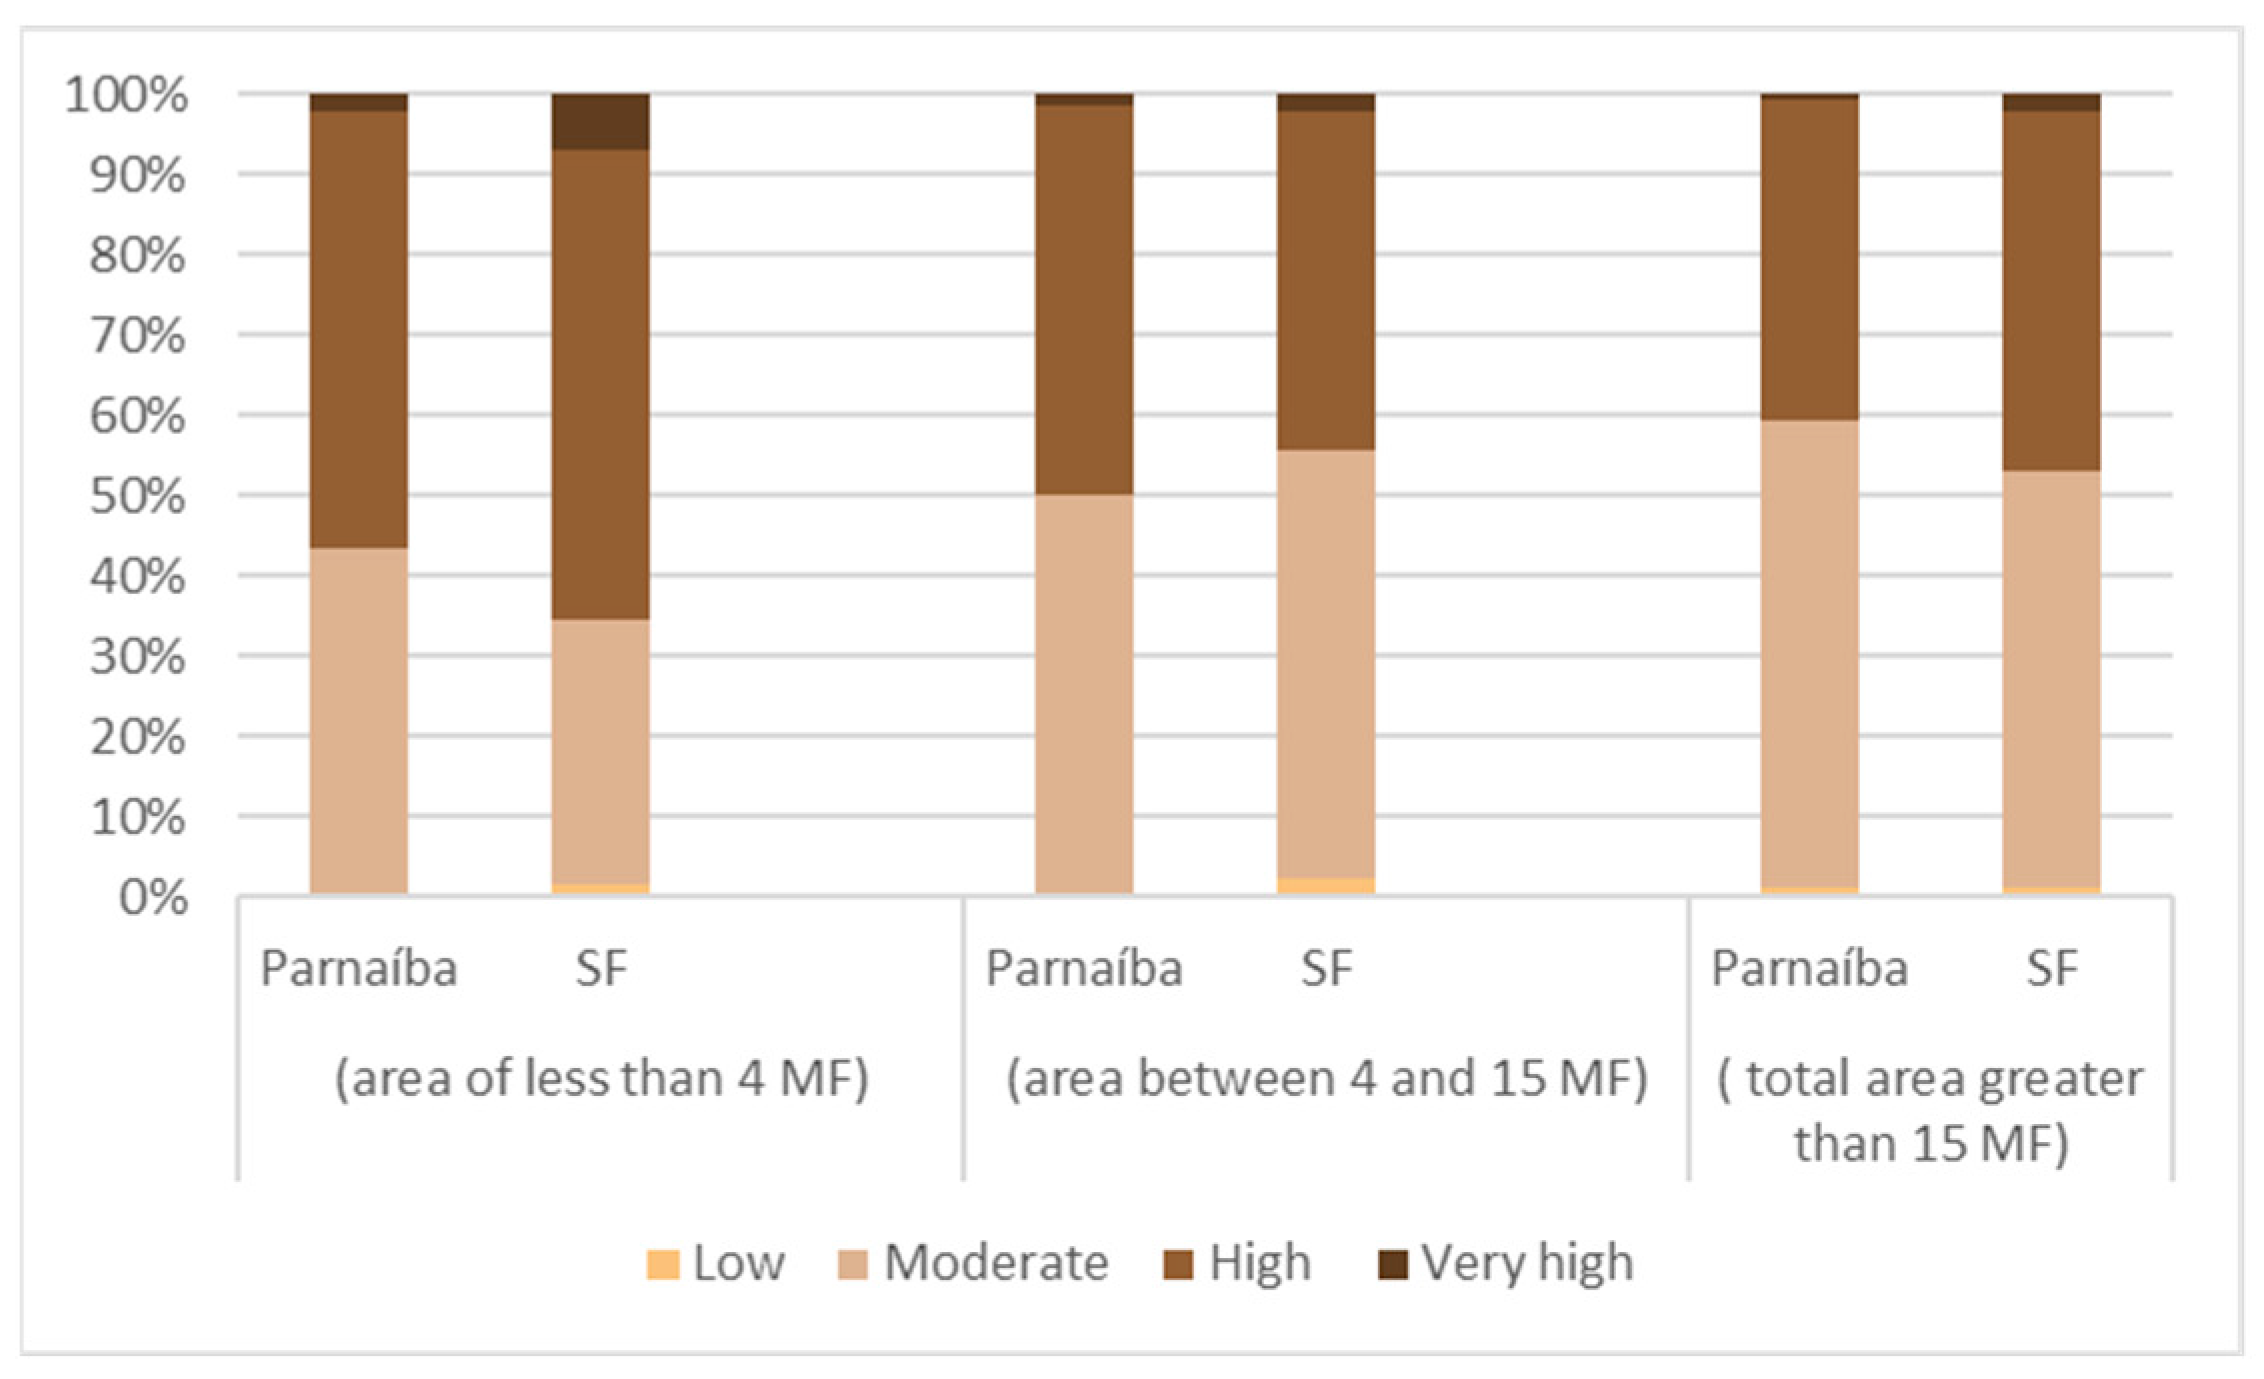
4.6. Analysis of SEVI in Relation to the Size Defined by the CAR
5. Conclusions
Supplementary Materials
Author Contributions
Funding
Institutional Review Board Statement
Informed Consent Statement
Data Availability Statement
Acknowledgments
Conflicts of Interest
References
- ONU; United Nations Department of Economic and Social Affairs, Population Division. Global Population Growth and Sustainable Development; United Nations: New York, NY, USA, 2021. [Google Scholar]
- Zou, T.; Chang, Y.; Chen, P.; Liu, J. Spatial-Temporal Variations of Ecological Vulnerability in Jilin Province (China), 2000 to 2018. Ecol. Indic. 2021, 133, 108429. [Google Scholar] [CrossRef]
- Kumar, M.; Kalra, N.; Singh, H.; Sharma, S.; Singh Rawat, P.; Kumar Singh, R.; Kumar Gupta, A.; Kumar, P.; Ravindranath, N.H. Indicator-Based Vulnerability Assessment of Forest Ecosystem in the Indian Western Himalayas: An Analytical Hierarchy Process Integrated Approach. Ecol. Indic. 2021, 125, 107568. [Google Scholar] [CrossRef]
- Ballesteros-González, K.; Sullivan, A.P.; Morales-Betancourt, R. Estimating the Air Quality and Health Impacts of Biomass Burning in Northern South America Using a Chemical Transport Model. Sci. Total Environ. 2020, 739, 139755. [Google Scholar] [CrossRef]
- Pivello, V.R.; Vieira, I.; Christianini, A.V.; Ribeiro, D.B.; da Silva Menezes, L.; Berlinck, C.N.; Melo, F.P.L.; Marengo, J.A.; Tornquist, C.G.; Tomas, W.M.; et al. Understanding Brazil’s Catastrophic Fires: Causes, Consequences and Policy Needed to Prevent Future Tragedies. Perspect Ecol. Conserv. 2021, 19, 233–255. [Google Scholar] [CrossRef]
- Klink, C.A.; Machado, R.B. A Conservação Do Cerrado Brasileiro. Megadiversidade 2005, 1, 147–155. [Google Scholar]
- Santos, F.C.; da Silva Pinto Vieira, R.M.; Barbosa, A.A.; da Cruz Ferreira, Y.; Polizel, S.P.; Sestini, M.F.; Ometto, J.P.H.B. Application of Remote Sensing to Analyze the Loss of Natural Vegetation in the Jalapão Mosaic (Brazil) before and after the Creation of Protected Area (1970–2018). Environ. Monit. Assess. 2022, 194, 201. [Google Scholar] [CrossRef]
- Swanson, F.J. Fire and Geomorphic Process; Mooney, H.A., Bonnicksen, T.M., Christensen, N.L., Lotan, J.E., Eds.; U.S. Department of Agriculture, Forest Service: Washington, DC, USA, 1981; pp. 401–444.
- Pompeu, J. Performance of an Automated Conservation Status Assessment for the Megadiverse Vascular Flora of Brazil. J. Nat. Conserv. 2022, 70, 126272. [Google Scholar] [CrossRef]
- Redin, M.; Santos, G.D.; Miguel, P.; Denega, G.L.; Lupatini, M.; Doneda, A.; Souza, E.L. Impactos Da Queima Sobre Atributos Químicos, Físicos e Biológicos Do Solo. Ciência Florest. 2011, 21, 381–392. [Google Scholar] [CrossRef]
- Tomasella, J.; Silva Pinto Vieira, R.M.; Barbosa, A.A.; Rodriguez, D.A.; de Oliveira Santana, M.; Sestini, M.F. Desertification Trends in the Northeast of Brazil over the Period 2000–2016. Int. J. Appl. Earth Obs. Geoinf. 2018, 73, 197–206. [Google Scholar] [CrossRef]
- Cunha, A.P.M.A.; Brito, S.S.B.; Neto, G.G.R.; Alvalá, R.C.S. Drought Between 1963 and 2017 in the Federal District, Brazil. Anuário Inst. Geociências-UFRJ 2018, 41, 487–498. [Google Scholar] [CrossRef]
- Marengo, J.A.; Cunha, A.P.; Cuartas, L.A.; Deusdará Leal, K.R.; Broedel, E.; Seluchi, M.E.; Michelin, C.M.; De Praga Baião, C.F.; Chuchón Angulo, E.; Almeida, E.K.; et al. Extreme Drought in the Brazilian Pantanal in 2019–2020: Characterization, Causes, and Impacts. Front. Water 2021, 3, 639204. [Google Scholar] [CrossRef]
- Leite-Filho, A.T.; Soares-Filho, B.S.; Davis, J.L.; Abrahão, G.M.; Börner, J. Deforestation Reduces Rainfall and Agricultural Revenues in the Brazilian Amazon. Nat. Commun. 2021, 12, 2591. [Google Scholar] [CrossRef]
- Tomasella, J.; Cunha, A.P.M.A.; Simões, P.A.; Zeri, M. Assessment of Trends, Variability and Impacts of Droughts across Brazil over the Period 1980–2019. Nat. Hazards 2022, 116, 2173–2190. [Google Scholar] [CrossRef]
- Silva Junior, C.; Aragão, L.; Fonseca, M.; Almeida, C.; Vedovato, L.; Anderson, L. Deforestation-Induced Fragmentation Increases Forest Fire Occurrence in Central Brazilian Amazonia. Forests 2018, 9, 305. [Google Scholar] [CrossRef]
- Efthimiou, N.; Psomiadis, E.; Panagos, P. Fire Severity and Soil Erosion Susceptibility Mapping Using Multi-Temporal Earth Observation Data: The Case of Mati Fatal Wildfire in Eastern Attica, Greece. Catena 2020, 187, 104320. [Google Scholar] [CrossRef]
- Ayoubi, S.; Rabiee, S.; Mosaddeghi, M.R.; Abdi, M.R.; Abbaszadeh Afshar, F. Soil Erosion and Properties as Affected by Fire and Time after Fire Events in Steep Rangelands Using 137Cs Technique. Arab. J. Geosci. 2021, 14, 113. [Google Scholar] [CrossRef]
- Stringer, L.C.; Dyer, J.C.; Reed, M.S.; Dougill, A.J.; Twyman, C.; Mkwambisi, D. Adaptations to Climate Change, Drought and Desertification: Local Insights to Enhance Policy in Southern Africa. Environ. Sci. Policy 2009, 12, 748–765. [Google Scholar] [CrossRef]
- Cuartas, L.A.; Cunha, A.P.M.d.A.; Alves, J.A.; Parra, L.M.P.; Deusdará-Leal, K.; Costa, L.C.O.; Molina, R.D.; Amore, D.; Broedel, E.; Seluchi, M.E.; et al. Recent Hydrological Droughts in Brazil and Their Impact on Hydropower Generation. Water 2022, 14, 601. [Google Scholar] [CrossRef]
- de Jong, P.; Barreto, T.B.; Tanajura, C.A.S.; Oliveira-Esquerre, K.P.; Kiperstok, A.; Andrade Torres, E. The Impact of Regional Climate Change on Hydroelectric Resources in South America. Renew Energy 2021, 173, 76–91. [Google Scholar] [CrossRef]
- Alves, H.P.d.F. Socio-Environmental Vulnerability in the São Paulo Macro-Metropolis’ Three Main Metropolitan Regions: A Socio-Environmental Indicators Analysis Indicators Analysis. Ambiente Soc. 2021, 24. [Google Scholar] [CrossRef]
- Gallopín, G.C. Linkages between Vulnerability, Resilience, and Adaptive Capacity. Glob. Environ. Chang. 2006, 16, 293–303. [Google Scholar] [CrossRef]
- Sánchez-Salguero, R.; Camarero, J.J.; Gutiérrez, E.; González Rouco, F.; Gazol, A.; Sangüesa-Barreda, G.; Andreu-Hayles, L.; Linares, J.C.; Seftigen, K. Assessing Forest Vulnerability to Climate Warming Using a Process-Based Model of Tree Growth: Bad Prospects for Rear-Edges. Glob. Chang. Biol. 2017, 23, 2705–2719. [Google Scholar] [CrossRef] [PubMed]
- OEIWG. Report of the Open-Ended Intergovernmental Expert Working Group on Indicators and Terminology Relating to Disaster Risk Reduction; UNDRR: Geneva, Switzerland, 2016. [Google Scholar]
- UNDRR. Global Assessment Report on Disaster Risk Reduction, Geneva, Switzerland, United Nations Office for Disaster Risk Reduction (UNDRR); UNDRR: Geneva, Switzerland, 2019. [Google Scholar]
- Adger, W.N. Vulnerability. Glob. Environ. Chang. 2006, 16, 268–281. [Google Scholar] [CrossRef]
- Oliveira, U.; Soares-Filho, B.; Bustamante, M.; Gomes, L.; Ometto, J.P.; Rajão, R. Determinants of Fire Impact in the Brazilian Biomes. Front. For. Glob. Chang. 2022, 5, 735017. [Google Scholar] [CrossRef]
- dos Santos, A.; Oliveira Lopes, P.M.; da Silva, M.V.; Maniçoba da Rosa Ferraz Jardim, A.; Barbosa de Albuquerque Moura, G.; Siqueira Tavares Fernandes, G.; de Oliveira Silva, D.A.; Bezerra da Silva, J.L.; de Moraes Rodrigues, J.A.; Araújo Silva, E.; et al. Causes and Consequences of Seasonal Changes in the Water Flow of the São Francisco River in the Semiarid of Brazil. Environ. Sustain. Indic. 2020, 8, 100084. [Google Scholar] [CrossRef]
- Myers, N.; Mittermeier, R.A.; Mittermeier, C.G.; da Fonseca, G.A.B.; Kent, J. Biodiversity Hotspots for Conservation Priorities. Nature 2000, 403, 853–858. [Google Scholar] [CrossRef]
- Pires, M.O. ‘Cerrado’, Old and New Agricultural Frontiers. Braz. Political Sci. Rev. 2020, 14, 1–24. [Google Scholar] [CrossRef]
- Marengo, J.A.; Galdos, M.V.; Challinor, A.; Cunha, A.P.; Marin, F.R.; Vianna, M.d.S.; Alvala, R.C.S.; Alves, L.M.; Moraes, O.L.; Bender, F. Drought in Northeast Brazil: A Review of Agricultural and Policy Adaptation Options for Food Security. Clim. Resil. Sustain. 2022, 1, e17. [Google Scholar] [CrossRef]
- Motta, E.D.O.; Gonçalves, N.E.W. Plano Nascente São Francisco: Plano de Preservação e Recuperação de Nascentes da Bacia do Rio São Francisco; Companhia de Desenvolvimento dos Vales do São Francisco e do Parnaíba: Brasilia, Brazil, 2016.
- Vieira, R.M.S.P.; Tomasella, J.; Alvalá, R.C.S.; Sestini, M.F.; Affonso, A.G.; Rodriguez, D.A.; Barbosa, A.A.; Cunha, A.P.M.A.; Valles, G.F.; Crepani, E.; et al. Identifying Areas Susceptible to Desertification in the Brazilian Northeast. Solid Earth 2015, 6, 347–360. [Google Scholar] [CrossRef]
- Beuchle, R.; Grecchi, R.C.; Shimabukuro, Y.E.; Seliger, R.; Eva, H.D.; Sano, E.; Achard, F. Land Cover Changes in the Brazilian Cerrado and Caatinga Biomes from 1990 to 2010 Based on a Systematic Remote Sensing Sampling Approach. Appl. Geogr. 2015, 58, 116–127. [Google Scholar] [CrossRef]
- Duque, J.G. Solo e Água No Polígono Das Secas; Ministério da Viação e Obras Públicas, Departamento Nacional de Obras Contra as Secas: Brasilia, Brazil, 1980; Volume 5.
- Ribeiro, J.F.; Walter, B.M.T. Fitofisionomias do Bioma Cerrado. In Cerrado: Ambiente e Flora; Embrapa Cerrados: Brasília, Brasil, 1998. [Google Scholar]
- Oliveira-Filho, A.T.; Ratter, J.A. Vegetation Physiognomies and Woody Flora of the Cerrado Biome; Columbia University Press: New York, NY, USA, 2002; pp. 91–120. [Google Scholar]
- Bellard, C.; Leclerc, C.; Leroy, B.; Bakkenes, M.; Veloz, S.; Thuiller, W.; Courchamp, F. Vulnerability of Biodiversity Hotspots to Global Change. Glob. Ecol. Biogeogr. 2014, 23, 1376–1386. [Google Scholar] [CrossRef]
- IBGE-Instituto Brasileiro de Geografia e Estatística. Manual Técnico da Vegetação Brasileira; IBGE-Instituto Brasileiro de Geografia e Estatística: Rio de Janeiro, Brazil, 2012.
- EMBRAPA. Cerrado. Agência de Informação Embrapa Bioma Cerrado. Solos Do Cerrado. Available online: https://www.agencia.cnptia.embrapa.br/Agencia16/AG01/arvore/AG01_14_911200585231.html (accessed on 21 July 2018).
- Alvares, C.A.; Stape, J.L.; Sentelhas, P.C.; Gonçalves, J.D.M.; Sparovek, G. Köppen’s Climate Classification Map for Brazil. Meteorol. Z. 2013, 22, 711–728. [Google Scholar] [CrossRef]
- Vieira, R.M.d.S.P.; Sestini, M.F.; Tomasella, J.; Marchezini, V.; Pereira, G.R.; Barbosa, A.A.; Santos, F.C.; Rodriguez, D.A.; do Nascimento, F.R.; Santana, M.O.; et al. Characterizing Spatio-Temporal Patterns of Social Vulnerability to Droughts, Degradation and Desertification in the Brazilian Northeast. Environ. Sustain. Indic. 2020, 5, 100016. [Google Scholar] [CrossRef]
- MMA–Ministério do Meio Ambiente. Índice de Vulnerabilidade Aos Desastres Naturais Relacionados Às Secas No Contexto da Mudança do Clima. Ministério da Integração Nacional; Ministério do Meio Ambiente: Brasília, Brazil, 2017.
- Cunha, A.P.M.A.; Zeri, M.; Deusdará Leal, K.; Costa, L.; Cuartas, L.A.; Marengo, J.A.; Tomasella, J.; Vieira, R.M.; Barbosa, A.A.; Cunningham, C.; et al. Extreme Drought Events over Brazil from 2011 to 2019. Atmosphere 2019, 10, 642. [Google Scholar] [CrossRef]
- Cavalcante, L.; Dewulf, A.; van Oel, P. Fighting against, and Coping with, Drought in Brazil: Two Policy Paradigms Intertwined. Reg. Environ. Chang. 2022, 22, 111. [Google Scholar] [CrossRef]
- Bezerra, F.G.S.; Aguiar, A.P.D.; Alvalá, R.C.S.; Giarolla, A.; Bezerra, K.R.A.; Lima, P.V.P.S.; do Nascimento, F.R.; Arai, E. Analysis of Areas Undergoing Desertification, Using EVI2 Multi-Temporal Data Based on MODIS Imagery as Indicator. Ecol. Indic. 2020, 117, 106579. [Google Scholar] [CrossRef]
- Perez-Marin, A.M.; Vendruscolo, J.; Zárate-Salazar, J.R.; De Araújo Queiroz, H.A.; Magalhães, D.L.; Menezes, R.S.C.; Fernandes, I.M. Monitoring Desertification Using a Small Set of Biophysical Indicators in the Brazilian Semiarid Region. Sustainability 2022, 14, 9735. [Google Scholar] [CrossRef]
- Programa das Nações Unidas para o Desenvolvimento; Instituto de Pesquisa Econômica Aplicada; Instituto Brasileiro de Geografia e Estatística; Fundação João Pinheiro. Atlas Do Desenvolvimento Humano No Brasil/Índice de Desenvolvimento Humano Municipal [Cited 2007 Jan 18]; Programa das Nações Unidas para o Desenvolvimento. Instituto de Pesquisa Econômica Aplicada. Instituto Brasileiro de Geografia e Estatística. Fundação João Pinheiro: Brasília, Brazil, 2000. [Google Scholar]
- Costa, M.A.; Marguti, B.O.; Brasil. Ipea-Instituto de Pesquisa Econômica Aplicada. Atlas da Vulnerabilidade Social nas Regiões Metropolitanas Brasileiras; IPEA: Brasília, Brazil, 2015. [Google Scholar]
- Funk, C.; Peterson, P.; Landsfeld, M.F.; Pedreros, D.H.; Verdin, J.P.; Rowland, J.; Romero, B.E.; Husak, G.J.; Michaelsen, J.C.; Verdin, A.P. Quasi-Global Precipitation Time Series for Drought Monitoring. In U.S. Geological Survey Data Serie; USGS: Reston, VA, USA, 2014. [Google Scholar]
- Projeto MapBiomas–Coleção 5.0 Série Anual de Mapas de Cobertura e Uso de Solo do Brasil. Available online: https://https://mapbiomas.org/colecoes-mapbiomas-1 (accessed on 28 August 2021).
- Wan, Z. Collection-5 MODIS Land Surface Temperature Products Users’ Guide; ICESS, University of California: Santa Barbara, CA, USA, 2007. [Google Scholar]
- IBGE. Sistematização das Informações Sobre Recursos Naturais Mapa de Solos do Brasil; IBGE: Rio de Janeiro, Brazil, 2006.
- Vieira, R.M.d.S.P.; Tomasella, J.; Barbosa, A.A.; Polizel, S.P.; Ometto, J.P.H.B.; Santos, F.C.; Ferreira, Y.d.C.; de Toledo, P.M. Land Degradation Mapping in the MATOPIBA Region (Brazil) Using Remote Sensing Data and Decision-Tree Analysis. Sci. Total Environ. 2021, 782, 146900. [Google Scholar] [CrossRef]
- IBGE. Sistema IBGE de Recuperação Automática–SIDRA; IBGE: Rio de Janeiro, Brazil, 2019.
- Crepani, E.; Medeiros, J.S.; Azevedo, L.G.; Duarte, V.; Hernandez, P.; Florenzano, T. Curso de Sensoriamento Remoto Aplicado Ao Zoneamento Ecológico-Econômico; INPE: São José dos Campos, Brazil, 1996.
- de Figueiredo, M.C.B.; Vieira, V.P.P.B.; Mota, F.S.B. Análise da Vulnerabilidade Ambiental; Embrapa Agroindústria Tropical: Fortaleza, Brazil, 2010. [Google Scholar]
- Wijitkosum, S. Factor Influencing Land Degradation Sensitivity and Desertification in a Drought Prone Watershed in Thailand. Int. Soil Water Conserv. Res. 2021, 9, 217–228. [Google Scholar] [CrossRef]
- Abuzaid, A.S.; Abdelatif, A.D. Assessment of Desertification Using Modified MEDALUS Model in the North Nile Delta, Egypt. Geoderma 2022, 405, 115400. [Google Scholar] [CrossRef]
- Confalonieri, U.E.C. Global Environmental Change and Health in Brazil: Review the Present Situation and Proposal for Indicators for Monitoring These Effects. In Human Dimensions of Global Environmental Change; National Research Council: Washington, DC, USA, 2001. [Google Scholar]
- Taghipour-Javi, S.; Fazeli, A.; Kazemi, B. A Case Study of Desertification Hazard Mapping Using the MEDALUS (ESAs) Methodology in Southwest Iran. J. Nat. Resour. Dev. 2016, 6, 1–8. [Google Scholar] [CrossRef]
- Bedoui, C. Study of Desertification Sensitivity in Talh Region (Central Tunisia) Using Remote Sensing, G.I.S. and the M.E.D.A.L.U.S. Approach. Geoenviron. Disasters 2020, 7, 16. [Google Scholar] [CrossRef]
- Siddiqi, N. Developing and Implementing Intelligent Credit Scoring, 3rd ed.; John Wiley & Sons: Hoboken, NJ, USA, 2012. [Google Scholar]
- BRASIL. Lei N° 9.985, de 18 de Julho de 2000-Institui o Sistema Nacional de Unidades de Conservação da Natureza e de Outras Providências. Available online: https://legislacao.presidencia.gov.br/atos/?tipo=LEI&numero=9985&ano=2000&ato=77ck3aq1kMNpWTfc9 (accessed on 6 October 2021).
- MMA-Ministério do Meio Ambiente. Instrução Normativa N° 2/MMA, de 06 de Maio de 2014. Available online: https://www.car.gov.br/leis/IN_CAR.pdf (accessed on 12 October 2021).
- INCRA-Instituto Nacional de Colonização e Reforma Agrária. Classificação dos Imóveis Rurais. Available online: http://www.incra.gov.br/tamanho-propriedades-rurais (accessed on 12 October 2021).
- Alencar, M.T.D. Caracterização da Macrorregião do Semiárido Piauiense. In Semiárido Piauiense: Educação e Contexto; Silva, C.M.S., Lima, E.S., Cantalice, M.L., Alencar, M.T., Silva, W.A., Eds.; UFPB: Campina Grande, Brazil, 2010. [Google Scholar]
- Margulis, S. Vulnerabilidad y Adaptación de Las Ciudades de América Latina al Cambio Climático; Naciones Unidas Comisión Económica para América Latina y el Caribe (CEPAL): Santiago, Chile, 2017. [Google Scholar]
- Macambira, D.M.; Gomes, J.M.A. Desertificação Em Gilbués–Piauí: Uma Possível Abordagem a Partir Da História Ambiental. História Questões Debates 2021, 69, 155. [Google Scholar] [CrossRef]
- Motta, E.D.O.; Gonçalves, N.E.W. Plano Nascente Parnaíba: Plano de Preservação e Recuperação de Nascentes da Bacia do Rio Parnaíba; Companhia de Desenvolvimento dos Vales do São Francisco e do Parnaíba: Brasilia, Brazil, 2016.
- de Oliveira, G.; Araújo, M.B.; Rangel, T.F.; Alagador, D.; Diniz-Filho, J.A.F. Conserving the Brazilian Semiarid (Caatinga) Biome under Climate Change. Biodivers. Conserv. 2012, 21, 2913–2926. [Google Scholar] [CrossRef]
- Souza, C.M.; Shimbo, J.Z.; Rosa, M.R.; Parente, L.L.; Alencar, A.A.; Rudorff, B.F.T.; Hasenack, H.; Matsumoto, M.; Ferreira, L.G.; Souza-Filho, P.W.M.; et al. Reconstructing Three Decades of Land Use and Land Cover Changes in Brazilian Biomes with Landsat Archive and Earth Engine. Remote Sens. 2020, 12, 2735. [Google Scholar] [CrossRef]
- Gonçalves-Souza, D.; Vilela, B.; Phalan, B.; Dobrovolski, R. The Role of Protected Areas in Maintaining Natural Vegetation in Brazil. Sci. Adv. 2021, 7, eabh2932. [Google Scholar] [CrossRef]
- Brito, S.S.B.; Cunha, A.P.M.A.; Cunningham, C.C.; Alvalá, R.C.; Marengo, J.A.; Carvalho, M.A. Frequency, Duration and Severity of Drought in the Semiarid Northeast Brazil Region. Int. J. Climatol. 2018, 38, 517–529. [Google Scholar] [CrossRef]


| Indicators | Description | Source | |
|---|---|---|---|
| Adaptation sub-index (AI) | Municipal Human development index (in Portuguese, IDHM) | Geometric mean of the normalized indices of the economic, educational, and longevity conditions | [49] |
| Social vulnerability index (in Portuguese, IVS) | Arithmetic mean of the sub-indices: IVS Urban Infrastructure, IVS Human Capital, and IVS Income and Labor | [50] | |
| Sensitivity sub-index (SI) | Number of days without rain | Days with no rain (annual average period 2001 to 2018) | [51] |
| Land use and land cover | Land-use and land cover classes in the year 2018 based on the MapBiomas—Collection 5.0 mapping | [52] | |
| Surface temperature | Average temperature (2001 to 2018) | [53] | |
| Soil type | Soil map | [54] | |
| Exposure sub-index (EI) | Soil degradation/desertification | Based on NDVI images (period 1985 to 2019) | [55] |
| Population density | Population density by area (2010) | [56] |
| IV | Predictiveness |
|---|---|
| Less than 0.02 | Not useful for prediction |
| 0.02 to 0.1 | Weak predictive power |
| 0.1 to 0.3 | Medium predictive power |
| 0.3 to 0.5 | Strong predictive power |
| Greater than 0.5 | Suspicious predictive power |
Disclaimer/Publisher’s Note: The statements, opinions and data contained in all publications are solely those of the individual author(s) and contributor(s) and not of MDPI and/or the editor(s). MDPI and/or the editor(s) disclaim responsibility for any injury to people or property resulting from any ideas, methods, instructions or products referred to in the content. |
© 2023 by the authors. Licensee MDPI, Basel, Switzerland. This article is an open access article distributed under the terms and conditions of the Creative Commons Attribution (CC BY) license (https://creativecommons.org/licenses/by/4.0/).
Share and Cite
Vieira, R.M.d.S.P.; Tomasella, J.; Cunha, A.P.M.d.A.; Barbosa, A.A.; Pompeu, J.; Ferreira, Y.; Santos, F.C.; Alves, L.M.; Ometto, J. Socio-Environmental Vulnerability to Drought Conditions and Land Degradation: An Assessment in Two Northeastern Brazilian River Basins. Sustainability 2023, 15, 8029. https://doi.org/10.3390/su15108029
Vieira RMdSP, Tomasella J, Cunha APMdA, Barbosa AA, Pompeu J, Ferreira Y, Santos FC, Alves LM, Ometto J. Socio-Environmental Vulnerability to Drought Conditions and Land Degradation: An Assessment in Two Northeastern Brazilian River Basins. Sustainability. 2023; 15(10):8029. https://doi.org/10.3390/su15108029
Chicago/Turabian StyleVieira, Rita Marcia da Silva Pinto, Javier Tomasella, Ana Paula Martins do Amaral Cunha, Alexandre Augusto Barbosa, João Pompeu, Yara Ferreira, Fabrícia Cristina Santos, Lincoln Muniz Alves, and Jean Ometto. 2023. "Socio-Environmental Vulnerability to Drought Conditions and Land Degradation: An Assessment in Two Northeastern Brazilian River Basins" Sustainability 15, no. 10: 8029. https://doi.org/10.3390/su15108029
APA StyleVieira, R. M. d. S. P., Tomasella, J., Cunha, A. P. M. d. A., Barbosa, A. A., Pompeu, J., Ferreira, Y., Santos, F. C., Alves, L. M., & Ometto, J. (2023). Socio-Environmental Vulnerability to Drought Conditions and Land Degradation: An Assessment in Two Northeastern Brazilian River Basins. Sustainability, 15(10), 8029. https://doi.org/10.3390/su15108029