
Sustainability Assessment of Regional Water Resources in China Based on DPSIR Model

Abstract
1. Introduction
2. Research Methods and Data Sources
2.1. DPSIR Model Construction and Index Identification
2.1.1. WRCC Logic Based on DPSIR Model
2.1.2. Evaluation Index Selection
2.2. Research Methods
2.2.1. Combination Weighting of Entropy Weight and Coefficient of Variation—TOPSIS Method
- (1)
- Index normalization. Suppose the original matrix is ; m is the number of provinces; n is the number of indicators; and is the original data of the i-th province and the j-th indicator. For positive indicators and negative indicators, normalization processing is performed respectively, and a standardized matrix is obtained after processing. The specific formula is
- (2)
- Determine the index weight. To use the entropy weight method to calculate the index weight, the matrix Y is first normalized to obtain the matrix . The calculation formula is as follows.
- (3)
- Construct TOPSIS model
- (4)
- Calculation of WRCC index
2.2.2. Spatial Autocorrelation Analysis
2.2.3. Geodetector
2.3. Data Sources
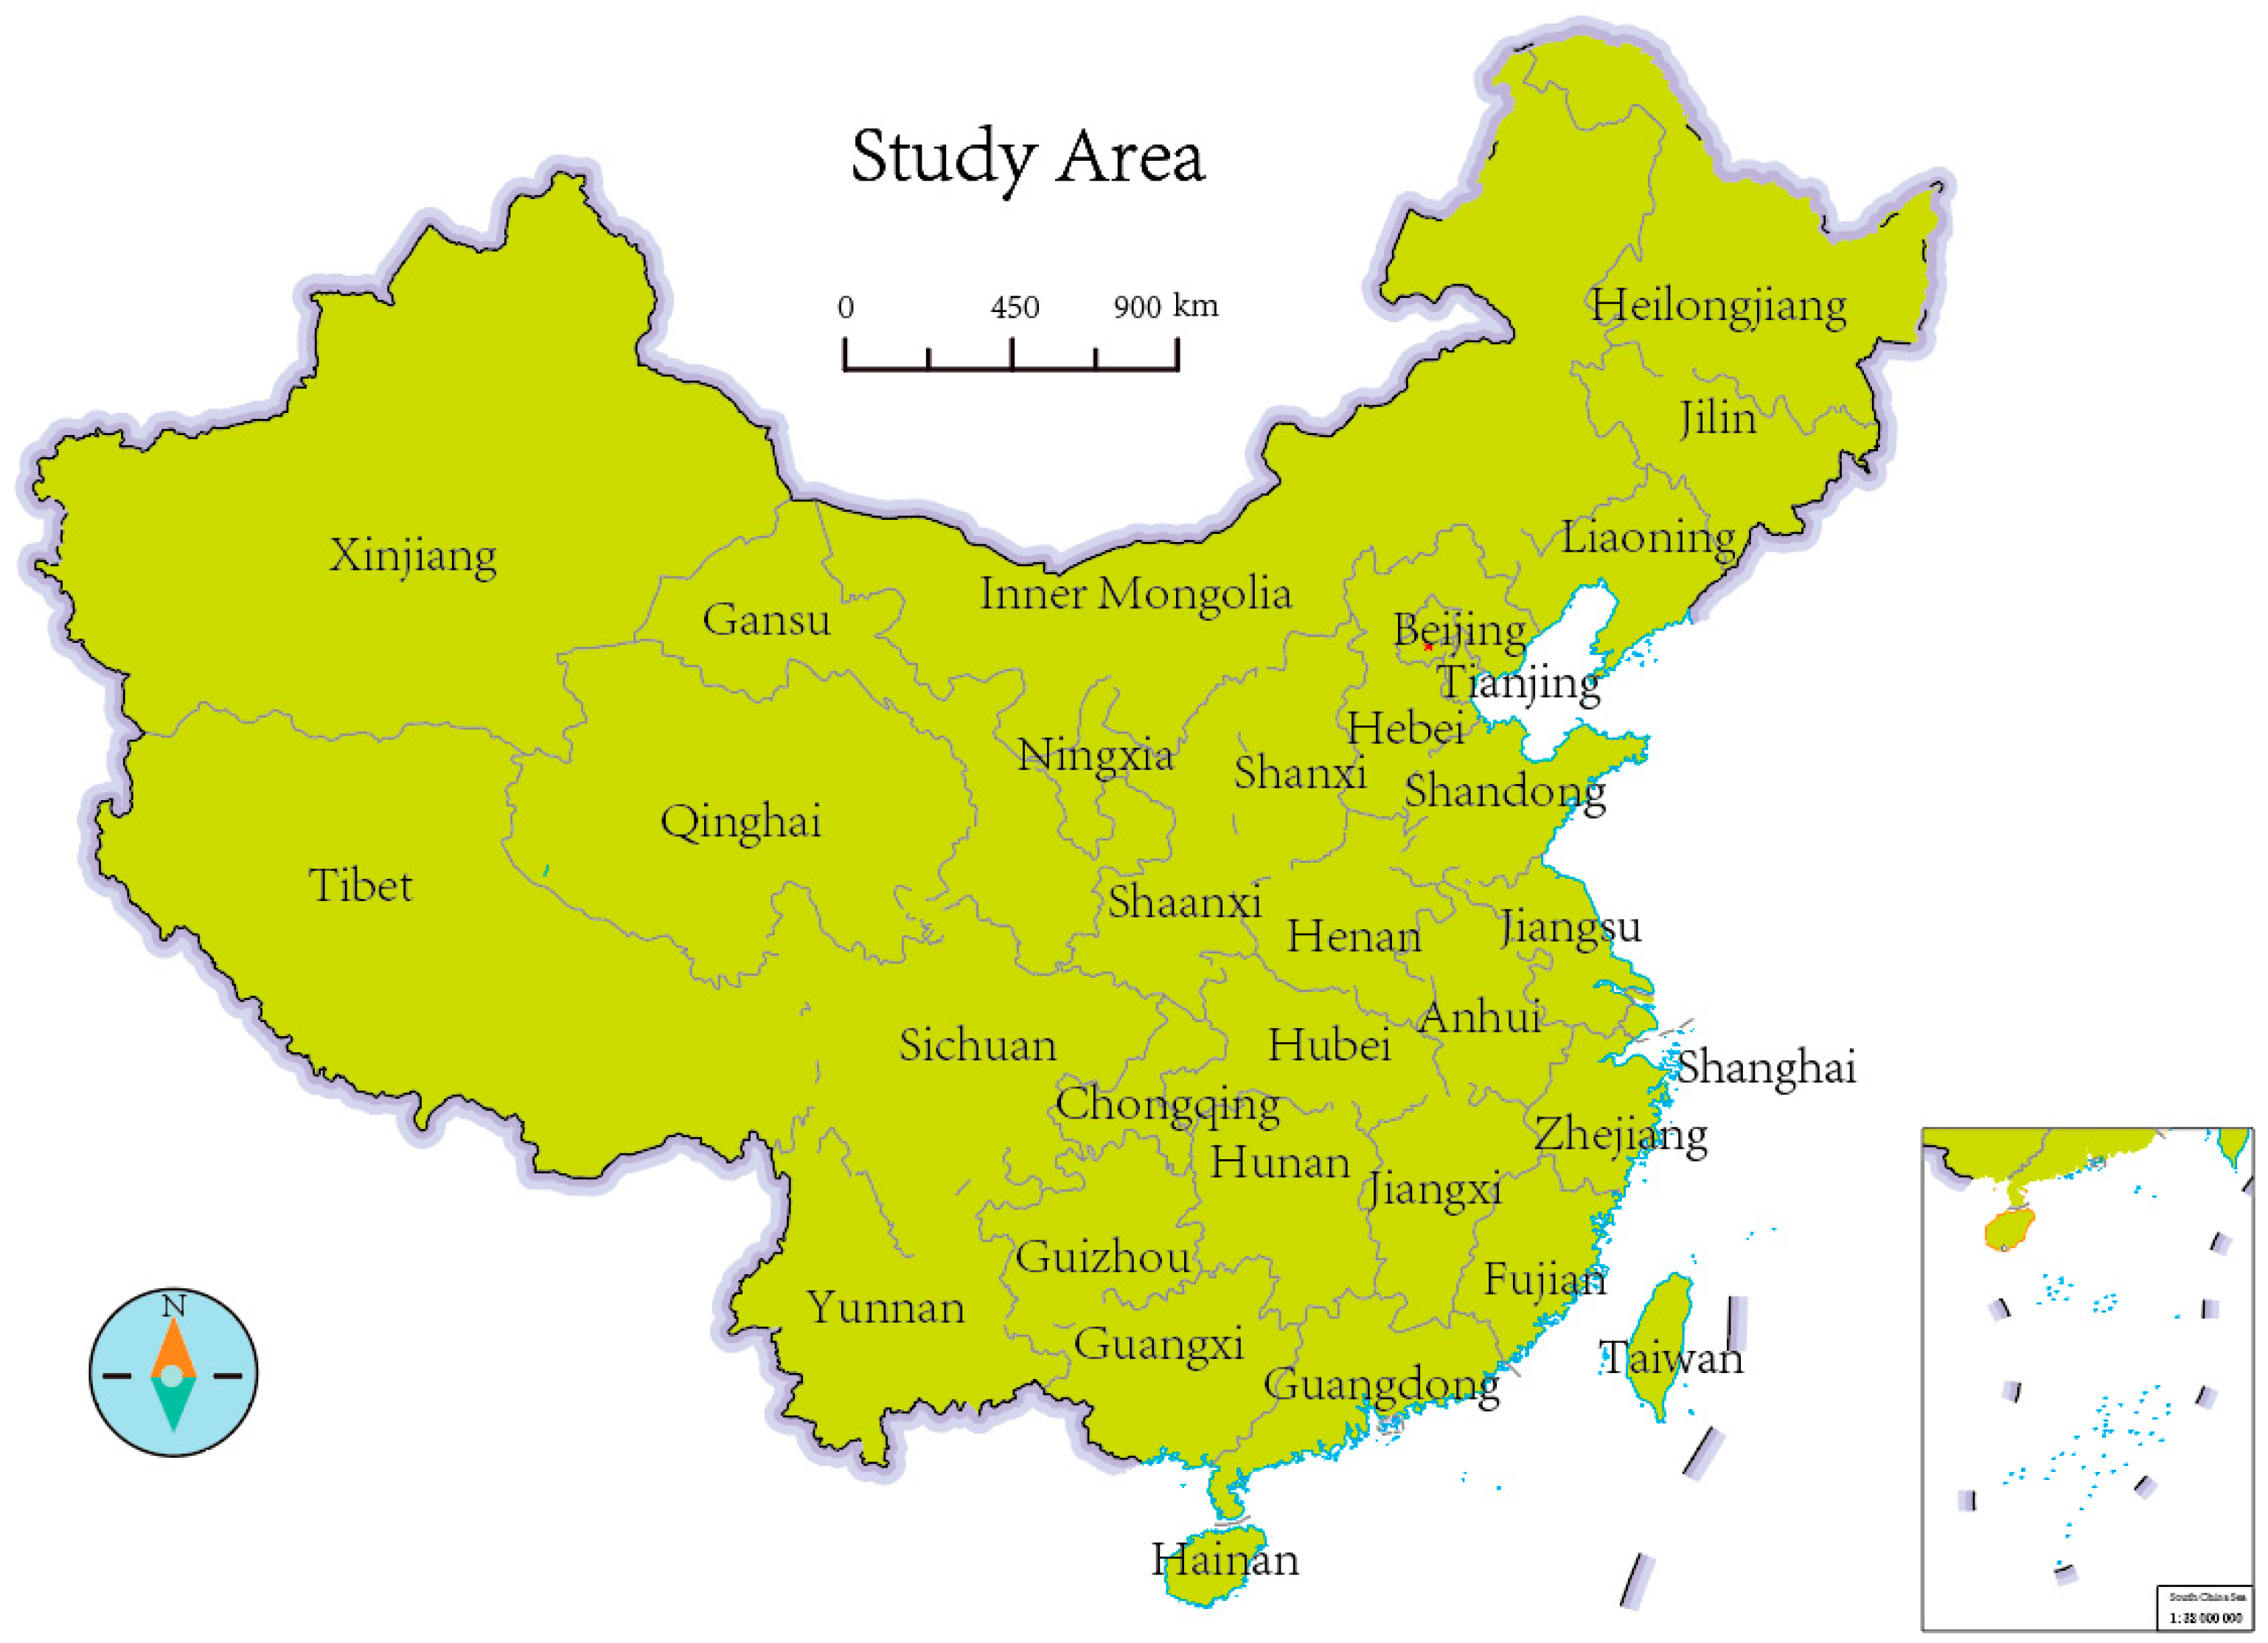
2.4. Study Area
3. Spatial-Temporal Changes of Inter-Provincial WRCC in China
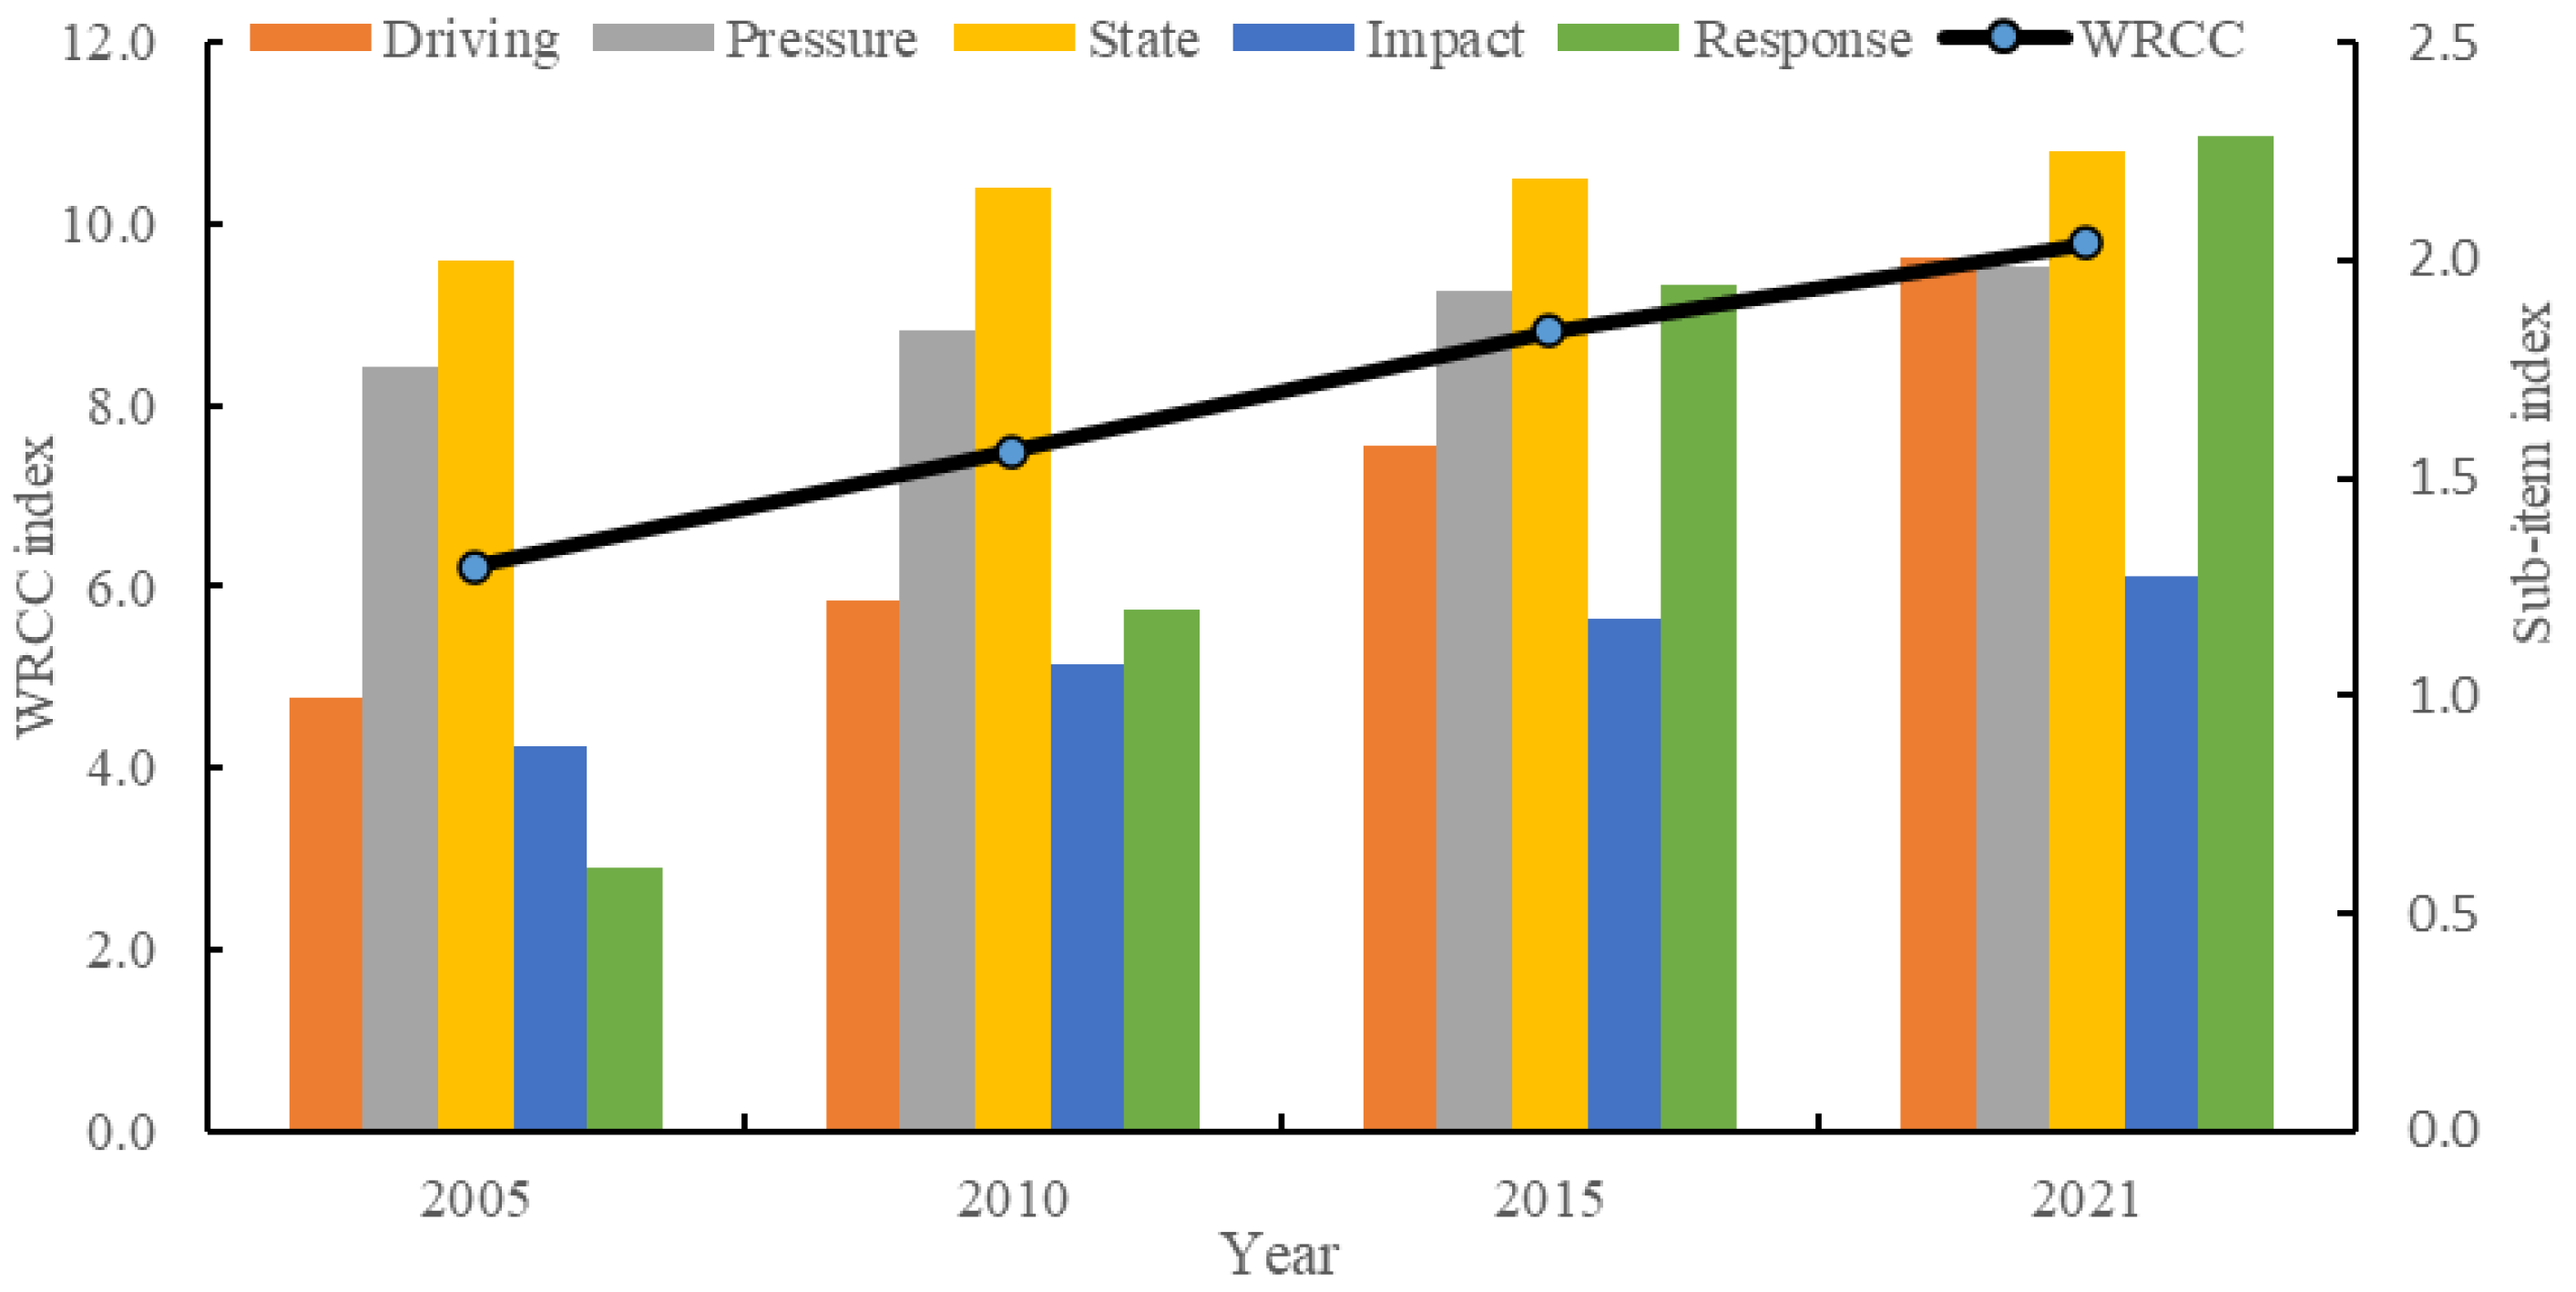
3.1. Time Change Analysis of WRCC in China
3.2. Spatial Change Analysis of WRCC in China
3.2.1. Spatial Pattern of WRCC in China
3.2.2. Spatial Change Trend of WRCC in China
3.3. Spatial Correlation Analysis of WRCC in China
3.3.1. Global Spatial Autocorrelation Analysis on WRCC in China
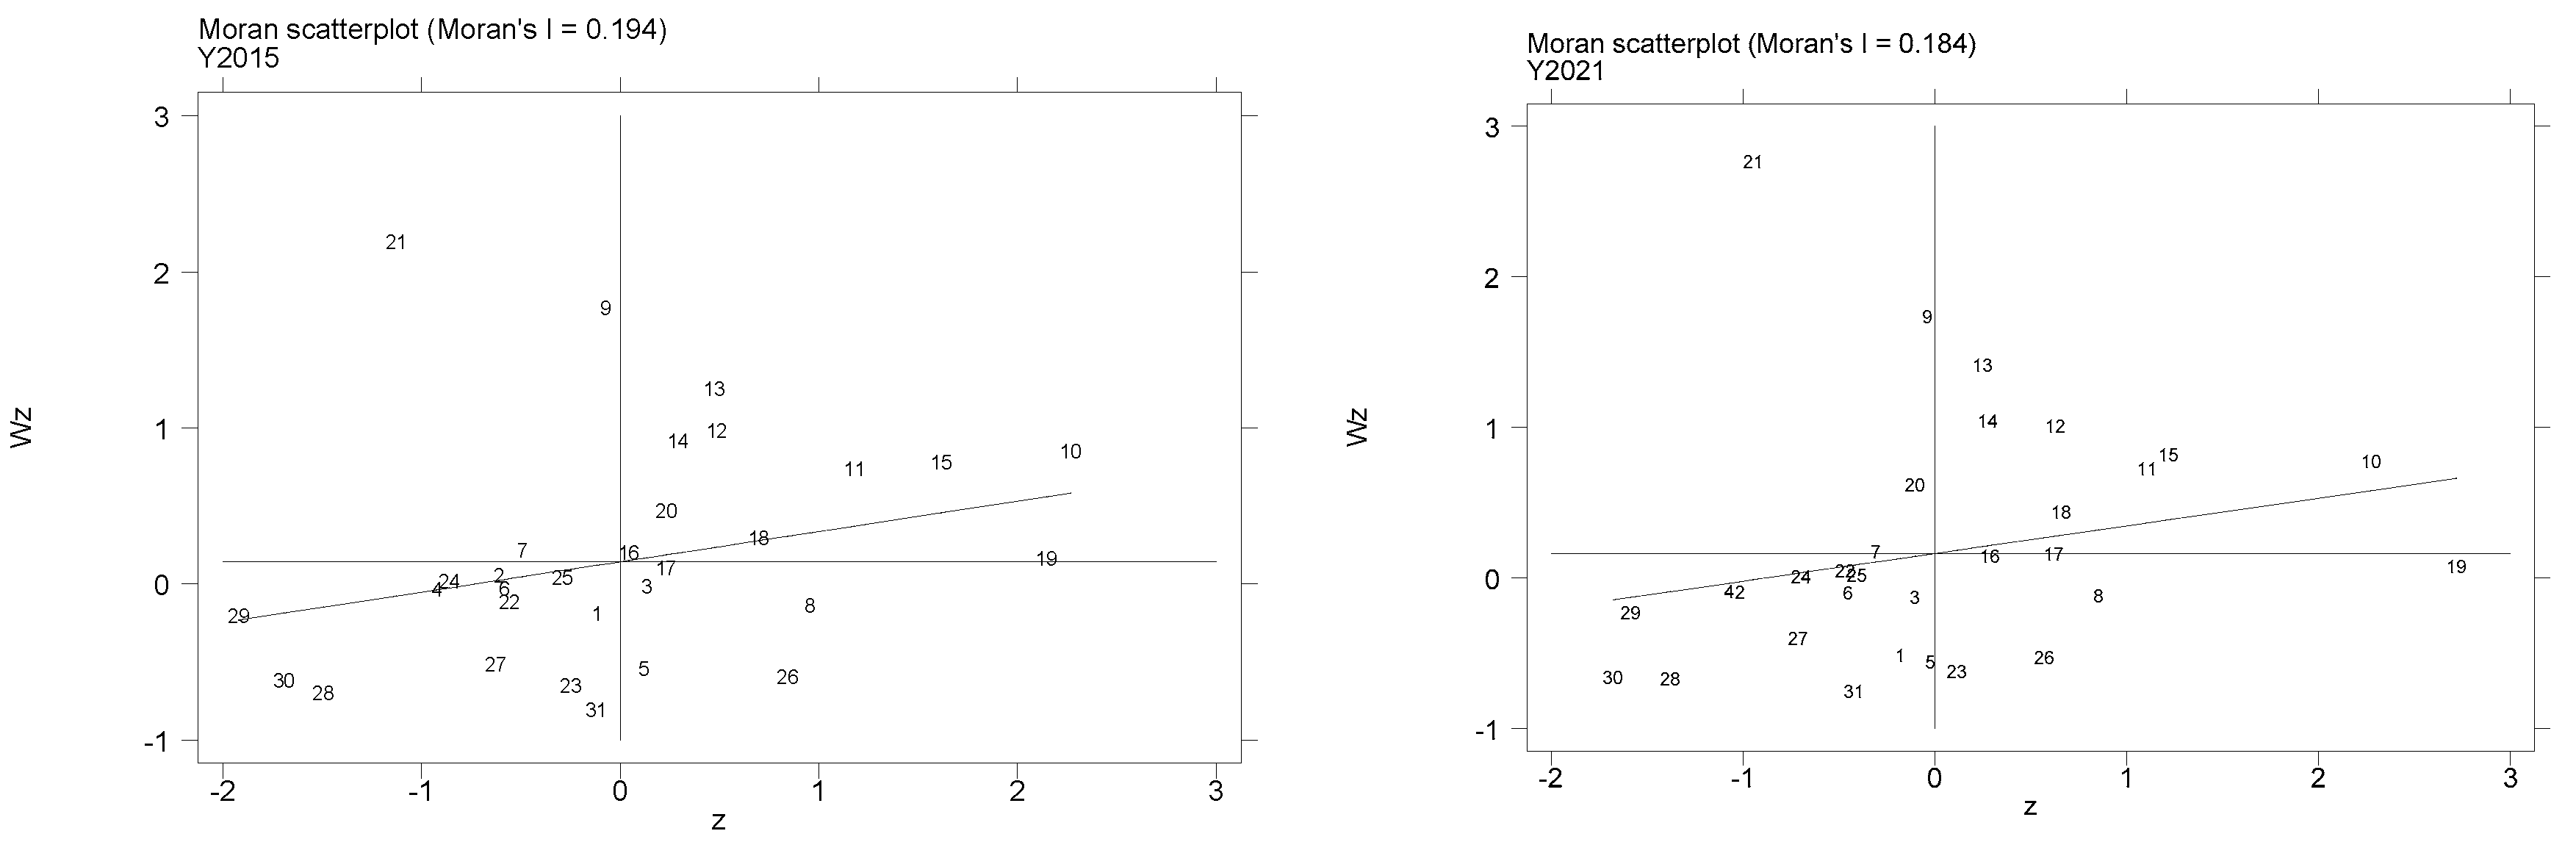
3.3.2. Local Spatial Autocorrelation Analysis of WRCC in China
- (1)
- The HH agglomeration areas are mainly distributed in southeastern China, including Jiangsu, Zhejiang, Anhui, Fujian, Jiangxi, Hunan, and Hubei provinces, forming areas with high WRCC index values. This area has expanded significantly after 2010, mainly because most of the provinces in this area are coastal provinces with relatively high rainfall, good economic development, and rapid water pollution control. However, since 2010, provinces in the HH region have gradually decreased. Henan, Hubei, Guangdong, and Guangxi have changed from HH agglomeration to HL agglomeration or LH agglomeration in 2021, which is mainly caused by the increasing gap between regions.
- (2)
- HL agglomeration areas are very scattered throughout the country, and there are very few provinces in this state. In 2005, HL agglomeration areas were Hubei, Hunan, and Tibet. In 2010, they were Hebei, Heilongjiang, and Tibet. In 2015, they were Hebei and Inner Mongolia, Heilongjiang, Hubei, and Tibet; in 2021, they are Heilongjiang, Henan, Hubei, Guangdong, Sichuan, and Tibet. Tibet has been in a state of HL agglomeration. Shanxi, Chongqing, and Yunnan adjacent to this area are in the state of LL agglomeration, with a tendency of “spreading”. Water resource management should be strengthened to improve the WRCC of the province. Hunan is in the state of HH agglomeration, and it is necessary to strengthen the effective supervision of water resources.
- (3)
- The spatial distribution of LH agglomeration is relatively stable, which mainly is in Shanghai, Hainan, Guangxi, and other provinces. Due to their closeness to the HH and LL agglomeration areas, they are extremely affected. Jilin LL agglomeration changed to LH agglomeration from 2015 to 2021; Yunnan and Qinghai changed from LH agglomeration to LL agglomeration from 2015 to 2021. Guangxi was LH agglomeration in 2005 and changed to HH agglomeration in 2010–2015, and it transformed into LH agglomeration in 2021. Overall, the differences in economic development levels are an important factor causing changes in LL, HH, and other indicators, reflecting the need for provinces such as Guangxi and Jilin to refer to the experience of neighboring provinces in economic development and formulate corresponding industry and economic development policies.
- (4)
- The LL agglomeration areas are located in the west and north of China. The number of provinces with LL agglomeration status has not changed during 2010–2015, but the regional scope has been adjusted as a whole. Inner Mongolia has changed from LL agglomeration to HL agglomeration; Jilin has changed from LL agglomeration to LH agglomeration; Yunnan and Qinghai changed from LH agglomeration to LL agglomeration; the number of provinces which are in LL agglomeration state increased by 1 during 2015–2021; Hebei and Inner Mongolia changed from HL agglomeration to LL agglomeration from a regional perspective; Sichuan has changed from LL agglomeration to HL agglomeration. In 2021, both northern China and northwestern China were in a state of LL agglomeration. It shows that the western and northern regions of China form a spatial agglomeration area with low WRCC, and the surrounding areas have a tendency to spread into the areas.
4. Analysis of Influencing Factors of Spatial Differences of WRCC
4.1. Intensity of Influencing Factors of WRCC in China
4.2. Multi-Factor Interactive Detection Analysis
5. Conclusions and Recommendations
5.1. Conclusions
- (1)
- From 2005 to 2021, China’s WRCC showed a continuous upward trend. During the study period, the number of provinces whose WRCCs are in level IV increased from 1 to 12, and the number of level I provinces decreased from 20 to 0. The WRCCs of Tibet, Guangdong, Jiangsu, and Zhejiang are firmly at the forefront of China, while the WRCCs of Ningxia, Qinghai, Gansu, and other provinces rank low.
- (2)
- The center of WRCC is generally moving to the southeast, indicating that the WRCC in the southeast is steadily improving. The increase is greater than that in the west and north, and the regional gap is increasing. Through the global autocorrelation analysis, it can be seen that the spatial correlation of China’s WRCC index is obvious; the positive correlation characteristics are significant; and the correlation intensity fluctuates. The local autocorrelation analysis shows that the number of cities in China where WRCCs are concentrated in HH and LL dropped from 23 in 2005 to 21 in 2021, indicating that the spatial aggregation characteristics of WRCC continue to weaken.
- (3)
- The degree of influence of each driving factor on the spatial differences of WRCC in different periods is different. Since 2006, the main factors affecting the spatial differences of WRCC have been along the line of “industrial wastewater discharge → sewage treatment capacity → industrial scientific research expenditure above designated size”. In the direction of industrial scientific research expenditures, the intensity of action of sewage treatment capacity and industrial scientific research expenditures above designated size continued to rise, while the intensity of action of industrial wastewater discharge continued to decline. After any factor interacted, it showed double-factor enhancement or non-linear enhancement, reflecting the complexity characteristics between compound factors and WRCC level.
- (4)
- The regional differences in China’s WRCC levels are the result of the combined effects of multiple factors, with the interaction between these factors having a greater impact on the overall effect than the effect of individual factors. Specifically, 63.2% of the factors exhibit non-linear enhancement, and 36.8% exhibit bi-factor enhancement. Improving China’s WRCC level requires balancing the individual effects and the interactions of multiple factors, while ensuring economic and social development, technological progress, industrial transformation, and other related factors.
5.2. Recommendations
- (1)
- Further narrow the development gap between regions and promote coordinated regional economic development. While optimizing regional industrial structure, strengthen cooperation between different regions; promote the flow of resources, technology, and talent; and achieve complementary development between regions.
- (2)
- Strengthen investment in science and technology and research and development to improve water resource utilization efficiency and reduce waste. Increase support for technological innovation in water resources; encourage innovation by enterprises and teams; strengthen the transformation and application of scientific and technological achievements; and promote the scientific management and efficient utilization of water resources.
- (3)
- Reduce the amount of water used per unit of industrial value added and the amount of industrial wastewater discharged. This can be achieved through optimizing industrial structure and production processes, promoting water-saving and emission reduction technologies, increasing investment in sewage treatment capacity, and reducing pollutant emissions. At the same time, strengthen supervision of industrial enterprises; strictly enforce environmental laws and standards; and achieve coordinated development of industrial production and environmental protection.
- (4)
- Build water-saving cities and communities by optimizing urban planning and management, strengthening the management and utilization of urban water resources, promoting green buildings and ecological urban construction, and promoting the sustainable utilization and protection of urban water resources. Encourage and support community residents to actively participate in water-saving activities and actions to jointly achieve water-saving goals.
Author Contributions
Funding
Institutional Review Board Statement
Informed Consent Statement
Data Availability Statement
Conflicts of Interest
References
- Ren, C.F.; Ping, G.; Mo, L.; Li, R. An innovative method for water resources carrying capacity research–metabolic theory of regional water resources. J. Environ. Manag. 2016, 167, 139–146. [Google Scholar] [CrossRef]
- Wang, M.; Wang, K.X. Exploring Water Landscape Adaptability of Urban Spatial Development Base on Coupling Coordination Degree Model a Case of Caidian District, Wuhan. Sustainability 2021, 13, 1475. [Google Scholar] [CrossRef]
- Wang, M.; Webber, M.; Finlayson, B.; Barnett, J. Rural industries and water pollution in China. J. Environ. Manag. 2008, 86, 648–659. [Google Scholar] [CrossRef] [PubMed]
- Zhai, Y.J.; Zhang, T.Z.; Ma, X.T.; Shen, X.X.; Ji, C.X.; Bai, Y.Y. Life cycle water footprint analysis of crop production in China. Agric. Water Manag. 2021, 256, 107079. [Google Scholar] [CrossRef]
- Meng, X.J.; Wu, L. Prediction of per capita water consumption for 31 regions in China. Environ. Sci. Pollut. Res. 2021, 28, 29253–29264. [Google Scholar] [CrossRef] [PubMed]
- Wei, Y.; Wang, R.; Zhuo, X.; Feng, H. Research on comprehensive evaluation and coordinated development of water resources carrying capacity in Qingjiang River Basin, China. Sustainability 2021, 13, 10091. [Google Scholar] [CrossRef]
- Jiang, M.; Webber, M.; Barnett, J.; Rogers, S.; Rutherfurd, I.; Wang, M.; Finlayson, B. Beyond contradiction: The state and the market in contemporary Chinese water governance. Geoforum 2020, 108, 246–254. [Google Scholar] [CrossRef]
- Yang, Q.; Gao, D.; Song, D.; Li, Y. Environmental regulation, pollution reduction and green innovation: The case of the Chinese Water Ecological Civilization City Pilot policy. Econ. Syst. 2021, 45, 100911. [Google Scholar] [CrossRef]
- Wang, J.; Zhu, Y.; Sun, T.; Huang, J.; Zhang, L.; Guan, B.; Huang, Q. Forty years of irrigation development and reform in China. Aust. J. Agric. Resour. Econ. 2020, 64, 126–149. [Google Scholar] [CrossRef]
- Song, M.; Tao, W.; Shang, Y.; Zhao, X. Spatiotemporal characteristics and influencing factors of China’s urban water resource utilization efficiency from the perspective of sustainable development. J. Clean. Prod. 2022, 338, 130649. [Google Scholar] [CrossRef]
- Plumb, G.E.; White, P.J.; Coughenour, M.B.; Wallen, R.L. Carrying capacity, migration, and dispersal in Yellowstone bison. Biol. Conserv. 2009, 142, 2377–2387. [Google Scholar] [CrossRef]
- Kessler, J.J. Usefulness of the human carrying-capacity concept in assessing ecological sustainability of land-use in semiarid regions. Agric. Ecosyst. Environ. 1994, 48, 273–284. [Google Scholar] [CrossRef]
- Wang, B.; Wang, B.; Zhao, X.; Li, J.; Zhang, D. Study and Evaluation of Dynamic Carrying Capacity of Groundwater Resources in Hebei Province from 2010 to 2017. Sustainability 2023, 15, 4394. [Google Scholar] [CrossRef]
- Feng, L.H.; Huang, C.F. A risk assessment model of water shortage based on information diffusion technology and its application in analyzing carrying capacity of water resources. Water Resour. Manag. 2008, 22, 621–633. [Google Scholar] [CrossRef]
- Clarke, A.L. Assessing the carrying capacity of the Florida Keys. Popul. Environ. 2002, 23, 405–418. [Google Scholar] [CrossRef]
- Song, X.M.; Kong, F.Z.; Zhan, C.S. Assessment of water resources carrying capacity in Tianjin City of China. Water Resour. Manag. 2011, 25, 857–873. [Google Scholar] [CrossRef]
- Xu, Y.P. Study on comprehensive evaluation of water resources carrying capacity in arid area-Taking Hotan River Basin in Xinjiang as an example. J. Nat. Resour. 1993, 8, 229–237. [Google Scholar]
- Zuo, Q.T. Summary and Reconsideration on Research Methods of Water Resources Carrying Capacity. Prog. Water Conserv. Hydropower Technol. 2017, 37, 1–6+54. [Google Scholar]
- Dou, M.; Ma, J.X.; Li, G.Q.; Zuo, Q.T. Measurement and assessment of water resources carrying capacity in Henan Province, China. Water Sci. Eng. 2015, 8, 102–113. [Google Scholar] [CrossRef]
- Magri, A.; Berezowska-Azzag, E. New tool for assessing urban water carrying capacity (WCC) in the planning of development programs in the region of Oran, Algeria. Sustain. Cities Soc. 2019, 48, 101316. [Google Scholar] [CrossRef]
- He, L.; Du, Y.; Wu, S.; Zhang, Z. Evaluation of the agricultural water resource carrying capacity and optimization of a planting-raising structure. Agric. Water Manag. 2021, 243, 106456. [Google Scholar] [CrossRef]
- Chi, M.; Zhang, D.; Fan, G.; Zhang, W.; Liu, H. Prediction of water resource carrying capacity by the analytic hierarchy process-fuzzy discrimination method in a mining area. Ecol. Indic. 2019, 96, 647–655. [Google Scholar] [CrossRef]
- Yang, Z.; Song, J.; Cheng, D.; Xia, J.; Li, Q.; Ahamad, M.I. Comprehensive evaluation and scenario simulation for the water resources carrying capacity in Xi’an city, China. J. Environ. Manag. 2019, 230, 221–233. [Google Scholar] [CrossRef]
- Zhao, Y.; Wang, Y.; Wang, Y. Comprehensive evaluation and influencing factors of urban agglomeration water resources carrying capacity. J. Clean. Prod. 2021, 288, 125097. [Google Scholar] [CrossRef]
- Cui, Y.; Zhou, Y.; Jin, J.; Wu, C.; Zhang, L.; Ning, S. Quantitative evaluation and diagnosis of water resources carrying capacity (WRCC) based on dynamic difference degree coefficient in the Yellow River irrigation district. Front. Earth Sci. 2022, 10, 816055. [Google Scholar] [CrossRef]
- Peng, T.; Deng, H.; Lin, Y.; Jin, Z. Assessment on water resources carrying capacity in karst areas by using an innovative DPESBRM concept model and cloud model. Sci. Total Environ. 2021, 767, 144353. [Google Scholar] [CrossRef] [PubMed]
- Wang, G.; Xiao, C.; Qi, Z.; Liang, X.; Meng, F.; Sun, Y. Water resource carrying capacity based on water demand prediction in Chang-Ji economic circle. Water 2020, 13, 16. [Google Scholar] [CrossRef]
- Han, Y.; Zhang, S.; Lv, A.; Zeng, H. Risk assessment of the water resources carrying capacity: A case study in North China. J. Am. Water Resour. Assoc. 2022, 58, 1240–1254. [Google Scholar] [CrossRef]
- Lv, A.; Han, Y.; Zhu, W.; Zhang, S.; Zhao, W. Risk assessment of water resources carrying capacity in China. J. Am. Water Resour. Assoc. 2021, 57, 539–551. [Google Scholar] [CrossRef]
- Cao, F.; Lu, Y.; Dong, S.; Li, X. Evaluation of natural support capacity of water resources using principal component analysis method: A case study of Fuyang district, China. Appl. Water Sci. 2020, 10, 192. [Google Scholar] [CrossRef]
- Xu, D.; Hou, G. The Spatiotemporal Coupling Characteristics of Regional Urbanization and Its Influencing Factors: Taking the Yangtze River Delta as an Example. Sustainability 2019, 11, 822. [Google Scholar] [CrossRef]
- Ren, L.; Gao, J.; Song, S.; Li, Z.; Ni, J. Evaluation of water resources carrying capacity in Guiyang City. Water 2021, 13, 2155. [Google Scholar] [CrossRef]
- Yao, L.; Li, X.L.; Li, Q.; Wang, J.K. Temporal and Spatial Changes in Coupling and Coordinating Degree of New Urbanization and Ecological-Environmental Stress in China. Sustainability 2019, 11, 1171. [Google Scholar] [CrossRef]
- Wei, C.; Lin, Q.; Yu, L.; Zhang, H.; Ye, S.; Zhang, D. Research on Sustainable Land Use Based on Production–Living–Ecological Function: A Case Study of Hubei Province, China. Sustainability 2021, 13, 996. [Google Scholar] [CrossRef]
- Lu, M.; Wang, S.; Wang, X.; Liao, W.; Wang, C.; Lei, X.; Wang, H. An assessment of temporal and spatial dynamics of regional water resources security in the DPSIR framework in Jiangxi Province, China. Int. J. Environ. Res. Public Health 2022, 19, 3650. [Google Scholar] [CrossRef] [PubMed]
- Zhang, X.Y.; Du, X.F.; Li, Y.B. Comprehensive evaluation of water resources carrying capacity in ecological irrigation districts based on fuzzy set pair analysis. Desalin. Water Treat. 2020, 187, 63–69. [Google Scholar] [CrossRef]
- Ni, X.; Wu, Y.; Wu, J.; Lu, J.; Wilson, P.C. Scenario analysis for sustainable development of Chongming Island: Water resources sustainability. Sci. Total Environ. 2012, 439, 129–135. [Google Scholar] [CrossRef]
- Wang, X.; Liu, L.; Zhang, S.; Gao, C. Dynamic simulation and comprehensive evaluation of the water resources carrying capacity in Guangzhou city, China. Ecol. Indic. 2022, 135, 108528. [Google Scholar] [CrossRef]
- Wang, G.; Xiao, C.; Qi, Z.; Meng, F.; Liang, X. Development tendency analysis for the water resource carrying capacity based on system dynamics model and the improved fuzzy comprehensive evaluation method in the Changchun city, China. Ecol. Indic. 2021, 122, 107232. [Google Scholar] [CrossRef]
- Carr, E.R.; Wingard, P.M.; Yorty, S.C.; Thompson, M.C.; Jensen, N.K.; Roberson, J. Applying DPSIR to sustainable development. Int. J. Sustain. Dev. World Ecol. 2007, 14, 543–555. [Google Scholar] [CrossRef]
- Gari, S.R.; Newton, A.; Icely, J.D. A review of the application and evolution of the DPSIR framework with an emphasis on coastal social-ecological systems. Ocean Coast. Manag. 2015, 103, 63–77. [Google Scholar] [CrossRef]
- Demarco, C.F.; Quadro, M.S.; Selau Carlos, F.; Pieniz, S.; Morselli, L.B.G.A.; Andreazza, R. Bioremediation of Aquatic Environments Contaminated with Heavy Metals: A Review of Mechanisms, Solutions and Perspectives. Sustainability 2023, 15, 1411. [Google Scholar] [CrossRef]
- Mirchi, A.; Madani, K.; Watkins, D.; Ahmad, S. Synthesis of system dynamics tools for holistic conceptualization of water resources problems. Water Resour. Manag. 2012, 26, 2421–2442. [Google Scholar] [CrossRef]
- Zuo, Q.; Guo, J.; Ma, J.; Cui, G.; Yang, R.; Yu, L. Assessment of regional-scale water resources carrying capacity based on fuzzy multiple attribute decision-making and scenario simulation. Ecol. Indic. 2021, 130, 108034. [Google Scholar] [CrossRef]
- Wang, Y.; Cheng, H.; Huang, L. Water resources carrying capacity evaluation of a dense city group: A comprehensive water resources carrying capacity evaluation model of Wuhan urban agglomeration. Urban Water J. 2018, 15, 615–625. [Google Scholar] [CrossRef]
- Peng, T.; Deng, H. Comprehensive evaluation on water resource carrying capacity in karst areas using cloud model with combination weighting method: A case study of Guiyang, southwest China. Environ. Sci. Pollut. Res. 2020, 27, 37057–37073. [Google Scholar] [CrossRef]
- Zhao, J.; Jin, J.; Zhu, J.; Xu, J.; Hang, Q.; Chen, Y.; Han, D. Water resources risk assessment model based on the subjective and objective combination weighting methods. Water Resour. Manag. 2016, 30, 3027–3042. [Google Scholar] [CrossRef]
- Rousset, F.; Ferdy, J.B. Testing environmental and genetic effects in the presence of spatial autocorrelation. Ecography 2014, 37, 781–790. [Google Scholar] [CrossRef]


| Target Layer | Standard Layer | Index Layer | Unit | Indicator Property | Comprehensive Weight |
|---|---|---|---|---|---|
| WRCC Evaluation Index System | Driving force (D) | X1: GDP per capita | yuan/person | + | 0.047 |
| X2: Urbanization rate | % | + | 0.023 | ||
| X3: Population density | person/km2 | − | 0.009 | ||
| X4: Proportion of tertiary industries | % | + | 0.030 | ||
| Pressure (P) | X5: Discharge of industrial wastewater | kiloton | − | 0.011 | |
| X6: Fertilizer application per unit of cultivated land area | t/hm2 | − | 0.011 | ||
| X7: Water consumption per 10,000 yuan of industrial added value | m3 | − | 0.010 | ||
| X8: Water consumption per 10,000 yuan of GDP | m3 | − | 0.005 | ||
| X9: Domestic water consumption per capita | m3 | − | 0.022 | ||
| State (S) | X10: Precipitation | 108 m3 | + | 0.035 | |
| X11: Per capita water resources | m3/person | + | 0.288 | ||
| X12: Grain production per capita | t/person | + | 0.053 | ||
| X13: Water supply of surface water resources | 108 m3 | + | 0.061 | ||
| X14: Forest coverage | % | + | 0.040 | ||
| Influence (I) | X15: Water supply penetration rate | % | + | 0.007 | |
| X16: Effective irrigation area | 103 hm | + | 0.053 | ||
| X17: Green coverage rate of built-up areas | % | + | 0.014 | ||
| Response (R) | X18: Expenditure on industrial scientific research above designated size | ten thousand yuan | + | 0.119 | |
| X19: Investment amount completed in industrial pollution control | ten thousand yuan | + | 0.068 | ||
| X20: Sewage treatment rate | % | + | 0.034 | ||
| X21: Sewage treatment capacity | 104 m3/day | + | 0.062 |
| Serial Number | Province | Sort by Position | WRCC Index | ||||
|---|---|---|---|---|---|---|---|
| W–E Index | S–N Index | 2005 | 2010 | 2015 | 2021 | ||
| 1 | Beijing | 21 | 26 | 0.199 | 0.242 | 0.278 | 0.305 |
| 2 | Tianjing | 24 | 25 | 0.175 | 0.205 | 0.253 | 0.254 |
| 3 | Hebei | 19 | 23 | 0.199 | 0.242 | 0.291 | 0.310 |
| 4 | Shanxi | 14 | 22 | 0.158 | 0.207 | 0.236 | 0.250 |
| 5 | Inner Mongolia | 13 | 27 | 0.180 | 0.225 | 0.290 | 0.314 |
| 6 | Liaoning | 29 | 28 | 0.194 | 0.223 | 0.254 | 0.288 |
| 7 | Jilin | 30 | 29 | 0.192 | 0.215 | 0.259 | 0.297 |
| 8 | Heilongjiang | 31 | 31 | 0.196 | 0.247 | 0.334 | 0.368 |
| 9 | Shanghai | 28 | 14 | 0.180 | 0.235 | 0.281 | 0.313 |
| 10 | Jiangsu | 25 | 16 | 0.258 | 0.319 | 0.402 | 0.455 |
| 11 | Zhejiang | 27 | 11 | 0.236 | 0.283 | 0.345 | 0.383 |
| 12 | Anhui | 22 | 15 | 0.203 | 0.260 | 0.310 | 0.354 |
| 13 | Fujian | 26 | 5 | 0.234 | 0.271 | 0.309 | 0.331 |
| 14 | Jiangxi | 20 | 8 | 0.212 | 0.269 | 0.299 | 0.333 |
| 15 | Shandong | 23 | 21 | 0.252 | 0.294 | 0.368 | 0.390 |
| 16 | Henan | 17 | 18 | 0.198 | 0.241 | 0.287 | 0.333 |
| 17 | Hubei | 18 | 13 | 0.212 | 0.260 | 0.296 | 0.354 |
| 18 | Hunan | 15 | 7 | 0.216 | 0.273 | 0.320 | 0.356 |
| 19 | Guangdong | 16 | 3 | 0.251 | 0.334 | 0.396 | 0.482 |
| 20 | Guangxi | 10 | 2 | 0.198 | 0.245 | 0.296 | 0.310 |
| 21 | Hainan | 12 | 1 | 0.194 | 0.218 | 0.226 | 0.258 |
| 22 | Chongqing | 8 | 9 | 0.181 | 0.222 | 0.255 | 0.287 |
| 23 | Sichuan | 6 | 12 | 0.201 | 0.229 | 0.271 | 0.323 |
| 24 | Guizhou | 9 | 6 | 0.154 | 0.201 | 0.240 | 0.273 |
| 25 | Yunnan | 4 | 4 | 0.199 | 0.220 | 0.269 | 0.291 |
| 26 | Tibet | 2 | 10 | 0.352 | 0.367 | 0.328 | 0.351 |
| 27 | Shaanxi | 11 | 17 | 0.176 | 0.219 | 0.252 | 0.272 |
| 28 | Gansu | 5 | 19 | 0.142 | 0.164 | 0.207 | 0.232 |
| 29 | Qinghai | 3 | 20 | 0.137 | 0.158 | 0.185 | 0.219 |
| 30 | Ningxia | 7 | 24 | 0.135 | 0.170 | 0.197 | 0.213 |
| 31 | Xinjiang | 1 | 30 | 0.216 | 0.235 | 0.278 | 0.290 |
| Grading Standards | Level I | Level II | Level III | Level IV |
|---|---|---|---|---|
| Division basis | (0, VB] | (VB, V] | (V, V + B] | (V + B, 1] |
| (0, 0.201] | (0.201, 0.263] | (0.263, 0.326] | (0.326, 1] |
| Year | Moran’s I | p Value | Z Value |
|---|---|---|---|
| 2005 | 0.131 | 0.051 | 1.638 |
| 2006 | 0.160 | 0.032 | 1.852 |
| 2007 | 0.162 | 0.031 | 1.873 |
| 2008 | 0.160 | 0.032 | 1.853 |
| 2009 | 0.233 | 0.006 | 2.485 |
| 2010 | 0.216 | 0.010 | 2.343 |
| 2011 | 0.183 | 0.021 | 2.027 |
| 2012 | 0.249 | 0.004 | 2.618 |
| 2013 | 0.166 | 0.032 | 1.854 |
| 2014 | 0.190 | 0.019 | 2.073 |
| 2015 | 0.271 | 0.002 | 2.827 |
| 2016 | 0.291 | 0.001 | 3.018 |
| 2017 | 0.244 | 0.005 | 2.588 |
| 2018 | 0.223 | 0.008 | 2.413 |
| 2019 | 0.248 | 0.004 | 2.648 |
| 2020 | 0.269 | 0.002 | 2.841 |
| 2021 | 0.257 | 0.003 | 2.730 |
Disclaimer/Publisher’s Note: The statements, opinions and data contained in all publications are solely those of the individual author(s) and contributor(s) and not of MDPI and/or the editor(s). MDPI and/or the editor(s) disclaim responsibility for any injury to people or property resulting from any ideas, methods, instructions or products referred to in the content. |
© 2023 by the authors. Licensee MDPI, Basel, Switzerland. This article is an open access article distributed under the terms and conditions of the Creative Commons Attribution (CC BY) license (https://creativecommons.org/licenses/by/4.0/).
Share and Cite
Zhang, Y.; Wei, Y.; Mao, Y. Sustainability Assessment of Regional Water Resources in China Based on DPSIR Model. Sustainability 2023, 15, 8015. https://doi.org/10.3390/su15108015
Zhang Y, Wei Y, Mao Y. Sustainability Assessment of Regional Water Resources in China Based on DPSIR Model. Sustainability. 2023; 15(10):8015. https://doi.org/10.3390/su15108015
Chicago/Turabian StyleZhang, Yansong, Yujie Wei, and Yu Mao. 2023. "Sustainability Assessment of Regional Water Resources in China Based on DPSIR Model" Sustainability 15, no. 10: 8015. https://doi.org/10.3390/su15108015
APA StyleZhang, Y., Wei, Y., & Mao, Y. (2023). Sustainability Assessment of Regional Water Resources in China Based on DPSIR Model. Sustainability, 15(10), 8015. https://doi.org/10.3390/su15108015