Article

Urban Stream Temperature Surge—Streamwater Temperature Variability after Rainfall in Suceava City Metropolitan Area

Department of Geography, Stefan cel Mare University, 720229 Suceava, Romania
*
Author to whom correspondence should be addressed.
Sustainability 2023, 15(10), 7882; https://doi.org/10.3390/su15107882
Submission received: 11 March 2023 / Revised: 7 April 2023 / Accepted: 9 May 2023 / Published: 11 May 2023
(This article belongs to the Special Issue Water Resource Management and Sustainable Environment Development)

Abstract

:
Suceava city is a territory under the urban heat island effect that leads to warm runoffs into small urban streamwaters that are highly impacted by the thermal pollution due to a combination of the small stream discharge and important runoff from impervious urban surfaces. This research detects the frequency and specificities of temperature surges in the Suceava city metropolitan area–40 surges were certainly identified in ~2 years-long time series. We analyzed the diurnal cycles of the stream temperature and correlated the atmospheric precipitation with some heated surface runoffs that resulted in aperiodic increases in the stream temperature. The high variability of rainfalls in the urban area meant that the stream temperature surges occurred rarely in all streams during the same rainfall event, despite the small distances between the watersheds (1–5 km between adjacent water monitoring points). The surges lasted up to 10 h and had an amplitude of up to 5.2 °C; they usually lasted 3.9–5.6 h after 5.8–7.7 mm rainfalls, causing temperature peaks of 0.5–1.4 °C. Additionally, they were easier to detect in the Cetăţii Creek due to its colder-than-natural waters during the warm season—a result of important wastewater discharge. Overall, the surges occurred mostly during the warm and wet semester of the year (87.5%) and especially during the summer (50%). Because Suceava is an average Romanian city, our findings could be taken into account as relevant data at least for cities located in the Moldavian Plateau.

1. Introduction

More than half of the world population lives in cities, and the way cities modify the water cycle has various effects on the human habitat. Due to climate change and developing cities, urban stormwater is warmer and collected into surface runoffs in a higher quantity than during the previous decades [1,2,3,4]. The thermal pollution of urban streamwaters, to which the widespread impervious surfaces and reduced riparian canopy contribute [1,2], leads to water quality impairment and affects biochemical processes.
Streamwaters can be warmed quickly as they pass through cities, from various and common diffuse and point sources associated with landscape changes from natural to anthropogenic, and a baseflow increase of even 10 °C within a kilometer stream length was documented [5]. Storm drains and wastewater outlets are common point sources of thermal pollution. The temperature jumps in urban rivers after rainfalls may sometimes exceed 10 °C [6]. However, the surge values in the scientific literature are usually smaller, e.g., 1.9–3.27 °C [2], 4 °C [7] or 2–7 °C [1].
The temperature surge is easily detected where the baseflows are small or smaller than in the past due to the urbanization of catchments. Zahn et al. [6] indicate that the urban temperature surge frequency is well corelated with watershed developed/vegetated areas, while the surge magnitude is linked to the stream discharge/temperature before the temperature event. The same authors suggest that the urban heat island (UHI), which was detected as a cause of the thermal pollution of rivers, should be an extended concept, including not only the higher temperatures of urban air, solid surfaces and subsurfaces, but also the warmer waters (which can be studied as the hydrological urban heat island).
Rapid increases in the streamwater temperature of 1 °C after a 15 min or less time interval following summer thunderstorms were reported [7], and the occurrence of such increases is also correlated to the growing urban land cover in a given watershed. Because the rain intensity and duration in urban environments can vary significantly over short distances (mainly compared to the size of big cities), the prediction of river temperature surges needs precipitation data with a high spatial density (<1 km2 per monitoring point) and with a high sampling frequency (<15 min.) [8]. Weather radars are useful tools for mapping the high spatial variability in cities [9]. Spatial rainfall variability contributes to the river flow variability in urban areas [10], and heavy rainfall events have a spatial variability that is higher than that of the other rainfalls and induce significant changes in the rainfall runoff [11].
The average water temperature of runoff after a rainfall event is dependent on land use, increasing from residential areas to industrial and commercial areas, and various measures that are implemented for reducing the storm runoff volumes are often not efficient in mitigating the runoff temperature [12]. Wetlands can be used to reduce the peak temperatures of runoff waters discharging into urban rivers after rainfalls [13]. The models that take into account additional urban development show the significant importance of shade for limiting the increase in urban streamwater temperature [14].
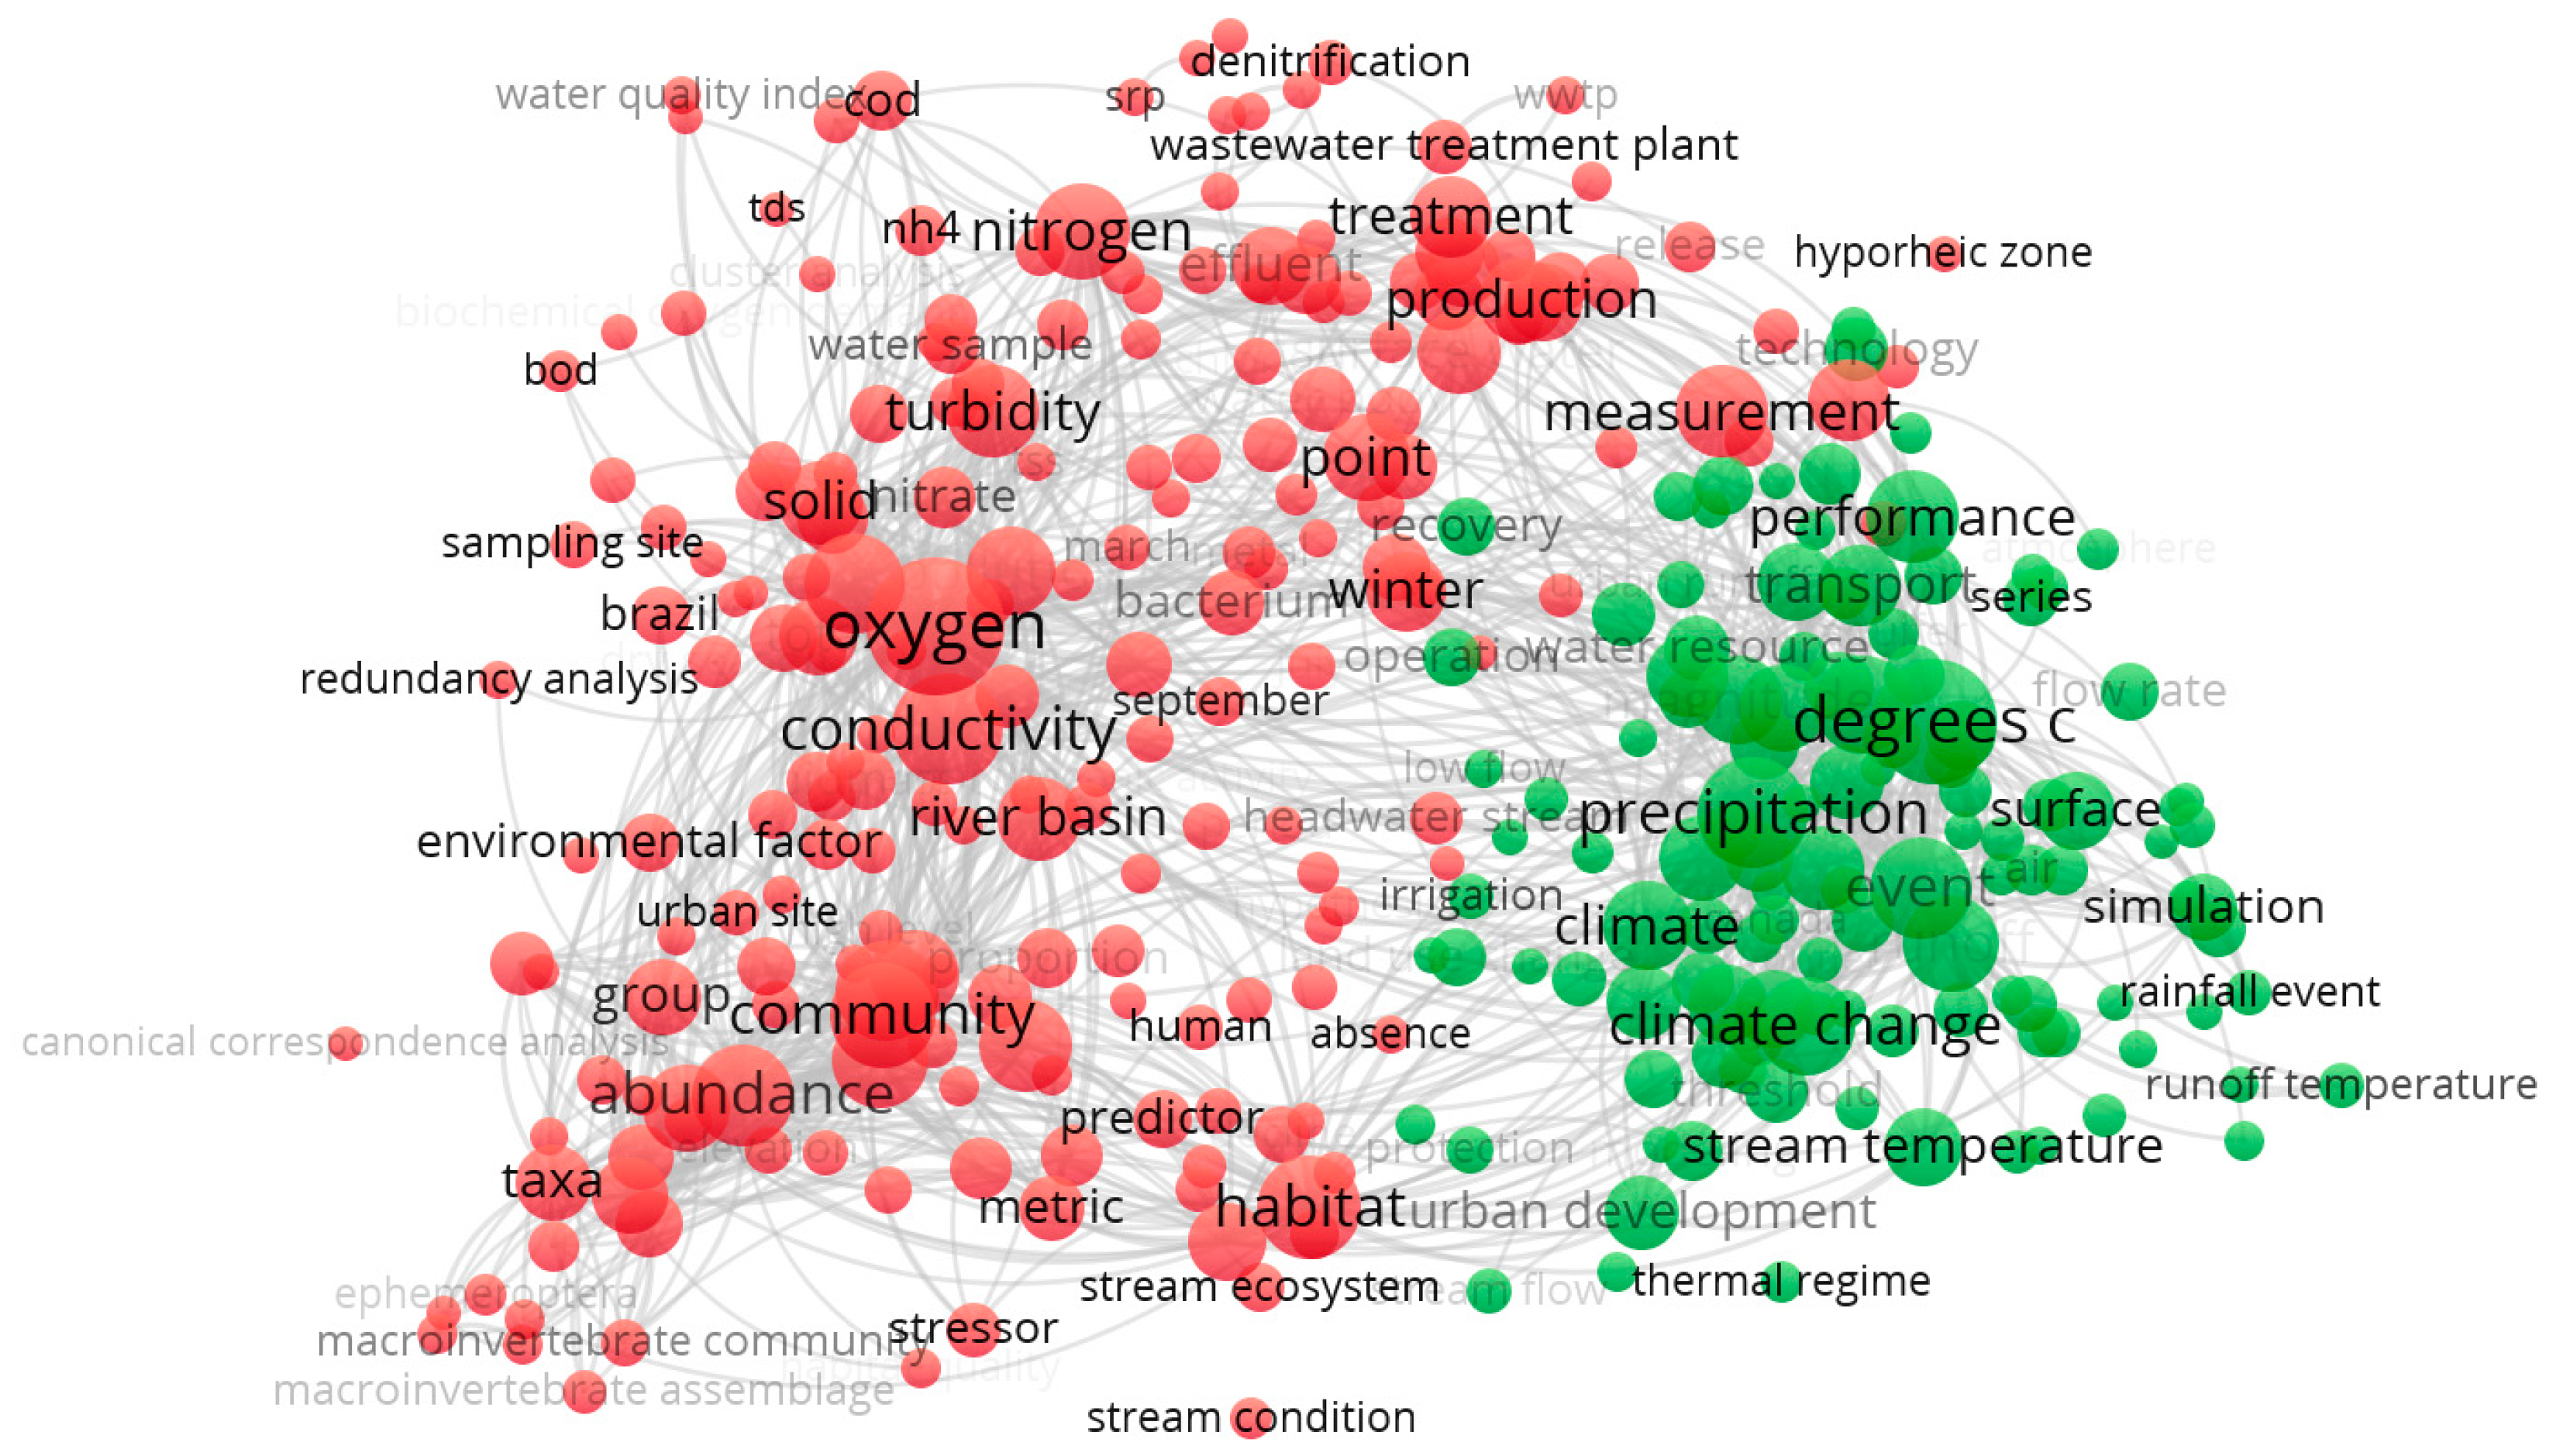
Studies that include research related directly or indirectly to concepts such as “urban”, “stream”, “water” and “temperature” create a consistent cluster of papers dealing with the links between (amongst other items) climate change, urban development, stream temperature, precipitation, rainfall event and runoff temperature (Figure 1), while the dominant cluster exists around the effects of urbanization and temperature changes, especially the decrease in the dissolved oxygen in urban rivers.
Most studies regarding water thermal pollution in Romania are focused on the environmental impact of various power plants located near the built areas of some cities [16,17,18]. However, there are also a few studies that analyze the thermal impact of urban wastewaters or urban heat island on rivers that pass through cities [19,20].
In one of our previous studies regarding the influence of Suceava city on urban streamwaters, we showed that the urban tributaries of the Suceava River (the city’s main river) are small streams with warmer waters [20]. In this study, we analyze the thermal behavior of these streams over a longer period of time and provide a better thermal characterization. Additionally, because we found a few instances of streamwater temperature surges after rainfall runoff (two events on Suceava River) in the previous study, we persisted in our current study in searching for more such events in the recent years and we describe them with the aim to provide the first dedicated analysis of temperature surges after rainfalls in the streamwaters of a Romanian city.
The study of the streamwater temperature surges caused by rainfalls and the associated runoffs in urban areas is a step forward in the quantification of the various parts that contribute to the general thermal pollution of urban rivers. A river temperature is important for river ecology and the riparian area that might contribute to the improvement of the living conditions in cities.

2. Materials and Methods

2.1. Study Area

Suceava city is located in the north-eastern part of Romania (in the Moldavian Plateau) and has a population of ~84,300 inhabitants according to the 2021 census, while its metropolitan area has approximately 150,000 people. Its climate is temperate continental with rainy summers. The average annual sum of atmospheric precipitation usually ranges between 550 mm and 650 mm. Air temperature during summer daytime may sometimes exceed 30 °C.
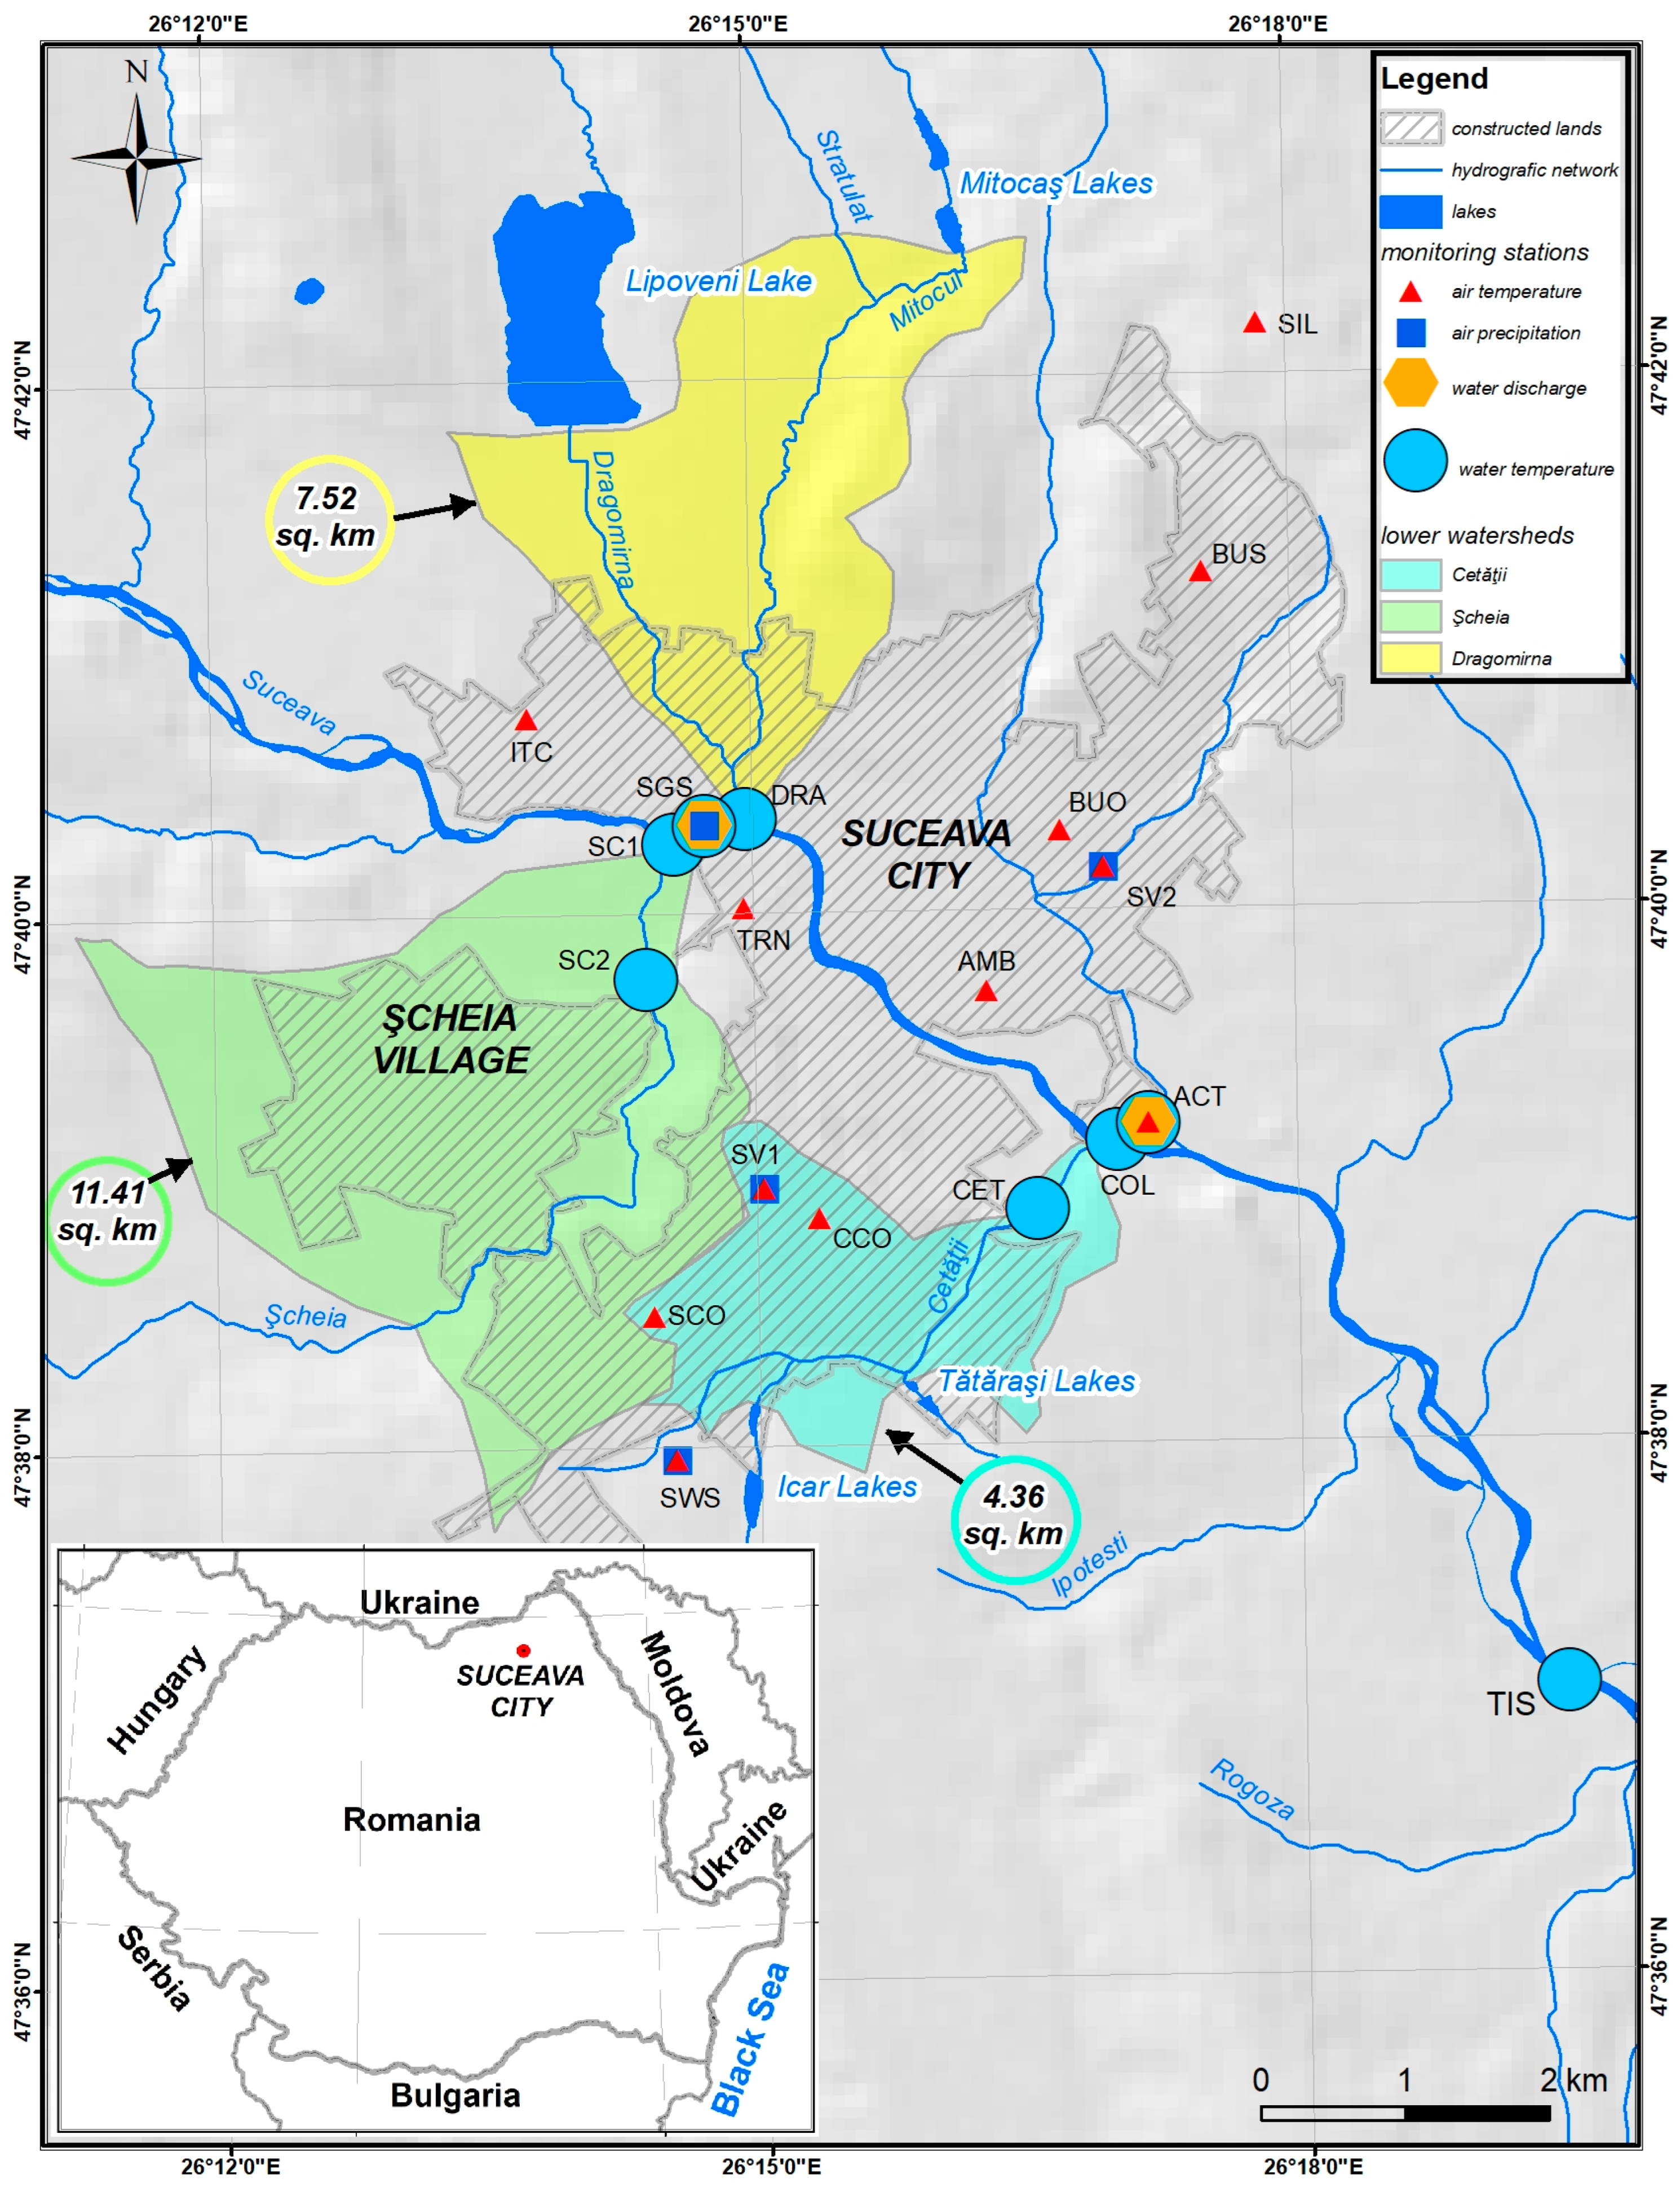
The four streamflows on which this study focuses on have their lower reaches inside the administrative area of Suceava city. These are tributaries of the Suceava River and discharge into the main river inside the built area of the homonymous city (Figure 2). Three of them (Şcheia, Cetăţii and Dragomirna) are natural streamflows, while the waters of Collector are a mix of groundwater and wastewaters drained through a pipe from the Suceava River floodplain until past a levee, where they are discharged and flow freely downstream toward the Suceava River.
The flow rate of the studied tributaries changed in recent decades due to the increasing impervious surface of Suceava city and its neighbor villages and towns [21]; this trend diminishes the importance of the groundwater discharge in the average annual flow rate, while stormwater and wastewater (mostly illicit and untreated) have increasing, very variable and yet uncounted contributions. The average flow rate approximation that could be used to describe the flow rate of the four tributaries (small watercourses with small and similar discharges) is 0.1 m3/s per stream, with the mention that Şcheia and Dragomirna drain more water than the average. On average, the baseflow of the natural streamflows in Suceava city consists of a few liters per second, while the flow rate during the heavy rains can exceed 1 m3/s.
Of secondary interest for this study is the Suceava River, which splits the city in a northern half and a southern half (each half contains the catchments of two of the selected tributaries). It has a much larger discharge than its urban tributaries (16.87 m3/s [21]), and the urban stormwater has a less important impact on it [20]. Much of the stormwater-induced changes can be monitored by using the effluent discharge of the wastewater treatment plant due to the fact that most of the territory of Suceava city has a combined sewerage (it collects wastewater + stormwater).

2.2. Data, Instruments and Methods

The data are composed of data obtained with own instruments (that provided the most part of our data) and data obtained from various national and regional monitoring networks. Most time series have values from hourly measurements, but daily values (from national institutions, when hourly measurements were not available) were also taken into account for some argumentations.
The atmospheric environment (air temperature) was monitored inside the administrative borders of the city along a line that has approximately the same general direction as that of the elongation of the city; that line contains twelve monitoring points and covers the valley of the main river from one slope to the opposite slope.
Data from national and regional monitoring networks consists of air temperature and precipitation data at the city’s weather station (SWS—National Administration of Meteorology), two environmental stations (SV1, SV2; belonging to the Environment Protection Agency) and a hydrometric station (SGS; National Administration “Romanian Waters”).
The time interval used for air temperature and precipitation analyses is 1 January 2020–31 December 2021. Air temperature time series from points not included in any national network were obtained with CEM DT-171 instruments (accuracy: 1 °C, resolution: 0.1 °C) in miniature weather stations at a 2 m height from the ground.
Streamflow temperature was recorded from September 2019 to November 2021. Water temperature of the four streamflows discharging into the Suceava River was monitored near the junction points (tens of meters upstream) by using DS1922L-F5 iButton instruments (accuracy: 0.5 °C, resolution: 0.0625 °C; three monitoring periods: September 2019–June 2020, July 2020–April 2021, June–November 2021); the instrument on Şcheia River had its location changed during the last two monitoring periods because it was moved 1 km upstream in order to avoid the effect of remuu (backwater) caused by the Suceava River high waters.
Data regarding water temperature of the Suceava River, monitored in 2 points located inside and downstream of Suceava city, are more heterogenous; the downstream point (at Tişăuţi—TIS) was monitored using AquaTROLL500 (accuracy: 0.1 °C, resolution: 0.01 °C), while the point inside the city is part of the monitoring network of the National Administration “Romanian Waters”.
Wastewater temperature and discharge were provided by ACET, a regional provider of water supply and sewerage for the effluent of the wastewater treatment plant (WWTP) of Suceava city—the monitoring point ACT includes instruments from both ACET and our network.
The maps were created in ArcGIS by using referenced geospatial data from national cartographic maps and from orthophotoplans provided by ANCPI—National Cadastre and Real Estate Advertising Agency (for identifying the built areas).
We define the runoff-induced streamwater temperature surge as the event consisting of an aperiodic increase in water temperature, exceeding the shape of the expected thermal diurnal profile, with a temporal length of a few hours and occurring during or shortly after a rainfall. As a result, average diurnal thermal profiles of water and air were calculated in order to detect deviations from the average behavior. Air temperature is present in some of our graphs in order to indicate that the water temperature increase during the studied surge events is not caused by air temperature increase.

3. Results and Discussion

3.1. Temperature Regime of Urban Streams

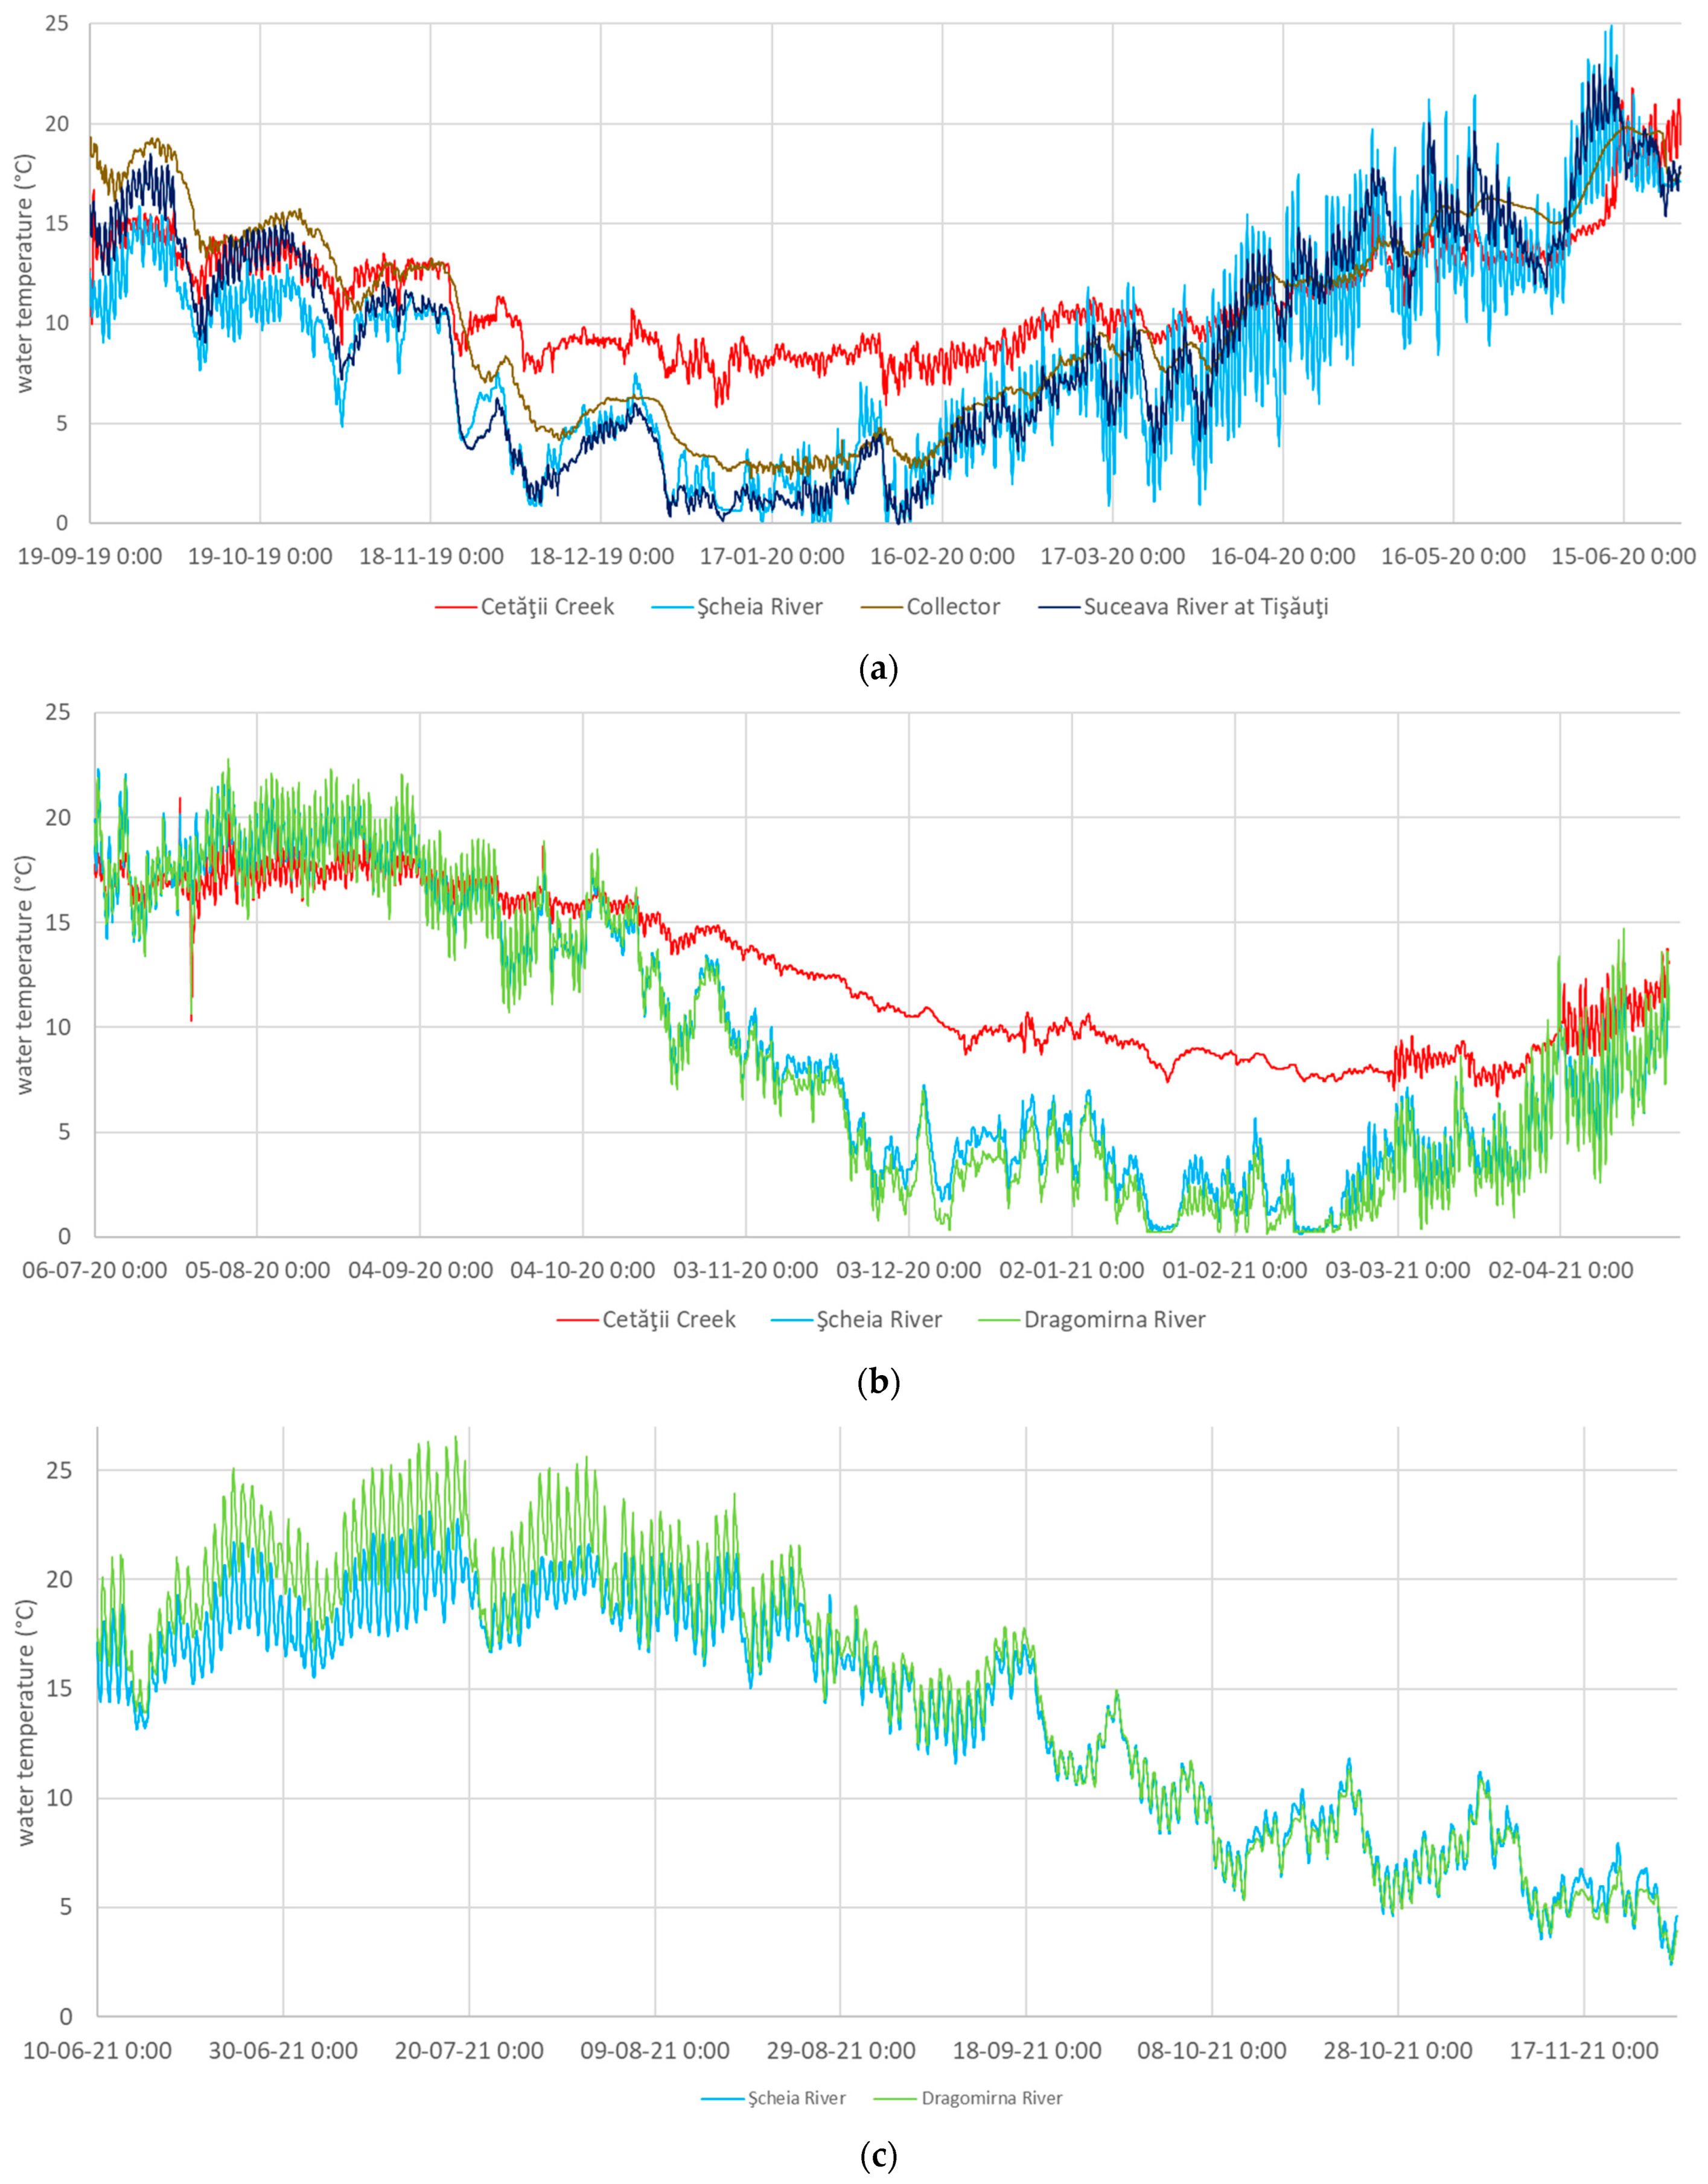
The water temperature time series from the monitoring points of the Suceava River and its tributaries exhibit large seasonal variations of the monitored streamwaters, with short-term variations induced by synoptic conditions and diurnal cycles created by the alternance of days and nights.
A typical streamflow in the plateau region of the study area should have, most of the time, temperatures above 10 °C during the warm semester, usually with high amplitudes (3–5 °C) of the diurnal cycle [20]; in the cold semester of an average year, the temperatures drop/grow toward/from the winter months, when waters are sometimes near the freezing point and the diurnal thermal cycle is weak or absent.
The waters of the Cetăţii Creek have a distinct thermal behavior, easily detected during winter, when they can have a temperature ~7 °C higher than that of the tributaries of the Suceava River with a more natural flow. Due to this difference, when the Şcheia and Dragomirna rivers have waters with a temperature of <1 °C and lack a diurnal cycle due to numerous consecutive days with negative air temperature, the diurnal cycle of the Cetăţii Creek is still present. During winters, the Cetăţii Creek water temperature ranges mostly between 7 and 10 °C. In comparison, the average temperature of treated wastewaters evacuated by the city’s WWTP during the winter months of 2019–2021 was 11.9 °C. This indicates what can be seen in the field, which is that most of the water flowing into the creek valley is untreated wastewater from residential neighborhoods; this prevalence is due to the fact that a. the untreated wastewater discharge is high (tens of liters per second) and b. most of the natural flow of the creek is retained upstream into the Icar and Tătăraşi group of reservoirs (Figure 2).
The waters of Collector flow through a pipe made from a thermo-conductive material that transmits the soil heat during summer and drains water heat during winter. The diurnal cycle is very weak and is not in phase with the cycle of the other tributaries of the Suceava River (different moments of the daily minimum and maximum); this is an indicator that this water is composed of a significant groundwater discharge (Figure 3).
The Şcheia and Dragomirna rivers have similar temperature averages, minima, maxima and standard deviations (Table 1); the Cetăţii Creek has higher minimum temperature and lower maximum, and these lead, indirectly, to a lower standard deviation—this weaker oscillation indicates again the input of wastewaters that inherit a more constant temperature (than the outside environment) from various households.
The shape of the average diurnal cycle has similarities and also some important changes from one streamwater to another (Figure 4). The diurnal minimum occurs earlier in the warm semester and the summer, while the diurnal maximum occurs at approximately the same hour or later (as compared to the opposite semester/season), indicating the longer period with daylight. The diurnal cycle has a lower amplitude during the cold semester and the winter.
The moment of the maximum water temperature is almost the same (+/−1 h) per monitoring point when the semester (warm and cold) averages are taken into account. It occurs in the afternoon, after the equivalent maximum in the air temperature, but later for the Cetăţii Creek (17:00) than for Şcheia (16:30) and Dragomirna (15:00). The average hour of these three watersheds is ~16:00, which is also the moment of the daily maximum for the Suceava River downstream of Suceava city, as shown in our previous study [20]. The Suceava River upstream the homonymous city has the daily maximum in the early evening (19:00), and the change of the hourly position of the temperature maximum was caused by the urban heat island of Suceava city [20].
For the urban tributaries of Suceava city (Cetăţii, Şcheia, Dragomirna), the occurrence of the maximum in the afternoon indicates that they are affected by the urban heat island and contribute to propagating the heat from the urban air and soil/soil cover into the main river. Their water flow rate is too small to stop significant water thermal changes caused by the strong heat transfer from their constructed riverbanks and the heated groundwater of their watersheds.
Because of the low thermal variability of the Collector waters and, implicitly, of the lack of temperature surge events, its temperature time series are no longer discussed in the following analyses (they are included in a few plots for comparison only).
The average shape of the diurnal cycle was used in order to detect days with secondary variations of water temperature which were possibly caused by the atmospheric precipitation that occurred at the same time or earlier. Surge events occur almost always on the ascending or the descending slope of the diurnal profile (a peak superimposed over the maximum of the cycle is less frequent). Starting from the sinusoid representing the expected diurnal cycle specific to the day of the temperature surge without the rainfall event included (empirical estimate), the temperature difference compared to the real diurnal cycle that occurred (containing the temperature surge) is attributed to the streamwater temperature surge event.

3.2. Case Studies of Temperature Surges

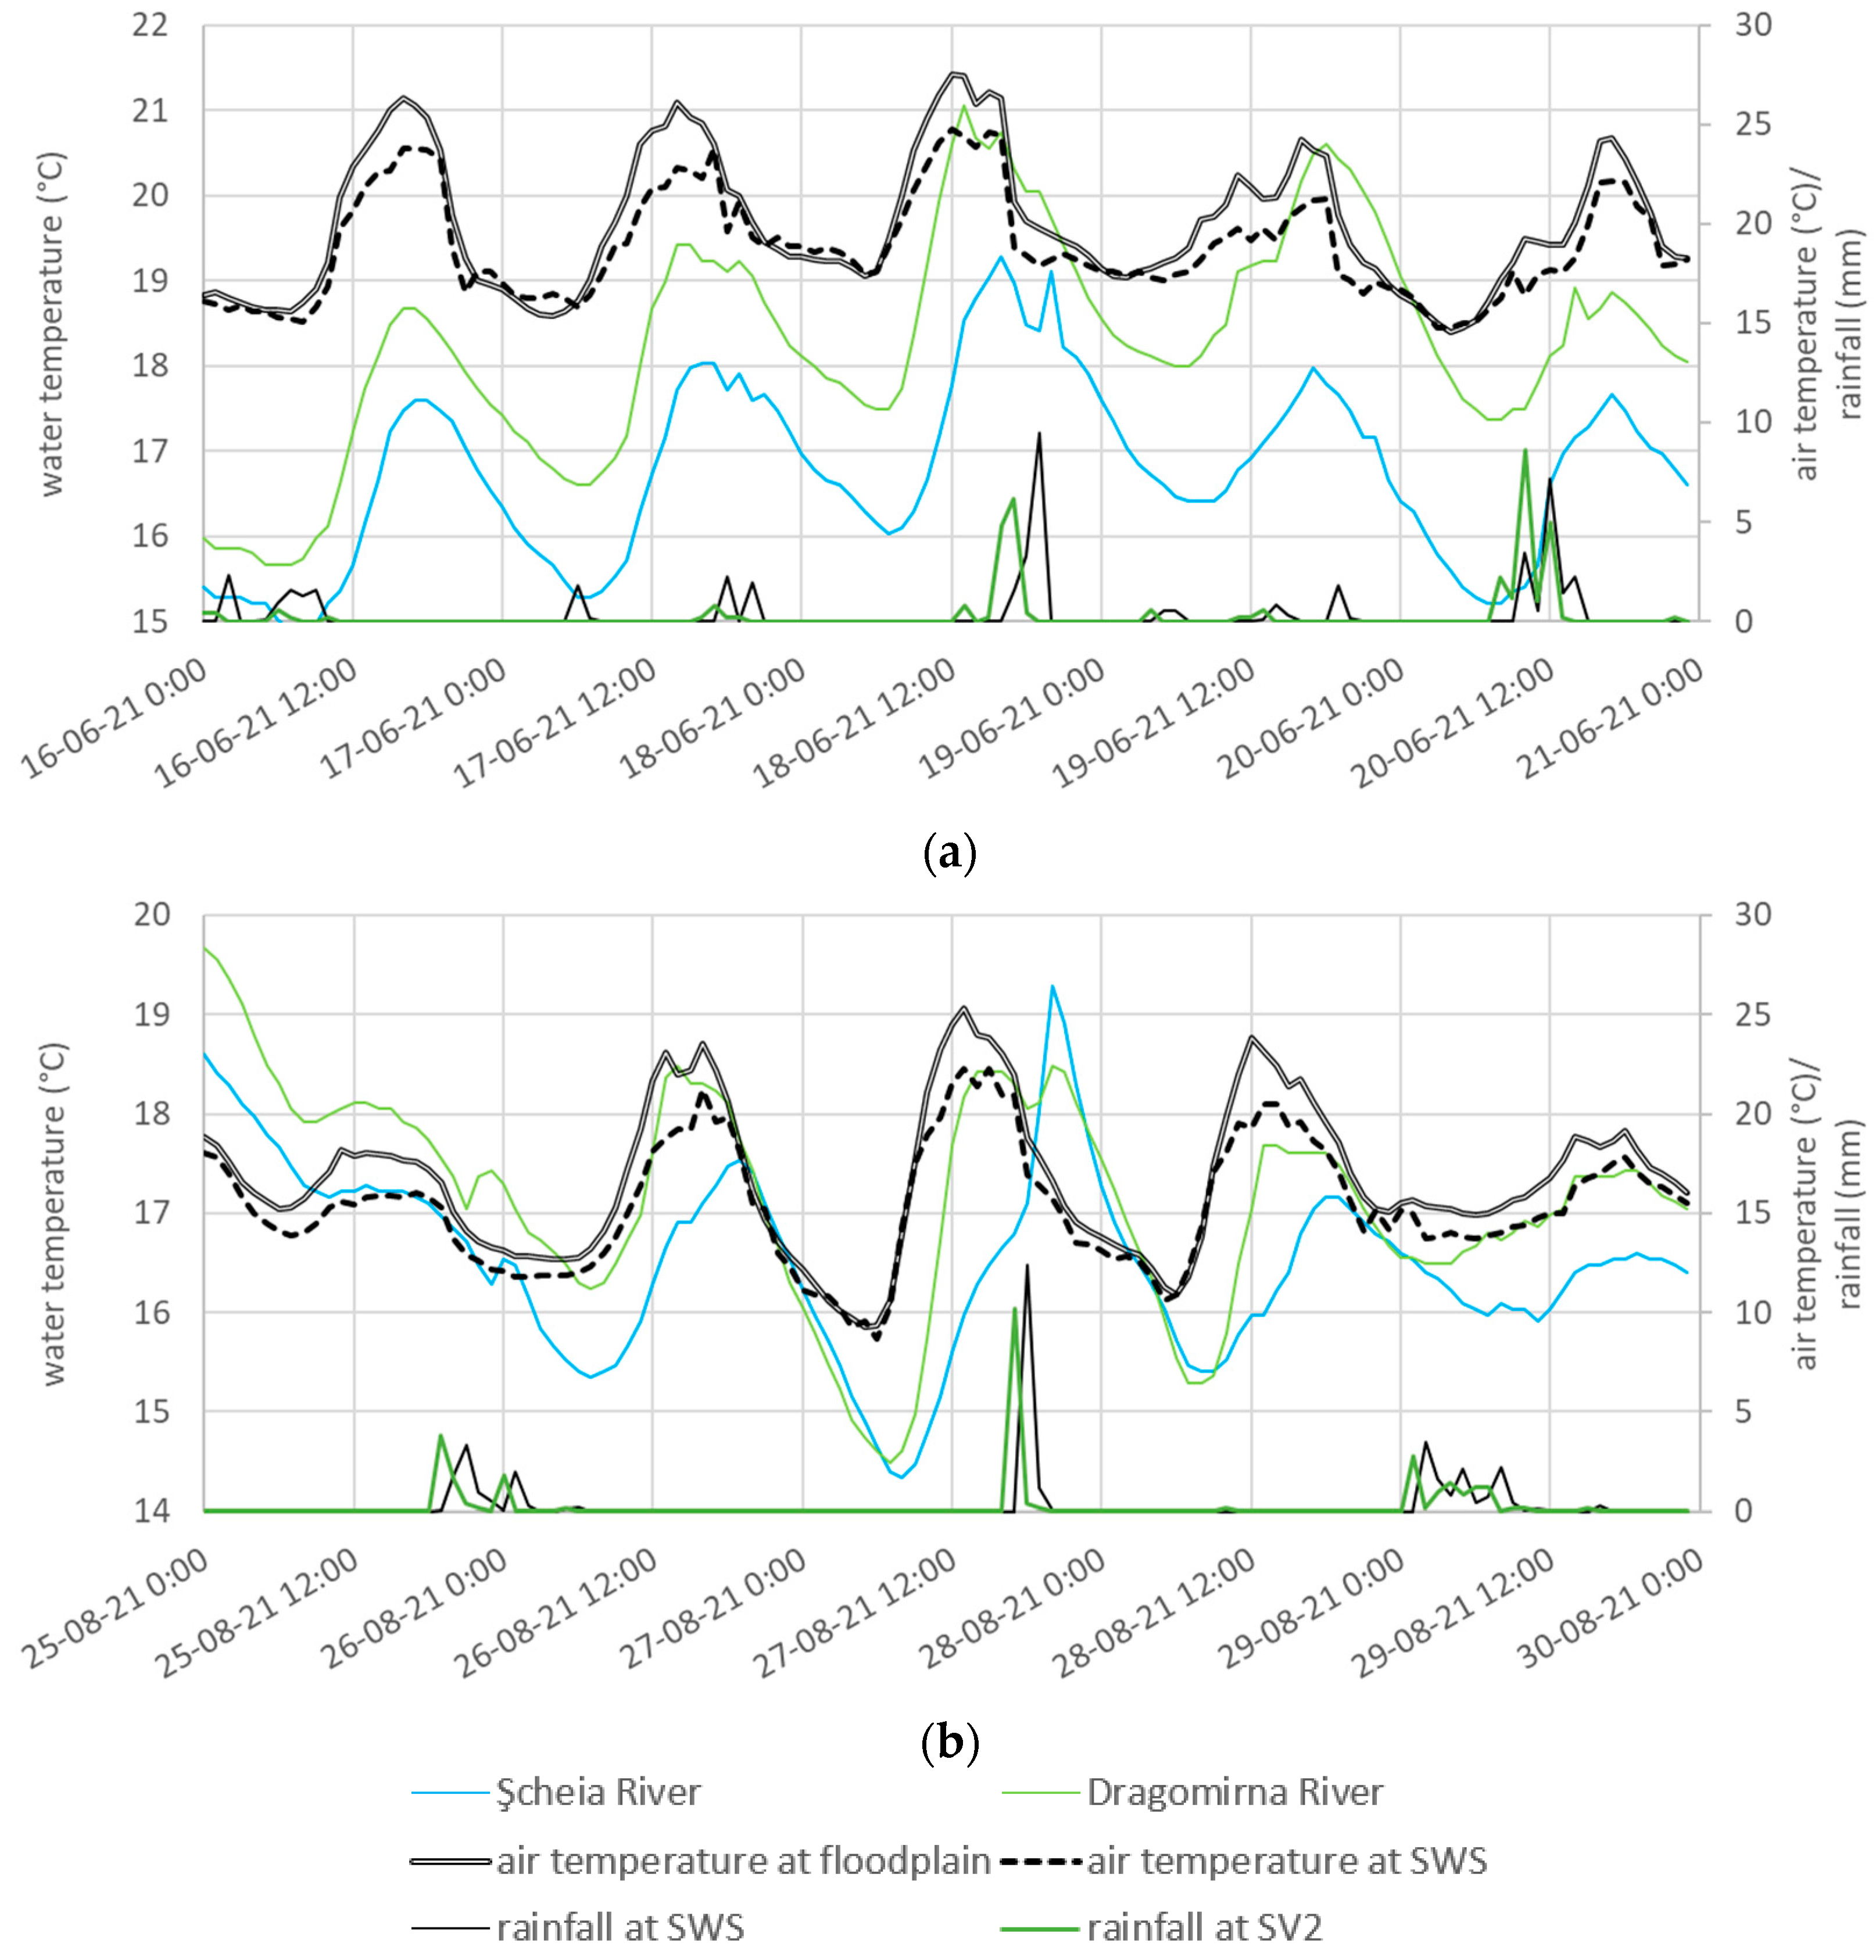
The list of events which were counted in our statistics as temperature surges includes the aperiodic temperature peaks recorded between 18 and 20 June 2021, in Şcheia and, respectively, Dragomirna (Figure 5a), but does not include other oscillations that may qualify as surges but can also be explained by concurrent causes (especially if similar air temperature variations occurred at the same time). It is easier to identify the temperature oscillations assimilated to the runoff-induced streamwater temperature surges when these surges occur simultaneously in different streams and after important and recorded rainfalls—e.g., during 25–27 August 2021 (Figure 5b).
We identified 40 temperature surge events on the tributaries of the Suceava River. Our estimates are restricted to the certain, sure events, but a less restrictive analysis might discover that the number of temperature surge events that occurred during the three monitoring periods is probably 50% higher.
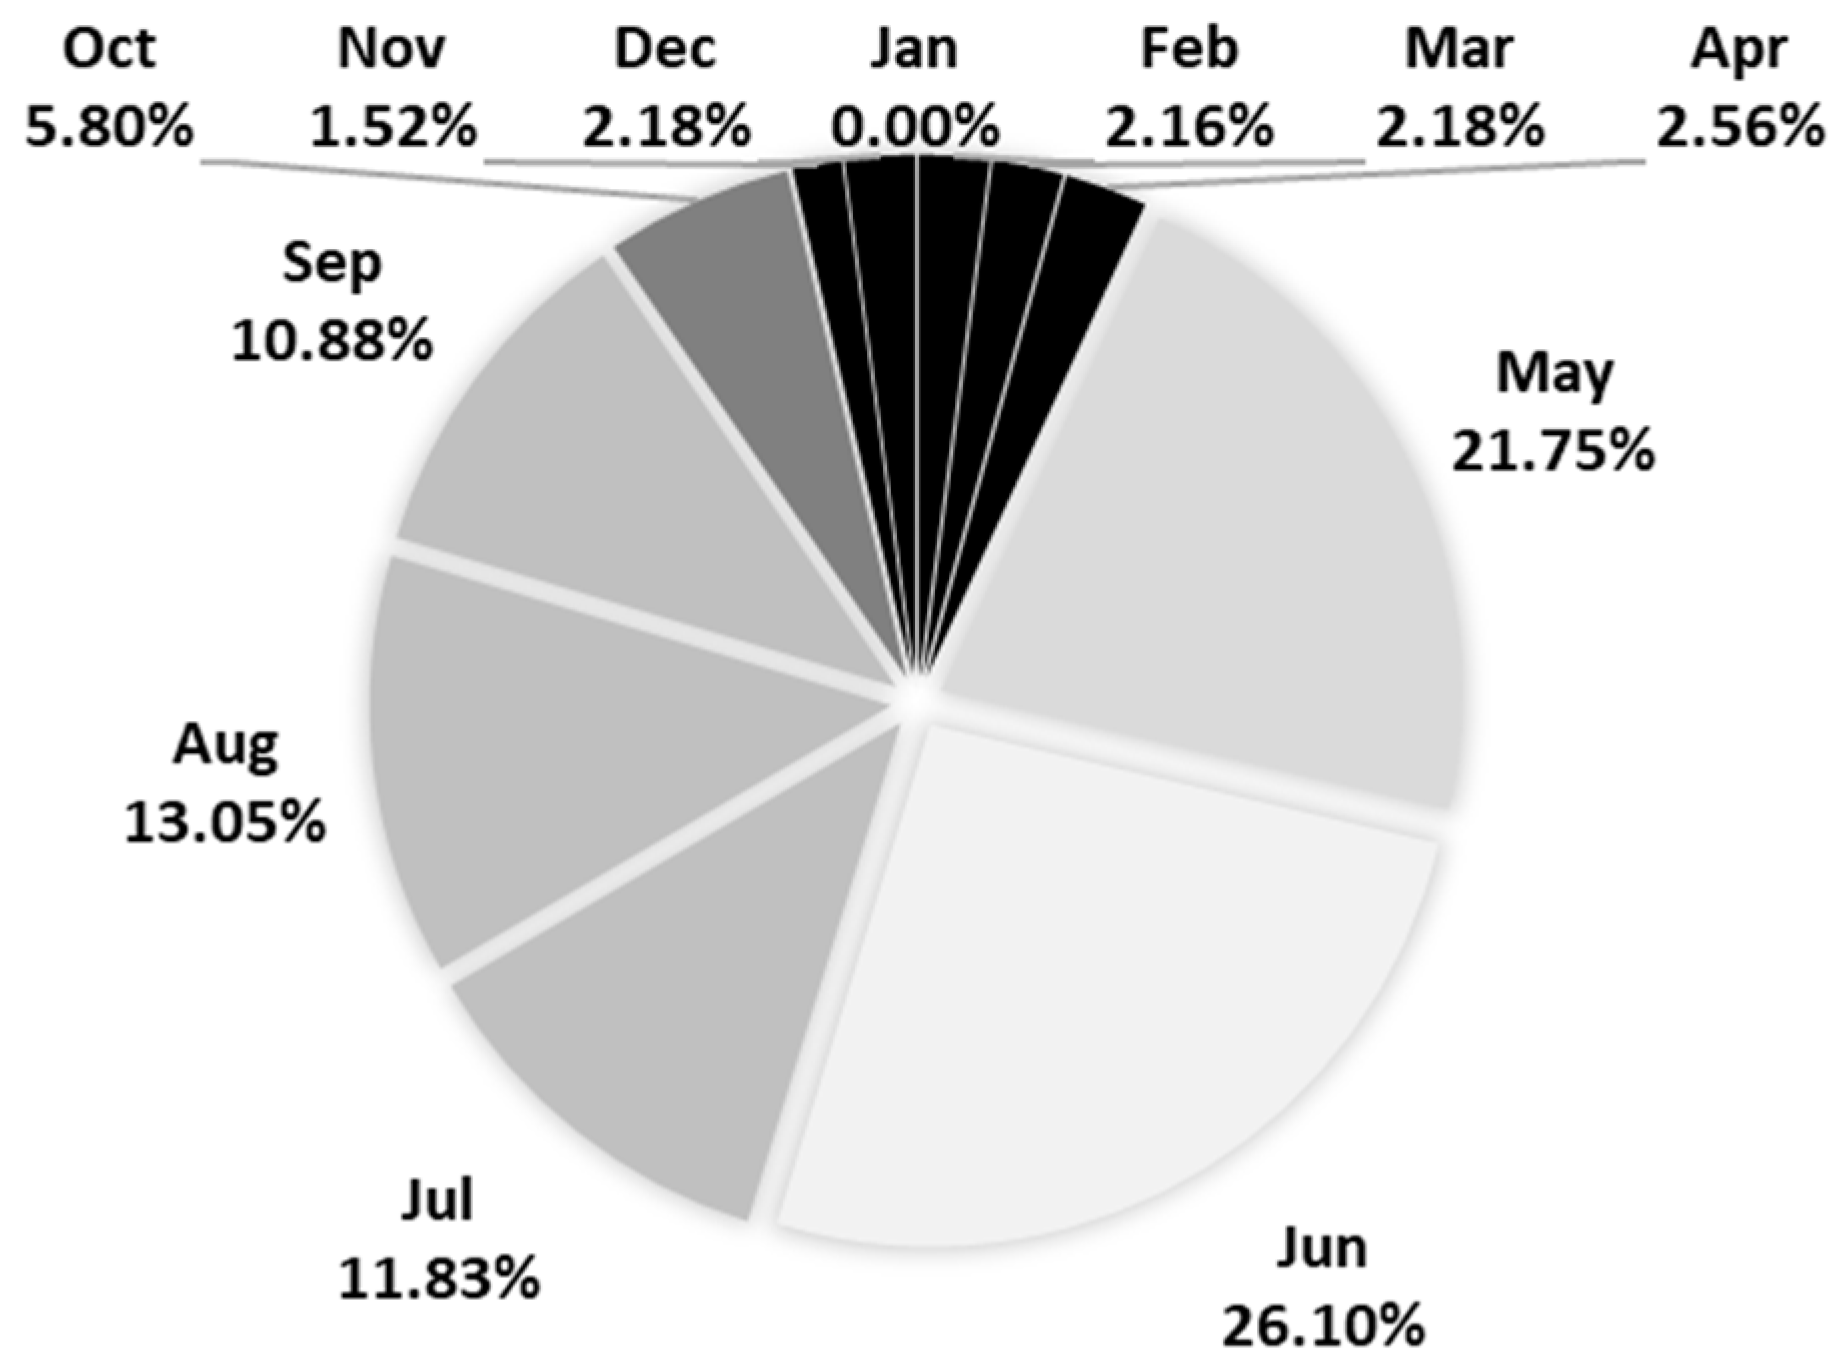
Most recorded events took place in June (9), August and September (6 events each), May and July (5 events each) and October (4). During the cold semester, each month had one temperature surge event, with the exception of January, which had no event. This means that the great majority of the recorded events occurred during the warm semester (35 of 40), and half of the total events occurred during the summer (20/40). Because some months are only included partly or are missing in some monitoring periods, we calculated the potential distribution of the temperature surge events during an average year if each month would have had a similar number of monitoring days (number of days attributed according to the calendar year). According to this calculation, there is a minor correction to the previous ratios/percentages as follows: The warm semester would have 89.4% (instead of 87.5%) of the total events, while the summer would include 51% (instead of 50%) of the total events (Figure 6). This temporal distribution is consistent with the data in the scientific literature regarding cities in the northern hemispheres, with surges in the April-October interval [6] and mostly during the summer [1,7].
A few (3) and certain temperature surges were also recorded in the Suceava River downstream of Suceava city. They are rare because the Suceava River is a much bigger river compared to its urban tributaries (discharge and watershed sizes); it has a more complex evolution of its discharge in relation to rainfall and it is also more able to incorporate warm runoff waters (received directly or through tributaries) without significant or detectable increases in the stream temperature. Because the monitoring period including the Suceava River is short, we discuss its temperature surges only in relation to its tributaries.
Most of the temperature surge events occurred in the Cetăţii Creek (29 of 31 events during the monitoring periods when Cetăţii Creek was monitored). When the temperature surge events occurred approximately at the same time in two streams, it occurred more frequently in the Cetăţii Creek and Şcheia. In 19 out of 40 surge events, the surges occurred in pair in 2 or 3 streams. The surges that occurred at the same time in the Cetăţii Creek, Şcheia and Dragomirna rivers were much rare, in 6 out of 16 events recorded when all 3 streams were monitored simultaneously.
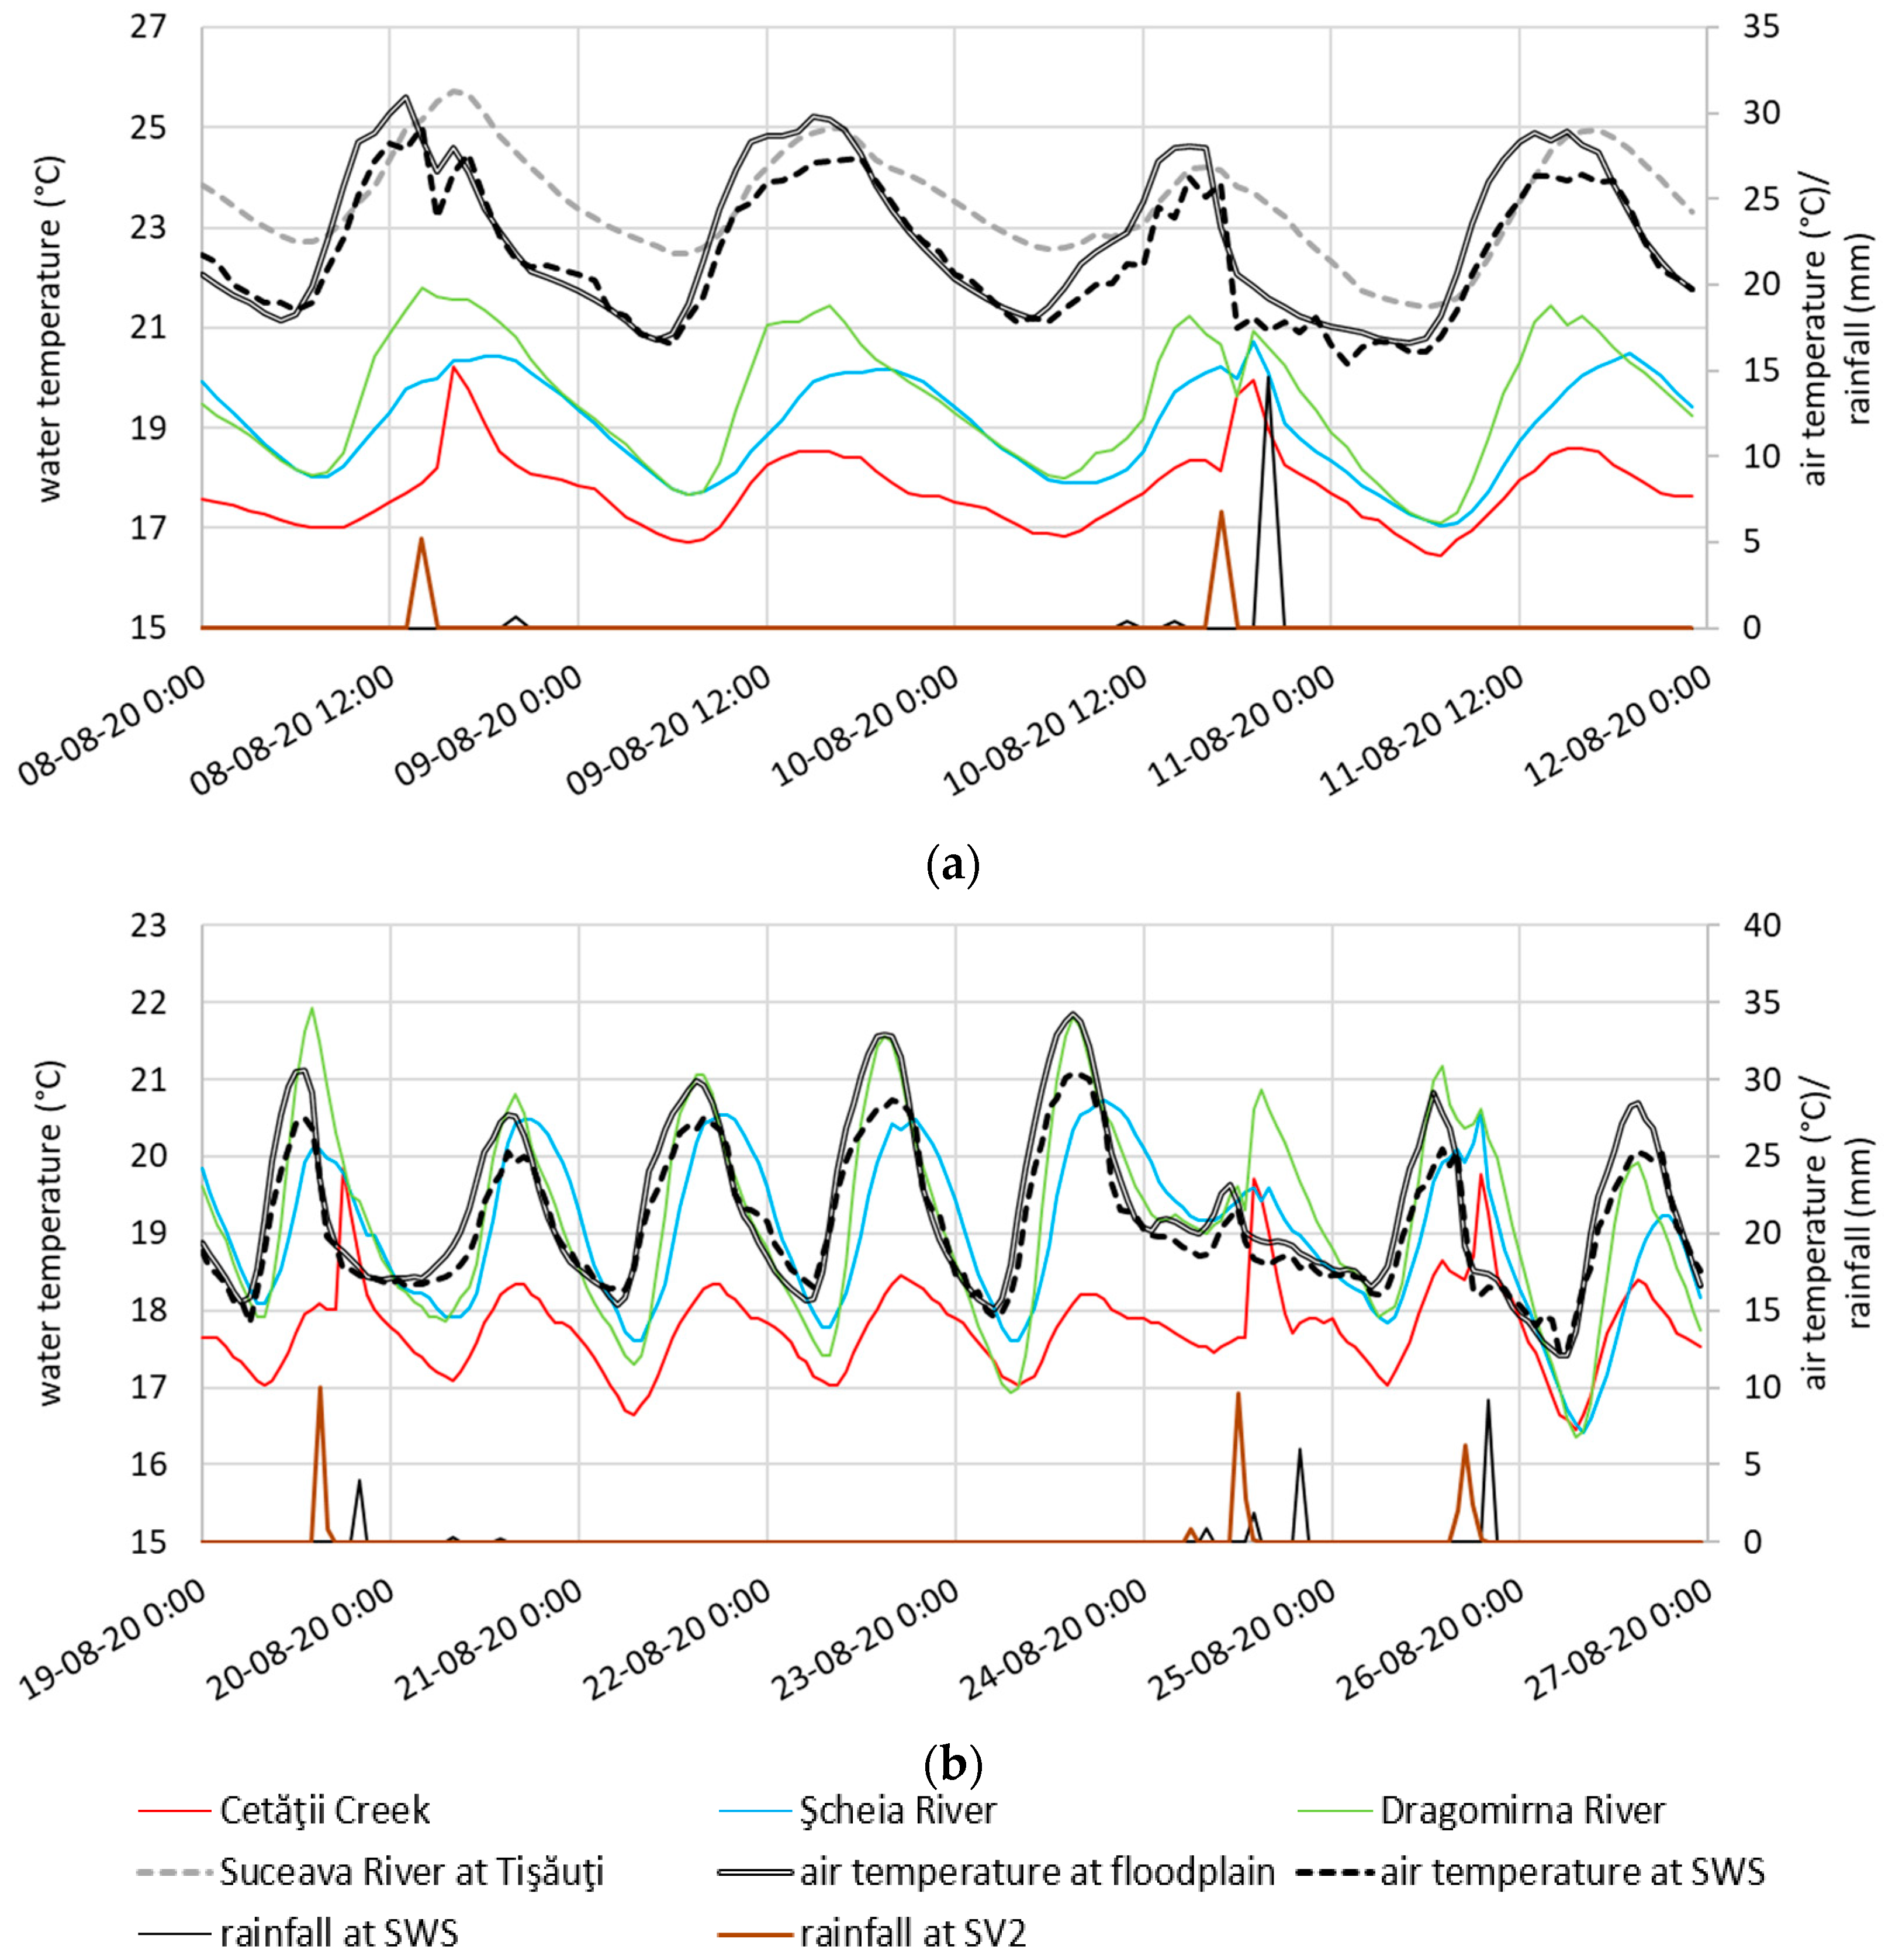
Atmospheric precipitation data used for determining the moment and amount of precipitation that caused warm runoffs were selected from SWS for the tributaries on the right side of the Suceava River (Cetăţii Creek and Şcheia) and from SV2 for the tributaries on the other side (Dragomirna and Collector). One can observe in Figure 7 that the rainfalls from SV2, a measuring point representative for the floodplain of Suceava city, are more useful for explaining the temperature surge for the tributaries on the right side of the Suceava River, instead of SWS, which is located in their watershed and at a higher elevation that is specific for the watersheds of the rivers located south of the Suceava River (its right side/bank). This is most probably partly due to the fact that all of our water temperature monitoring points are located in the floodplain, under the influence of the air circulation specific to that part of the city.
The air circulation above the Suceava city metropolitan area is influenced by the urban heat island effects—these occur because the areas within the borders of the constructed lands (covered mostly by various types of roofs and pavements) have a net temperature difference compared to the surrounding natural areas (forests and pastures), leading to increased air convection above the city. In our previous study [20], we showed that the Suceava River is warmer downstream of the homonymous city in such a way that the water temperature difference itself between the upstream and downstream monitoring points has a diurnal cycle, that cannot be attributed to warm wastewaters, but to an urban heat island.
Between the northern, central and southern parts, there are spatial differences that often exceed 0.5 °C (daily averages), and these differences lead to a high variability of the air turbulence and atmospheric precipitation. Moreover, general air movement above the metropolitan area is from NV toward SE, especially during summer, when approximately half of the annual precipitation can occur.

3.3. The Variability of Urban Rainfalls and Air Temperature

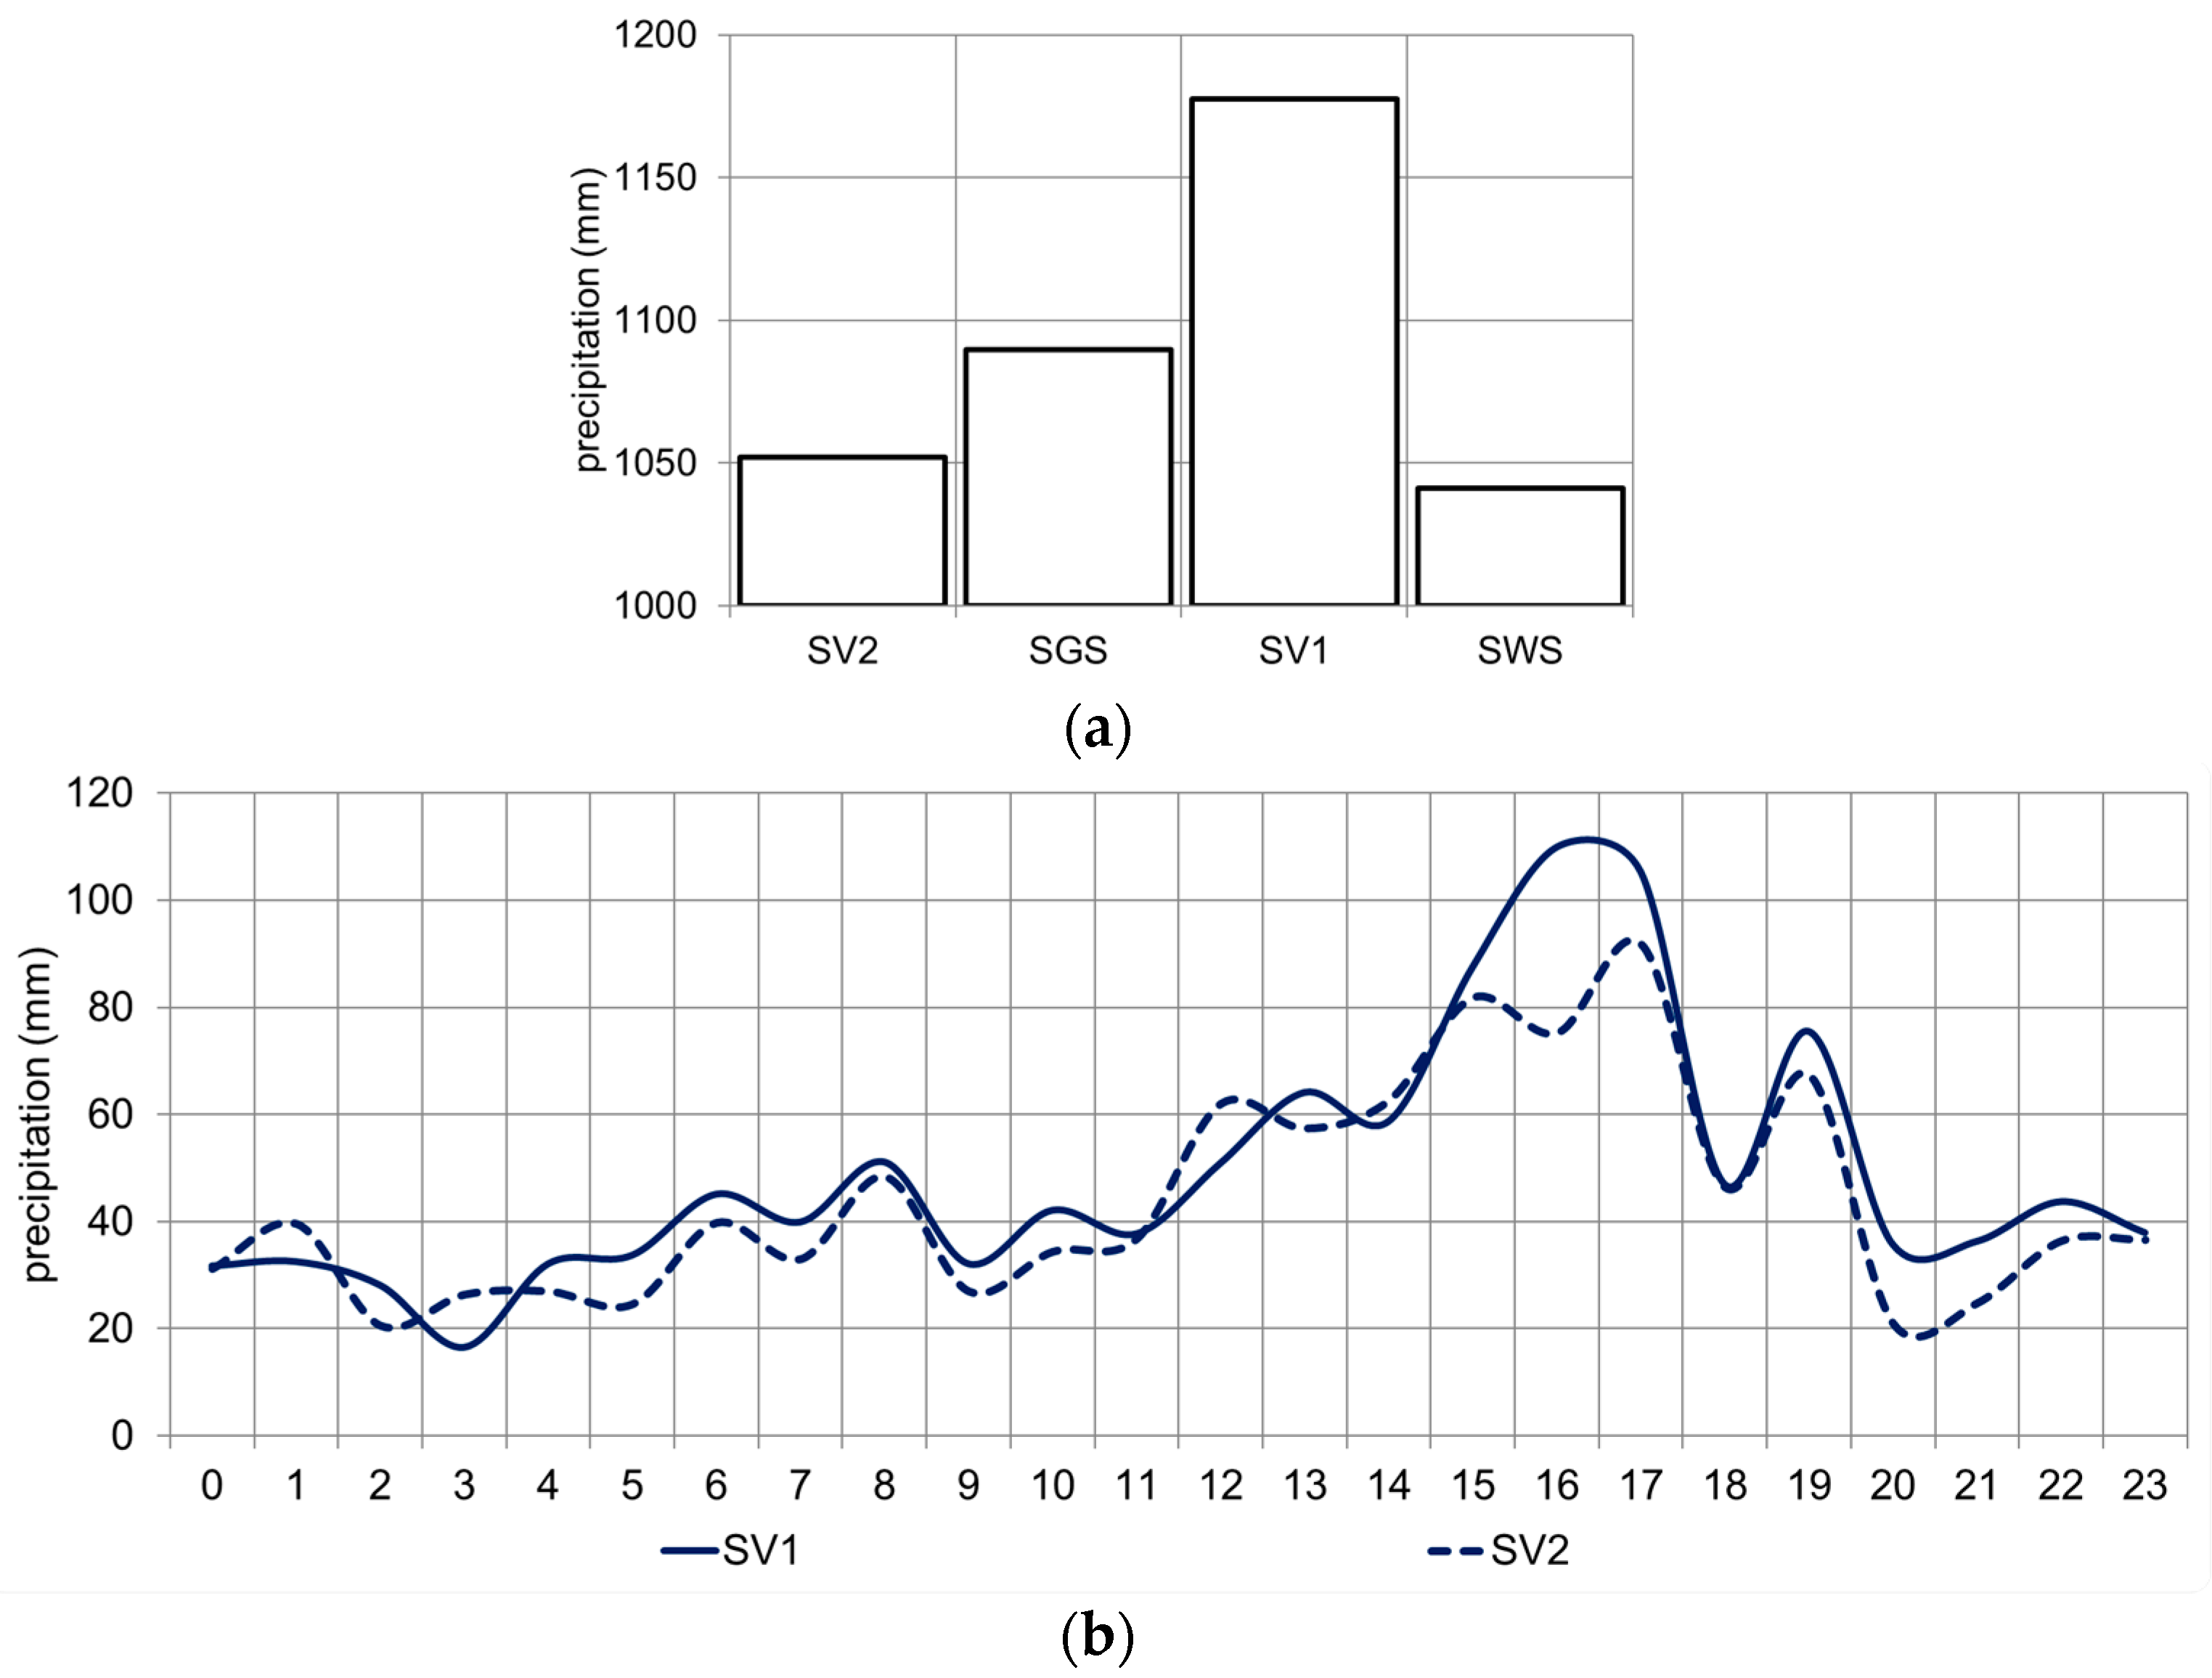
The rainfall data indicate that, in the urban area of Suceava (as in other urban areas), larger amounts of precipitation fall than in the surroundings (Figure 8a). In an annual average, in the urban area, 5.5 mm more precipitation fell at SV2, 24.1 mm more at SGS and 68.0 mm more at the SV1 station (all compared to SWS). The pluviometric difference is due to several factors, including the elongated shape of the city in the general N–S direction, the existence of two major urban nuclei separated from the major riverbed of Suceava which favors the channeling of air masses, local hypsographic and hypsometric differences, the heterogeneity of land use and coverage and differences in local air circulation.
Above the city, the thermo-orographic convection generated by the urban profile is significant, a fact argued by the profiles of the diurnal regime of precipitation at the SV2 and SV1 stations (Figure 8b), which show well-marked diurnal maxima in the afternoon. The number of hourly intervals in which the precipitation was recorded fluctuated in the general N–S direction and was 1178 at SV2, increased to 1185 at SV1 station and then decreased at Suceava meteorological station (SWS) to 1044. This fact is due to the main direction of movement (NW–SE) of the air masses loaded with precipitation coming from outside the region and channelized along the Suceava Valley.
In the Burdujeni neighborhood and the industrial platform nearby (where the SV2 station is located), advection charges the air volumes with numerous condensation nuclei and, when they pass above the Suceava River, the air is charged with moisture. The escalation of the steeper right slope of the Suceava River valley causes this volume of air with large amounts of condensation nuclei and vapors to be entrained in a light orographic convection, able to generate in the medium and long term the surplus of precipitation that is recorded in the Zamca–Mărășești neighborhoods on the higher plateau of Suceava city, on which the SV1 station is located. The topographical profile given by the constructions in the Zamca–Mărășești neighborhoods contributes to the enhancement of the convective–orographic processes. From SV1, the air descends slightly and heats up from the active urban surface and from the adiabatic transformation toward the SWS, the consequence of these processes being the important decrease in the amount of precipitation.
Another particularity of the local rainfalls, detected when analyzing the hourly data, is that the precipitation starts in the northern half of the researched area (SV2) 2 h earlier, and in its center (SV1), 1 h earlier than in the southern extremity, at SWS. Instead, the precipitation lasts 1–3 h later at SWS compared to SV2 and SV1. Therefore, the territorial pattern of the propagation of precipitation unfolds with a time lag from the N to the city center and to the S (where it starts later but lasts 1–3 h after the precipitation stopped in the rest of the city).
By analyzing the number of precipitation days at the stations with daily data (SWS, SGS, SV1, SV2), we found that, out of 731 days in 2020 and 2021, precipitation fell on at least one point out of the four analyzed on 405 days (55.4% of interval days). Of the 405 days with precipitation, in 119 days (29.1%) the precipitation was recorded in only one point, in 72 days (17.8%) in two points, in 109 days (26.8) in three points out of four, and in 106 days (23.2%) in all analyzed points. The differentiated number of days with precipitation in these four considered points is an element that shows how important local factors are in generating these pluviometric differentiations.
On the right side of the Suceava River, we placed six monitoring points and, on the left side, we placed another six points (Figure 2), in such a way that we can obtain, with great precision, the air temperature distribution on one side and the other of the mentioned river. From the analysis of all 12 temperature time series (Figure 9), we note that the outskirts of the city—at SWS and SIL—have the lowest temperature values. The altitudinal position, the grassy surface and the surrounding forest give the two locations the status of cooler areas. We note the existence of a first urban heat island (UHI1) located in the southern half of the city (SCO, SV1, CCO), whose heat thermal gain is within the limits of 0.8–1.0 °C compared to SWS, which was taken as a landmark. A second urban heat island (UHI2), better highlighted than the previous one (with a thermal increase of 0.7–1.3 °C compared to SWS), is in the northern half of the city (AMB, SV2, BUO, BUS).
The thermal differences between the urban heat islands and the city surroundings can exceed 2 °C in some time intervals. In the midday and afternoon hours (12.30–14.30), the heat islands may merge, or a third heat island (UHI3) may appear above the Suceava floodplain; this is sometimes dominant in the thermal field (in autumn, for example, it shows a thermal increase of almost 4.5 °C compared to SWS). The observed thermal differences are small compared to those of other cities, mainly due to the small size of Suceava city; the UHI can determine an increase in air temperature of up to 15 °C in some cities [22], and the temperature increase in various surfaces/land covers is even higher [23].
From the analysis of all the air temperature data, we observed that the highest diurnal thermal amplitudes occur along the floodplain of the Suceava River (at the ITC, TRN stations; on average, the value of the diurnal thermal amplitude is 10–11 °C, and in winter, this thermal parameter is included between 6 and 7 °C, while in summer, it can rise to 15 °C).

3.4. Complex Causes Lead to Complex Effects

The temperature surges of the Suceava River tributaries have an impact on the diurnal cycle of the main river, and the moment of the day when the impact is recorded can be used to detect indirectly which tributaries were more affected by the rains. The surge in the Suceava River is sometimes observed after similar events were recorded in its urban tributaries (the most reliable recorder is the Cetăţii Creek) (Figure 10). The surge recorded at Tişăuţi (TIS), downstream of Suceava city, can occur quasi-simultaneously with the surge in the Cetăţii Creek (located most downstream within the city) or later. The fact that a temperature surge in the Suceava River can also happen simultaneously with a surge in the Cetăţii Creek indicates that the surge in the main river originates upstream of the river mouth of the Cetăţii Creek, from the contribution of the other urban tributaries. When the surge in the main river originates later than in the Cetăţii Creek, it has thermal contributions mostly from the Cetăţii Creek and the wastewaters from the WWTP. In both cases, the occurrence of the temperature surge during midnight removes any incertitude regarding the source of heat; the late hour of the temperature peak at TIS is caused by the time needed by the heat wave/warmed waters to propagate from the city to TIS. The Suceava River has shallow waters and a riverbed with transversal hydraulic infrastructures that cause a good mixing, and the water temperature is relevant for the whole water flow.
The wastewaters were previously analyzed as sources of heat into the Suceava River via the WWTP [20] because most of the runoff in the city goes into the combined sewer network. During 12 and 13 June 2020, the output of treated waters from the WWTP into the Suceava River was 0.4 m3/s at 21.3 °C and, respectively, 0.43 m3/s at 20.8 °C (daily averages). The annual average output of the WWTP is 0.34 m3/s and this value remains the same for the averages of the warm or cold semester, summer or winter season (based on data from 2019–2021, using daily averages; standard deviation of 0.05 m3/s). Therefore, in the analyzed days of June, the warm output of the WWTP was increased by urban runoff after rainfalls. Without the urban runoff, the temperature of the main river at midnight would have been ~20 °C and, respectively, 19 °C and, thus, the river temperature downstream has benefited from the warmer wastewater. It is difficult to distinguish the contribution of tributaries from that of the WWTP, especially when both parts have temperatures above that of the Suceava River. On 28 May 2020, the effluent of the WWTP had the average daily value of 16.3 °C.
The impact of the warm runoff and urban heat island is evident as the temperature of the Suceava River increases from SGS to TIS; the average temperature of the first monitoring period (September 2019–June 2021) was 0.73 °C higher downstream (parameters at SGS in order to compare with TIS data in Table 1 as follows: average—8.44 °C, minimum—0 °C, maximum—21.2 °C, standard deviation—5.81 °C).
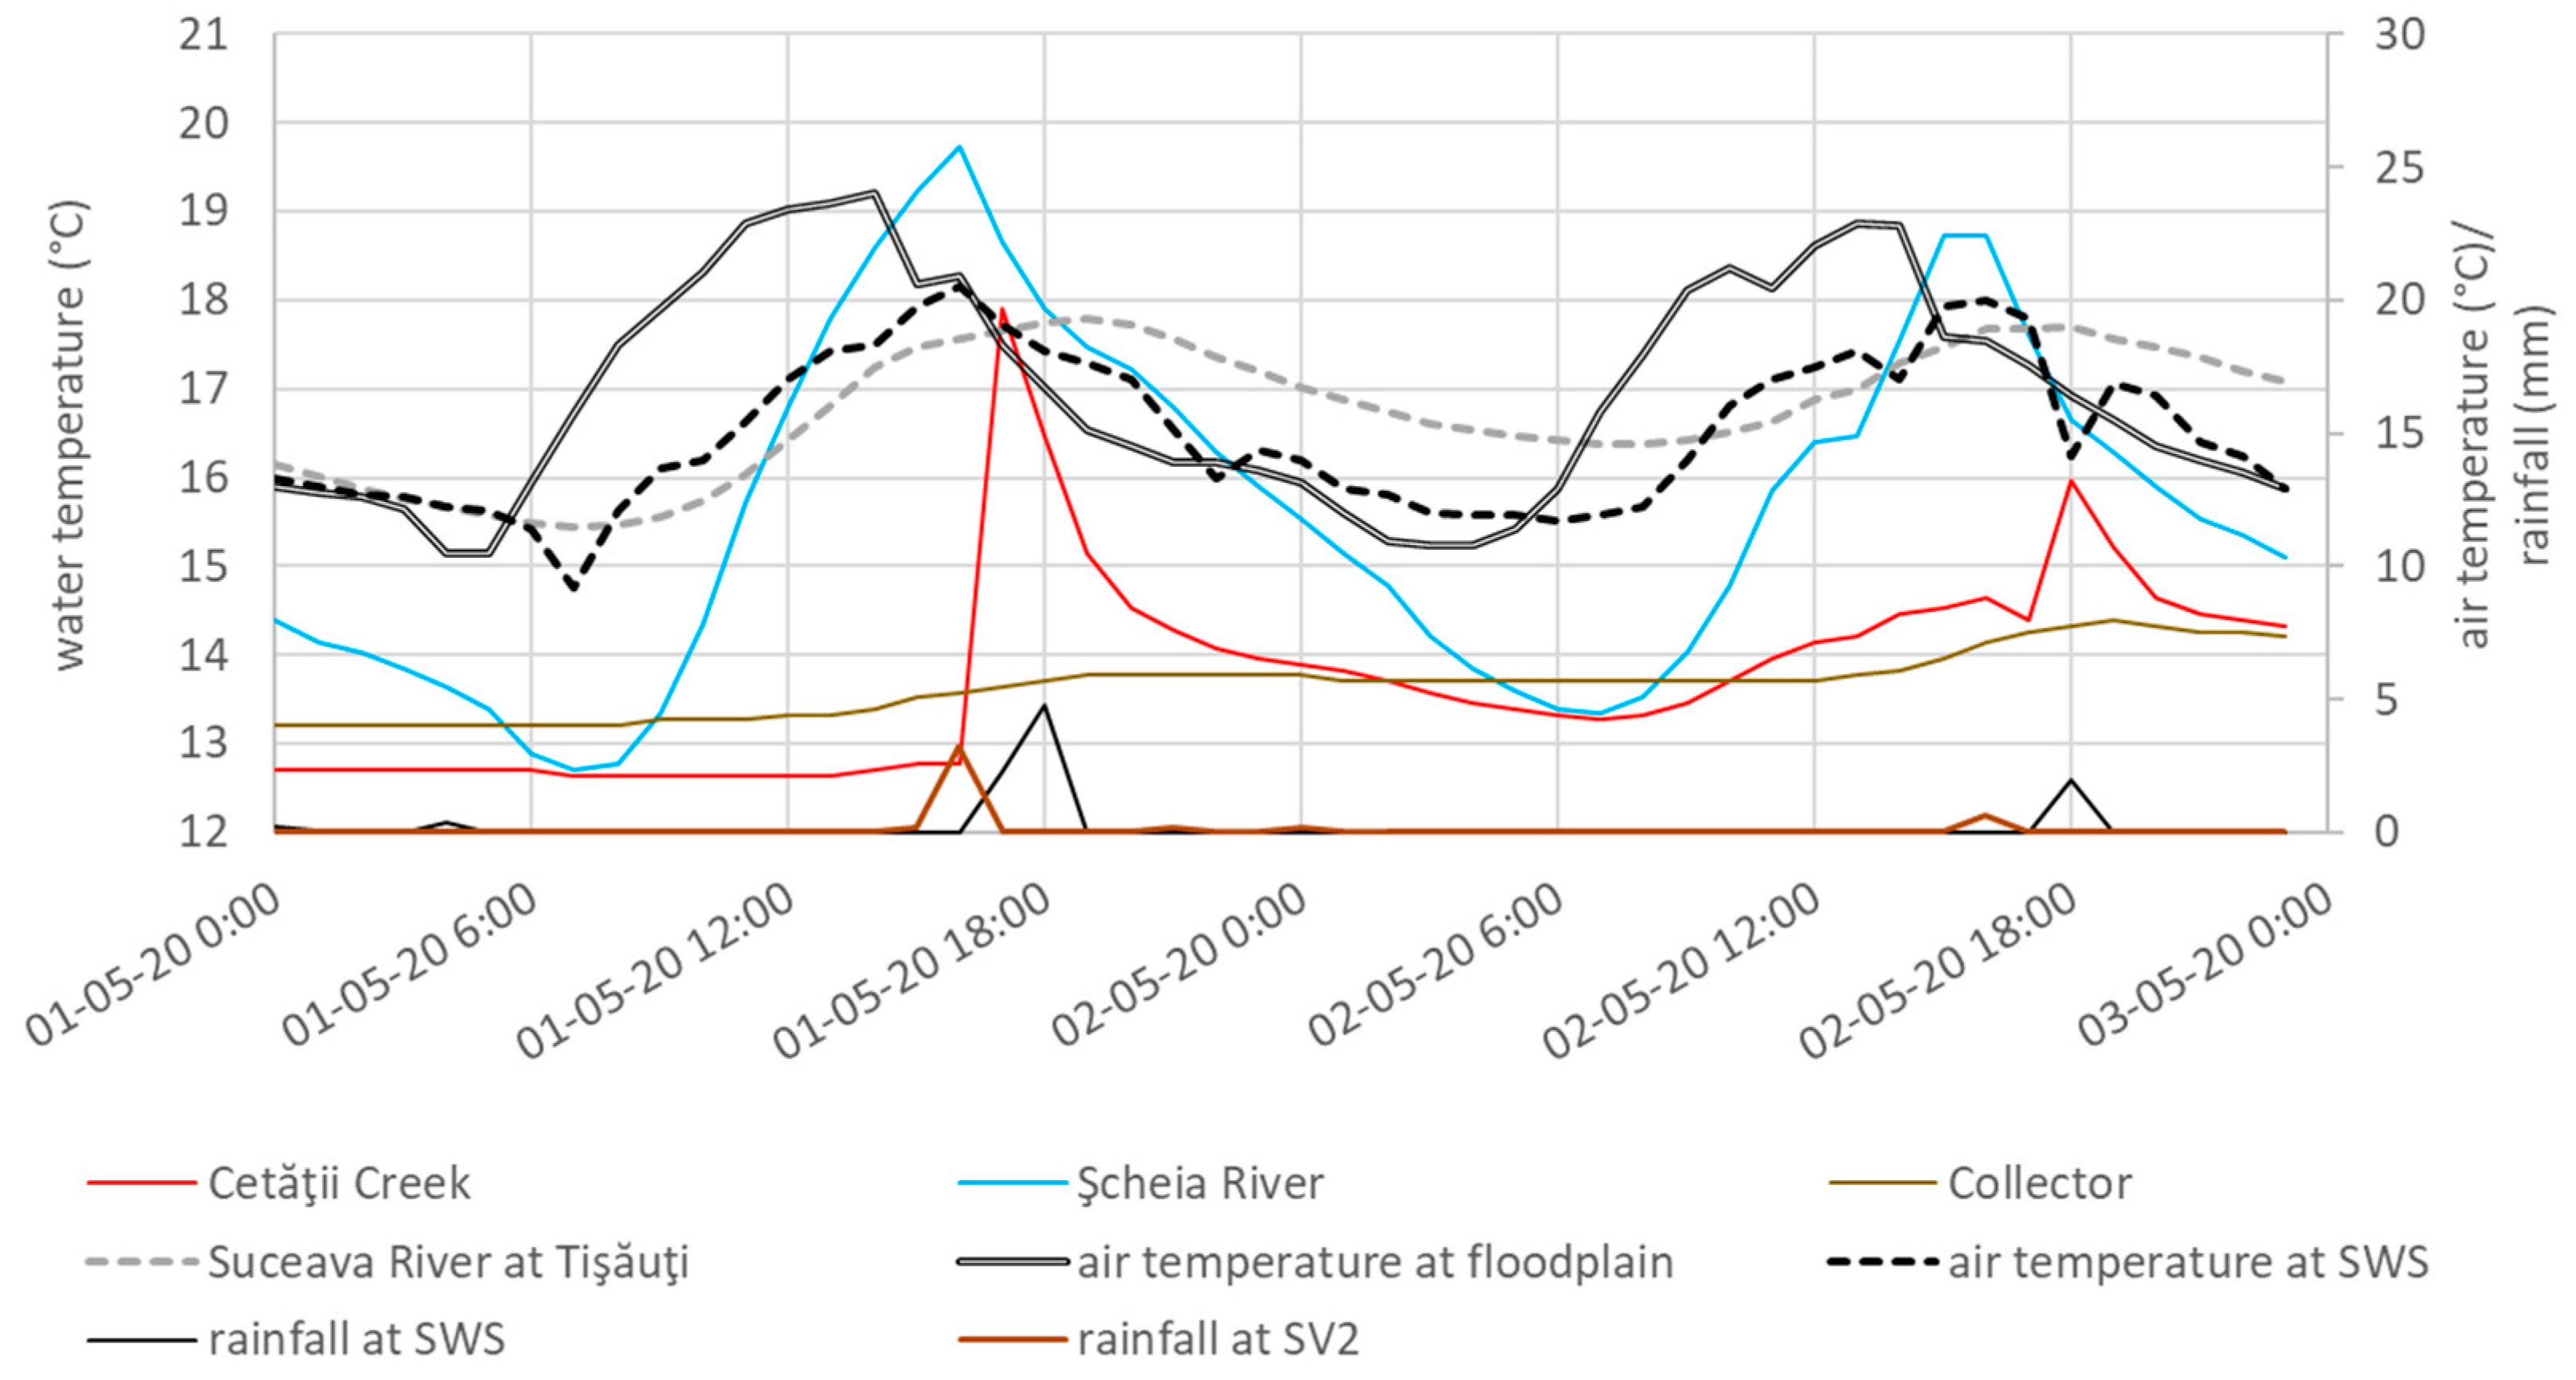
The maximum amplitude was recorded in the Cetăţii Creek—5.2 °C for a rainfall with a maximum amount of 4.8 mm precipitation that lasted 7 h starting from 16:00 (Figure 11). The peak temperature exceeded the maximum temperature of the Suceava River, which would have been lower and occurring earlier without the storm runoff, and the diurnal maximum of the Suceava River shifted toward the evening, at 19:00. The impact on the Suceava River was possible because the main river was at baseflow, with a discharge of 4.35 m3/s during that day (1 May 2020)—for comparison, the average flow rate of the Suceava River in 2020 was 14.81m3/s (median 6.89 m3/s). During the summer days, when the surface runoff over the urban surfaces increases because of the rainy season, the Suceava River also has higher discharges that often greatly diminish the thermal influence of the urban tributaries.
Based on the average values from the three studied watersheds, a rainfall event of approximately 5.8–7.7 mm can cause a streamwater temperature surge of 0.5–1.4 °C and 3.9–5.6 h in the temporal length/duration. The amplitude of the surges decreases from the Cetăţii watershed toward the Dragomirna watershed (Figure 12) because of the lower percentage of the constructed land in the total of the lower watershed.
The lower watersheds’ upper boundaries were defined mostly by the numerous dams that intersect the studied rivers and their tributaries (an exception is the Şcheia River, where the upper limit of the lower watershed was defined at the upper end of the constructed land of the Şcheia village). The lakes behind the dams retain most of the water surplus that occur during the rainfalls that affect the entire watersheds; as result, the water flow characteristics measured downstream of these dams during rains are caused mainly by surface runoffs originating from the built areas of Suceava city, which are represented by various roof and pavement types, mainly with a temperature above that of the air.
The lower watershed represents a varying percentage in the total size of the studied tributaries’ watershed as follows: Cetăţii Creek—50.8%, Şcheia—32.8%, Dragomirna—15.2%. This partly explains the higher occurrence and amplitude of the temperature surges in the Cetăţii Creek. Additionally, the percentage of the constructed land in the total of the lower watershed is greater in the case of the Cetăţii Creek (~80%), adding to the explanation of the greater occurrence of the temperature surges. A positive correlation between the percentage of the impermeable surfaces in a catchment and the temperature of the urban stream was detected in various studies [24,25], and the streamwater temperature increase can be partly caused by runoffs from warm/hot surfaces, which often have a lower albedo than natural surfaces [26,27].
The minimum rainfall recorded at a monitoring point after which a surge occurred was 0.4 mm (keeping in mind the high spatial variability of rainfalls), while the maximum was 19.4 mm. The minimum and maximum surge amplitudes were 0.1 °C and, respectively, 5.2 °C. The duration ranged from 1 to 10 h.
The Dragomirna River’s lower watershed needs a rainfall minimum of 2 mm in order to record a surge of up to 1.3 °C; similar values for Şcheia are 0.9 mm and 2.5 °C, while for the Cetăţii Creek, they are 0.4 mm and 5.2 °C. This means that a more consistent rainfall is needed to cause a temperature surge in the Dragomirna River, mostly because the constructed land covers only a small part of the lower watershed. Additionally, as the percentage of the constructed land in the total of the lower watershed increases (in the other watersheds), the surge amplitude and duration/length also increase.
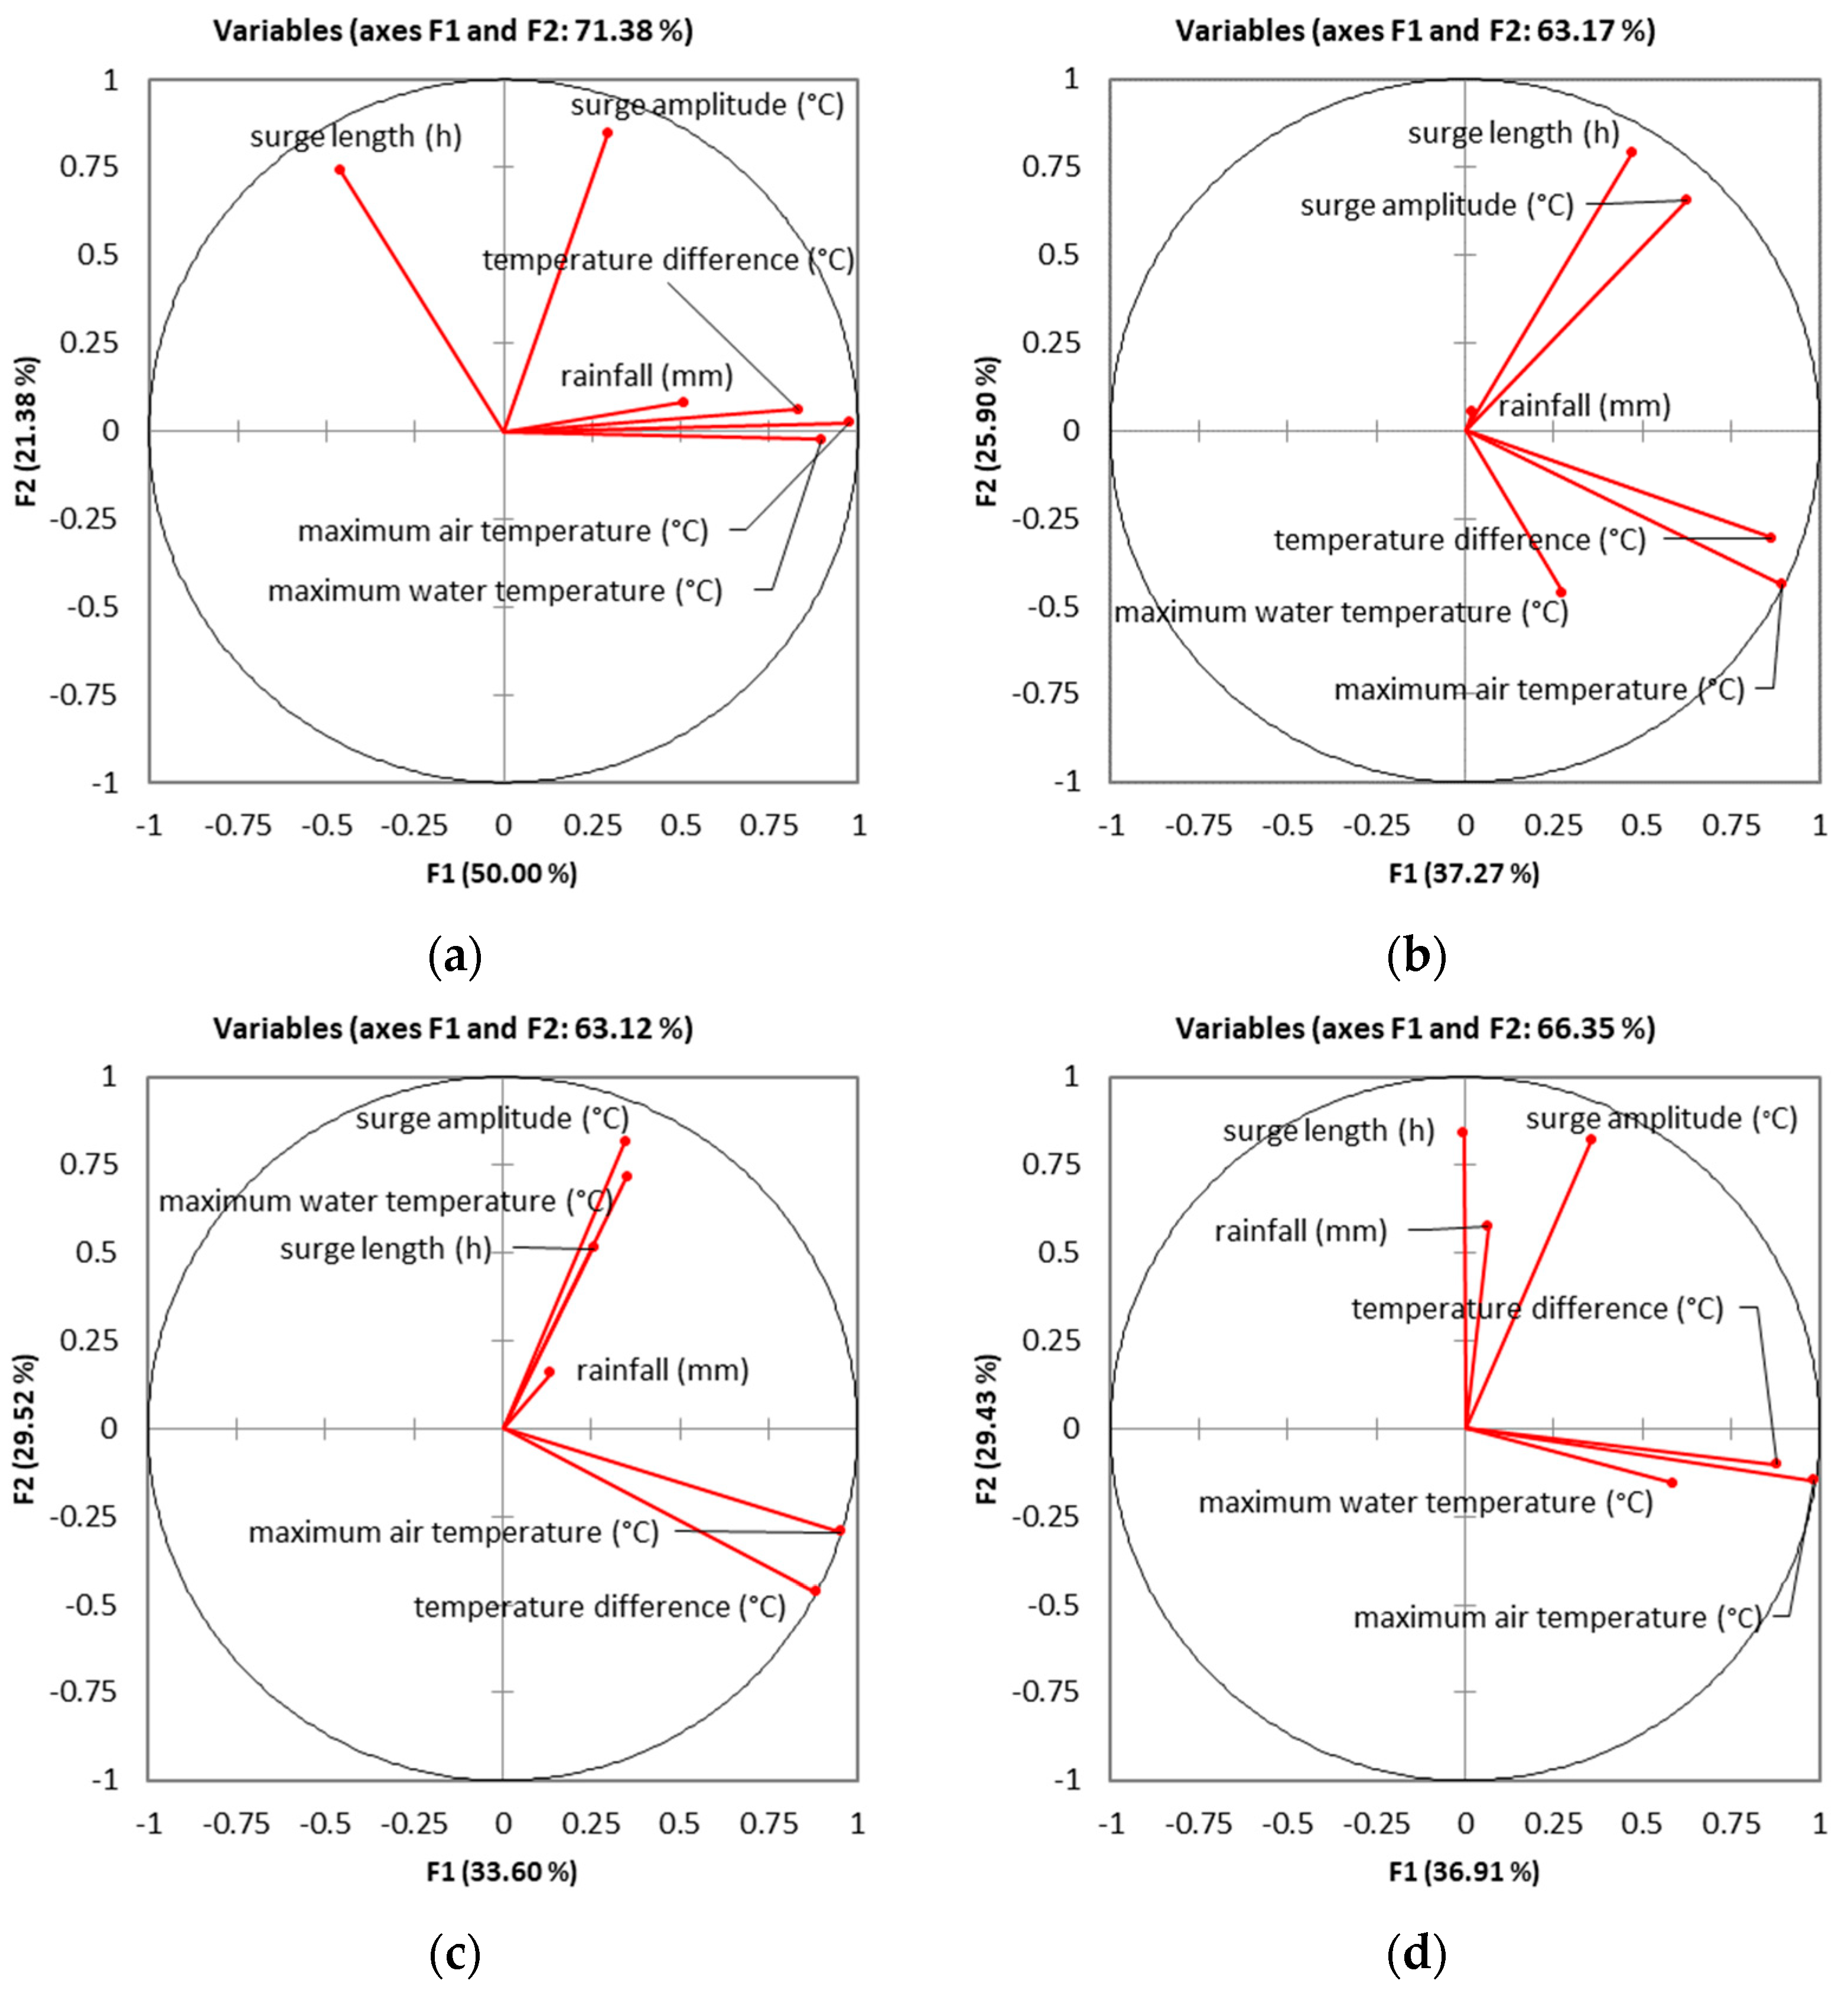
A multivariate analysis of the streamwater temperature surge (surge temperature, duration and amplitude) and environmental parameters (atmospheric precipitation amount, air temperature) suggests that, overall (all surge events, all streams), there is a strong positive correlation between the water and air temperature and the rainfall amount; this confirms that, during the monitoring periods, the climate of the study area preserved its main characteristics, with warm and wet summers/more precipitation in the warm semester (Figure 13).
When we restrict the Principal Component Analysis (PCA) in order to include only the surge events from the summer months (when half of the surges happened), we can observe that there is a strong positive correlation between the surge length and surge amplitude (Pearson coefficient = 0.7, significance level alpha = 0.05); this correlation is evident during the summer, most probably because there is a smaller variability of rainfall characteristics and of the warming of the urban surfaces during the same season. If we restrict the PCA analysis of the summer surges only to the Cetăţii Creek watershed (Figure 13c), we discover that a positive correlation also exists between the surge length and amplitude and the maximum water temperature of the stream during the day of the surge, indicating that, in this watershed, the temperature surges are the events that impose the maximum diurnal temperature when they occur (made possible due to the colder wastewater discharged into the creek). The Şcheia and Dragomirna rivers have a similar behavior, different from that of the Cetăţii Creek in regard to the stronger positive correlation between the rainfall amount and the surge length and amplitude; this correlation is possible because the surface runoffs do not have to compete with/diminish the influence of the untreated wastewaters discharged into the rivers in order to determine the short-term increases in water temperature (Figure 13d). Additionally, the strong positive correlation between the surge length and the surge amplitude happens again (Pearson coefficient = 0.6, significance level alpha = 0.05), indicating that these two rivers are to be regarded as producing the standard behavior of an urban tributary in the metropolitan area, while the Cetăţii Creek is an exception.
Most streamwater temperature surge events occur in the second half of an average day (as other similar studies have found, too [5,6,7]) due to three favorable facts as follows: a. the urban air and surfaces are warmer in the afternoon and early evening than in the rest of the day, being able to raise the temperature of stormwater runoffs; b. during an average day, most atmospheric precipitation occurs in the late afternoon (16:00–17:00), when the runoff is heated by the urban surfaces; c. when a temperature surge starts in the late evening/early night, it is measurable due to the fact that the stream temperature before the rainfall has already been diminished after the daylight hours, when the stream was partly (over-)heated by direct solar radiation and less able to record small inputs of warm runoff, and the urban surfaces are still warm enough to cause stream temperature surges from warm runoffs.
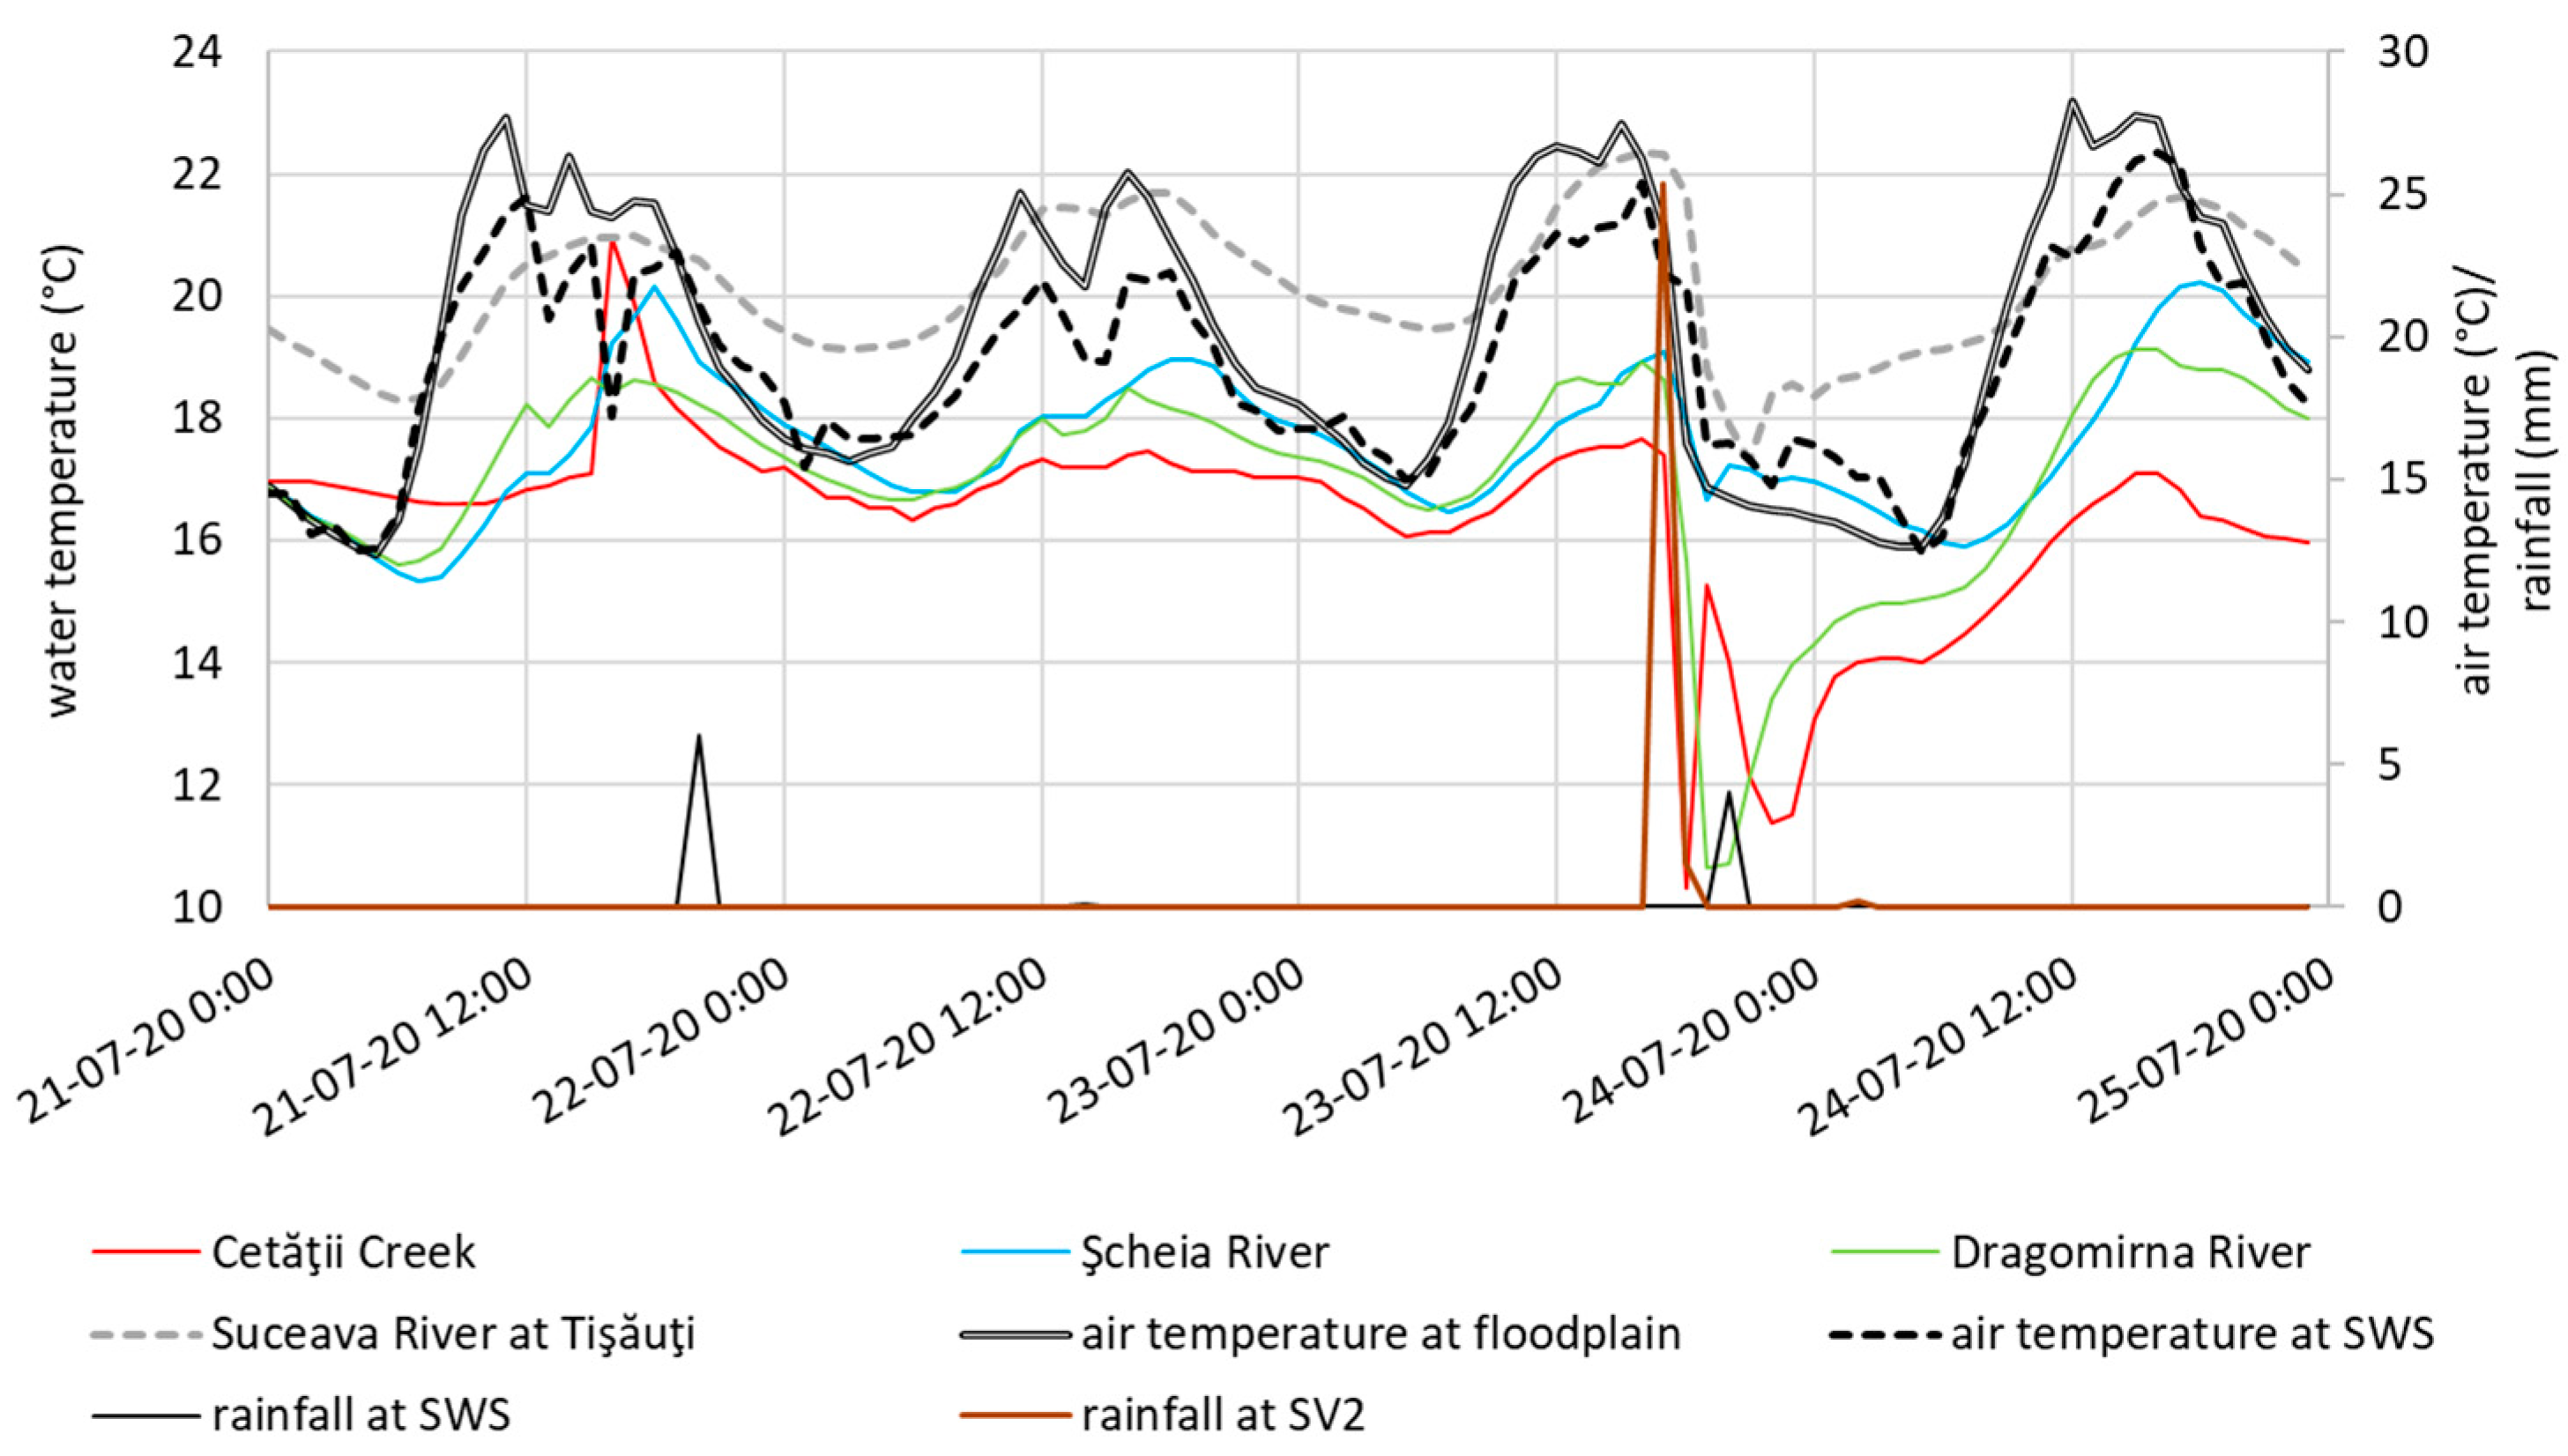
The atmospheric precipitation should also be taken into account not only as quantitative data, but also as qualitative data. This is the case of the day of 23 July 2020 (Figure 14), when a strong precipitation occurred, but it was a hailstorm (documented in the scientific literature [28]), which lowered the temperature of all rivers, small and big.
The urban atmospheric precipitation can be heated up before reaching the urban surfaces, having, as a source of heat, the warmer air of the two urban heat islands, UHI1 and UHI2, which have a quasi-permanent status, and also the third heat island, UHI3, especially during the daylight and the afternoons. Adding to these average situations, rains that interrupt hot periods with a strong heating of the urban surface and of the air above (the average of thermal maxima at SWS was 36.5 °C) can generate torrents of warm water that reach the Suceava River and its tributaries and might abruptly increase the streamwater temperature.
Future studies about the temperature jumps of urban streamwaters after rainfalls should rely more on data from high frequency measurements (<1 h sampling frequency) in order to observe the details of the “first heat flush” [29,30] that occurs immediately after a rainfall; high temporal frequency data might include higher temperature peaks than the lower frequency measurements were able to record.
4. Conclusions

Despite the small size of its urban surface and population, Suceava city has an urban heat island composed of multiple nuclei that impose a permanent thermal separation between the built/developed spaces and the countryside. The warm urban air and surfaces cause warmer urban streamwaters, both during baseflow and during rainfalls. The rainfalls have very variable amounts and durations, mainly because of the general air circulation and local turbulence and the configuration of slope orientations.
The urban streamwater temperature surges are frequently observed on the tributaries of the Suceava River because they have smaller flow rates than the city’s main river and, therefore, have less thermal inertia and less capacity to absorb warm runoffs without measurable temperature increments. The surges usually have a temperature of about 1 °C and last a few hours (<10), occurring mainly in the warm semester of the year (May–October). Their frequency is higher in the Cetăţii Creek’s lower watershed because of the high percentage of impervious surfaces and especially because the influx of wastewater into the stream is important, lowering the baseflow temperature of the creek during the warm semester and making the warm runoff inputs easier to be measured; the wastewater input also ensured the favorable context for recording the highest stream temperature jump in the study area.
A greater percentage of the constructed land in the lower watershed leads to a greater occurrence of the temperature surges (e.g., an 80% constructed land might lead to a 93.5% chance to generate a streamwater temperature surge).
Streamwater temperature surges rarely occur simultaneously in all urban rivers (in 37.5% of all rainfall events with surges) because of the high spatial variability of urban rainfalls and because of the important differences between urban rivers.

Author Contributions

Conceptualization, A.-E.B.; data curation, A.-E.B. and D.M.; investigation, A.-E.B. and D.M.; methodology, A.-E.B. and D.M.; resources, A.-E.B., A.P., D.M. and D.I.O.; supervision, A.-E.B. and D.M.; visualization, D.I.O. and A.P.; writing—original draft, A.-E.B. and D.M.; writing—review and editing, A.-E.B. All authors have read and agreed to the published version of the manuscript.

Funding

This research received no external funding.

Data Availability Statement

Data access is restricted due to ongoing doctoral research of one of the authors.

Acknowledgments

Due to important field and laboratory work, Dumitru Mihăilă is to be considered, together with Andrei-Emil Briciu, as one of the principal authors. Thanks for the data provided is addressed to three Romanian institutions, ANAR (Siret Water Basin Administration), ANM, ANPM, and ACET Suceava. This study was partly supported by the data obtained within the research project SQRTDA (Streamwater Quality Real-Time Data Analysis).

Conflicts of Interest

The authors declare no conflict of interest.

References

  1. Nelson, K.C.; Palmer, M.A. Stream temperature surges under urbanization and climate change: Data, models, and responses. JAWRA J. Am. Water Resour. Assoc. 2007, 43, 440–452. [Google Scholar] [CrossRef]
  2. Rice, J.S., Jr.; Anderson, W.P.; Thaxton, C.S. Urbanization Influences on Stream Temperature Behavior within Low Discharge Headwater Streams. Hydrol. Res. Lett. 2011, 5, 27–31. [Google Scholar] [CrossRef]
  3. Hathaway, J.M.; Winston, R.J.; Brown, R.A.; Hunt, W.F.; McCarthy, D.T. Temperature dynamics of stormwater runoff in Australia and the USA. Sci. Total Environ. 2016, 559, 141–150. [Google Scholar] [CrossRef] [PubMed]
  4. Sun, N.; Yearsley, J.; Voisin, N.; Lettenmaier, D.P. A spatially distributed model for the assessment of land use impacts on stream temperature in small urban watersheds. Hydrol. Process. 2014, 29, 2331–2345. [Google Scholar] [CrossRef]
  5. Somers, K.A.; Bernhardt, E.S.; Grace, J.B.; Hassett, B.A.; Sudduth, E.B.; Wang, S.; Urban, D.L. Streams in the urban heat island: Spatial and temporal variability in temperature. Freshw. Sci. 2013, 32, 309–326. [Google Scholar] [CrossRef]
  6. Zahn, E.; Welty, C.; Smith, J.A.; Kemp, S.J.; Baeck, M.; Bou-Zeid, E. The Hydrological Urban Heat Island: Determinants of Acute and Chronic Heat Stress in Urban Streams. JAWRA J. Am. Water Resour. Assoc. 2021, 57, 941–955. [Google Scholar] [CrossRef]
  7. Zeiger, S.J.; Hubbart, J.A. Urban Stormwater Temperature Surges: A Central US Watershed Study. Hydrology 2015, 2, 193–209. [Google Scholar] [CrossRef]
  8. Croghan, D.; Van Loon, A.F.; Sadler, J.P.; Bradley, C.; Hannah, D.M. Prediction of river temperature surges is dependent on precipitation method. Hydrol. Process. 2019, 33, 144–159. [Google Scholar] [CrossRef]
  9. Cristiano, E.; ten Veldhuis, M.C.; Van De Giesen, N. Spatial and temporal variability of rainfall and their effects on hydrological response in urban areas—A review. Hydrol. Earth Syst. Sci. 2017, 21, 3859–3878. [Google Scholar] [CrossRef]
  10. Peleg, N.; Blumensaat, F.; Molnar, P.; Fatichi, S.; Burlando, P. Partitioning the impacts of spatial and climatological rainfall variability in urban drainage modeling. Hydrol. Earth Syst. Sci. 2017, 21, 1559–1572. [Google Scholar] [CrossRef]
  11. Maier, R.; Krebs, G.; Pichler, M.; Muschalla, D.; Gruber, G. Spatial Rainfall Variability in Urban Environments—High-Density Precipitation Measurements on a City-Scale. Water 2020, 12, 1157. [Google Scholar] [CrossRef]
  12. Simpson, I.M.; Winston, R.J. Effects of land use on thermal enrichment of urban stormwater and potential mitigation of runoff temperature by watershed-scale stormwater control measures. Ecol. Eng. 2022, 184, 106792. [Google Scholar] [CrossRef]
  13. Maas, C.M.; Anderson, W.P.; Cockerill, K. Managing Stormwater by Accident: A Conceptual Study. Water 2021, 13, 1492. [Google Scholar] [CrossRef]
  14. Krause, C.W.; Lockard, B.; Newcomb, T.J.; Kibler, D.; Lohani, V.; Orth, D.J. Predicting influences of urban development on thermal habitat in a warm water stream. J. Am. Water Resour. Assoc. 2004, 40, 1645–1658. [Google Scholar] [CrossRef]
  15. Van Eck, N.J.; Waltman, L. Software survey: VOSviewer, a computer program for bibliometric mapping. Scientometrics 2010, 84, 523–538. [Google Scholar] [CrossRef]
  16. Rosen, M.A.; Bulucea, C.A.; Mastorakis, N.E.; Bulucea, C.A.; Jeles, A.C.; Brindusa, C.C. Evaluating the Thermal Pollution Caused by Wastewaters Discharged from a Chain of Coal-Fired Power Plants along a River. Sustainability 2015, 7, 5920–5943. [Google Scholar] [CrossRef]
  17. Dobrei, L.G.; Andronache, C.D.; Alic, C.; Vasiu, T.; Baraiac, O. Thermal pollution of Mures river by discharge of the cooling waters from Mintia power plant - Geoconference on ecology, economics, education and legislation. In Proceedings of the SGEM 2013, Albena, Bulgaria, 16–22 June 2013; Volume I. [Google Scholar]
  18. Zoran, M.A.; Savastru, R.S.; Savastru, D.M.; Miclos, S.I.; Tautan, M.N.; Baschir, L.V. Thermal pollution assessment in nuclear power plant environment by satellite remote sensing data - SPIE Remote Sensing. In Remote Sensing for Agriculture, Ecosystems, and Hydrology XIV; SPIE: Edinburgh, UK, 2012; Volume 8531, pp. 477–484. [Google Scholar]
  19. Briciu, A.-E.; Mihăilă, D.; Mihăilă, D. Short, medium and long term stochastic analysis of the Suceava River pollution evolution in the homonymous city. In Proceedings of the SGEM 2012 Conference Proceedings, Albena, Bulgaria, 1 August 2012; Volume 3, pp. 809–816. [Google Scholar]
  20. Briciu, A.-E.; Mihăilă, D.; Graur, A.; Oprea, D.I.; Prisăcariu, A.; Bistricean, P.I. Changes in the Water Temperature of Rivers Impacted by the Urban Heat Island: Case Study of Suceava City. Water 2020, 12, 1343. [Google Scholar] [CrossRef]
  21. Briciu, A.-E. Studiu de hidrologie urbana în arealul municipiului Suceava. In Urban Hydrology Study in Suceava Municipality Area; Stefan cel Mare University Publishing House: Suceava, Romania, 2017. [Google Scholar]
  22. Santamouris, M. Heat-Island Effect. In Energy and Climate in the Urban Built Environment, Santamouris, M., Ed.; Routledge: New York, NY, USA, 2011; Chapter 5; pp. 48–66. [Google Scholar]
  23. Oke, T.R.; Mills, G.; Christen, A.; Voogt, J.A. Urban Climates; Cambridge University Press: Cambridge, UK, 2017. [Google Scholar]
  24. Gu, C.; Anderson, W.P.; Colby, J.D.; Coffey, C.L. Air-stream temperature correlation in forested and urban headwater streams in the Southern Appalachians. Hydrol. Process. 2014, 29, 1110–1118. [Google Scholar] [CrossRef]
  25. Galli, J. Thermal Impacts Associated with Urbanization and Stormwater Management Best Management Practices; Department of Environmental Programs, Metropolitan Washington Council of Governments: Washington, DC, USA, 1990. [Google Scholar]
  26. Mohajerani, A.; Bakaric, J.; Jeffrey-Bailey, T. The Urban Heat Island Effect, Its Causes, and Mitigation, with Reference to the Thermal Properties of Asphalt Concrete. J. Environ. Manag. 2017, 197, 522–538. [Google Scholar] [CrossRef]
  27. Ramamurthy, P.; Bou-Zeid, E.; Smith, J.A.; Wang, Z.; Baeck, M.L.; Saliendra, N.Z.; Hom, J.L.; Welty, C. Influence of Subfacet Heterogeneity and Material Properties on the Urban Surface Energy Budget. J. Appl. Meteorol. Clim. 2014, 53, 2114–2129. [Google Scholar] [CrossRef]
  28. Drăgoiu, B.-A. Mapping the effects of the 23 July 2020 hailstorm that occurred in Suceava, Romania. Georeview 2022, 32, 39–48. [Google Scholar]
  29. Martin, R.M.; Sanchez, S.C.; Welker, A.L.; Komlos, J. Thermal Effects of Stormwater Control Measures on a Receiving Headwater Stream. J. Sustain. Water Built Environ. 2021, 7, 06020002. [Google Scholar] [CrossRef]
  30. Kolath, A.S.; Egemose, S. Influences of Urban Discharges and Urban Heat Effects on Stream Temperature. Hydrology 2023, 10, 30. [Google Scholar] [CrossRef]
Figure 1. The weight of some concepts in the scientific literature indexed by the Web of Science Core Collection that refer to urban, stream, water and temperature. A total of 804 papers found as of 27 January 2023; importance is suggested by the size of circles and letters; lines indicate links and different colors indicate different clusters. Obtained with VOSviewer 1.6.18 (https://www.vosviewer.com/— accessed on 27 January 2023 [15]), default settings, except minimum cluster size, which is set to 100 items.
Sustainability 15 07882 g001
Figure 2. Map of the study area with delineation of watersheds and position of the monitoring points (including a mini map with the position of the study area within Romania).
Sustainability 15 07882 g002
Figure 3. Raw time series showing the variation of water temperature in the study area during the three monitoring periods as follows: (a) 19 September 2019–24 June 2020; (b) 6 July 2020–21 April 2021; (c) 10 June 2021–26 November 2021.
Sustainability 15 07882 g003
Figure 4. Diurnal thermal profiles of water and air in the (a) Cetăţii Creek; (b) Şcheia River; (c) Dragomirna River; (d) Collector; (e) air at SWS (S—southern part of the study area) and in the floodplain (N—northern part).
Sustainability 15 07882 g004
Figure 5. Streamwater temperature surges in Şcheia and Dragomirna rivers in 2021, occurring after some summer rains (a) in June and (b) in August.
Sustainability 15 07882 g005
Figure 6. The percentage distribution during an average year of streamwater temperature surges after rainfall–runoff events (estimates from the extrapolation of the monitoring periods).
Sustainability 15 07882 g006
Figure 7. Streamwater temperature surges that occurred in Cetăţii Creek in 2020, with and without correspondence in Şcheia and Dragomirna rivers during (a) 8–12 August and (b) 19–27 August.
Sustainability 15 07882 g007
Figure 8. Characteristics of the atmospheric precipitation above Suceava city. (a) Sum of precipitation for 2 years, 2020 and 2021; (b) diurnal profile of precipitation at stations with hourly data and using the same type of instrument.
Sustainability 15 07882 g008
Figure 9. Urban heat island(s) above Suceava city as revealed by air temperature at 2 m above the topographic surface along a line passing through 12 monitoring points and with a general N–S direction (average values as follows): (a) annual; (b) winter; (c) spring; (d) summer; (e) autumn.
Sustainability 15 07882 g009aSustainability 15 07882 g009b
Figure 10. Streamwater temperature surges in Suceava River and its urban tributaries in 2020 (a) in May and (b) in June.
Sustainability 15 07882 g010aSustainability 15 07882 g010b
Figure 11. The thermal context of water and air during the highest streamwater temperature surge recorded in Suceava city up to date.
Sustainability 15 07882 g011
Figure 12. Univariate standard plots of data about the recorded streamwater temperature surges and the rainfalls from the same days (the maximum amount of precipitation from a rain event; for surges that occur during midnight, spanning two days, rain data are from the first day) as follows: The horizontal line in the box is the median, the box represents the interquartile range (contains 50% of data), the plus sign is the average, the dots are the minimum or maximum and the whiskers are extending to the furthest value that is within 1.5 times the interquartile range.
Sustainability 15 07882 g012aSustainability 15 07882 g012b
Figure 13. Principal Component Analysis of water and air properties during streamwater temperature surges (air temperature and rainfall refers to the maximum recorded at a monitoring point in the day with a surge; the maximum water temperature of a day with surge may occur or not during the surge, and the temperature difference parameter is the difference between the maximum air temperature in the floodplain and the maximum water temperature) as follows: (a) all surges taken into account; (b) all surges during summer; (c) all surges in Cetăţii Creek during summer; (d) all surges in Şcheia and Dragomirna rivers during summer.
Sustainability 15 07882 g013
Figure 14. Contrasting thermal influences of summer atmospheric precipitation during the same week; rain and hail effects indicate the usefulness of qualitative data analysis.
Sustainability 15 07882 g014
Table 1. Descriptors of water and air temperature time series of the three monitoring periods (all values in degrees Celsius; floodplain represents average from five points: SV2, ITC, TRN, AMB, ACT).
19 September 2019–24 June 2020
Water temperature Air temperature
Cetăţii CreekŞcheia RiverCollectorDragomirna RiverSuceava Rv. at TIS *SWSFloodplain
average11.348.5010.43-9.178.097.67
minimum5.80.12.2-0−15.6−13.1
maximum21.824.919.8-2330.927.5
stand. dev. *2.795.105.13-5.747.967.11
6 July 2020–21 April 2021
Water temperature Air temperature
Cetăţii CreekŞcheia RiverCollectorDragomirna RiverSuceava Rv. at TIS *SWSFloodplain
average12.509.35-8.99-8.737.94
minimum6.70.1-0.1-−18.5−18
maximum2122.3-22.8-36.133.7
stand. dev. *3.666.29-6.73-9.849.39
10 June 2021–26 November 2021
Water temperature Air temperature
Cetăţii CreekŞcheia RiverCollectorDragomirna RiverSuceava Rv. at TIS *SWSFloodplain
average-13.87-14.80-15.5214.46
minimum-2.4-2.5-−4.1−3.9
maximum-23.1-26.6-35.432.6
stand. dev. *-5.16-6.15-8.677.67
* abbreviations: Rv.—River; stand. dev.—standard deviation.
Disclaimer/Publisher’s Note: The statements, opinions and data contained in all publications are solely those of the individual author(s) and contributor(s) and not of MDPI and/or the editor(s). MDPI and/or the editor(s) disclaim responsibility for any injury to people or property resulting from any ideas, methods, instructions or products referred to in the content.