Abstract
In this paper, a novel hybrid model for the fault diagnosis of photovoltaic (PV) modules was developed. The model combines a convolutional neural network (CNN) with a machine learning (ML) algorithm. A total of seven defects were considered in this study: sand accumulated on PV modules, covered PV modules, cracked PV modules, degradation, dirty PV modules, short-circuited PV modules, and overheated bypass diodes. First, the hybrid CNN–ML has been developed to classify the seven common defects that occur in PV modules. Second, the developed model has been then optimized. Third, the optimized model has been implemented into a microprocessor (Raspberry Pi 4) for real-time application. Finally, a friendly graphical user interface (GUI) has been designed to help users analyze their PV modules. The proposed hybrid model was extensively evaluated by a comprehensive database collected from three regions with different climatic conditions (Mediterranean, arid, and semi-arid climates). Experimental tests showed the feasibility of such an embedded solution in the diagnosis of PV modules. A comparative study with the state-of-the-art models and our model has been also presented in this paper.
1. Introduction
Currently, millions of photovoltaic (PV) plants are installed around the world. With reference to the International Energy Agency (IEA), more than 940 GW [1] of PV capacity had been installed by the end of 2021. Given the widespread use of PV power supply systems and to keep these PV plants safe and avoid power losses, these plants should be carefully protected and monitored [2]. The overheating of solar cells, known as the hot spot phenomenon, is considered to be a big issue in solar PV plants [3]. In most cases, it leads to the risk of fire, as shown in Figure 1. Overheated solar cells are mainly due to internal and external defects [4,5].
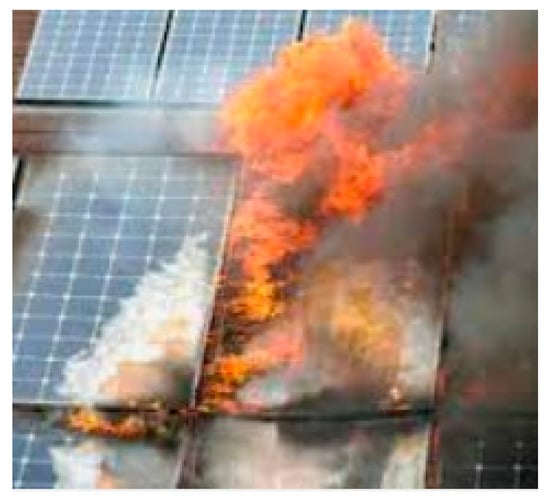
Figure 1.
Fire hazards in a PV system [3,4].
Up to now, various fault detection and diagnosis methods have been developed [6]. These can be classified into two main groups: manual methods, including visual inspection, and automatic or semi-automatic methods, including electrical and image-based approaches [4].
In this study we are very motivated by methods based on infrared (IR) thermography images in order to classify the four major defects that occur on PV modules (such as dust or sand accumulated on the PV modules’ surface, damaged bypass diodes, shunted PV modules, and the partial shading effect). These defects exhibit various hot spot profiles, so the question is how to classify these defects based on IR thermography images for real-world application.
Recently, many researchers have been attracted by the application of artificial intelligence (AI) techniques, including machine learning (ML) and deep learning (DL) methods, to diagnosis IR thermography (IRT) images of PV modules [7]. For example, in [8], with the help of aerial images collected from unmanned aerial vehicles and deep CNNs, a model for fault detection in PV modules was developed. The examined defects were delamination, burn marks, glass breakage, discoloration, and snail trails. The accuracy of the model was 95.40%. Similar work was completed in [9], in which the author developed a mask region-based convolutional neural network architecture. The proposed model is able to detect defects in a large-scale PV plant.
In [10], the authors developed a method for the fault detection of a PV module with the help of unmanned aerial vehicles (UAR) and edge computing. They showed that the experimental results are practical and effective. Another work [11] developed a CNN for the fault detection anomaly in a PV module, which then classified the possible faults based on the IRT image patterns (diodes, shadowing, hot spots, cracking, and soiling). The accuracy for fault detection was 92.5% for the detection and 78.85% for the classification of the selected defects. A region-based CNN was developed to detect anomalies within the PV modules [12]. In terms of the classification rate, the accuracy of the developed model was 95%.
In [13], the authors combined a CNN with a support vector machine to classify the IRT images of PV modules. In addition, the authors used both the image histogram information and its corresponding CDF (cumulative distribution function). The obtained classification accuracy was 97%. The CNN and a fine-tuned model based on VGG-16 were examined to address the issue of defective PV modules using IRT images [14]. Five types of defects were evaluated and tested: short circuits, diode faults, covered PV modules, shadowing, and dust accumulated. The accuracy achieved by VGG-16 for fault detection was more than 99%. In [15], the authors examined two types of faults: hot spot and hot substring. The total accuracy obtained during the validation model was 98%.
A hybrid fault detection scheme was proposed in [16]; in this work and for time, the temperature data were introduced in the training step to detect malfunctioning in PV modules. The developed mode is also able to classify three kinds of defects: potential induced degradation, open circuit, and hot spots with an accuracy of 98.6%. To handle a large amount of IRT images of PV modules, a method based on semi-automatic and computer vision for the processing of IRT videos and detect anomalies in PV modules, was introduced in [17]. The examined defects are open circuits, short circuits, substring open circuits, substring short circuits, PID, multiple hot cells, single hot cells, warm cells, overheated diodes, and hot spots. The classification accuracy ranged between 84% and 90.91%. In [18], the authors proposed a novel automatic multistage model using YOLOver3 (You Only Look Once version 3) to detect anomalies in aerial images (IR). The model was validated in two large PV plants with an accuracy of 98% for detecting defective PV modules. The developed model was also able to assess the severity of hot spot areas, and it can also compute the soiling coverage based on visual images. Other related works can be found in [19,20,21,22].
With reference to the above literature, the following points can be highlighted:
- Most of the developed models are validated in one location with specific climatic conditions and a lack of generalizability;
- Various types of cameras are used with a high cost and resolution;
- Very limited works have been made around an embedded fault diagnosis solution for PV modules, which play a very important role in real-world application (e.g., the design of smart embedded devices for defect detection);
- CNN (and its enhanced versions) is the most-used algorithm to classify IR images (detect anomalies in PVs), though its accuracy depends mainly on the dataset quality;
- Proposed models need to be further validated and improved through extensive tests, using IR images collected at different locations.
In this work, our proposed hybrid model is developed to tackle the limitations of the classical approaches in dealing with multi-classification based on IR thermal images and designing an embedded system for online applications. The main contributions of this article are briefly summarized as follows:
- Develop a novel hybrid model (CNN-ML algorithm) for the fault diagnosis of PV modules;
- Embed the developed CNN–ML model inside a microprocessor (MP) for possible real-time application;
- Experimental verification of the developed model at three locations with different climatic conditions (Mediterranean, arid, and semi-arid climates);
- Develop a graphical tool (GUI) to help users analyze and classify defective PV modules.
Such an application contributes to the reduction of human intervention as well as maintenance costs. It should also be pointed out that this kind of embedded solution for PV fault diagnosis has not been explored before. This is the first attempt to embed a hybrid deep leaning model into an MP for the fault diagnosis of PV modules.
The paper is organized as follows: Section 2 deals with the database description, including pre-processing and the preparation of the database. The proposed hybrid model and the suggested embedded solution are given in Section 3. The results and discussion are reported in Section 4, including the simulation results, the experimental results, and a comparative study. The conclusion and perspectives are presented in Section 5.
2. Database Description
2.1. Locations
The dataset was collected from four sites with different climatic conditions and PV module technologies (Si-Mono and Si-Ploy). The locations are (i) Eastern Saudi Arabia, (Madinah), characterized by a semi-arid climate; (ii) southern Algeria (Ouargla), characterized by an arid climate; and (iii) eastern Algeria (Jijel), characterized by a Mediterranean climate (see Figure 2):
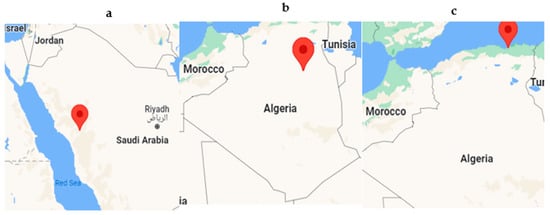
Figure 2.
Locations of the investigated PV systems: (a) Madinah, (b) Ouargla, and (c) Jijel.
Figure 3 shows the investigated PV systems: the first PV array is located on the rooftop of the Islamic University of Madinah, and its capacity is 800 W (see Figure 3a). The second PV string is located in Ouargla (close to the University of Ouargla), and its capacity is 300 W (see Figure 3b). The third PV string is located on the rooftop of the Hall of Technology building (University of Jijel), and its capacity is 2.1 kW (see Figure 3c).
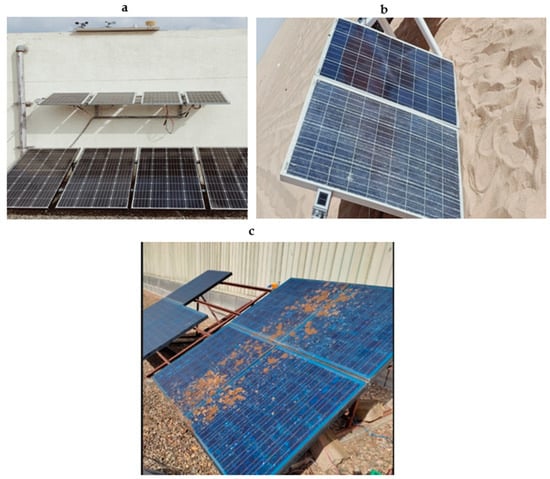
Figure 3.
The examined PV systems: (a) site 1 (b) site 2, and (c) site 3.
2.2. Measurement Conditions
A low-cost thermal camera was used to collect the infrared thermal (IRT) images at the four locations (see Figure 4a). The thermal camera specifications are shown in Appendix A. The measurement conditions provided the framework for the high throughput and informative value of the IR inspections [23]. Figure 4b displays an example of the collected IR thermography images from each location. The database initially consisted of 840 thermography IR images. All IRT images were collected at a solar irradiance > 500 W/m2, and the position of the camera was perpendicular to the PV array.
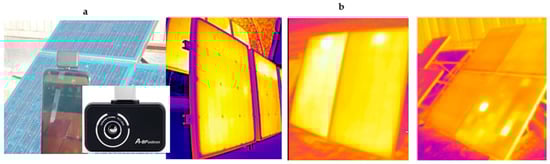
Figure 4.
(a) The IRT camera RX-450 that was used; (b) example of the collected IRT images from the three locations.
2.3. Image Pre-Processing
To remove noise from the collected images, all images were then pre-processed by using a simple median filter. Figure 5 (left) shows the original IR thermography image, and Figure 5 (right) depicts the IR thermography image after passing it through a median filter, i.e., a denoised image). The median filter is a non-linear digital filtering technique, often used to remove noise from an image (2D) or signal (1D). It is a simple and powerful non-linear filter. It is used to reduce the amount of intensity variation between one pixel and another pixel. It replaces the pixel value with the median value.
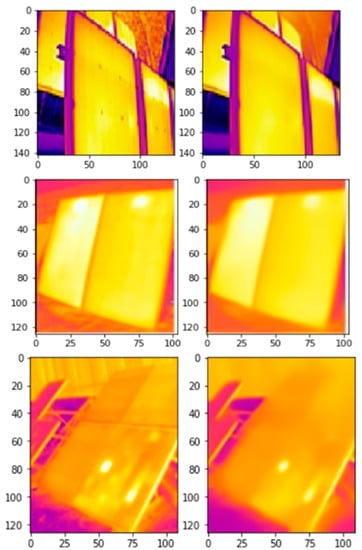
Figure 5.
Noisy IR image (left), denoised IR image using a median filter (right).
Seven common defects are considered in this paper: sand accumulated on PV modules, covered PV modules, cracked PV modules, degradation, dirty PV modules, short-circuited PV modules, and overheated bypass diodes. Figure 6 shows an example of the visual images and the corresponding IRT images (see Figure 7).
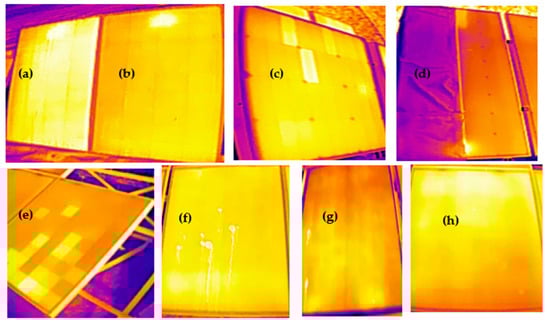
Figure 6.
Examples of normal and detective PV modules (IR images): (a) cracked PV module, (b) normal module, (c) short-circuited PV module, (d) covered PV module, (e) degradation, (f) dirty PV module, (g) sand accumulated on a PV module, and (h) overheated bypass diode.
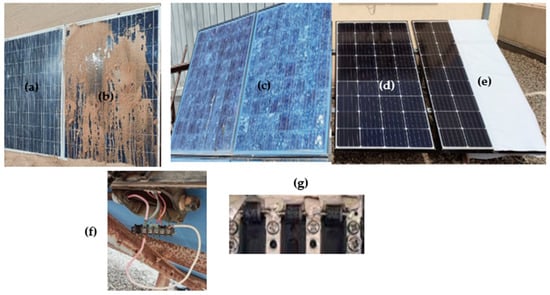
Figure 7.
Example of normal and defective (visible images): (a) cracked PV module, (b) sand accumulated on a PV module, (c) dirty PV module (or dust deposit) (d) clean PV module, (e) covered PV module, (f) short-circuited PV module, and (g) overheated bypass diode.
2.4. Data Augmentation
Data augmentation is crucial for many applications of artificial intelligence, as accuracy increases with the amount of training data. The size of the database increases by adding new data. In our case, more IR images are added to our database. The following techniques are used to augment the database:
- Image shifts via the width_shift_range and height_shift_range arguments;
- Image flips via the horizontal_flip and vertical_flip arguments;
- Image rotations via the rotation_range argument;
- Image brightness via the brightness_range argument;
- Image zoom via the zoom_range argument.
After the application of the data augmentation technique, the dataset expanded from a total of 840 images to 7548 IRT images. Table 1 summarizes the amount of IRT images for each class before and after augmentation.

Table 1.
The amount of IR images for the eight examined classes before and after augmentation.
Figure 8 shows an example of the augmented IRT images with the labeled classes.
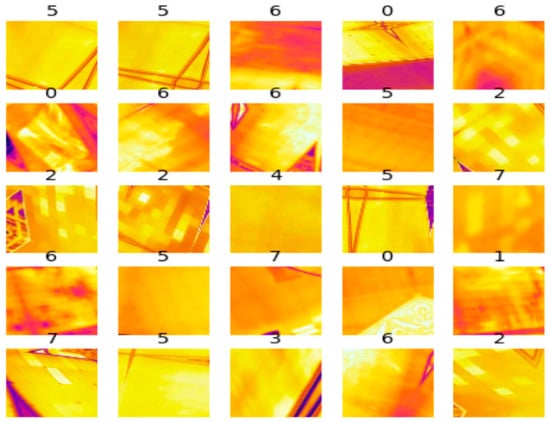
Figure 8.
IR images with labeled classes: D1 = class 0, D2 = class 1, D3 = class 2, D4 = class 3, N = class 4, D5 = class 5, D6 = class 6 and D7 = class 7.
The examined defects are labeled as follows: covered PV module (D1), cracked PV module (D2), degradation (D3), overheated bypass diode (D4), dusty or dirty PV module (D5), healthy PV module (N), sand accumulated on PV module’s surface (D6), and short-circuited PV module (D7). All of these defects create an overheating problem (the hot spot phenomena) with different temperature profiles, and, if this persists for a long time without detection, it can lead to a risk of fire, so we have to prevent our PV plants from such an issue.
3. Methodology
3.1. Proposed Hybrid Model
Many image processing tools and software based on ML and DL have been designed and have shown their capability to detect and classify defective PV modules based on IR images [24]. A combination of global, conventional fault diagnosis approaches termed as hybrid approaches can be time-saving and cost-effective, with more of an impact on diagnosis of PV modules.
Figure 9 depicts the workflow of the developed hybrid structure. It combines a CNN and an ML algorithm. There are various kinds of ML algorithms [7], such as K-nearest neighbor (K-NN), support vector machine (SVM), multilayer perceptron (MLP), decision tree (DT), and other ensemble learning algorithms such as random forest (RF) and boosting and bagging algorithms. In this work, we selected the SVM algorithm from among other mentioned algorithms due to its capability in solving classification problems, effectiveness in high-dimensional spaces, and simplicity in terms of implementation into edge device [24]. A SVM is able to minimize generalization errors that can occur while working with a multi-dimensional dataset.
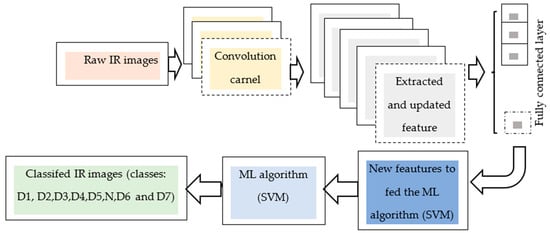
Figure 9.
The hybrid model (CNN–ML) workflow used for the fault diagnosis of PV modules using IR thermography images.
The hybrid model combines two algorithms: the first one is a CNN, which aims to extract the main features from IR images to feed the second algorithm (SVM). CNN can efficiently extract the deep defect features from images with high fault tolerance, self-learning capability, and adaptability [22]. It basically comprises various layers: convolution filters, max-pooling, dropout, and flattened, while the main task of the second one (SVM) is to classify the defective PV modules based on the extracted essential features. The output of the models is the eight classes: D1, D2, D3, D4, D5, D6, D7, and N.
From the database, the first part (80%) is used to train the hybrid model, while the other part (20%) is used to test the model. The code is developed under Google Colab, which is an open platform developed by Google and especially appropriate for ML, data analysis, and education [25].
3.2. Embedded Hybrid Model
A low-cost Raspberry Pi 4 was chosen to implement the hybrid model. Once the CNN–ML model was trained and validated, the next important step was to integrate it into a microprocessor for real-time applicability. The basic flowchart of the developed process is shown in Figure 10. The main part of this flowchart is the embedded CNN–ML program on the edge device.
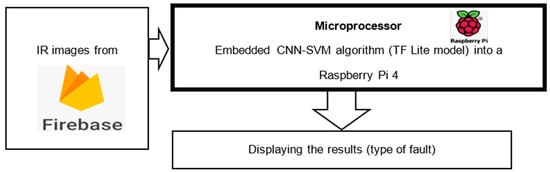
Figure 10.
The embedded optimized TF Lite model into a microprocessor for the fault diagnosis of PV modules.
3.3. Validation Metrics
The developed hybrid model is evaluated on the test set by means of accuracy, precision, recall, and F1-score and is calculated as follows:
where TP is the number of true positives, TN is the number of true negatives, FP is the number of false positives, FN is the number of false negatives.
The receiver operating characteristic (ROC) curve is also used to evaluate the model’s performance. It is defined as a plot of test sensitivity as the y coordinate versus its 1-specificity or false positive rate (FPR) as the x coordinate and is an effective method of evaluating the performance of diagnostic tests. The area under the ROC is denoted AUC, and this is a model that is consistently able to obtain an AUC of 1, though the model that only predicts the negative class would obtain an AUC of 0. The TPR and the FPR (false positive rate) are calculated based on the following expressions:
4. Results and Discussion
4.1. Test Performance
The performance of the proposed model was evaluated through classification accuracy, the ROC curve, and the confusion matrix. The developed model consists of three convolution layers, one average pooling layer, two carpooling layers, one drop layer, one flattened layer, four dense layers, and the SVM. The number of trained parameters is 109,816.
The training and validation accuracies of the developed CNN–ML model are shown in Figure 11a; it can be seen that both curves are very correlated, and the accuracy is close to 0.95. The training and validation loss functions (see Figure 11b) are also well-correlated for both curves (test and training), and the training loss is less than 0.9. The training process takes about two hours with 100 iterations.
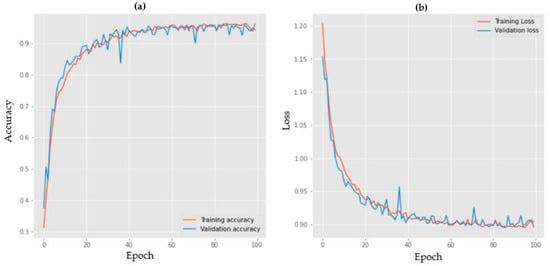
Figure 11.
(a) Training and validation accuracy and (b) training and validation loss.
From the confusion matrix shown in Figure 12, the most examined defects, including the normal case, are classified with a good precision except for the cases of sand accumulated on a PV module (class D6) and a short-circuited PV module (class D7). In this case, the defect D6 was misclassified as a degradation defect (D3) or a short-circuit defect (D7) with a low precision. This can be explained by a good similarity between the three defects, D6, D3, and D7 (similar in terms of temperature profile variation).
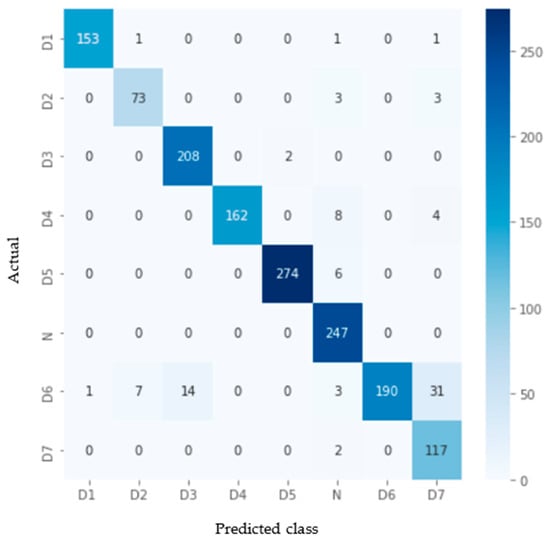
Figure 12.
Confusion matrix of the developed CNN–ML.
The receiver operating characteristic (ROC) curve is depicted in Figure 13, and it can be seen that the seven classes are very close to 1, except for class D6 = 0.97. These results confirm the ability of the developed hybrid model to classify the most-investigated faults correctly.
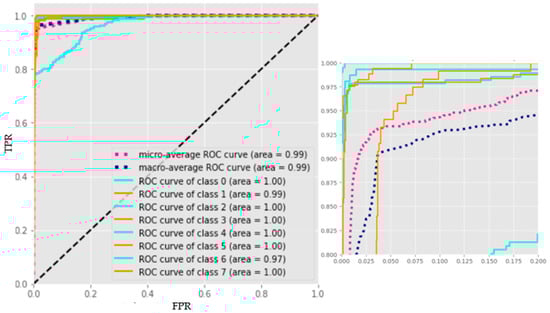
Figure 13.
CNN–ML: the ROC function of the developed classifier (left) and zoomed graph (right).
Table 2 shows the calculated precision, recall, F1-score, and accuracy of the developed hybrid model. Table 2 shows that the calculated accuracy is 94%. Overall, in terms of accuracy and precision, the results are quite acceptable. However, in terms of F1-score, it can be clearly seen that defects D6 and D7 present lower results (87% and 85%, respectively) compared to other defects.
Table 2.
Error metrics: precision, recall, F1-score, and accuracy for the classification (CNN–ML).
To check the effectiveness of the developed hybrid model, we compare the results with a simple CNN. The SVM is replaced with four dense layers, and the end layer contains a SoftMax function to classify the defects. The confusion matrix of the CNN is shown in Figure 14. The six classes (D1, D3, D4, D5, N, and D6) are classified with an acceptable F1-score (see Table 3), while the other two classes (D2 and D7) are the worst-classified classes with an F1-score of 74% and 76%, respectively. The accuracy of the DNN model is 88%. The number of trained parameters is 23,640.
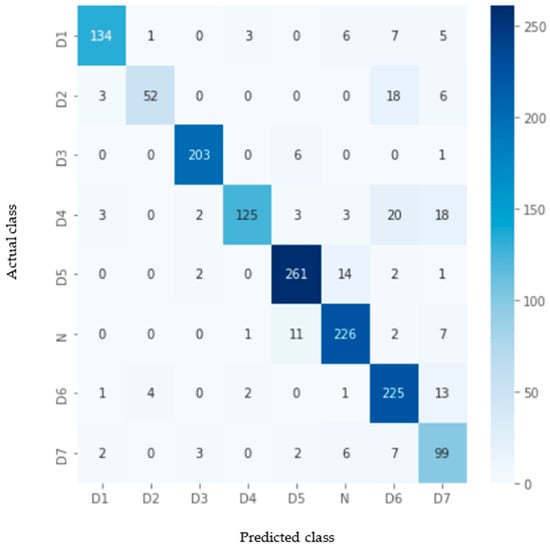
Figure 14.
Confusion matrix of the CNN model.
Table 3.
Error metrics: precision, recall, F1-score, and accuracy for the classification (CNN).
The receiver operating characteristic (ROC) curve is depicted in Figure 15. It can be observed (the red color in the zoomed-in part of Figure 15) that the lower value is 96%. In terms of accuracy, the developed hybrid model (CNN–ML) outperforms the CNN model. However, the CNN model requires less computing time compared to the developed CNN–ML.
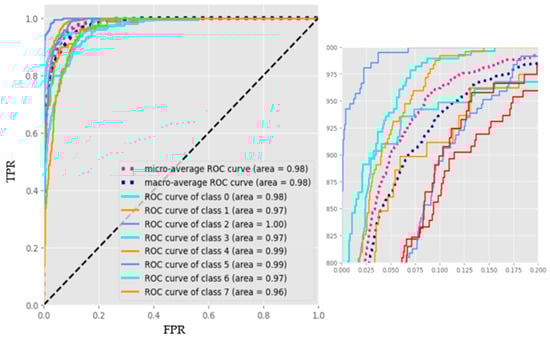
Figure 15.
CNN model: the ROC function of the developed classifier (left) and the zoomed-in graph (right).
To check the importation of the data augmentation, we trained the models with only original IR images. We used a dataset of 840 IR images, and we kept the same architecture and parameters for both models (CNN–ML and CNN). The accuracy of both models, CNN–ML and CNN, decreased by 7% and 20%, respectively. However, the computing time significantly decreased (about 15 min). The results are depicted in Figure 16.
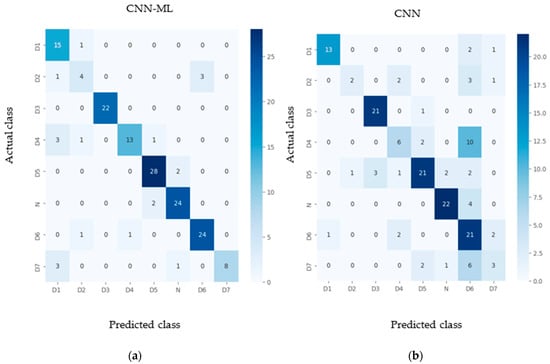
Figure 16.
Confusion matrices: (a) CNN–ML model (accuracy = 87.3%) and (b) CNN model (accuracy = 67.7%).
To verify the importance of pre-processing the dataset, we used the original database without pre-processing, and we used the same configuration for both models. The results also decreased by around 7% for both models.
4.2. Graphical Tool Presentation (GUI)
To help users who are not familiar with the Python programming language, an easy graphical guide (GUI) interface was developed (see Figure 17), in which we have integrated the developed model with two options regarding the notification of users about an anomaly: (1) by SMS (2) or by email. Thus, to test the developed GUI, five different IRT images from the database were uploaded and tested. The results are shown in Figure 18; it can be seen that the model can correctly classify the five examined IR images (a covered PV module, a dirty PV module, degradation of a PV module, a short-circuited PV module, and a healthy PV module).
Figure 17.
Main page of the developed GUI.
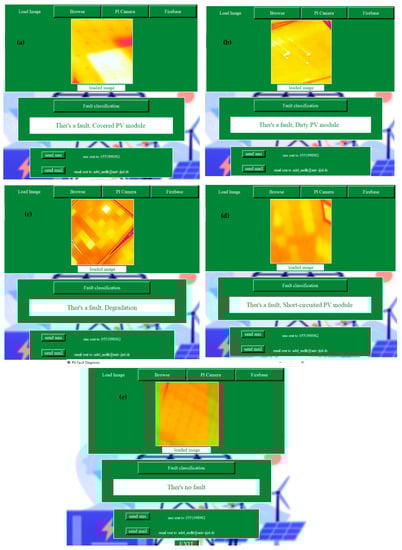
Figure 18.
Experimental verification of the designed GUI: (a) covered PV module, (b) dirty PV module, (c) degradation of PV module, (d) short-circuited PV module, and (e) healthy PV module.
To validate the efficacy of the developed model (CNN–ML), we tried to upload some newly collected IR images, which were not seen before by the model (i.e., not from the database that was used). Figure 19 shows an example of the newly uploaded IR images to the software. Among the 100 IR images, about 89% were correctly classified. This result depends on many factors: (i) the quality of the collected IR images, (ii) the measurement process, and (iii) the database used to train the model, which should cover different PV module technologies in different regions and under different climatic conditions.
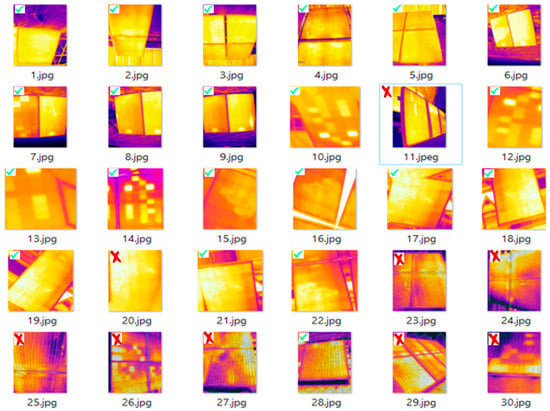
Figure 19.
Example of the newly tested IR images.
4.3. Experimental Verification
The experimental part aims to implement the optimized CNN–ML model (TF Lite model) on a microprocessor device to confirm the performance of the classifier. The model has been optimized and transferred into the tflite format using the TF Lite converter. TF Lite is a framework for deploying ML on embedded systems and mobiles [26].
One of the most popular model optimization techniques is quantization, which transforms a deep learning program into an approximated representation with lower-precision operations. To evaluate the TF Lite model, a validation test portion (20% from the dataset) has been used. As can be seen from Table 4, the size of the TensorFlow Lite model is reduced from 1345 KB to 434 KB, while the accuracy is slightly decreased (92.8%).
Table 4.
Results of the optimized CNN–ML model using TF Lite optimizer.
With reference to the edge device specifications reported in Table 5, the developed model can easily fit the selected device.
Table 5.
Microprocessor specifications.
Figure 20 shows the experimental results with the Raspberry Pi 4 that was used. In this experiment, we have tested the capability of the integrated model to classify this type of fault (dust or dirt accumulated on a PV module surface). The model can correctly classify this fault and displays the results on an LCD display (see Figure 20d).
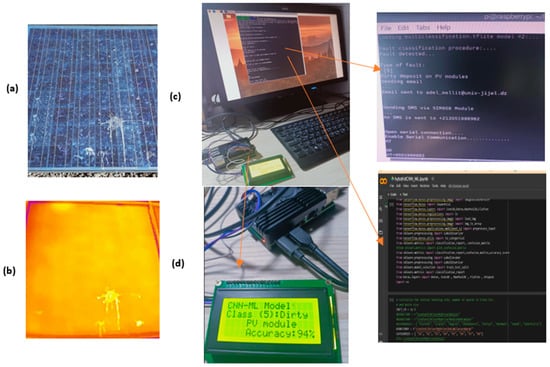
Figure 20.
Experimental tests: (a) faulty PV modules, (b) the corresponding IR image, (c) embedded program into Raspberry Pi 4, and (d) displayed results: case of dust or dirt accumulated on PV module.
In this application, we have shown the possibility of embedding a PV fault diagnosis model into a Raspberry Pi 4. At this stage, the program is ready to be deployed for real-time application by using IRT images collected from the cloud.
4.4. Comparative Study
To check the effectiveness of the developed hybrid model, we compared it with two additional ML learning algorithms: (i) decision tree (DT) and (ii) random forest (RF). The results are reported in Table 6. In terms of accuracy, the CNN–SVM outperforms CNN as well as the two hybrid models (CNN–DT and CNN–RF). As can be seen, there is not a big difference, in terms of accuracy, between CNN–SVM (94%) and CNN–RF (92.25%). Moreover, CNN and CNN–kNN are very close in terms of accuracy, 88.14% and 89.25%, respectively. However, in terms of computing time, hybrid models require much more than the CNN-based model.
Table 6.
Accuracy and computing time of the compared classifiers (CNN, CNN–RF, CNN–DT, and CNN–SVM).
Table 7 summarizes the comparison between our hybrid model with other published works. We compare the examined defects, the size of the dataset that was used, type of model (the DL or ML algorithm that was used), system level or capacity, detection of classification, experimental verification, tools, and accuracy. With reference to Table 5, the following points can be highlighted:
Table 7.
Comparison with other published methods based on CNN and IRT images for fault classification.
- CNN is the most-used algorithm to detect or classify defects in PV modules based on IR images;
- No tools have been developed by integrating the model, which could help users, while our developed GUI can help users to diagnosis their PV array easily;
- Most published works are verified by simulation, without any experimental verification, so our experimental test can be considered as the first attempt to implement a hybrid model into a microprocessor for real-time application;
- The classification accuracy ranges from 78% to 95%, but, in our study, the accuracy was 94%.
5. Conclusions and Perspectives
An embedded solution for the fault diagnosis of PV modules based on IR thermography images is proposed. The idea consists of embedding the optimized CNN–ML model into a microprocessor (e.g., a Raspberry Pi 4) for online applicability. The simulation results showed an acceptable classification accuracy of 94%. The experimental verification indicated the capability of such an embedded solution to diagnosis PV modules and correctly classify the examined fault, as shown in the developed GUI.
It should be pointed out that the accuracy of the embedded TF Lite model was slightly decreased, but the size of the model was significantly reduced, from 1345 KB to 434 KB. The proposed embedded system, including the developed GUI, helps to assist O&M operations and can also reduce costs and human intervention.
Although the MP used has good memory capacity and clock speed, but its main limits are cost and power. Thus, looking for a low-cost and low-power edge device will be planned in our future wok. In addition, and in order to improve the classification rate of the embedded model, the size of the database should be increased and more efforts should be taken regarding the classification algorithms.
Author Contributions
Conceptualization, M.B. and A.M.; methodology, M.B.; software, A.M.; validation, M.B. and A.M.; formal analysis, M.B.; investigation, A.M. and C.M.; resources, M.B.; data curation, M.B. and C.M.; writing—original draft preparation, A.M.; writing—review and editing, M.B.; visualization, M.B.; supervision, A.M.; funding acquisition, M.B. All authors have read and agreed to the published version of the manuscript.
Funding
This research was funded by the Deanship of Scientific Research at the Islamic University of Madinah through the support provided to the Post-Publishing Program.
Institutional Review Board Statement
Not applicable.
Informed Consent Statement
Not applicable.
Data Availability Statement
Not applicable.
Acknowledgments
The authors wish to extend their sincere gratitude to the Deanship of Scientific Research at the Islamic University of Madinah for the support provided to the Post-Publishing Program.
Conflicts of Interest
The authors declare no conflict of interest.
Appendix A. RX-450 Main Specifications
| Resolution | 256 × 192 |
| NETD | ≤50 mK@25 °C |
| Working band | 8–14 um |
| Frame rate | 25 Hz |
| Operating temperature range | −10–55 °C |
| Temperature measurement range | −20–550 °C |
References
- Snapshot of Global PV Markets. Report IEA-PVPS T1-42:2022. April 2022. Available online: https://iea-pvps.org/snapshot-reports/snapshot-2022/ (accessed on 25 April 2022).
- Mellit, A.; Kalogirou, S. Artificial intelligence and internet of things to improve efficacy of diagnosis and remote sensing of solar photovoltaic systems: Challenges, recommendations and future directions. Renew. Sustain. Energy Rev. 2021, 143, 110889. [Google Scholar] [CrossRef]
- Manzini, G.; Gramazio, P.; Guastella, S.; Liciotti, C.; Baffoni, G.L. The fire risk in photovoltaic Installations-Test protocols for fire behavior of PV modules. Energy Procedia 2015, 82, 752–758. [Google Scholar] [CrossRef]
- Mellit, A.; Tina, G.M.; Kalogirou, S.A. Fault detection and diagnosis methods for photovoltaic systems: A review. Renew. Sustain. Energy Rev. 2018, 91, 1–17. [Google Scholar] [CrossRef]
- Aram, M.; Zhang, X.; Qi, D.; Ko, Y. A state-of-the-art review of fire safety of photovoltaic systems in buildings. J. Clean. Prod. 2021, 308, 127239. [Google Scholar] [CrossRef]
- Li, B.; Delpha, C.; Diallo, D.; Migan-Dubois, A. Application of Artificial Neural Networks to photovoltaic fault detection and diagnosis: A review. Renew. Sustain. Energy Rev. 2021, 138, 110512. [Google Scholar] [CrossRef]
- Mellit, A.; Kalogirou, S.A. Machine Learning and Deep Learning for Photovoltaic Applications. In Artificial Intelligence for Smart Photovoltaic Technologies; AIP Publishing LLC.: New York, NY, USA, 2022; p. 1. [Google Scholar]
- Venkatesh, S.N.; Sugumaran, V. Fault Detection in aerial images of photovoltaic modules based on Deep learning. In IOP Conference Series: Materials Science and Engineering; IOP Publishing: Bristol, UK, 2021; Volume 1012, p. 012030. [Google Scholar]
- Pierdicca, R.; Paolanti, M.; Felicetti, A.; Piccinini, F.; Zingaretti, P. Automatic faults detection of photovoltaic farms: solAIr, a deep learning-based system for thermal images. Energies 2020, 13, 6496. [Google Scholar] [CrossRef]
- Li, X.; Li, W.; Yang, Q.; Yan, W.; Zomaya, A.Y. Edge-computing-enabled unmanned module defect detection and diagnosis system for large-scale photovoltaic plants. IEEE Internet Things J. 2020, 7, 9651–9663. [Google Scholar] [CrossRef]
- Alves, R.H.; de Deus Junior, G.A.; Marra, E.G.; Lemos, R.P. Automatic fault classification in photovoltaic modules using Convolutional Neural Networks. Renew. Energy 2021, 1, 502–516. [Google Scholar] [CrossRef]
- Vlaminck, M.; Heidbuchel, R.; Philips, W.; Luong, H. Region-based CNN for anomaly detection in PV power plants using aerial imagery. Sensors 2022, 7, 1244. [Google Scholar] [CrossRef] [PubMed]
- Kim, B.; Serfa Juan, R.O.; Lee, D.E.; Chen, Z. Importance of image enhancement and CDF for fault assessment of photovoltaic module using IR thermal image. Appl. Sci. 2021, 9, 8388. [Google Scholar] [CrossRef]
- Kellil, N.; Aissat, A.; Mellit, A. Fault diagnosis of photovoltaic modules using deep neural networks and infrared images under Algerian climatic conditions. Energy 2023, 15, 125902. [Google Scholar] [CrossRef]
- Haidari, P.; Hajiahmad, A.; Jafari, A.; Nasiri, A. Deep learning-based model for fault classification in solar modules using infrared images. Sustain. Energy Technol. Assess. 2022, 1, 102110. [Google Scholar] [CrossRef]
- Hwang, H.P.; Ku, C.C.; Chan, J.C. Detection of malfunctioning photovoltaic modules based on machine learning algorithms. IEEE Access 2021, 2, 37210–37219. [Google Scholar] [CrossRef]
- Bommes, L.; Pickel, T.; Buerhop-Lutz, C.; Hauch, J.; Brabec, C.; Peters, I.M. Computer vision tool for detection, mapping, and fault classification of photovoltaics modules in aerial IR videos. Prog. Photovolt. Res. Appl. 2021, 29, 1236–1251. [Google Scholar] [CrossRef]
- Di Tommaso, A.; Betti, A.; Fontanelli, G.; Michelozzi, B. A Multi-Stage model based on YOLOv3 for defect detection in PV panels based on IR and Visible Imaging by Unmanned Aerial Vehicle. Renew. Energy 2022, 1, 941–962. [Google Scholar] [CrossRef]
- Tsanakas, J.A.; Ha, L.; Buerhop, C. Faults and infrared thermographic diagnosis in operating c-Si photovoltaic modules: A review of research and future challenges. Renew. Sustain. Energy Rev. 2016, 1, 695–709. [Google Scholar] [CrossRef]
- Wang, M.H.; Lin, Z.H.; Lu, S.D. A fault detection method based on CNN and symmetrized dot pattern for PV modules. Energies 2022, 3, 6449. [Google Scholar] [CrossRef]
- Mellit, A. An embedded solution for fault detection and diagnosis of photovoltaic modules using thermographic images and deep convolutional neural networks. Eng. Appl. Artif. Intell. 2022, 116, 105459. [Google Scholar] [CrossRef]
- Li, X.; Li, W.; Yang, Q.; Yan, W.; Zomaya, A.Y. An unmanned inspection system for multiple defects detection in photovoltaic plants. IEEE J. Photovolt. 2019, 10, 568–576. [Google Scholar] [CrossRef]
- Buerhop, C.; Bommes, L.; Schlipf, J.; Pickel, T.; Fladung, A.; Peters, M. Infrared imaging of photovoltaic modules A review of the state of the art and future challenges facing gigawatt photovoltaic power stations. Prog. Energy 2022. [Google Scholar] [CrossRef]
- Mellit, A.; Kalogirou, S. Handbook of Artificial Intelligence Techniques in Photovoltaic Systems: Modeling, Control, Optimization, Forecasting and Fault Diagnosis, 1st ed.; Elsevier: Amsterdam, The Netherlands, 2022. [Google Scholar]
- Google Colab. Available online: https://colab.research.google.com/ (accessed on 17 December 2022).
- TensorFlow Lite. Available online: https://www.tensorflow.org/lite (accessed on 3 January 2023).
Disclaimer/Publisher’s Note: The statements, opinions and data contained in all publications are solely those of the individual author(s) and contributor(s) and not of MDPI and/or the editor(s). MDPI and/or the editor(s) disclaim responsibility for any injury to people or property resulting from any ideas, methods, instructions or products referred to in the content. |
© 2023 by the authors. Licensee MDPI, Basel, Switzerland. This article is an open access article distributed under the terms and conditions of the Creative Commons Attribution (CC BY) license (https://creativecommons.org/licenses/by/4.0/).