3. Results and Discussion
Thermographic recordings on sports shoes were made during training at five different times: moment zero (before starting the training), moment one at 2 min of training, moment two at 5 min of training, moment three at 15 min of training, and moment four at the end of the volleyball training. These recordings were made to identify the areas that ensure the best ventilation of the foot for comfort in movement.
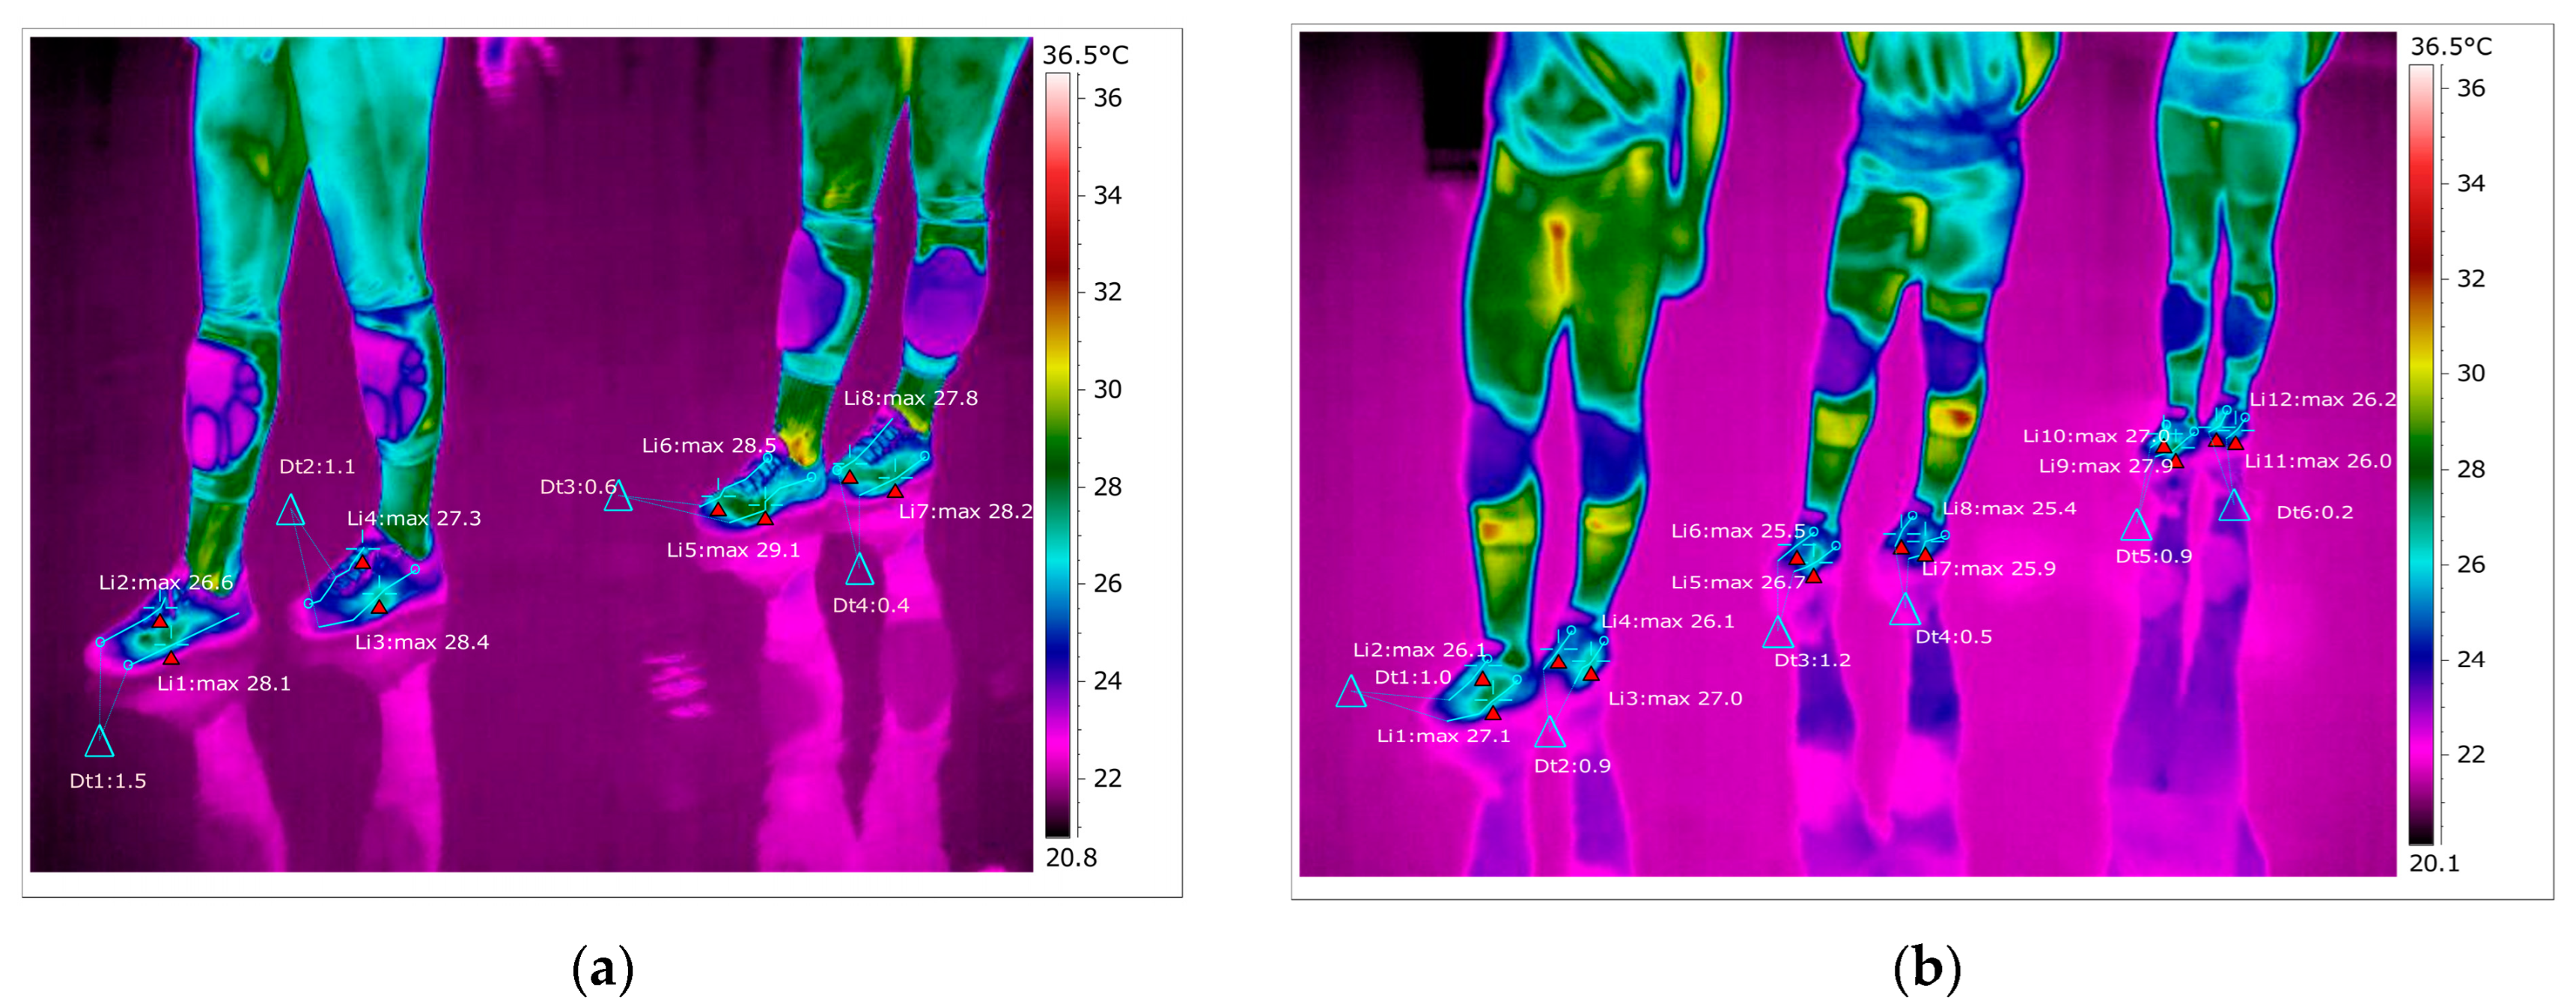
As shown in
Figure 7 for the right foot of subject 1 at time zero (before the start of volleyball training), the maximum temperature along the line Li1, which is positioned on the central part of the foot, is 28.1 °C, and the minimum temperature is 23.8 °C.
The temperature variation along the Li1 line is 4.3 °C, and the emissivity is 0.83, at time zero for subject 1.
On the side along the Li2 line, the maximum temperature is 26.6 °C, and the minimum temperature is 23.1 °C, at time zero for subject 1. The temperature variation along the Li2 line is 3.5 °C, and the emissivity is 0.86 at time zero for subject 1.
For the left foot of subject 1 at time zero, the maximum temperature along the Li3 line positioned on the central side is 28.4 °C, and the minimum temperature is 23.2 °C.
The temperature variation along the Li3 line is 5.2 °C, and the emissivity is 0.81, at time zero for subject 1.
On the side along the Li4 line, the maximum temperature is 27.3 °C, and the minimum temperature is 24.0 °C, at time zero for subject 1.
The temperature variation along the line Li4 is 3.3 °C, and the emissivity is 0.83, at time zero for subject 1.
In
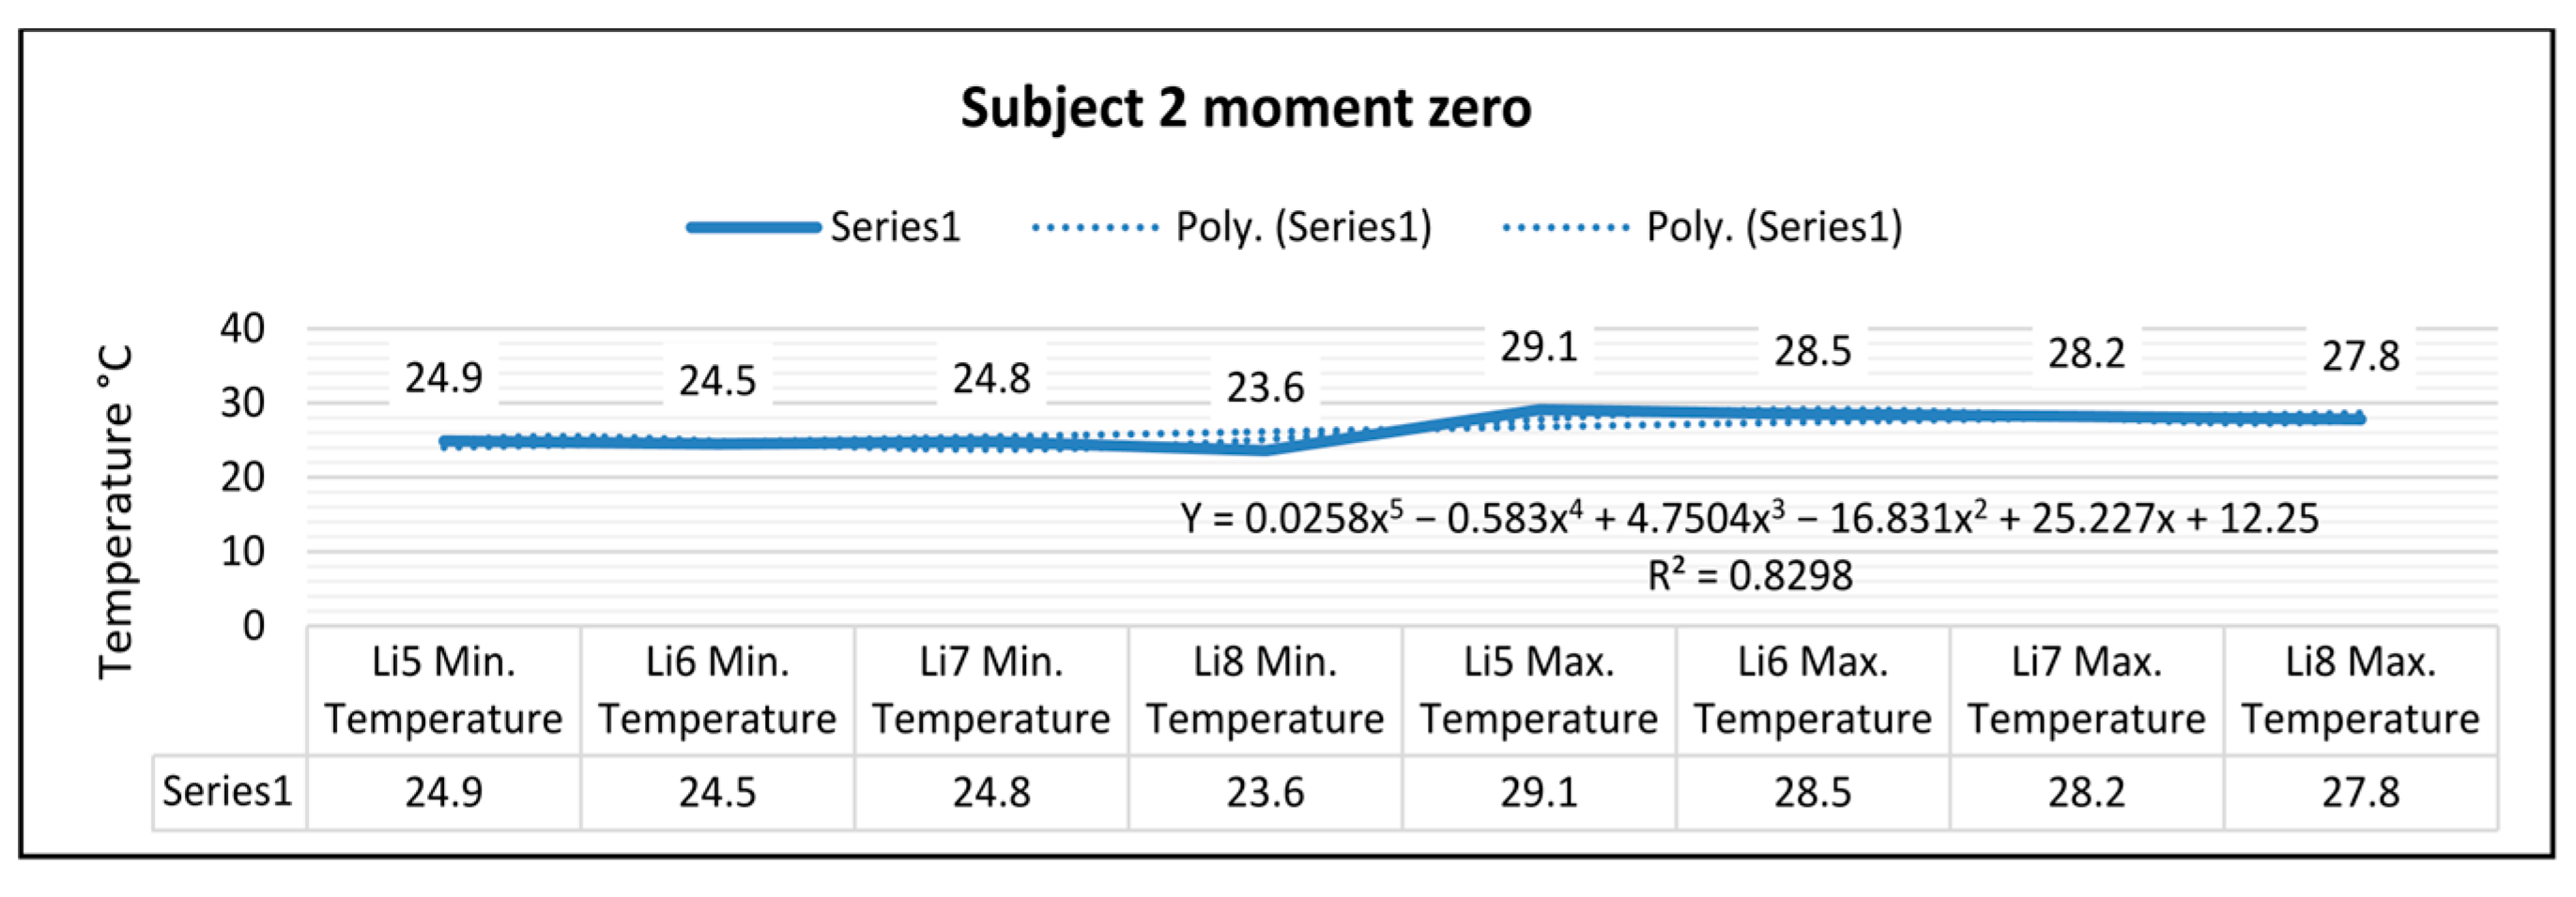
Figure 7, for the right foot of subject 2 at time zero (before starting the volleyball training), the maximum temperature along the line Li5, which is positioned on the central part of the leg, is 29.1 °C, and the minimum temperature is 24.9 °C.
The temperature variation along the Li5 line is 4.2 °C, and the emissivity is 0.83, at time zero for subject 2.
On the side along the Li6 line, the maximum temperature is 28.5 °C, and the minimum temperature is 24.5 °C, at time zero for subject 2.
The temperature variation along the line Li6 is 4.0 °C, and the emissivity is 0.83, at time zero for subject 2.
For the left foot of subject 2 at time zero, the maximum temperature along the Li7 line positioned on the central side is 28.2 °C, and the minimum temperature is 24.8 °C.
The temperature variation along the Li7 line is 3.4 °C, and the emissivity is 0.83, at time zero for subject 2.
On the side along the Li8 line, the maximum temperature is 27.8 °C, and the minimum temperature is 23.6 °C, at time zero for subject 2.
The temperature variation along the line Li8 is 4.2 °C, and the emissivity is 0.83, at time zero for subject 2.
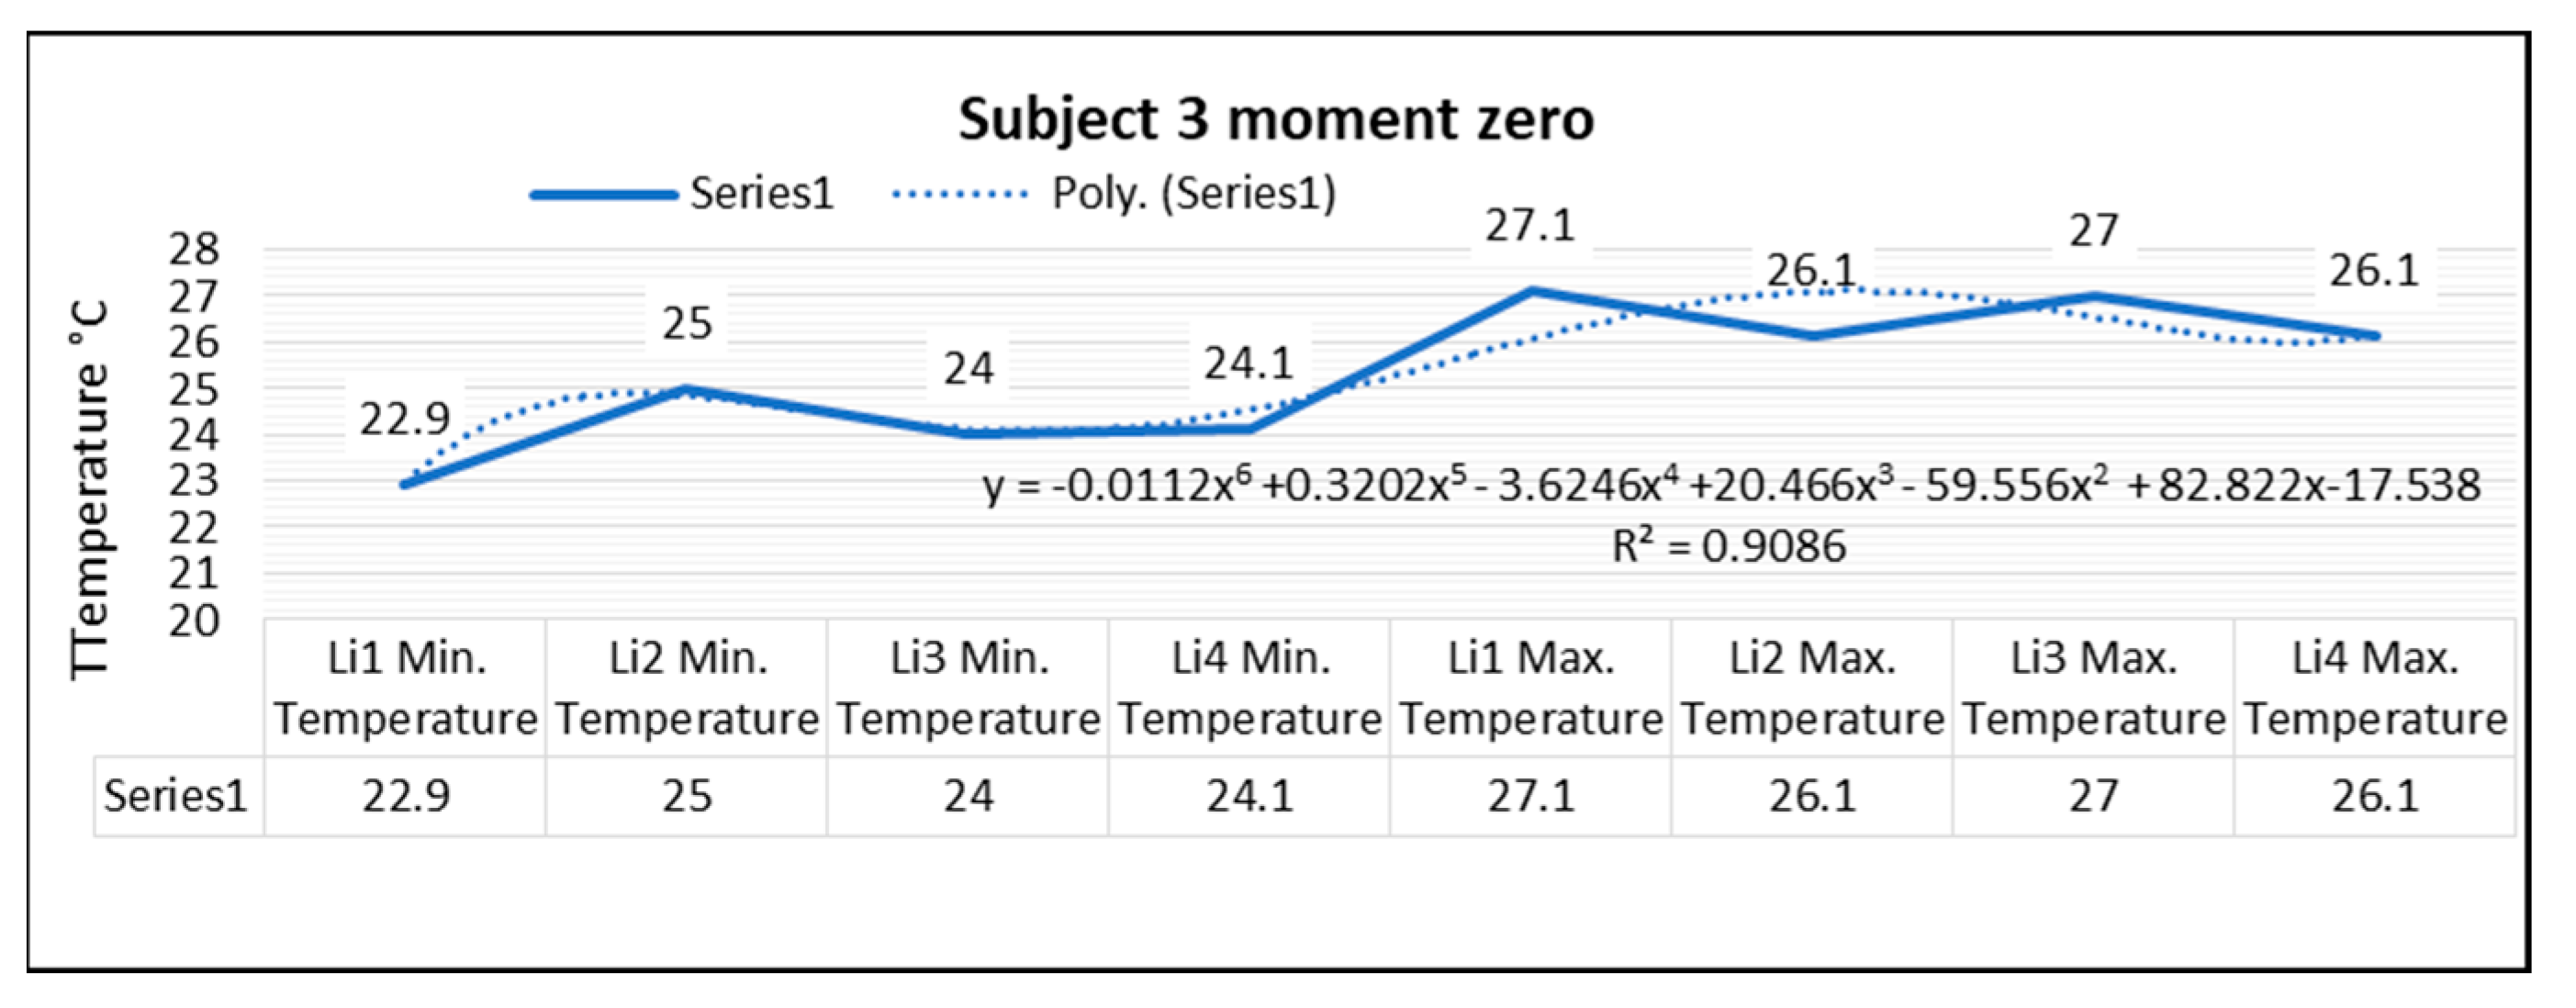
Thermography measurements for subject 3 for the right foot at time zero (before starting the volleyball training) show that the maximum temperature along the Li1 line, which is positioned on the center of the foot, is 27.1 °C, and the minimum temperature is 22.9 °C. The temperature variation along the Li1 line is 4.2 °C, and the emissivity is 0.83, at time zero for subject 3. On the side along the Li2 line, the maximum temperature is 26.1 °C, and the minimum temperature is 25.0 °C, at moment zero for subject 3. The temperature variation along the Li2 line is 1.1 °C, and the emissivity is 0.83, at moment zero for subject 3. For the left foot of subject 3 at time zero, the maximum temperature along the Li3 line positioned on the central side is 27.0 °C, and the minimum temperature is 24.0 °C. The temperature variation along the Li3 line is 3.0 °C, and the emissivity is 0.83, at time zero for subject 3. On the side along the Li4 line, the maximum temperature is 26.1 °C, and the minimum temperature is 24.1 °C, at time zero for subject 3.
The temperature variation along the line Li4 is 2.0 °C, and the emissivity is 0.83, at time zero for subject 3.
In
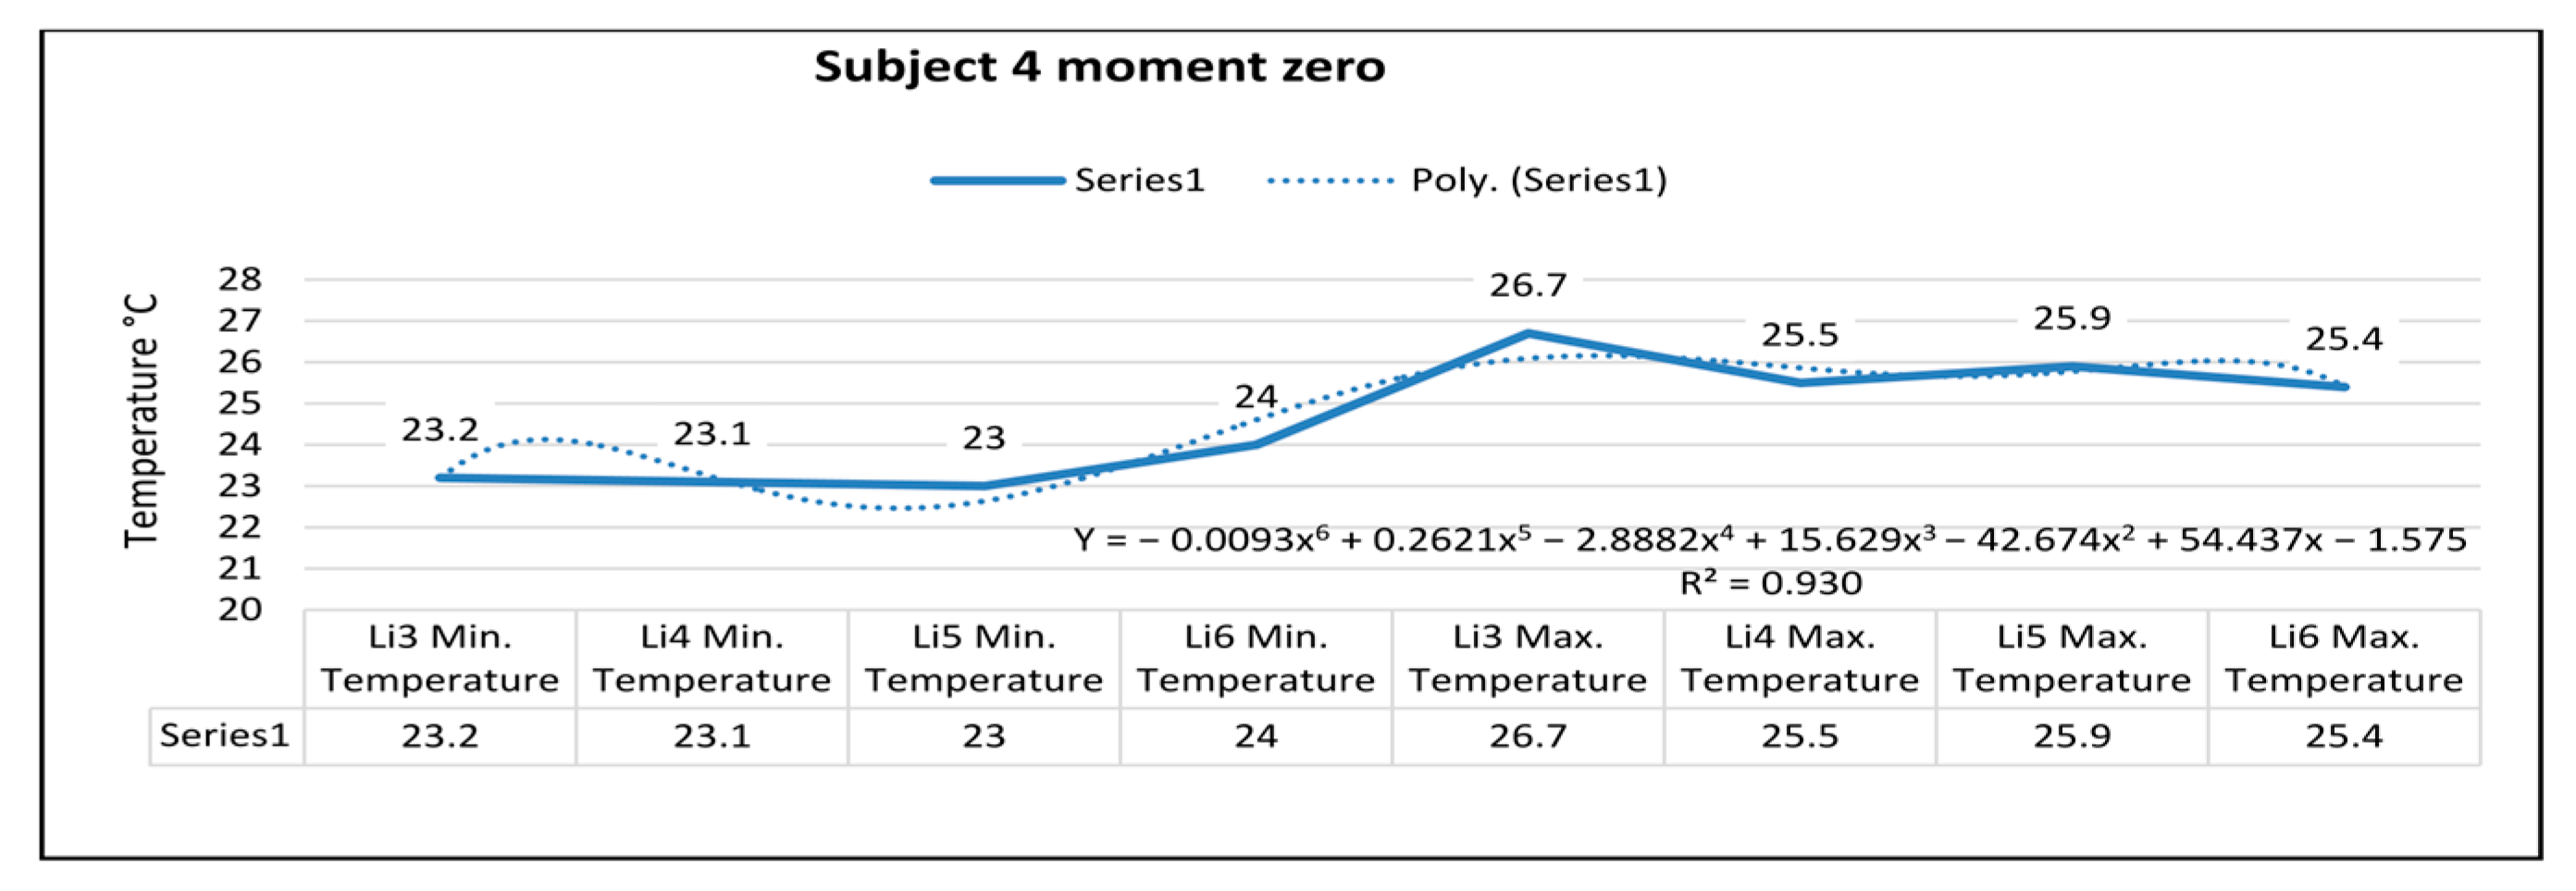
Figure 7, for the right foot of subject 4 at time zero (before starting the volleyball training), the maximum temperature along the Li5 line, which is positioned on the center of the foot, is 26.7 °C, and the minimum temperature is 23.2 °C. The temperature variation along the Li5 line is 3.5 °C, and the emissivity is 0.83, at time zero for subject 4. On the side along the Li6 line, the maximum temperature is 25.5 °C, and the minimum temperature is 23.1 °C, at time zero for subject 4.
The temperature variation along the line is 2.4 °C, and the emissivity is 0.83, at time zero for subject 4.
For the left foot of subject 4 at time zero, the maximum temperature along the Li7 line positioned on the central side is 25.9 °C, and the minimum temperature is 23.0 °C.
The temperature variation along the Li7 line is 2.9 °C, and the emissivity is 0.83, at time zero for subject 4. On the side along the Li8 line, the maximum temperature is 25.4 °C, and the minimum temperature is 24.0 °C, at time zero for subject 4. The temperature variation along the line Li8 is 1.4 °C, and the emissivity is 0.83, at time zero for subject 4.
In
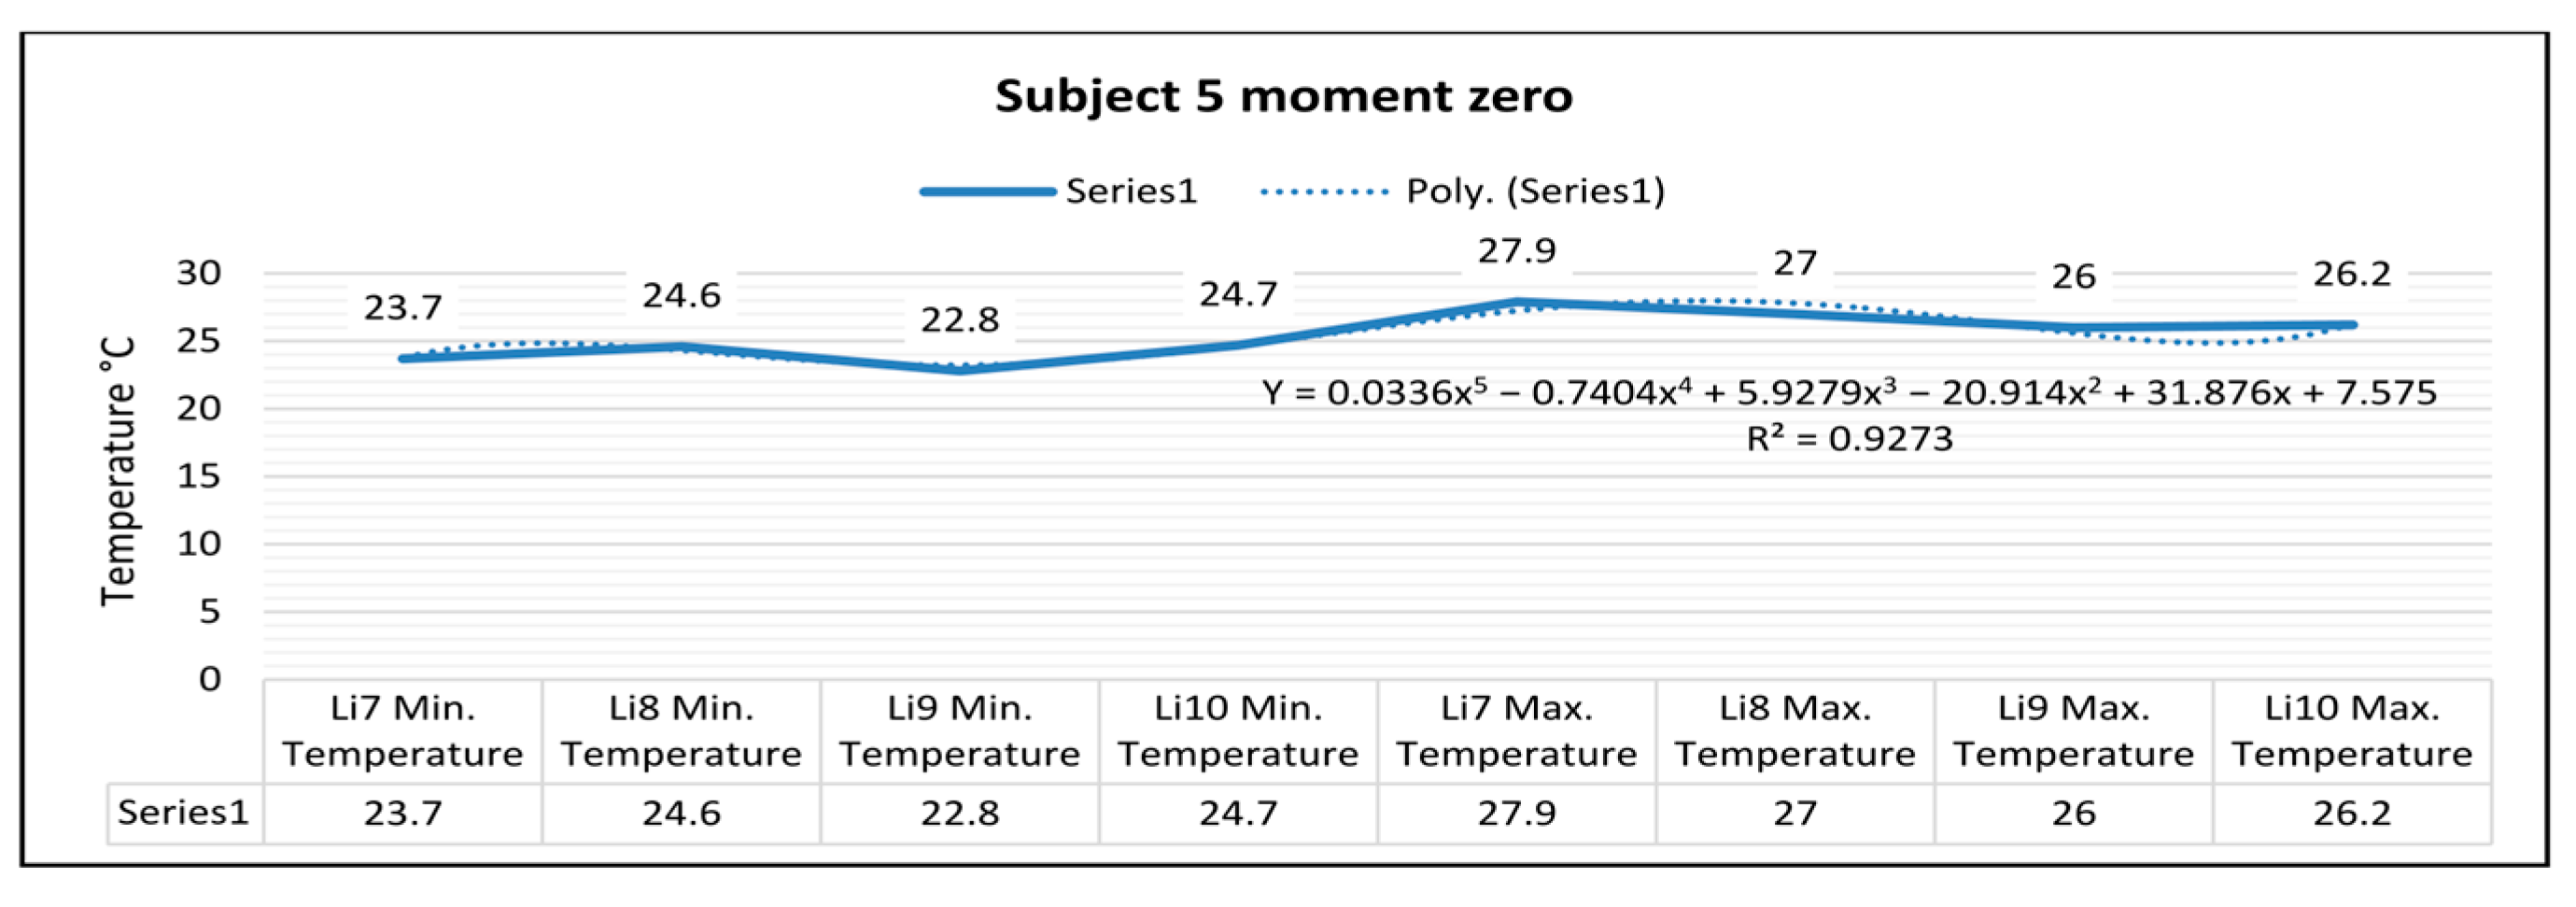
Figure 7, for the right foot of subject 5 at time zero (before starting the volleyball training), the maximum temperature along the line Li9, which is positioned on the center of the foot, is 27.9 °C, and the minimum temperature is 23.7 °C. The temperature variation along the Li9 line is 4.2 °C, and the emissivity is 0.83, at time zero for subject 5. On the side along the Li10 line, the maximum temperature is 27.0 °C, and the minimum temperature is 24.6 °C, at time zero for subject 5. The temperature variation along the line Li10 is 2.4 °C, and the emissivity is 0.83, at time zero for subject 5. For the left foot of subject 5 at time zero, the maximum temperature along the Li11 line positioned on the central side is 26.0 °C, and the minimum temperature is 22.8 °C.
The temperature variation along the Li11 line is 3.2 °C, and the emissivity is 0.83, at time zero for subject 5. On the side along the Li12 line, the maximum temperature is 26.2 °C, and the minimum temperature is 24.7 °C, at zero time for subject 5. The temperature variation along the Li12 line is 1.4 °C, and the emissivity is 0.83, at zero time for subject 5. (
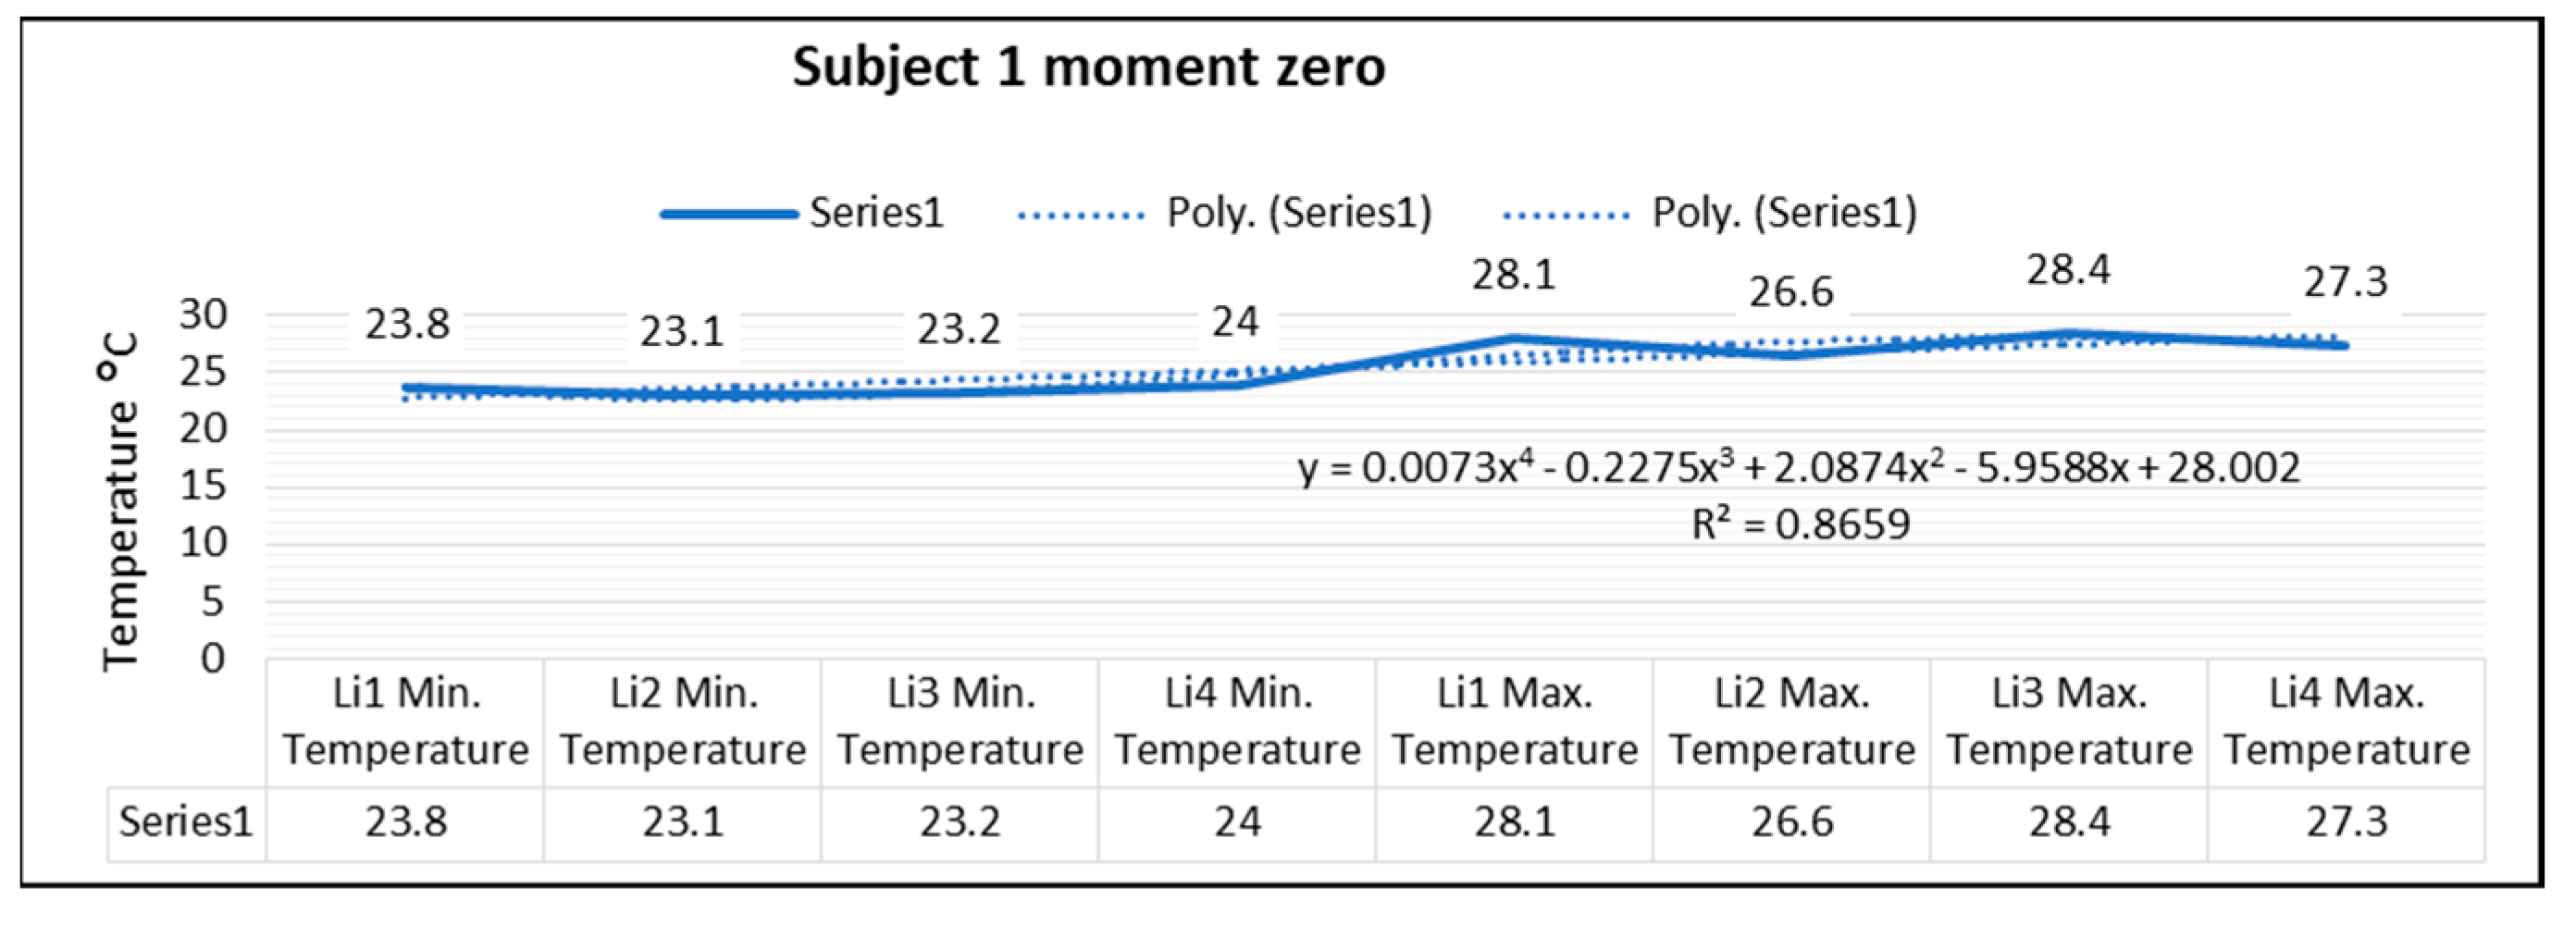
Figure 8) shows the temperature variation along the subject lines on each footwear at time zero.
In the case of subject 1 at time zero, as shown in
Figure 9, the relation obtained is a polynomial function of degree four (5).
The coefficient of determining R
2 established by the regression procedure is:
In the case of subject 2 at time zero as shown in
Figure 10, the relation obtained is a polynomial function of degree five (7).
The coefficient of determining R
2 established by the regression procedure is:
In the case of subject 3 at time zero, as shown in
Figure 11, the relation obtained is a polynomial function of degree six (9).
The coefficient of determining R
2 established by the regression procedure is:
In the case of subject 4 at time zero, as shown in
Figure 12, the relation obtained is a polynomial function of degree six (11).
The coefficient of determining R
2 established by the regression procedure is:
In the case of subject 5 at time zero, as shown in
Figure 13, the relation obtained is a polynomial function of degree five (13).
The coefficient of determining R
2 established by the regression procedure is:
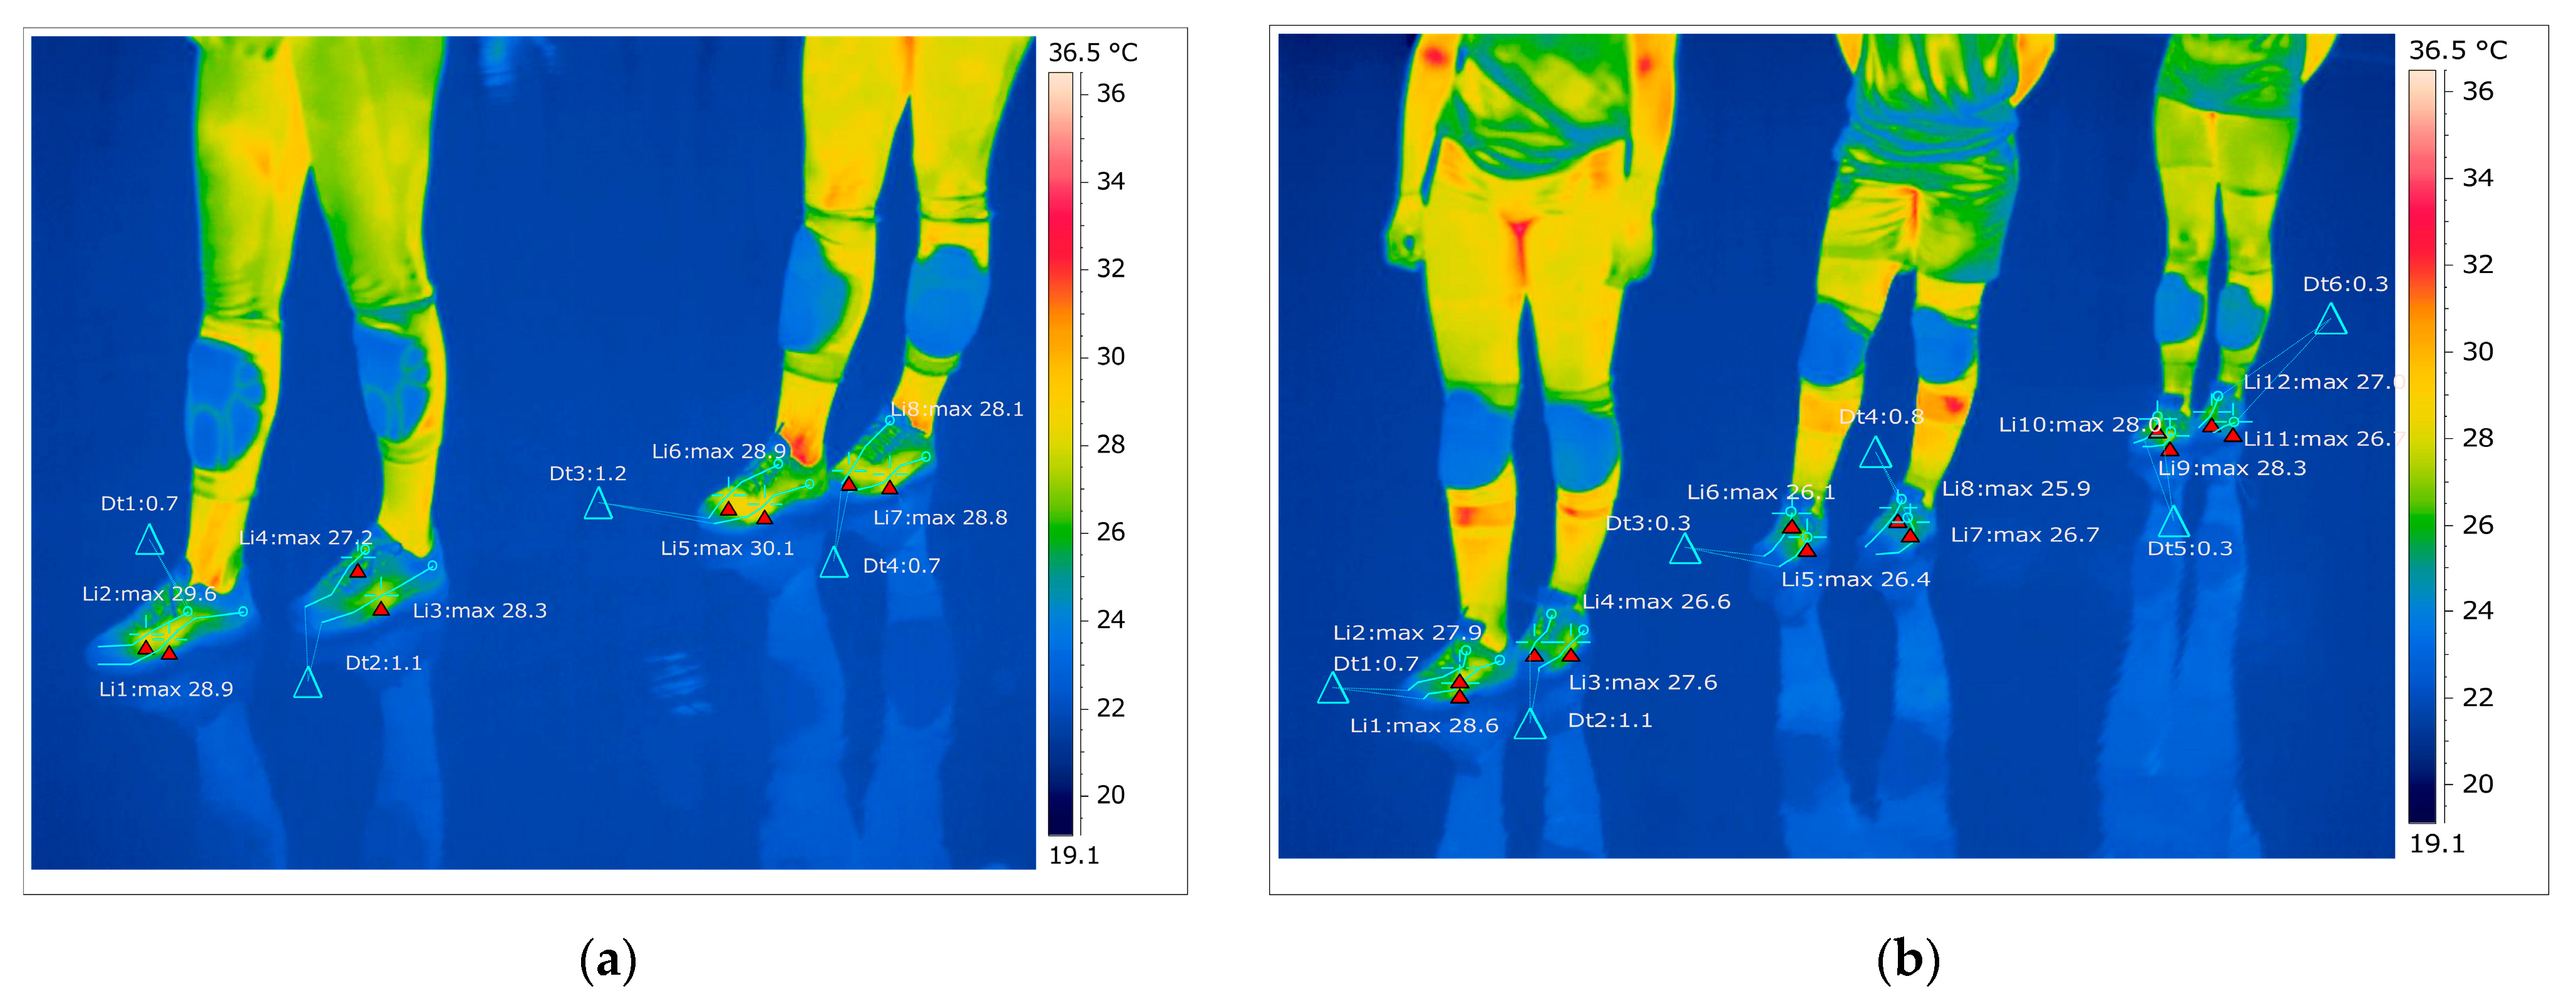
As shown in
Figure 14, for the right foot of subject 1 at time one (two minutes of training), the maximum temperature along the line Li1, which is positioned on the center of the foot, is 28.9 °C, and the minimum temperature is 22.3 °C. The temperature variation along the Li1 line is 6.6 °C, and the emissivity is 0.83 at time one. On the side along the Li2 line, the maximum temperature is 29.6 °C, and the minimum temperature is 22.8 °C at time one. The temperature variation along the Li2 line is 6.9 °C, and the emissivity is 0.83 at time one.
For the left foot of subject 1 at time one, the maximum temperature along the Li3 line positioned on the central side is 28.3 °C, and the minimum temperature is 23.6 °C. The temperature variation along the Li3 line is 4.6 °C, and the emissivity is 0.83, for subject 1 at time one. On the side along the Li4 line, the maximum temperature is 27.2 °C, and the minimum temperature is 22.9 °C, for subject 1 at time one. The temperature variation along the Li4 line is 4.2 °C, and the emissivity is 0.83, for subject 1 at time one.
In
Figure 14, for the right foot of subject 2 at time one (two minutes of training), the maximum temperature along the line Li5, which is positioned on the central part of the leg, is 30.1 °C, and the minimum temperature is 24.0 °C. The temperature variation along the Li5 line is 6.2 °C, and the emissivity is 0.83 at time one. On the side along the Li6 line, the maximum temperature is 28.9 °C, and the minimum temperature is 23.9 °C at time one. The temperature variation along the Li6 line is 4.9 °C, and the emissivity is 0.83 at time one.
For the left leg of subject 2 at time one, the maximum temperature along the Li7 line positioned on the central side is 28.8 °C, and the minimum temperature is 23.6 °C. The temperature variation along the Li7 line is 5.2 °C, and the emissivity is 0.83 at time one. On the side along the Li8 line, the maximum temperature is 28.1 °C, and the minimum temperature is 23.5 °C at time one. The temperature variation along the Li8 line is 4.6 °C, and the emissivity is 0.83 at time one.
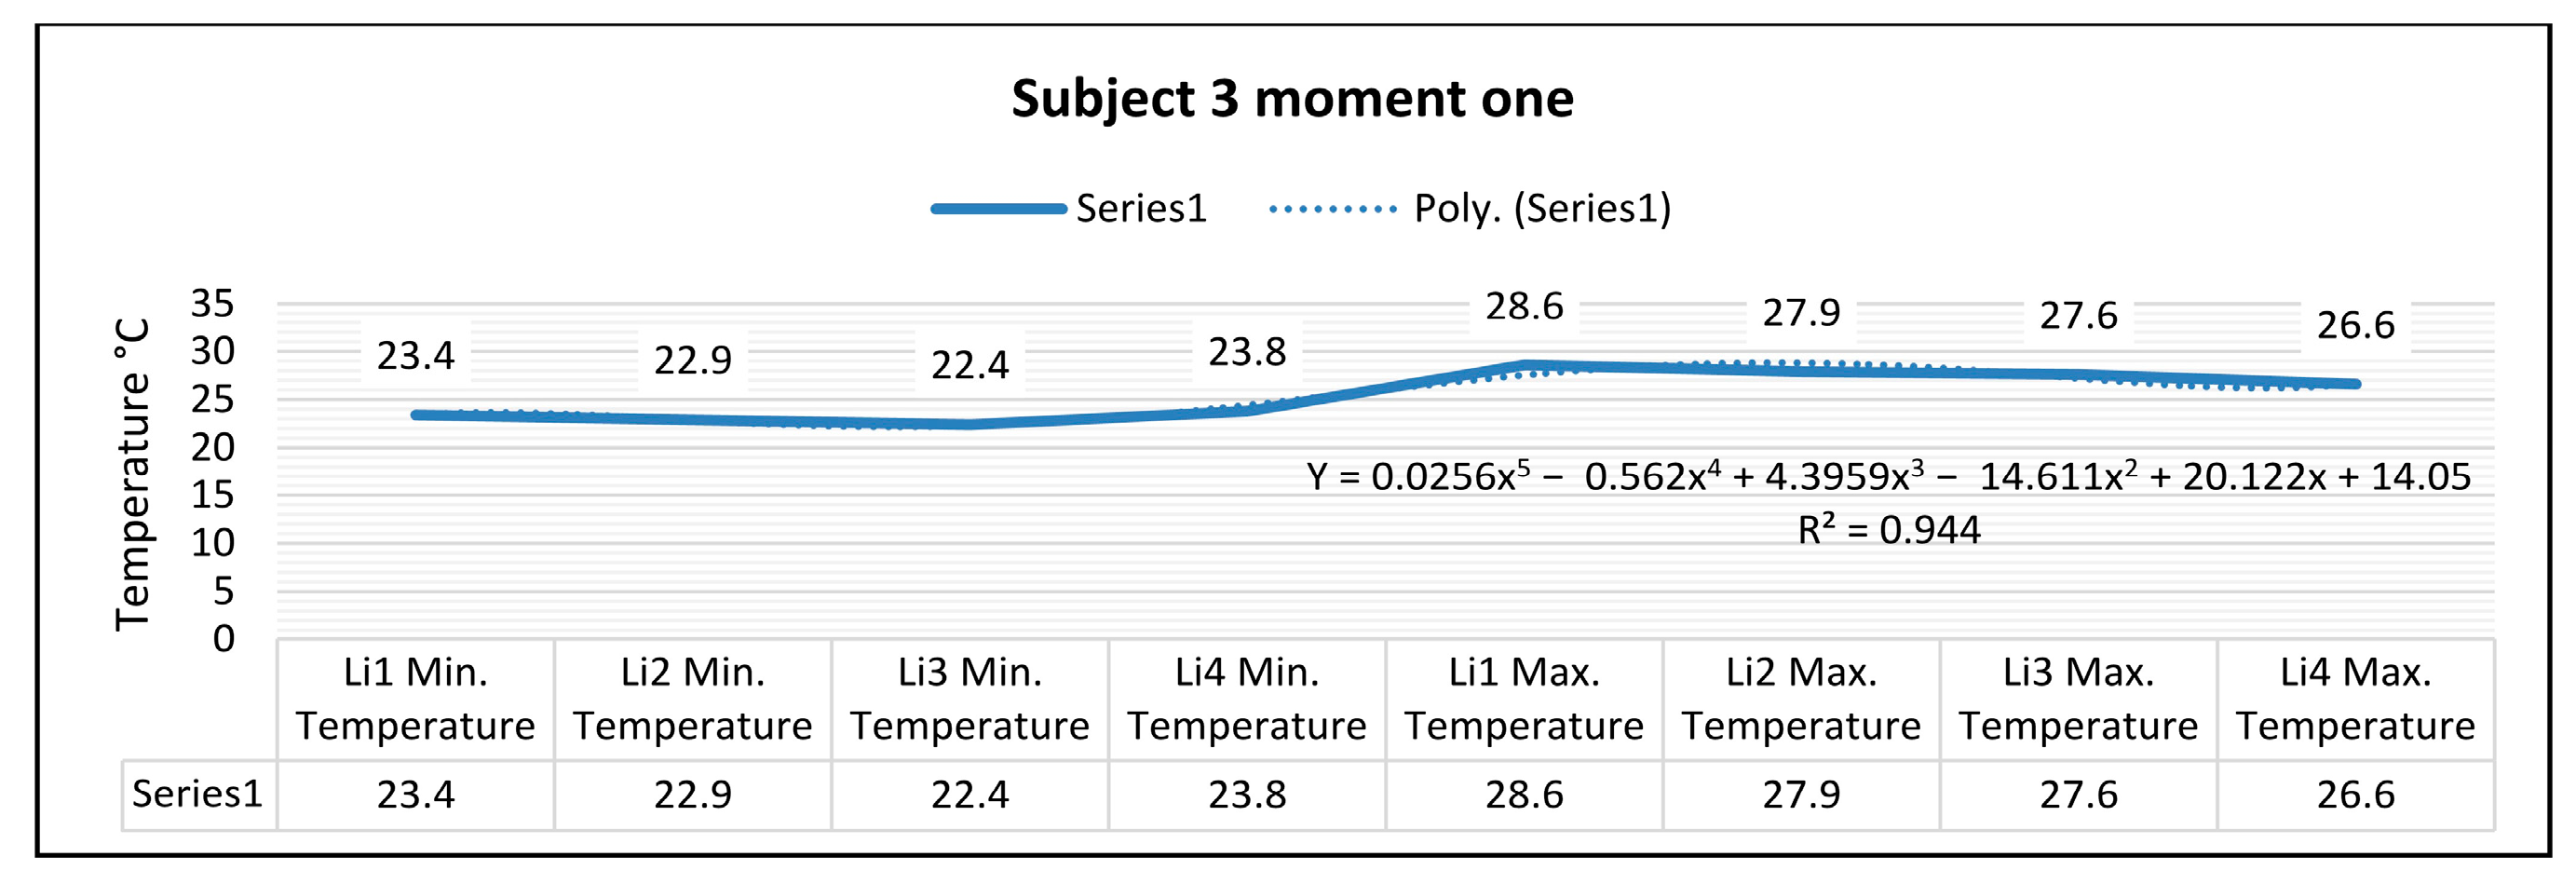
Thermography measurements afferent for subject 3 for the right foot at time one (two minutes of training) show that the maximum temperature along the Li1 line, which is positioned on the center of the foot, is 28.6 °C, and the minimum temperature is 23.4 °C. The temperature variation along the Li1 line is 5.2 °C, and the emissivity is 0.83 at time one. On the side along the Li2 line, the maximum temperature is 27.9 °C, and the minimum temperature is 22.9 °C, at time one. The temperature variation along the Li2 line is 4.9 °C, and the emissivity is 0.83 at time one.
For the left foot of subject 3 at time one, the maximum temperature along the Li3 line positioned on the central side is 27.6 °C, and the minimum temperature is 22.4 °C. The temperature variation along the Li3 line is 5.2 °C, and the emissivity is 0.83 at time one.
On the side along the Li4 line, the maximum temperature is 26.6 °C, and the minimum temperature is 23.8 °C, at time one. The temperature variation along the Li4 line is 2.8 °C, and the emissivity is 0.83 at time one.
In
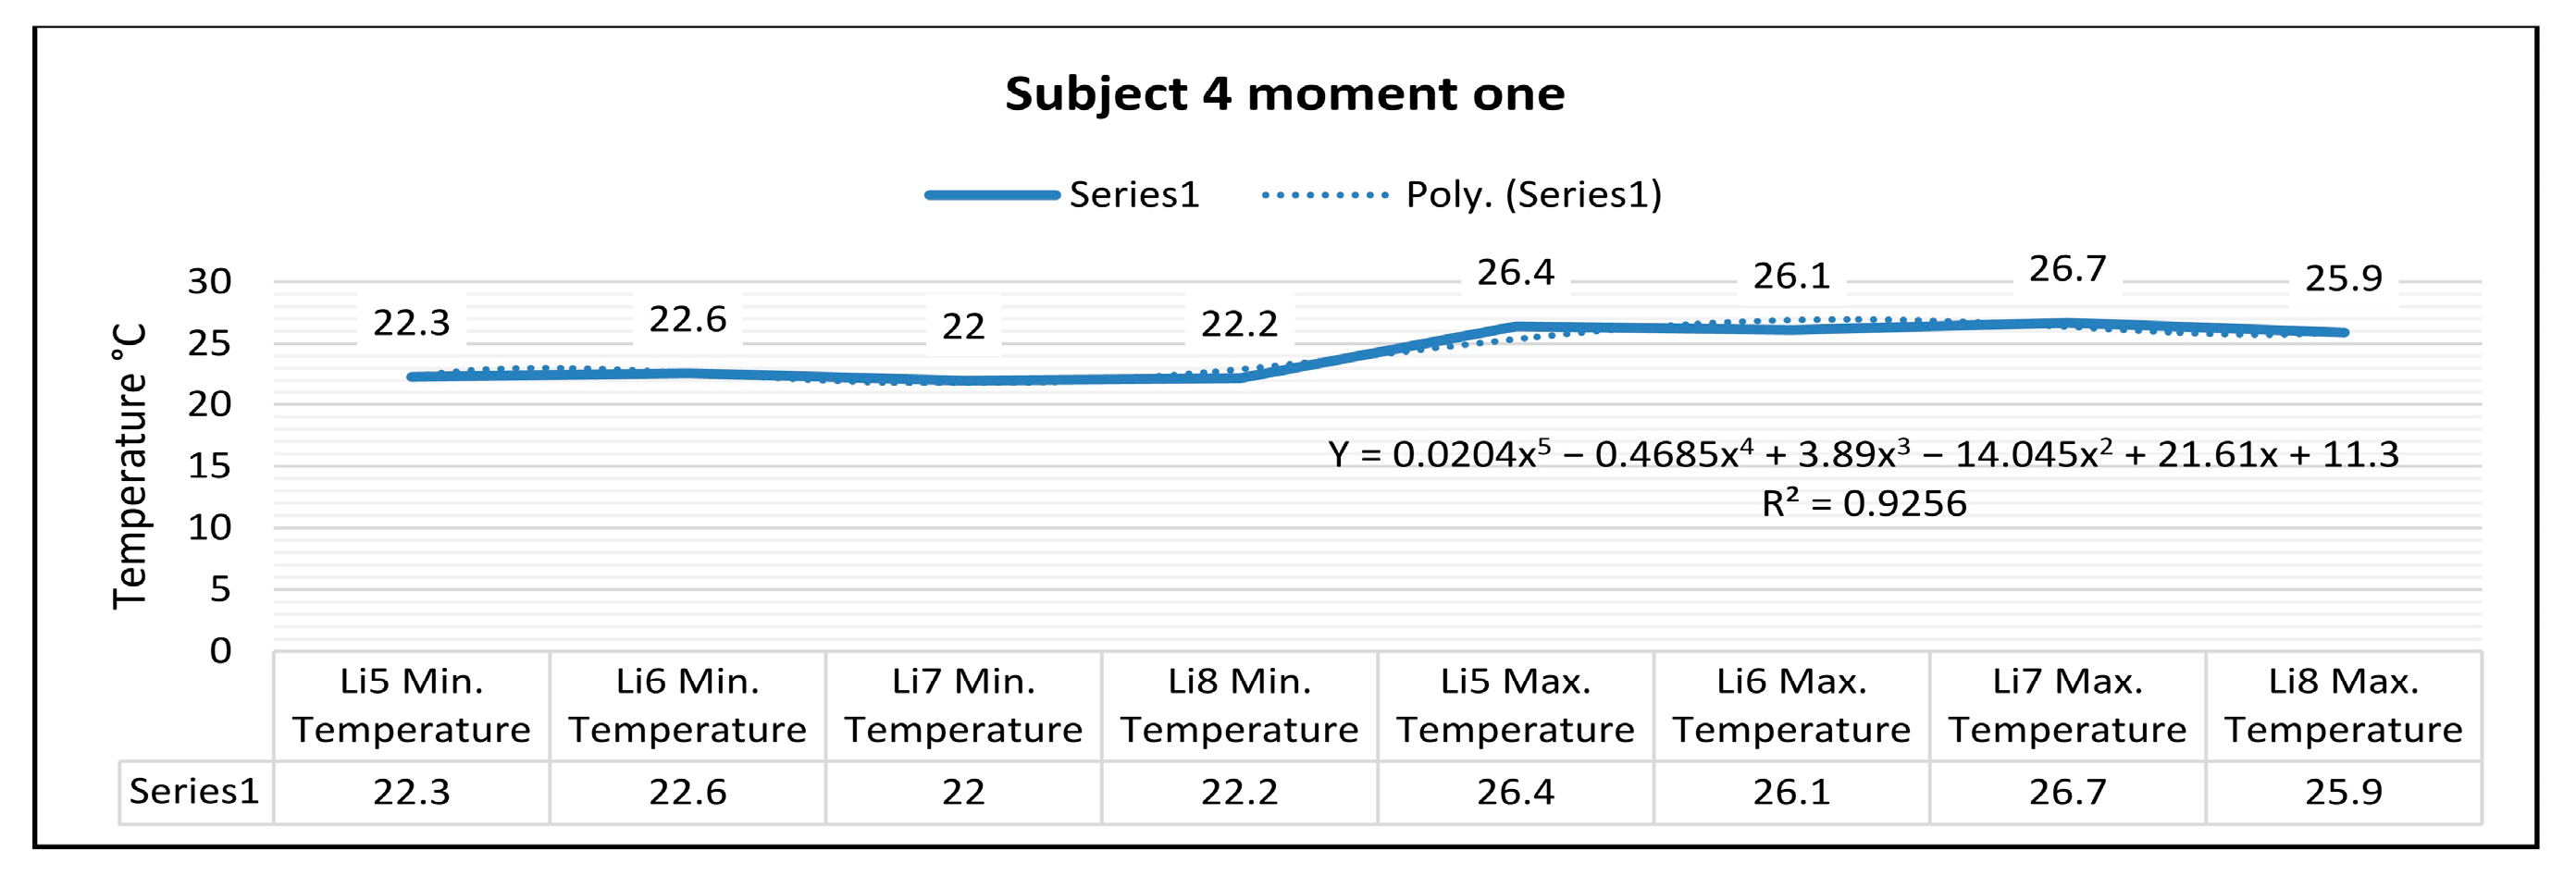
Figure 14, for the right foot of subject 4 at time one (two minutes of training), the maximum temperature along the Li5 line, which is positioned on the center of the foot, is 26.4 °C, and the minimum temperature is 22.3 °C.
The temperature variation along the Li5 line is 4.1 °C, and the emissivity is 0.83 at time one.
On the side along the Li6 line, the maximum temperature is 26.1 °C, and the minimum temperature is 22.6 °C, at time one.
The temperature variation along the line is 3.6 °C, and the emissivity is 0.83, at time one.
For the left foot of subject 4 at time one, the maximum temperature along the Li7 line positioned on the central side is 26.7 °C, and the minimum temperature is 22.0 °C.
The temperature variation along the Li7 line is 4.6 °C, and the emissivity is 0.83 at time one. On the side along the Li8 line, the maximum temperature is 25.9 °C, and the minimum temperature is 22.2 °C at time one.
The temperature variation along the Li8 line is 3.7 °C, and the emissivity is 0.83 at time one.
In
Figure 14, for the right foot of subject 5 at time one (two minutes of training), the maximum temperature along the line Li9, which is positioned on the central part of the foot, is 28.3 °C, and the minimum temperature is 23.0 °C.
The temperature variation along the Li9 line is 5.2 °C, and the emissivity is 0.83 at time one. On the side along the Li10 line, the maximum temperature is 28.0 °C, and the minimum temperature is 23.0 °C, at time one. The temperature variation along the Li10 line is 5.0 °C, and the emissivity is 0.83 at time one.
For the left foot of subject 5 at time one, the maximum temperature along the Li11 line positioned on the central side is 26.7 ° C, and the minimum temperature is 22.9 °C.
The temperature variation along the Li11 line is 3.8 °C, and the emissivity is 0.83 at time one. On the side along the Li12 line, the maximum temperature is 27.0 °C, and the minimum temperature is 23.3 °C, at moment one. The temperature variation along the Li12 line is 3.6 °C, and the emissivity is 0.83 at time one.
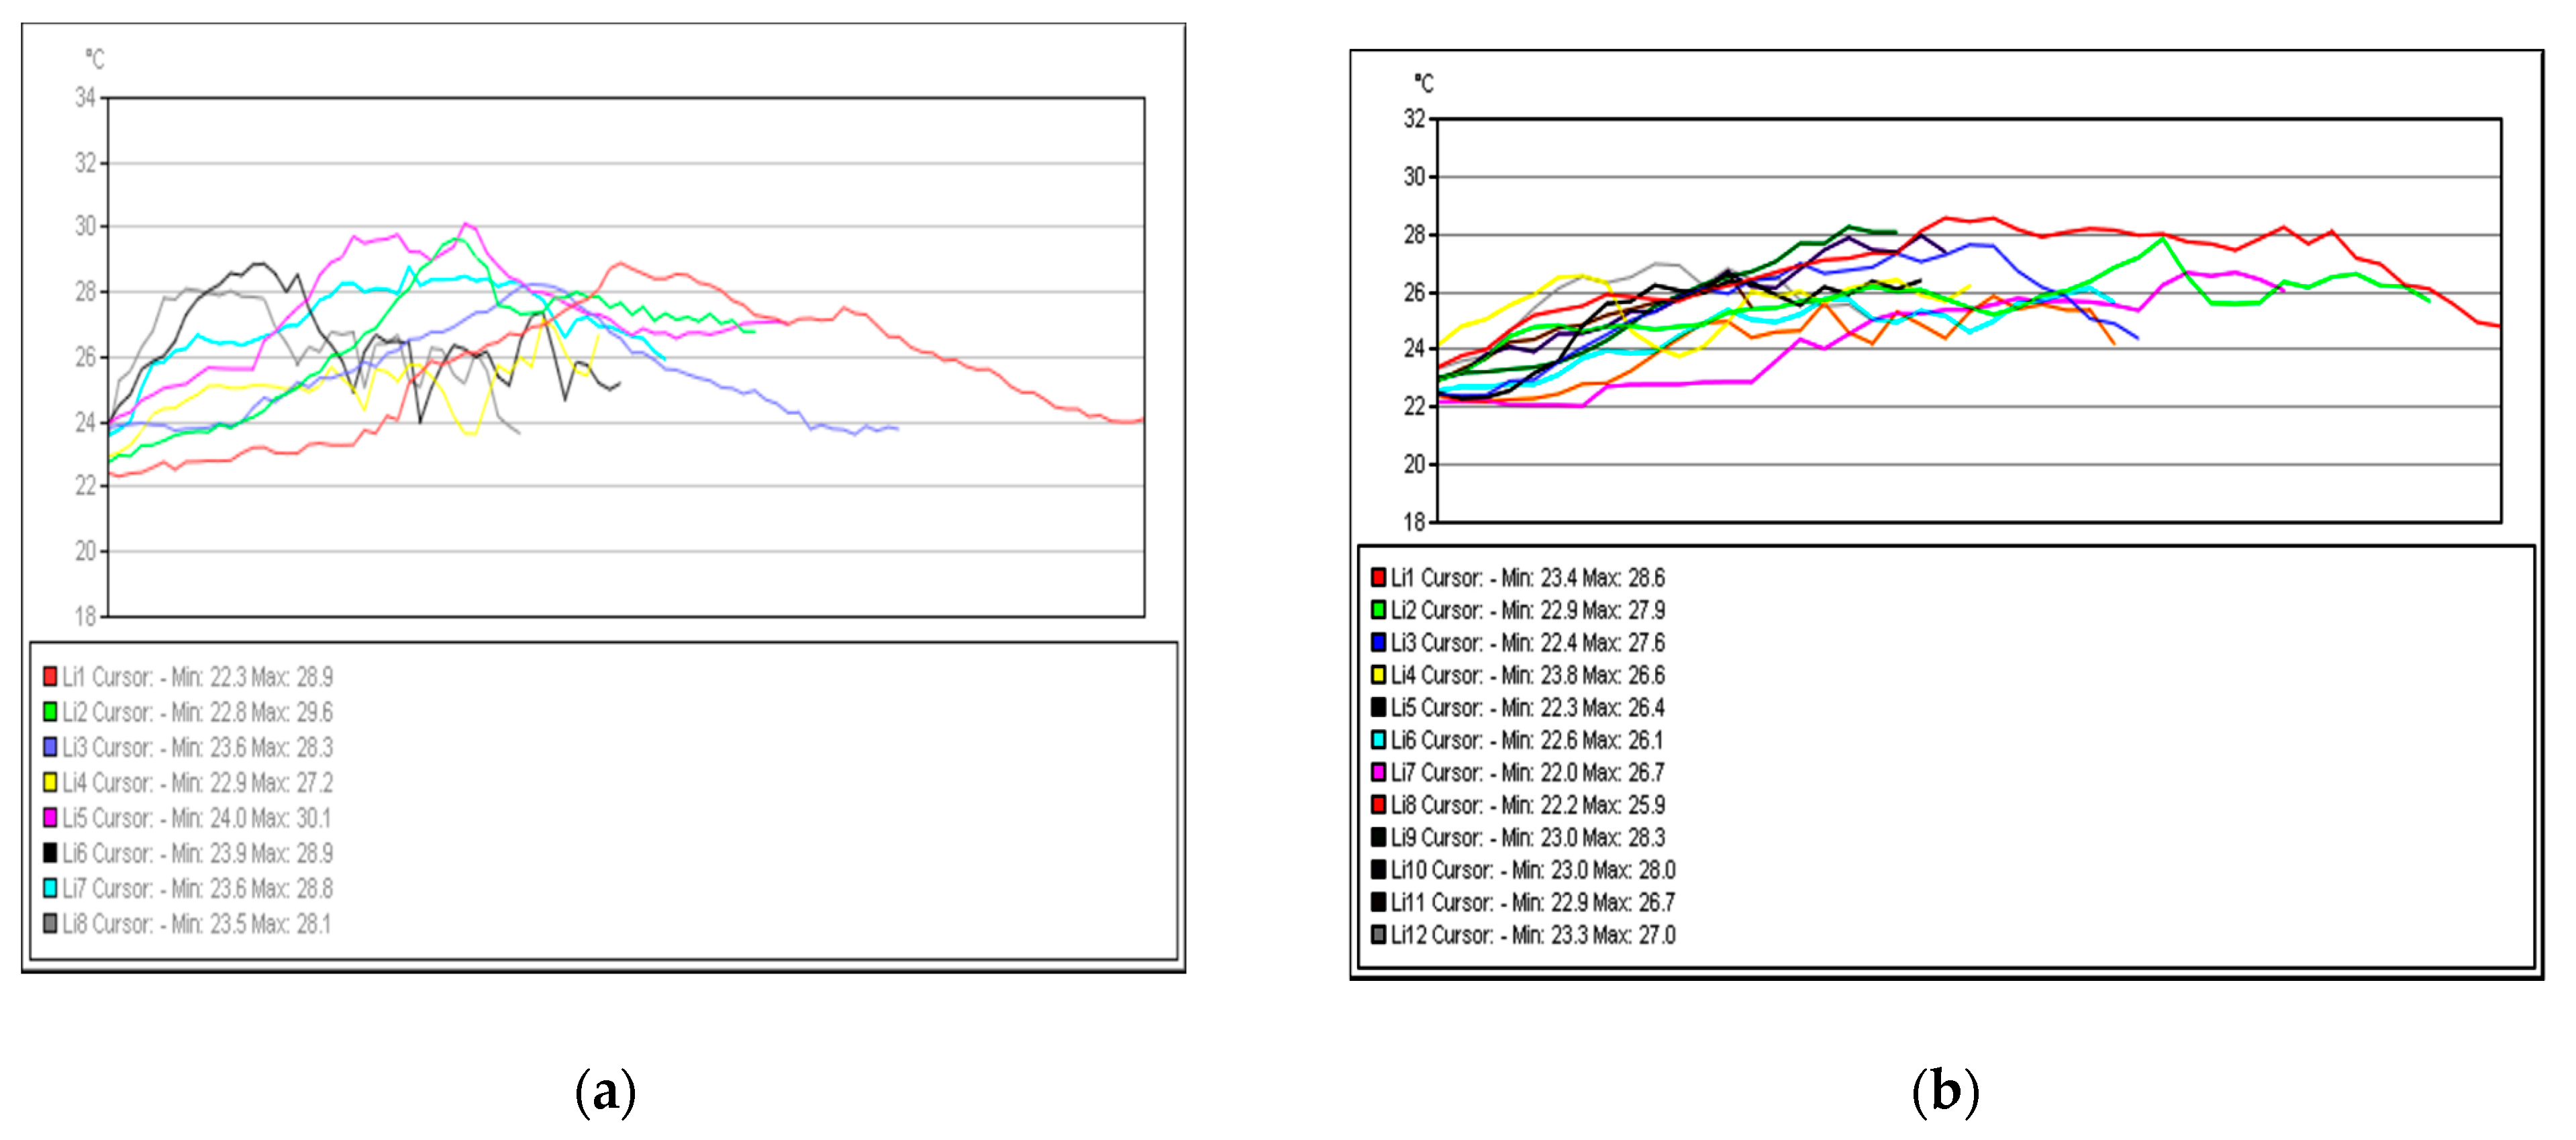
Figure 15 shows the temperature variation along the subject lines on each footwear at time one.
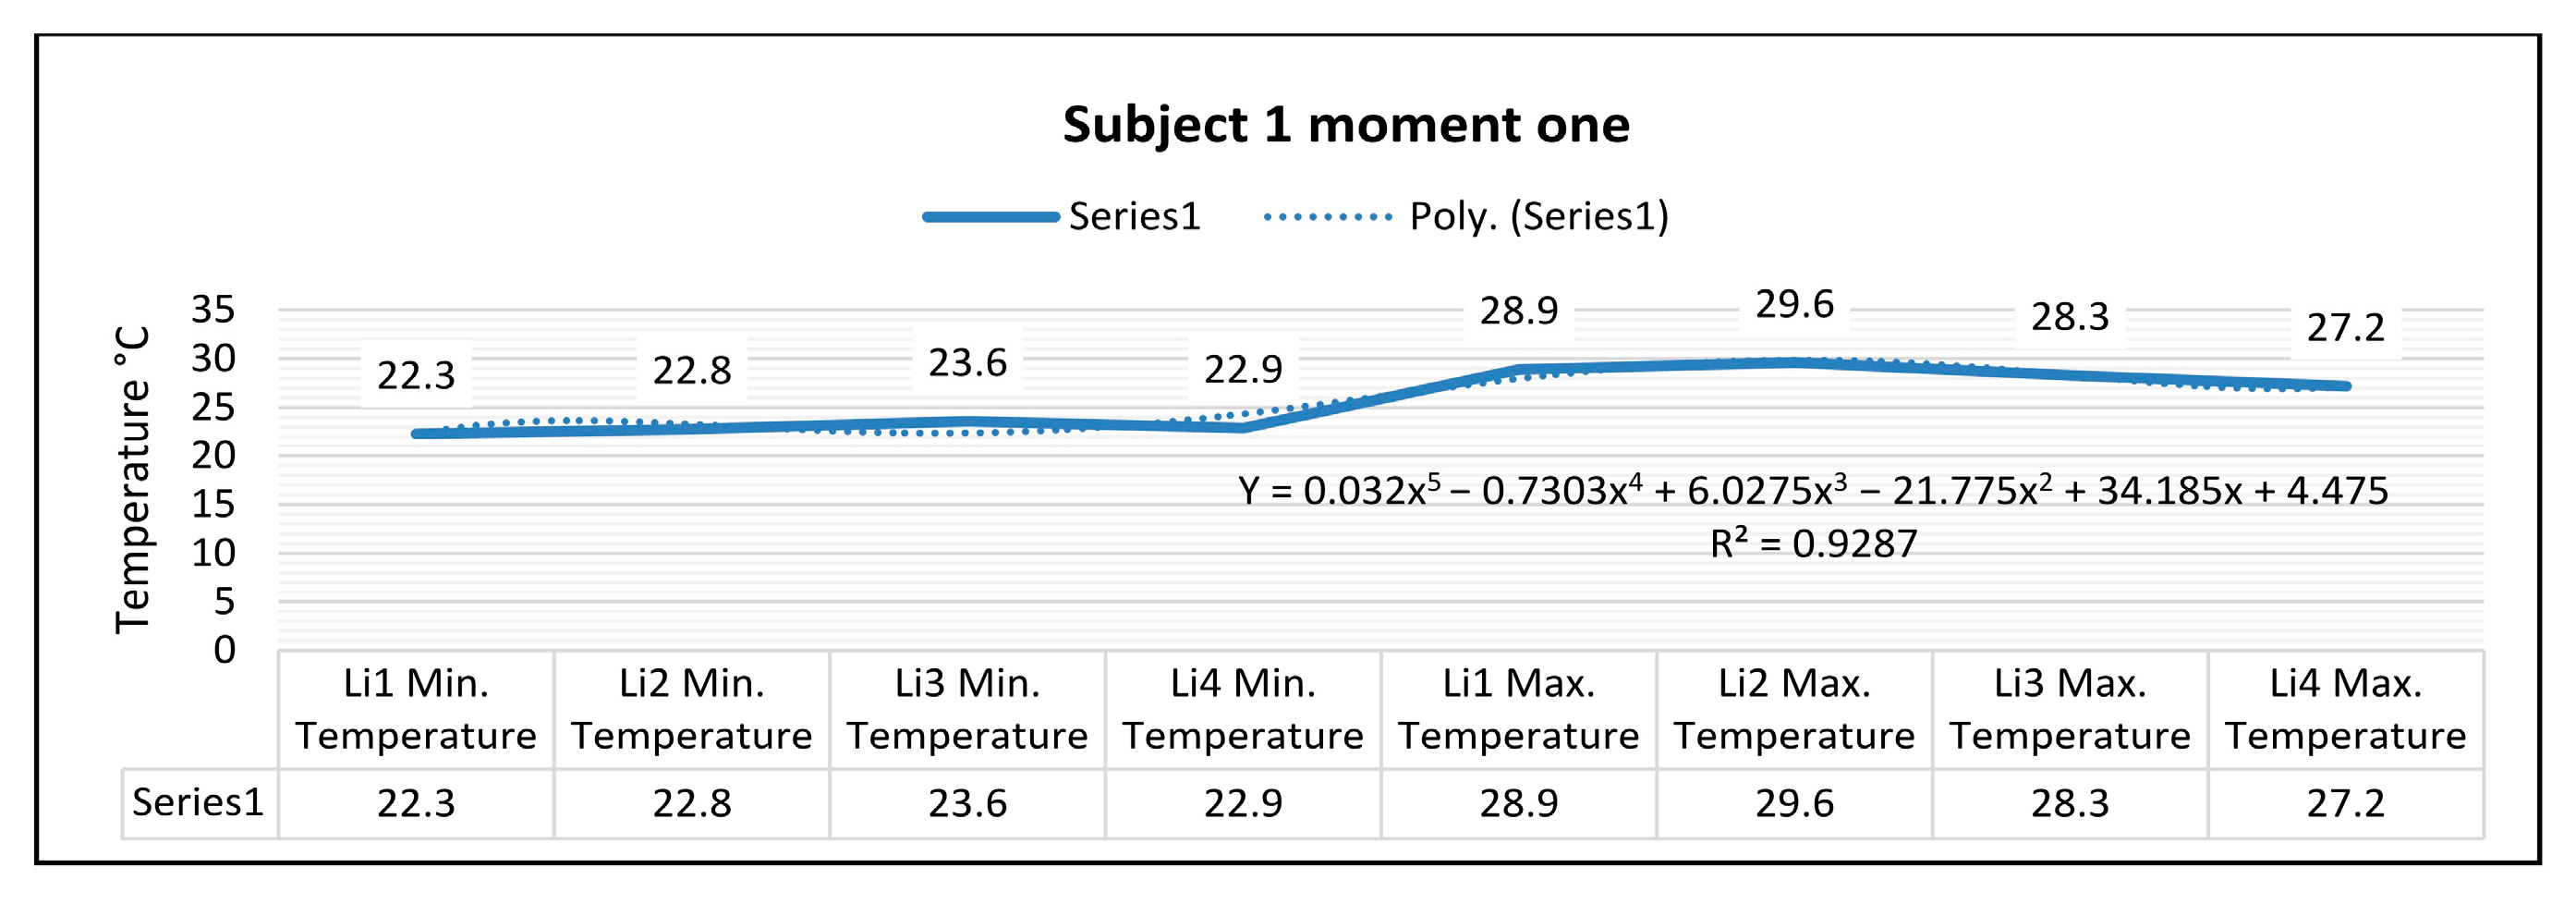
In the case of subject 1 at time one, as shown in
Figure 16, the relation obtained is a polynomial function of degree five (15).
The coefficient of determining R
2 established by the regression procedure is:
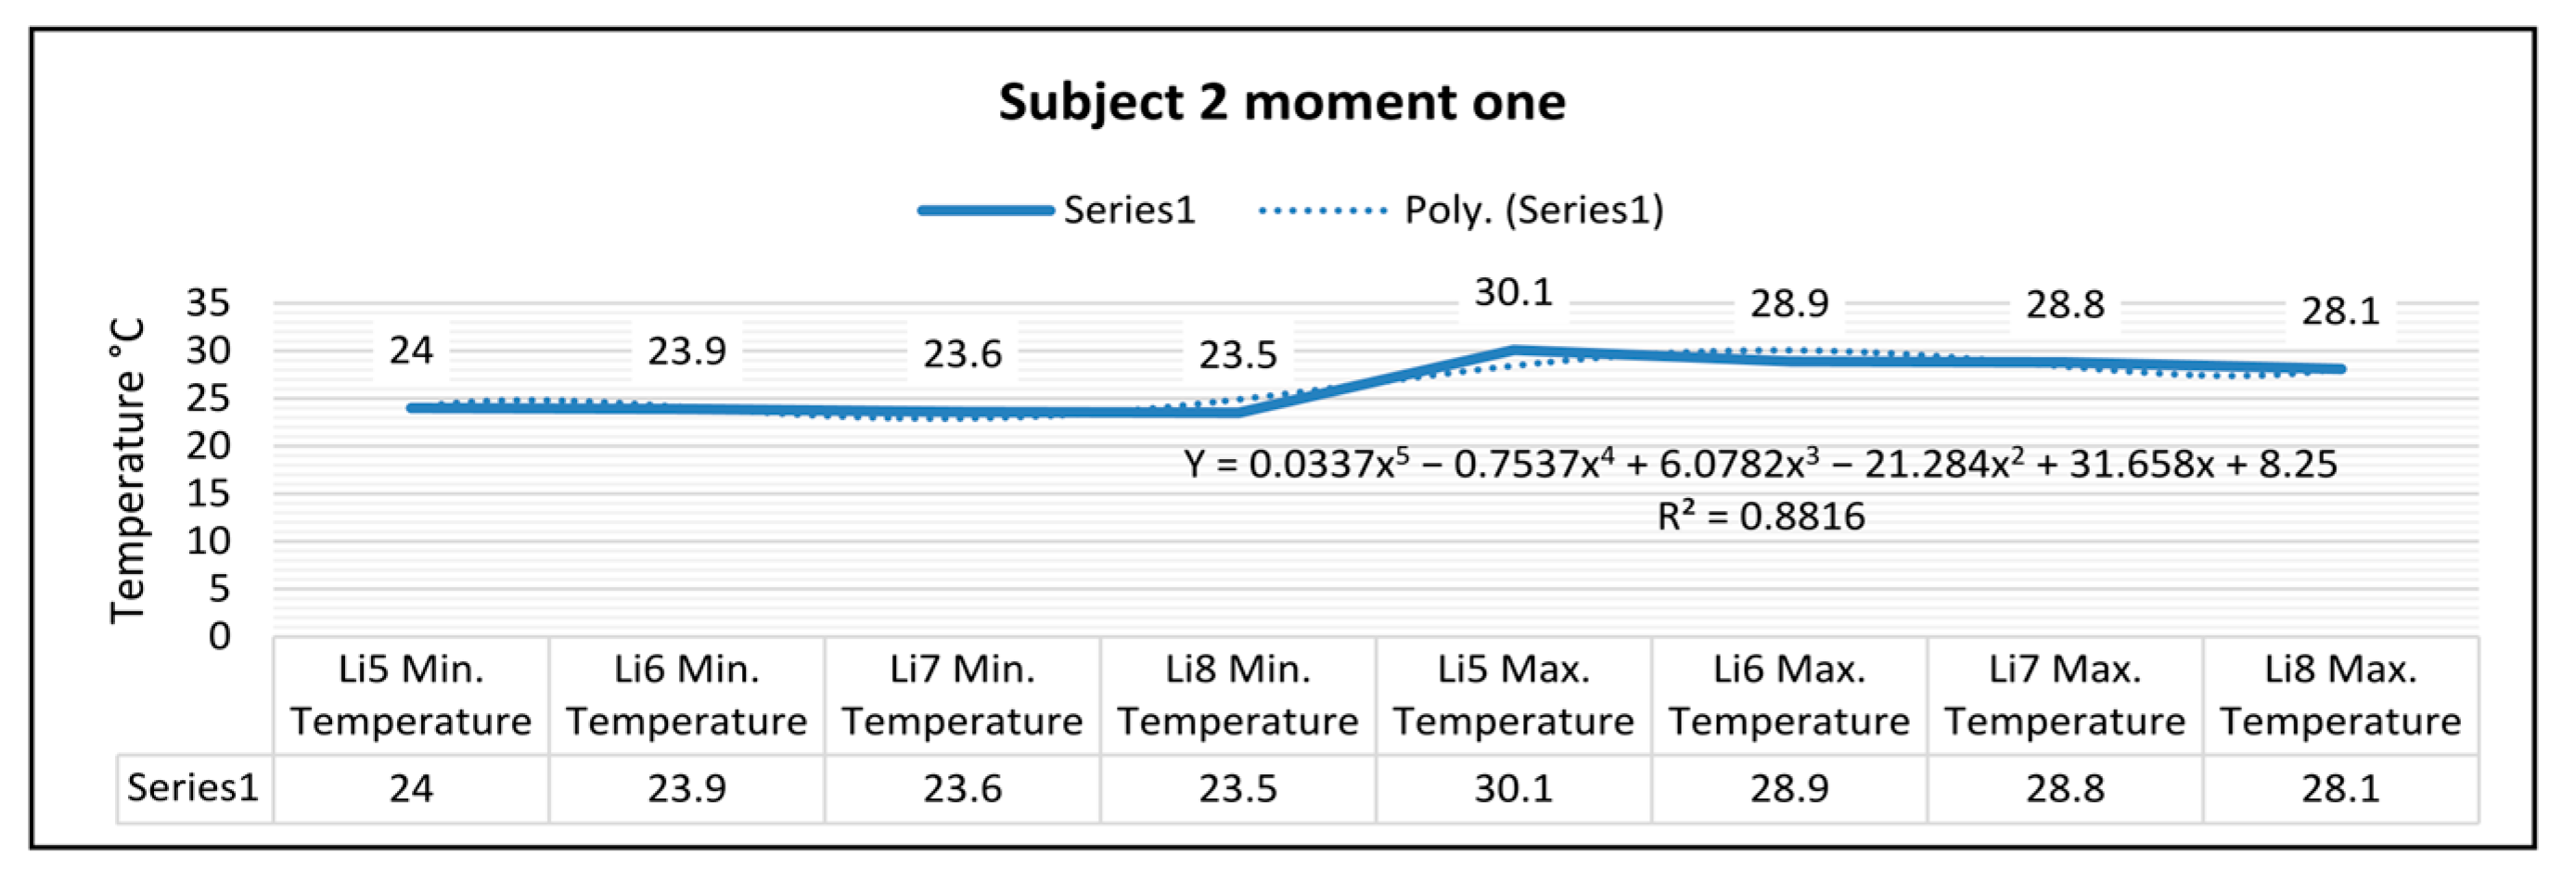
In the case of subject 2 at time one, as shown in
Figure 17, the relation obtained is a polynomial function of degree five (17).
The coefficient of determining R
2 established by the regression procedure is:
In the case of subject 3 at time one, as shown in
Figure 18, the relation obtained is a polynomial function of degree five (19).
The coefficient of determining R
2 established by the regression procedure is:
In the case of subject 4 at time one as shown in (
Figure 19), the relation obtained is a polynomial function of degree five (21).
The coefficient of determining R
2 established by the regression procedure is:
In the case of subject 5 at time one, as shown in
Figure 20, the relation obtained is a polynomial function of degree five (23).
The coefficient of determining R
2 established by the regression procedure is:
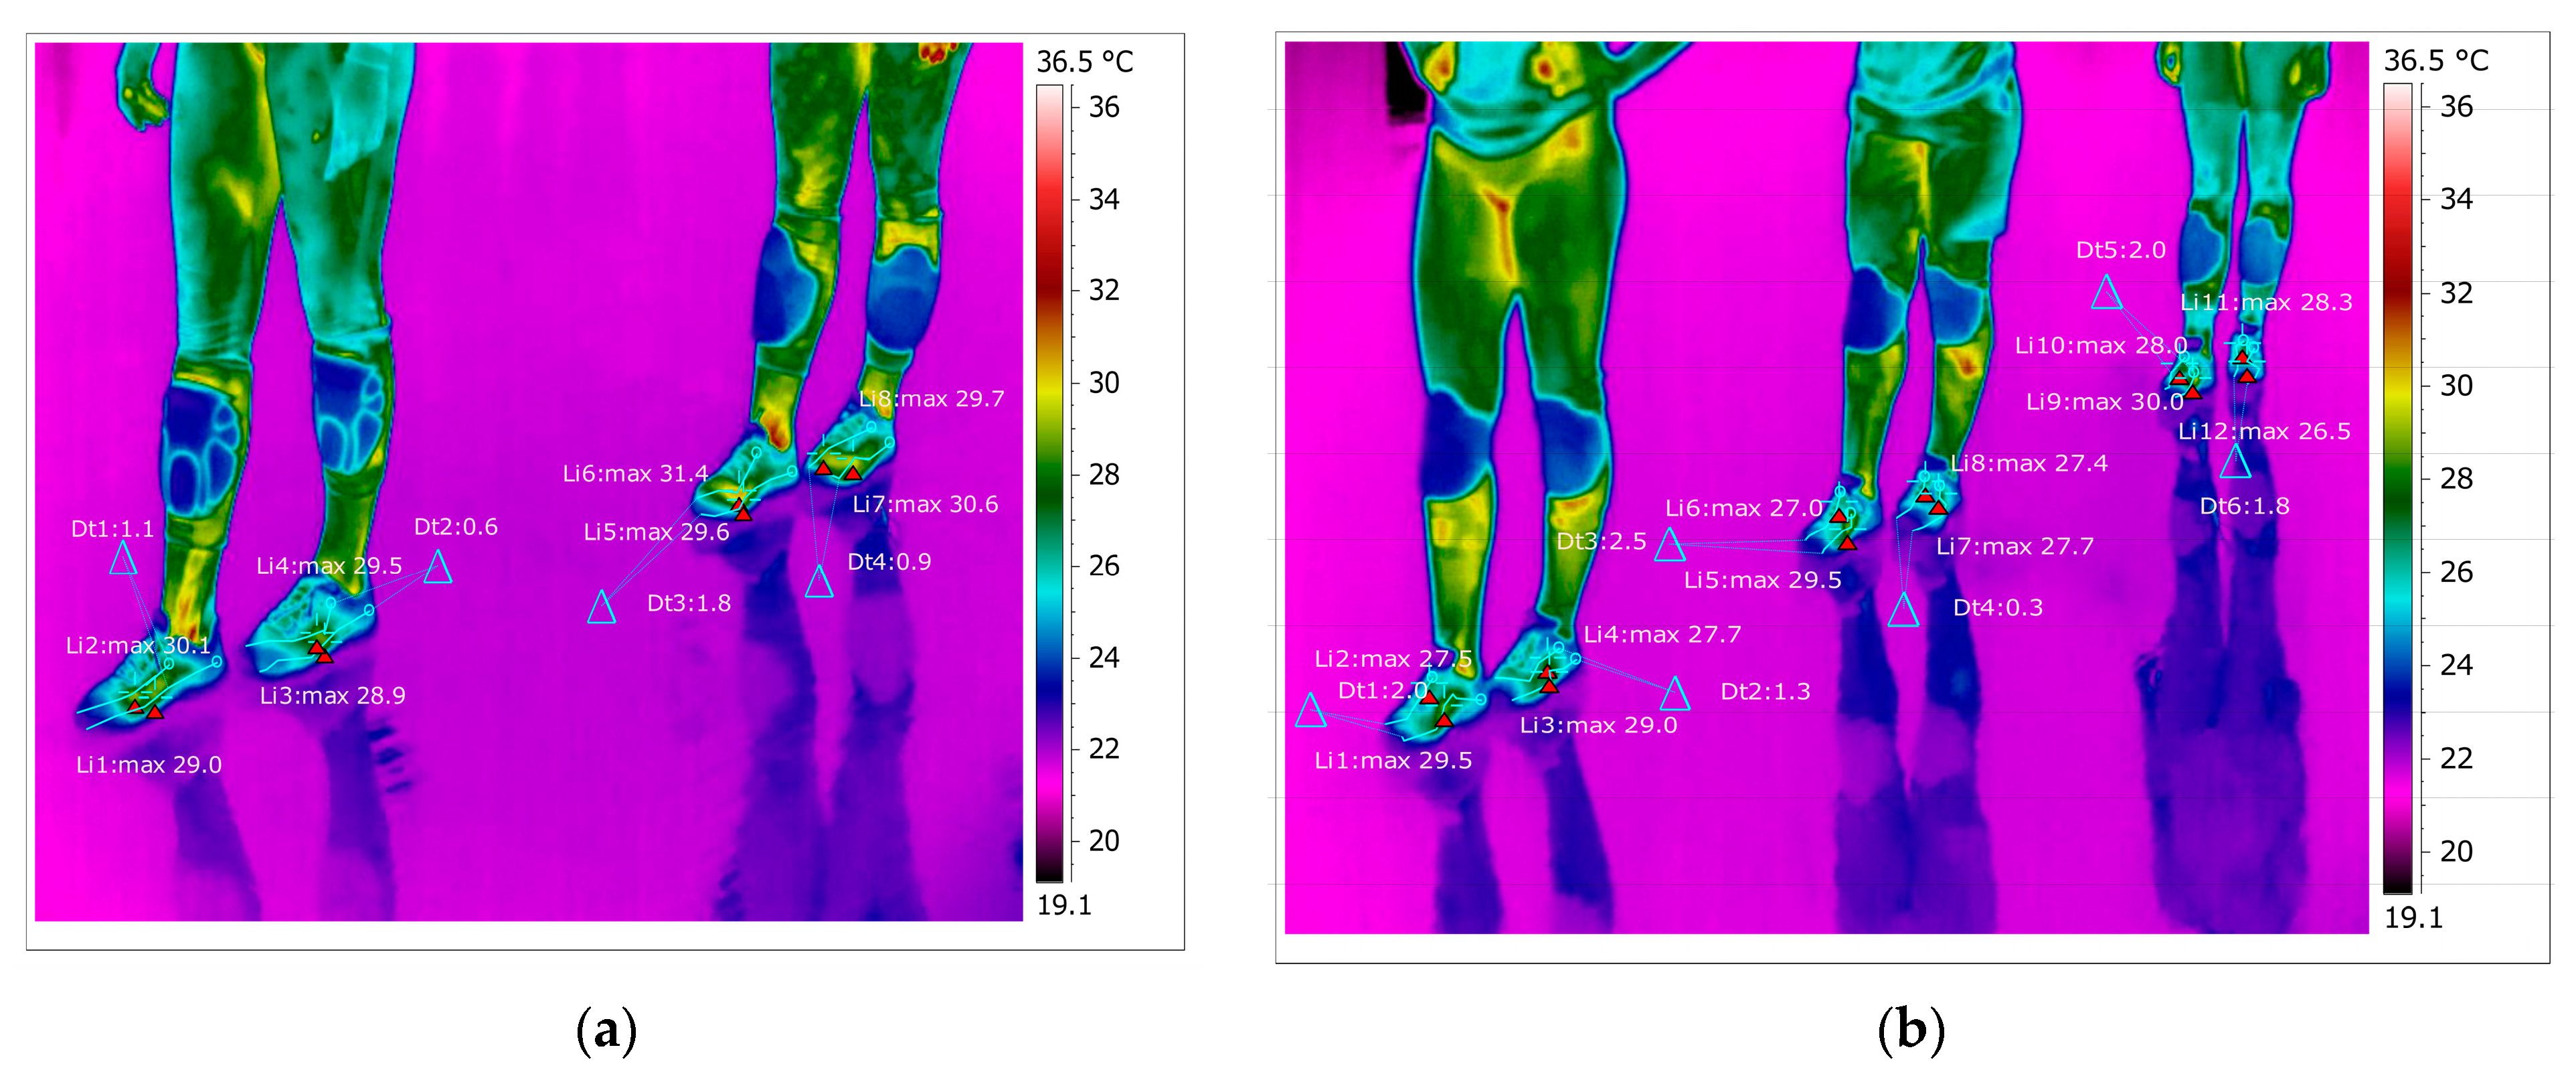
As shown in
Figure 21, for the right foot of subject 1 at time two (five minutes of training), the maximum temperature along the line Li1, which is positioned on the center of the foot, is 29.0 °C, and the minimum temperature is 22.1 °C. The temperature variation along the Li1 line is 6.9 °C, and the emissivity is 0.83 at time two. On the side along the Li2 line, the maximum temperature is 30.1 °C, and the minimum temperature is 22.5 °C at time two. The temperature variation along the Li2 line is 7.6 °C, and the emissivity is 0.83 at time two. For the left foot of subject 1 at time two, the maximum temperature along the Li3 line positioned on the central side is 28.9 °C, and the minimum temperature is 23.5 °C.
The temperature variation along the Li3 line is 5.5 °C, and the emissivity is 0.83, for subject 1 at time two. On the side along the Li4 line, the maximum temperature is 29.5 °C, and the minimum temperature is 23.0 °C, for subject 1 at time two. The temperature variation along the Li4 line is 6.5 °C, and the emissivity is 0.83, for subject 1 at time two.
In
Figure 21, for the right foot of subject 2 at time two (five minutes of training), the maximum temperature along the Li5 line, which is positioned on the center of the foot, is 29.6 °C, and the minimum temperature is 23.3 °C. The temperature variation along the Li5 line is 6.2 °C, and the emissivity is 0.83 at time two. On the side along the Li6 line, the maximum temperature is 31.4 °C, and the minimum temperature is 25.8 °C at time two.
The temperature variation along the Li6 line is 5.6 °C, and the emissivity is 0.83 at time two. For the left foot of subject 2 at time two, the maximum temperature along the Li7 line positioned on the central side is 30.6 °C, and the minimum temperature is 25.5 °C.
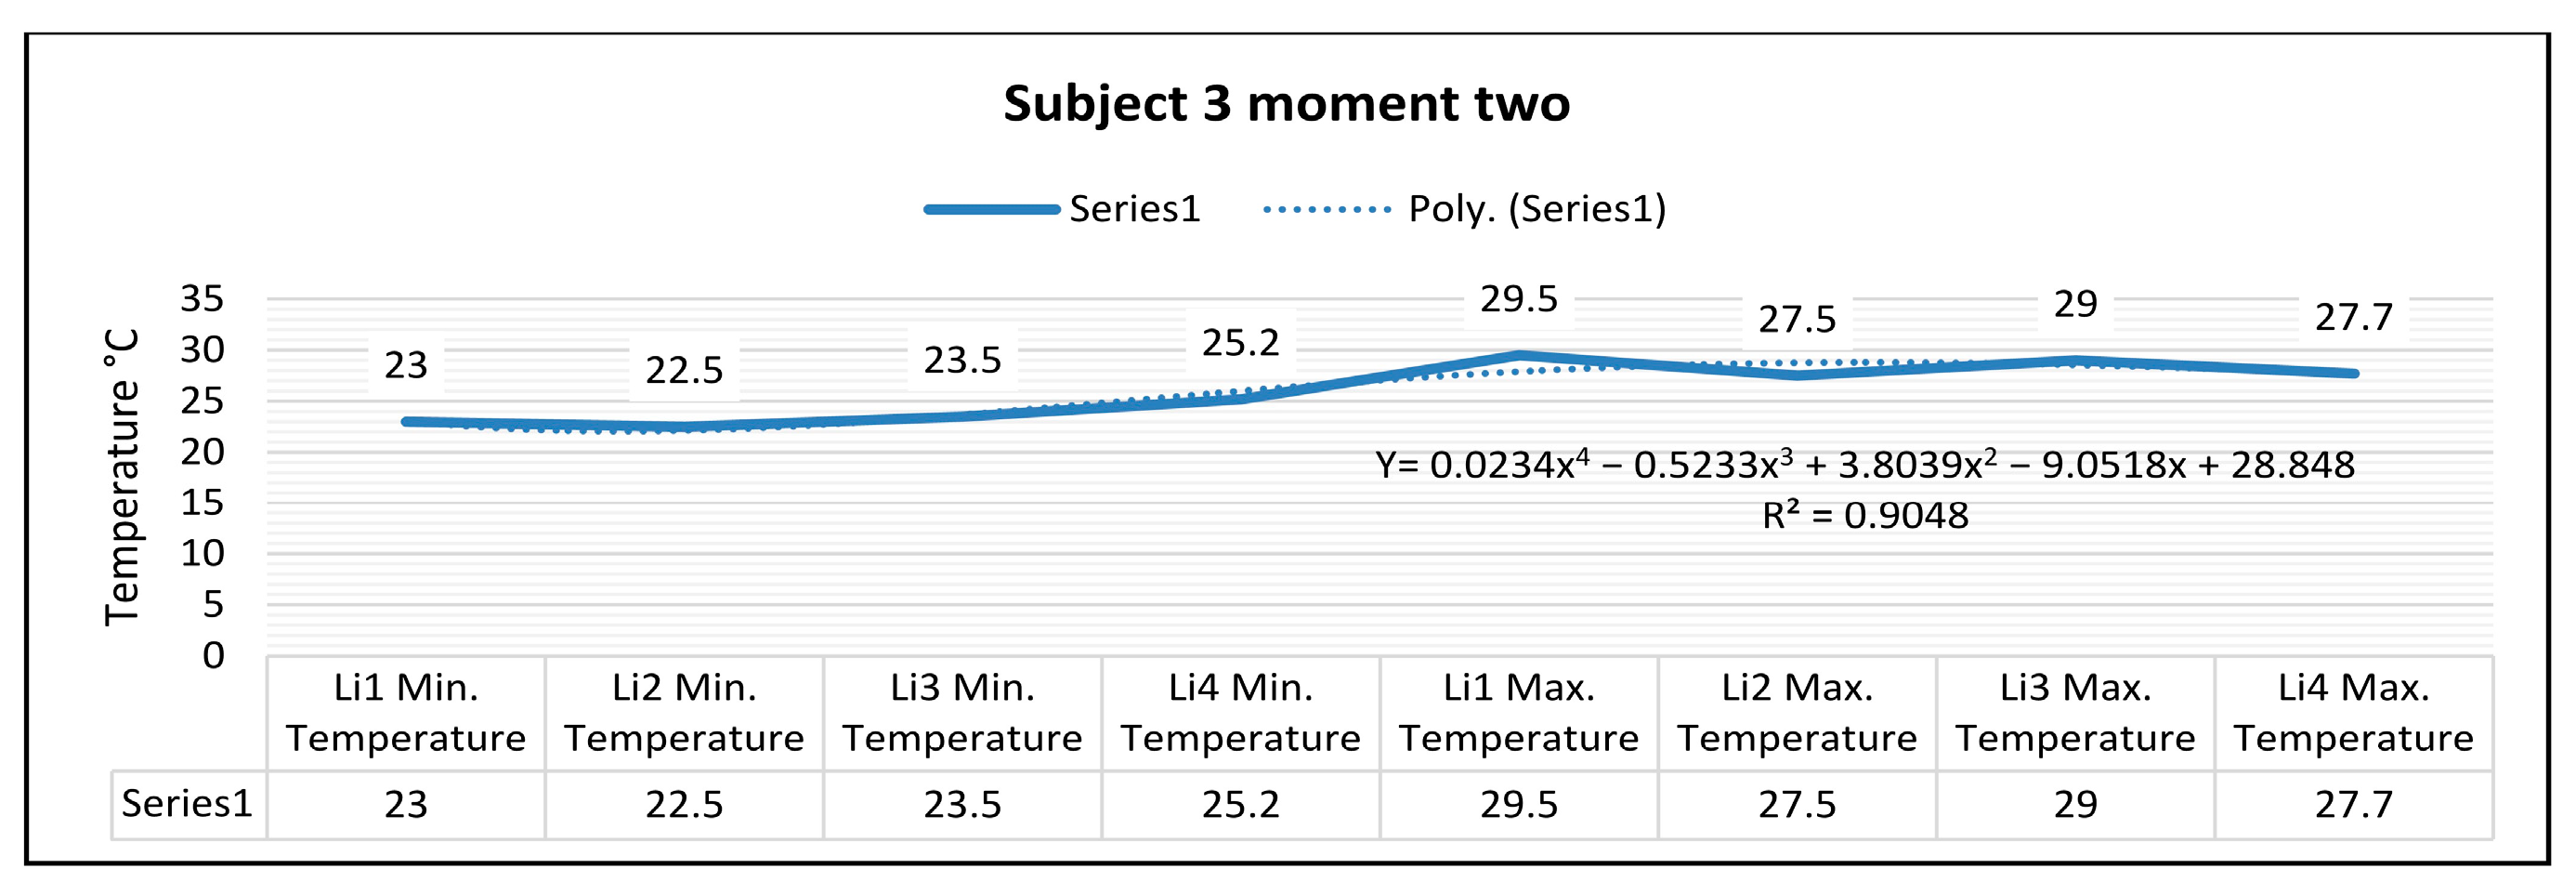
The temperature variation along the Li7 line is 5.1 °C, and the emissivity is 0.83 at time two. On the side along the Li8 line, the maximum temperature is 29.7 °C, and the minimum temperature is 24.9 °C, at time two. The temperature variation along the Li8 line is 4.8 °C, and the emissivity is 0.83 at the second moment. Thermography measurements afferent for subject 3 for the right foot at time two (five minutes of training) show that the maximum temperature along the Li1 line, which is positioned on the central part of the foot, is 29.5 °C, and the minimum temperature is 23.0 °C. The temperature variation along the Li1 line is 6.6 °C, and the emissivity is 0.83 at time two. On the side along the Li2 line, the maximum temperature is 27.5 °C, and the minimum temperature is 22.5 °C at time two. The temperature variation along the Li2 line is 5.0 °C, and the emissivity is 0.83 at time two. For the left leg of subject 3 at time two, the maximum temperature along the Li3 line positioned on the central side is 29.0 °C, and the minimum temperature is 23.5 °C. The temperature variation along the Li3 line is 5.5 °C, and the emissivity is 0.83 at time two. On the side along the Li4 line, the maximum temperature is 27.7 °C, and the minimum temperature is 25.2 °C, at time two. The temperature variation along the Li4 line is 2.5 °C, and the emissivity is 0.83 at the second moment.
In
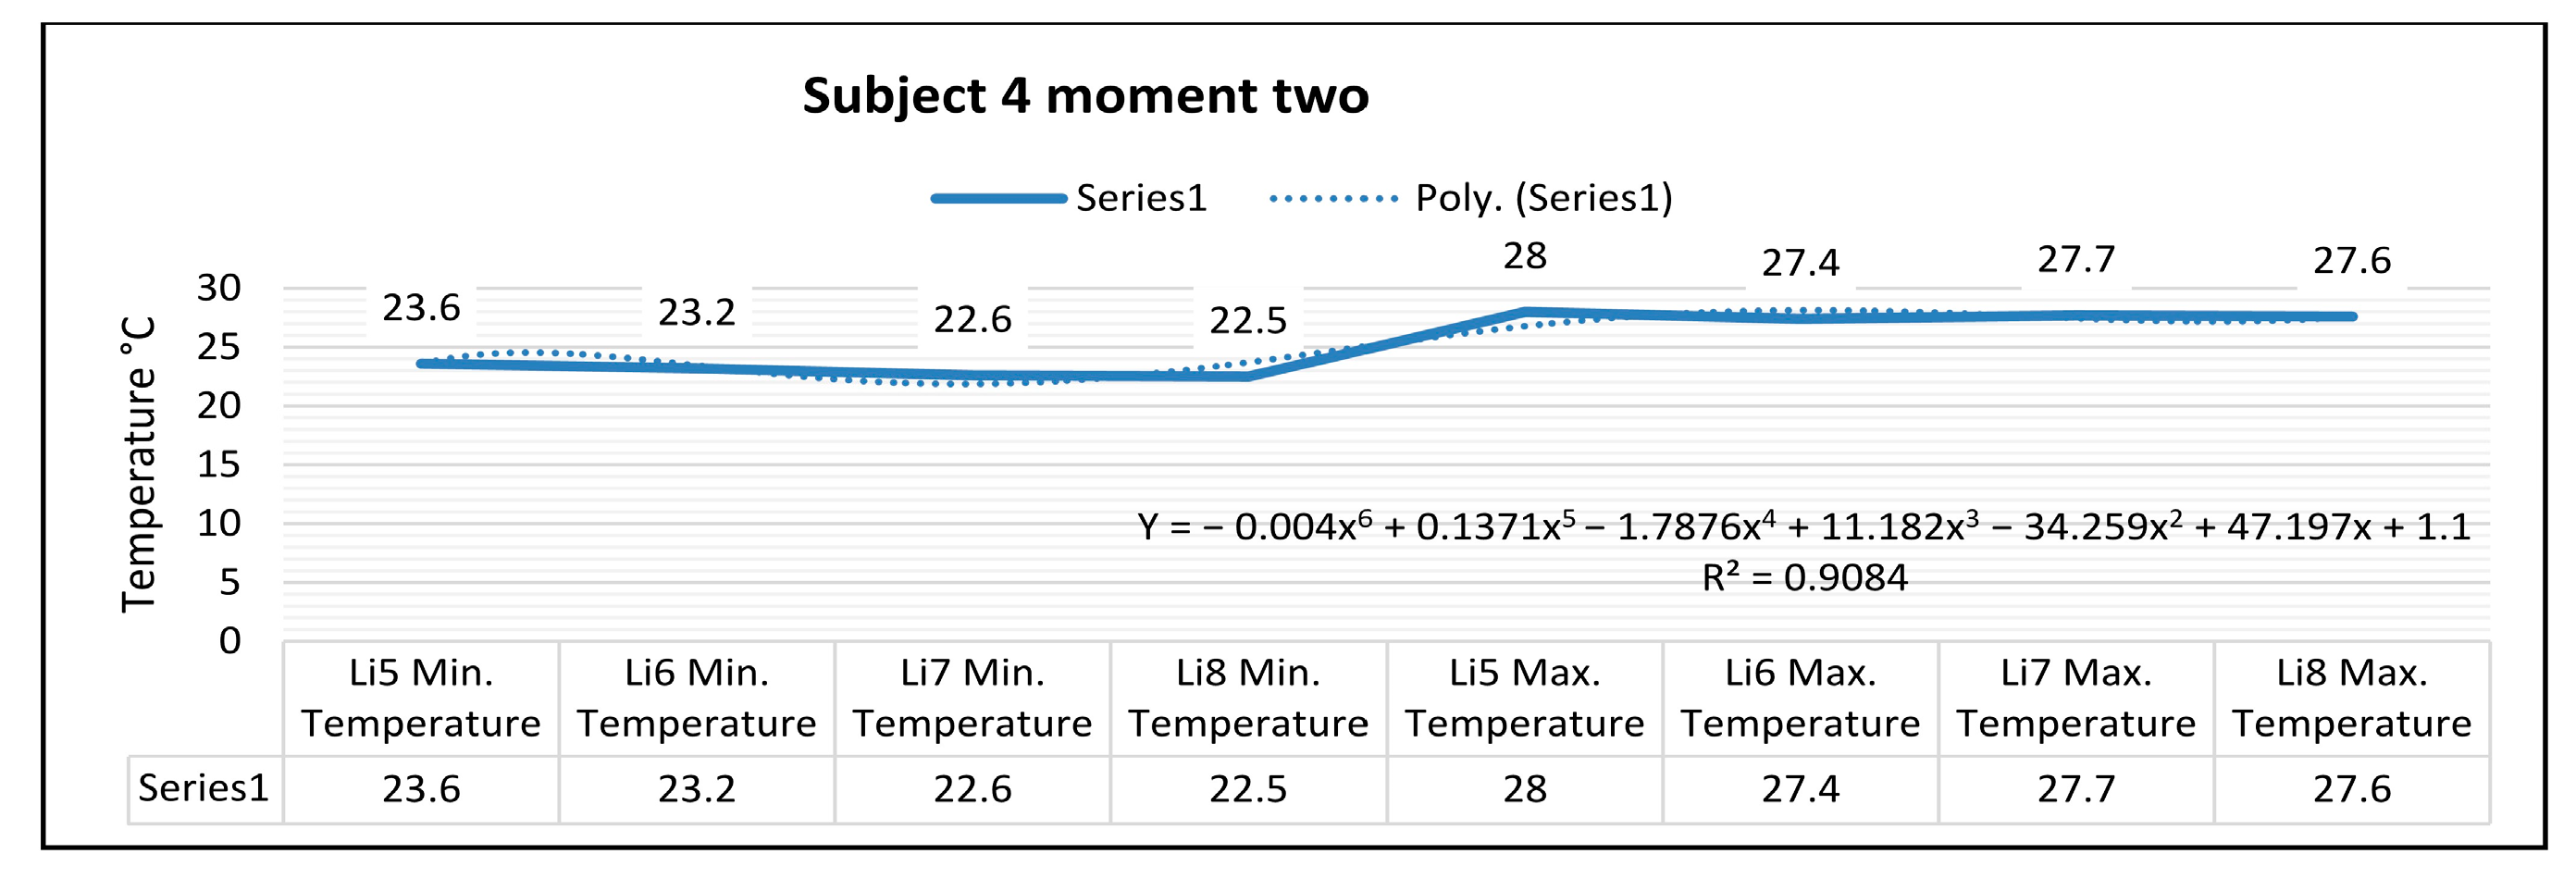
Figure 21, for the right foot of subject 4 at time two (five minutes of training), the maximum temperature along the Li5 line, which is positioned on the central part of the foot, is 29.5 °C, and the minimum temperature is 23.6 °C. The temperature variation along the Li5 line is 5.9 °C, and the emissivity is 0.83 at time two. On the side along the Li6 line, the maximum temperature is 27.0 °C, and the minimum temperature is 23.2 °C, at time two. The temperature variation along the line is 3.7 °C, and the emissivity is 0.83 at time two. For the left foot of subject 4 at time two, the maximum temperature along the Li7 line positioned on the central side of the foot is 27.7 °C, and the minimum temperature is 22.6 °C. The temperature variation along the Li7 line is 5.1 °C, and the emissivity is 0.83 at time two. On the side along the Li8 line, the maximum temperature is 27.4 °C, and the minimum temperature is 22.5 °C, at time two. The temperature variation along the Li8 line is 4.9 °C, and the emissivity is 0.83 at time two.
In
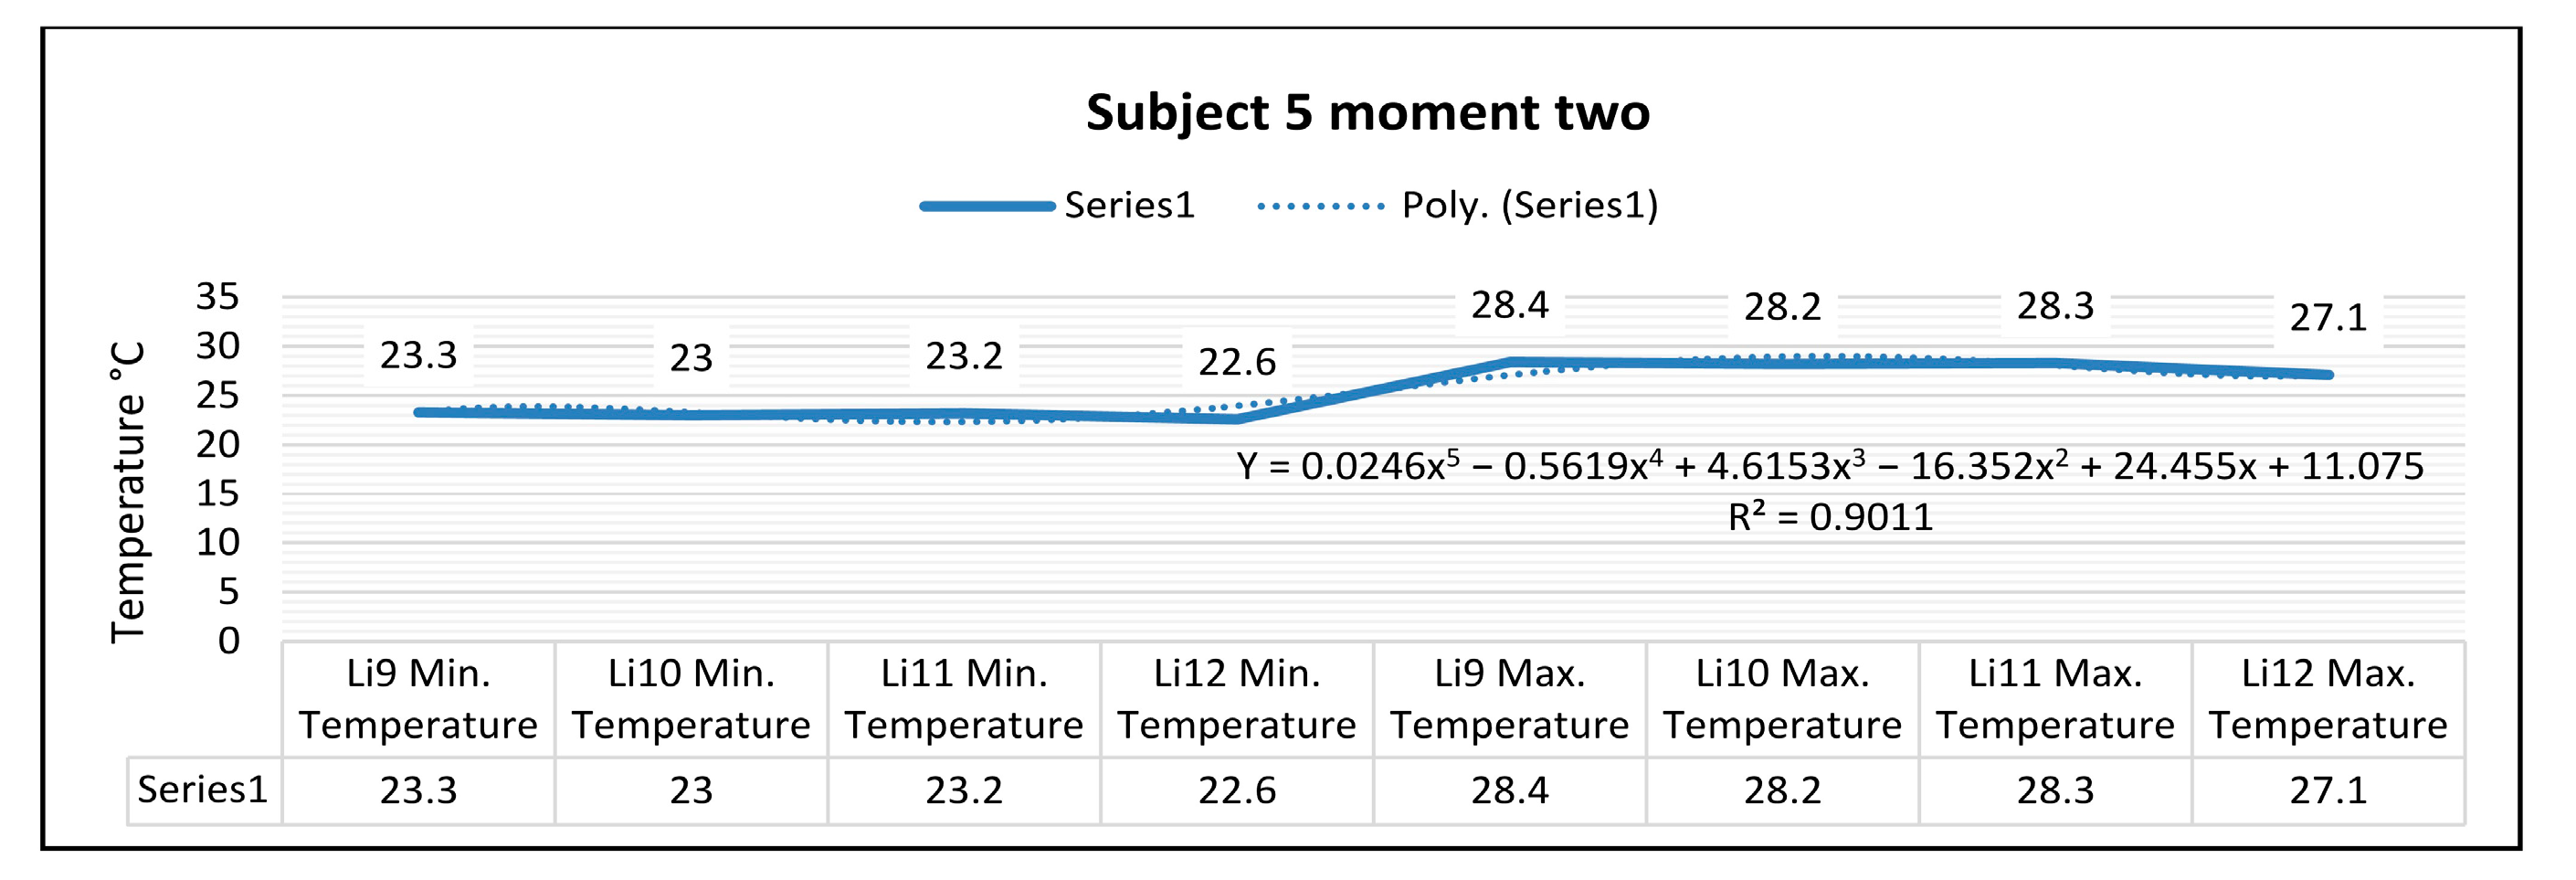
Figure 21, for the right foot of subject 5 at time two (five minutes of training), the maximum temperature along the line Li9, which is positioned on the central part of the foot, is 30.0 °C, and the minimum temperature is 23.3 °C. The temperature variation along the Li9 line is 6.8 °C, and the emissivity is 0.83 at time two. On the side along the Li10 line, the maximum temperature is 28.0 °C, and the minimum temperature is 23.0 °C, at time two. The temperature variation along the Li10 line is 5.0 °C, and the emissivity is 0.83 at time two. For the left foot of subject 5 at time two, the maximum temperature along the Li11 line positioned on the central side of the foot is 28.3 °C, and the minimum temperature is 23.2 °C. The temperature variation along the Li11 line is 5.1 °C, and the emissivity is 0.83 at time two. On the side along the Li12 line, the maximum temperature is 26.5 °C, and the minimum temperature is 22.6 °C at time two. The temperature variation along the Li12 line is 3.9 °C, and the emissivity is 0.83 at time two.
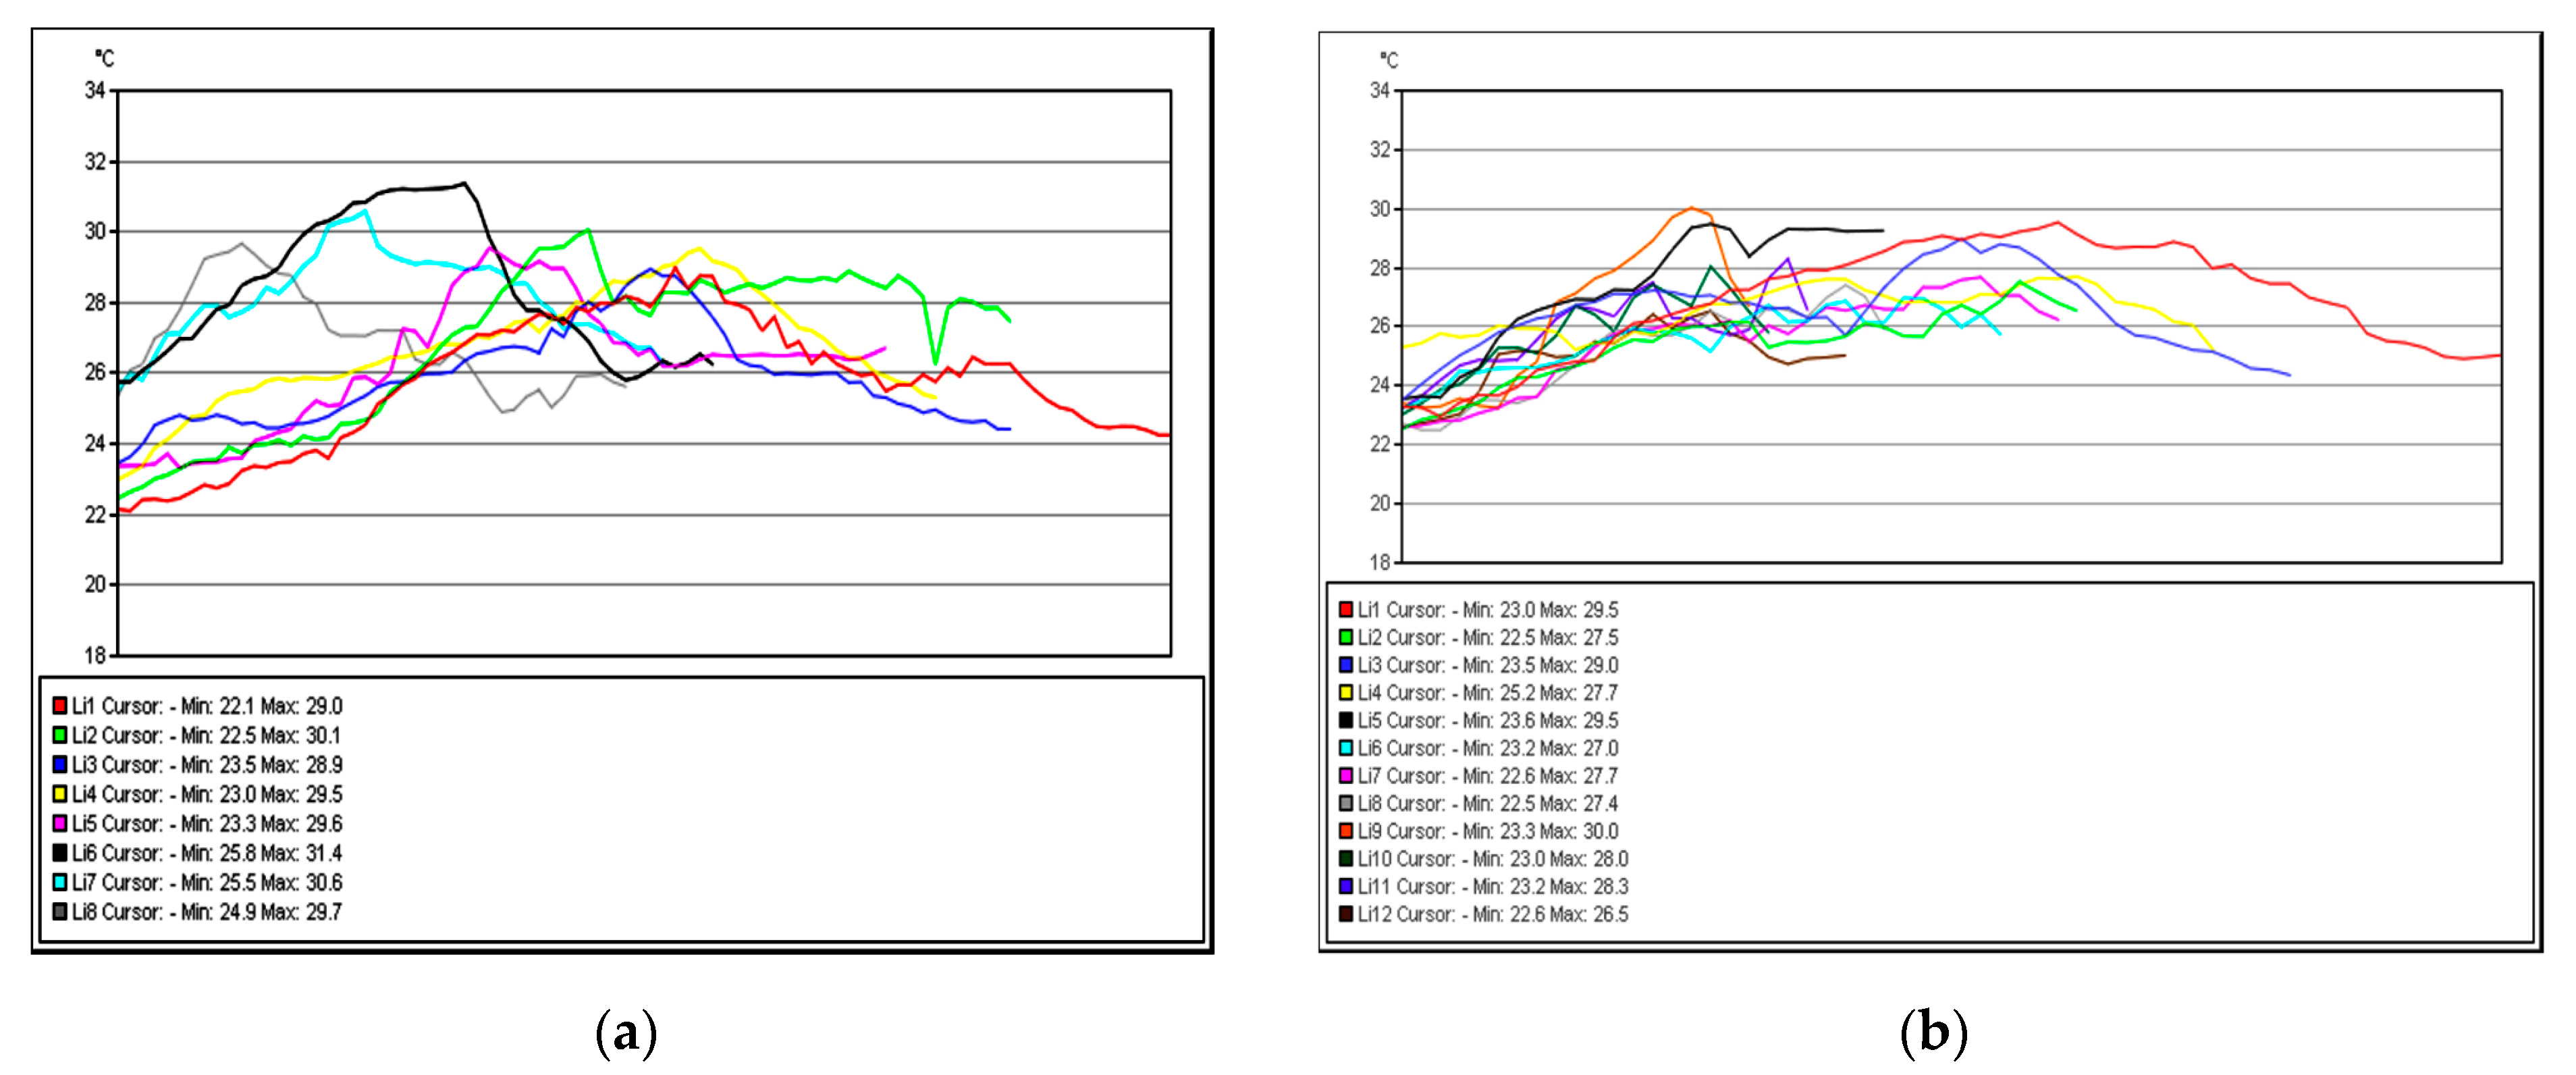
Figure 22 shows the temperature variation along the subject lines on each footwear at time two.
The graphs in
Figure 23 show the temperature variation along the subject lines on each shoe at time two.
In the case of subject 1 at time two, as shown in
Figure 23, the relation obtained is a polynomial function of degree five (25).
The coefficient of determining R
2 established by the regression procedure is:
In the case of subject 2 at time two, as shown in
Figure 24, the relation obtained is a polynomial function of degree five (23).
The coefficient of determining R
2 established by the regression procedure is:
In the case of subject 3 at time two, as shown in
Figure 25, the relation obtained is a polynomial function of degree four (29).
The coefficient of determining R
2 established by the regression procedure is:
In the case of subject 4 at time two, as shown in
Figure 26, the relation obtained is a polynomial function of degree six (31).
The coefficient of determining R
2 established by the regression procedure is:
In the case of subject 5 at time two, as shown in
Figure 27, the relation obtained is a polynomial function of degree five (33).
The coefficient of determining R
2 established by the regression procedure is:
As shown in
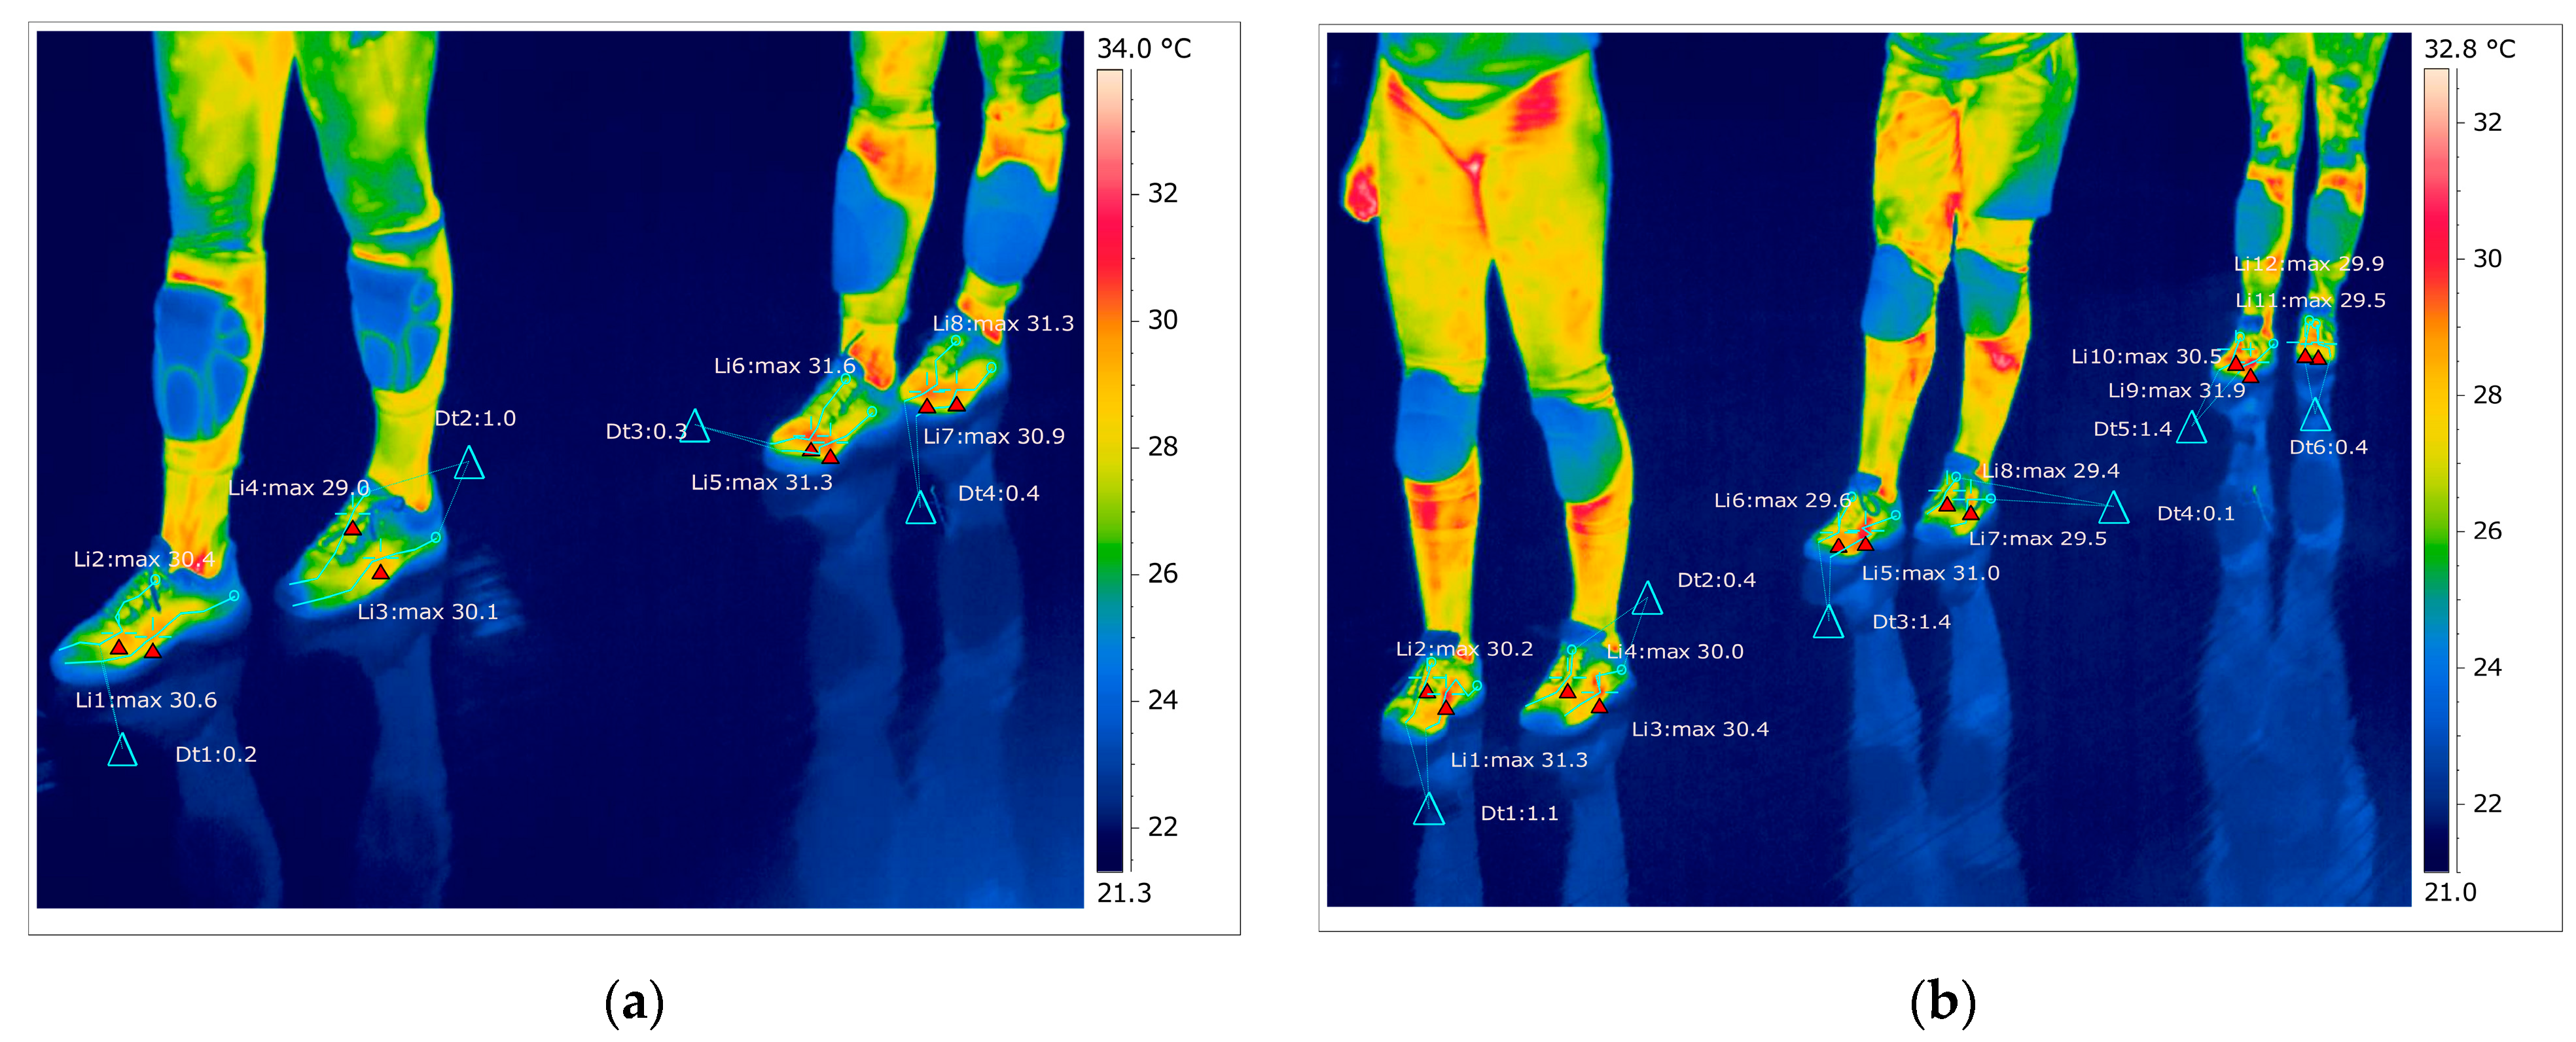
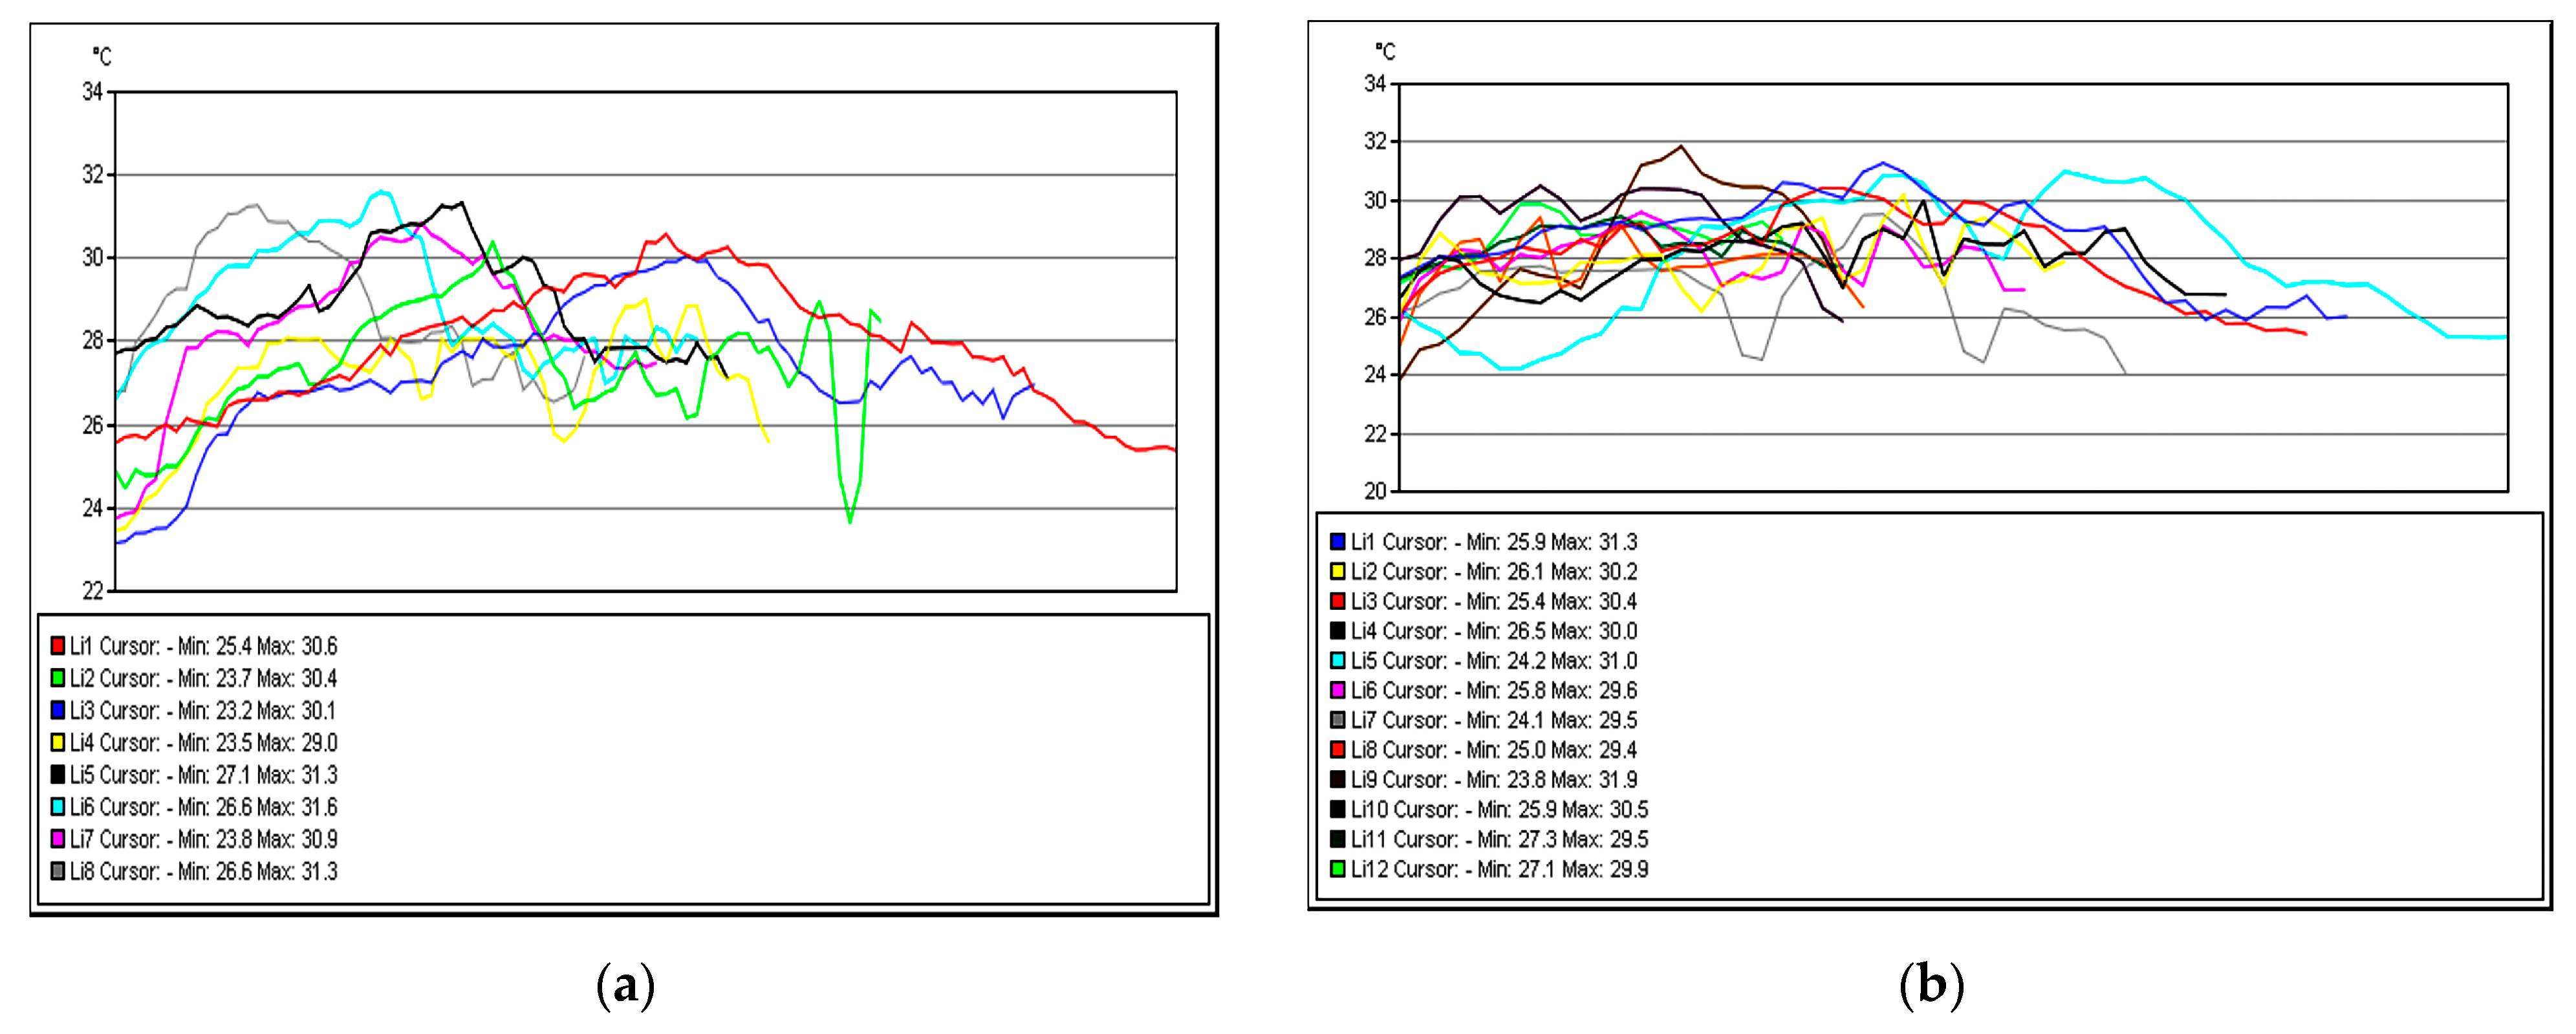
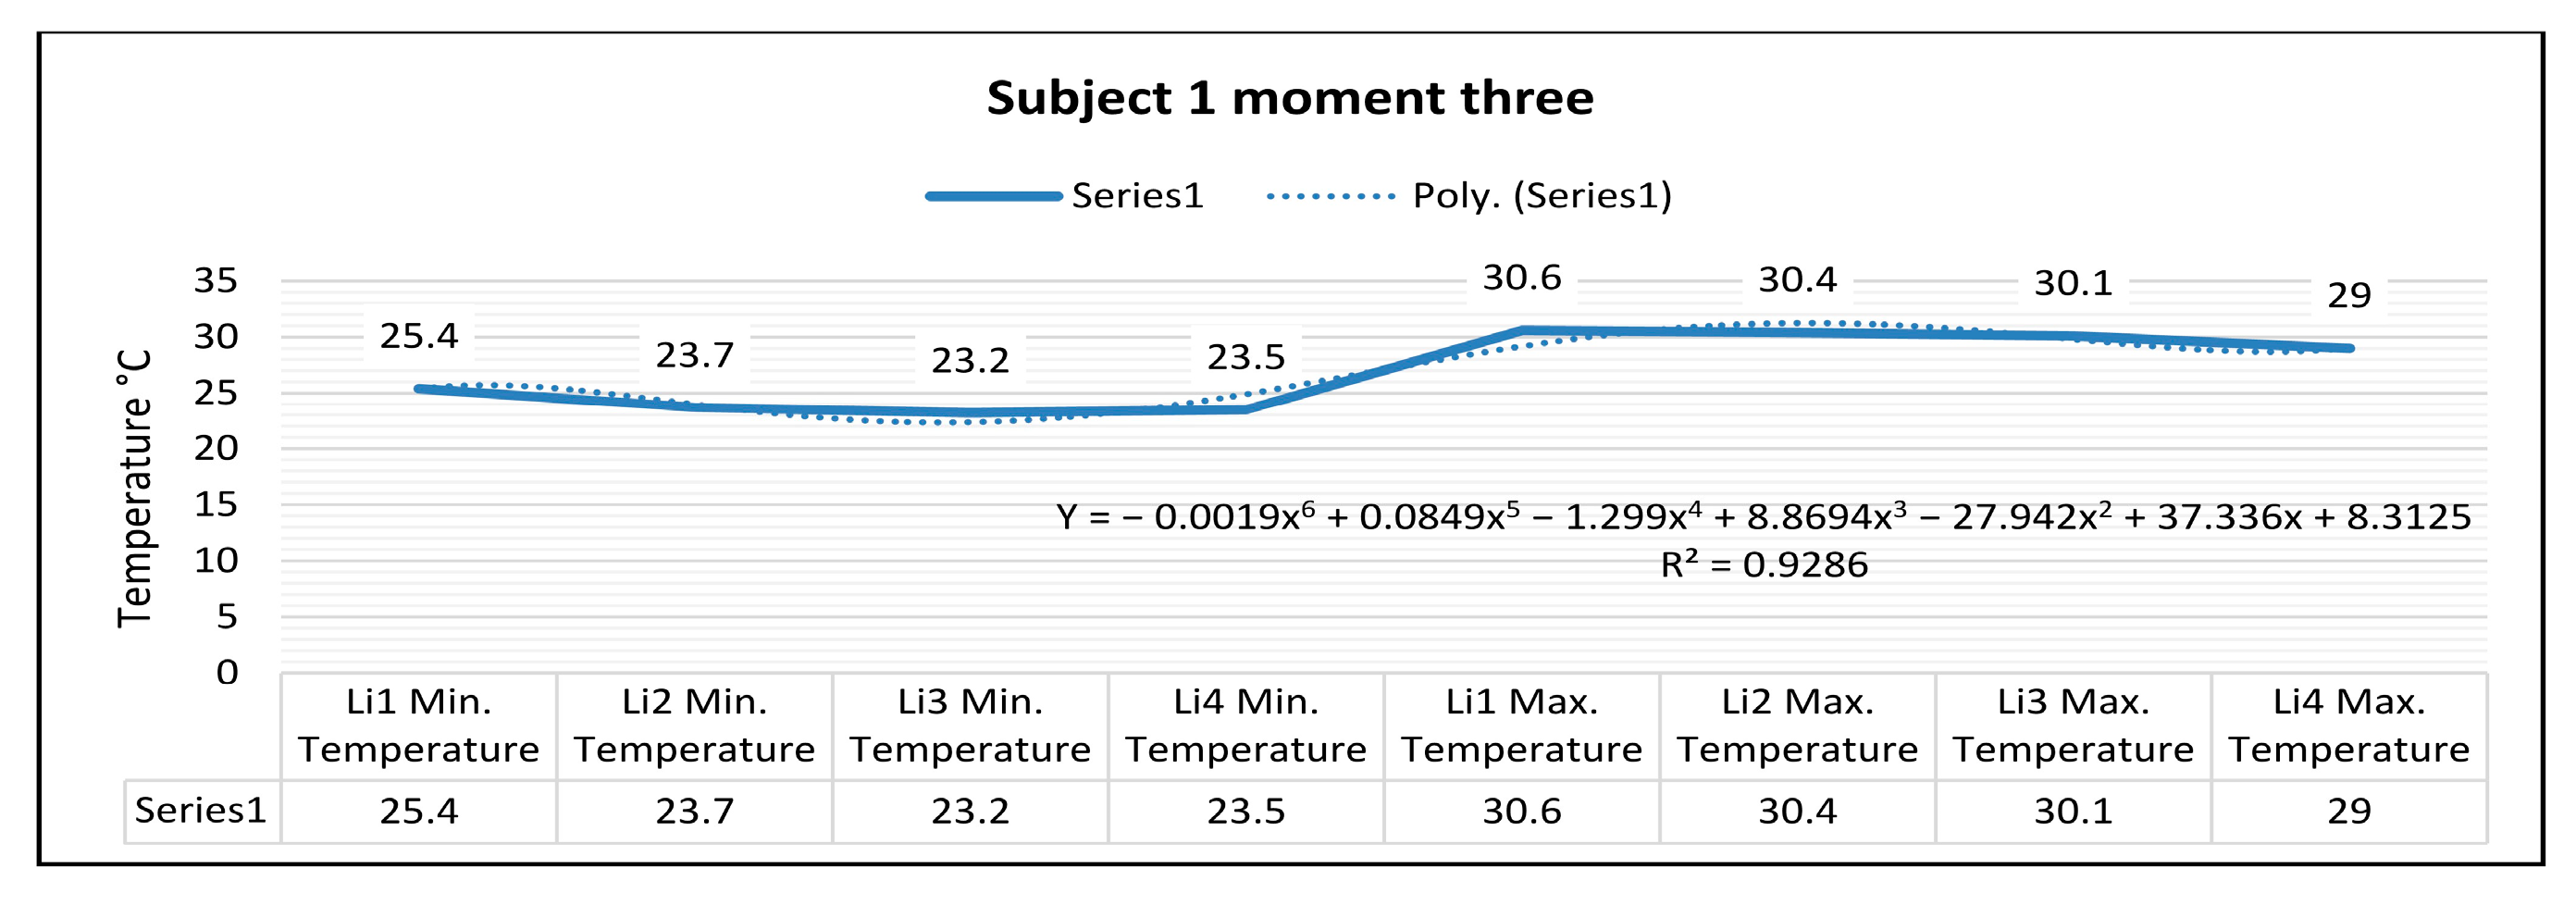
Figure 28, for the right foot of subject 1 at time three (15 min of training), the maximum temperature along the line Li1, which is positioned on the center of the foot, is 30.6 °C, and the minimum temperature is 25.4 °C.
The temperature variation along the Li1 line is 5.2 °C, and the emissivity is 0.83 at time three. On the side along the Li2 line, the maximum temperature is 30.4 °C, and the minimum temperature is 23.7 °C, at time three. The temperature variation along the Li2 line is 6.7 °C, and the emissivity is 0.83 at time three. For the left foot of subject 1 at time three, the maximum temperature along the Li3 line positioned on the central side is 30.1 °C, and the minimum temperature is 23.2 °C. The temperature variation along the Li3 line is 6.9 °C, and the emissivity is 0.83, for subject 1 at time three. On the side along the Li4 line, the maximum temperature is 29.0 °C, and the minimum temperature is 23.5 °C, for subject 1 at time three. The temperature variation along the Li4 line is 5.6 °C, and the emissivity is 0.83, for subject 1 at time three.
In
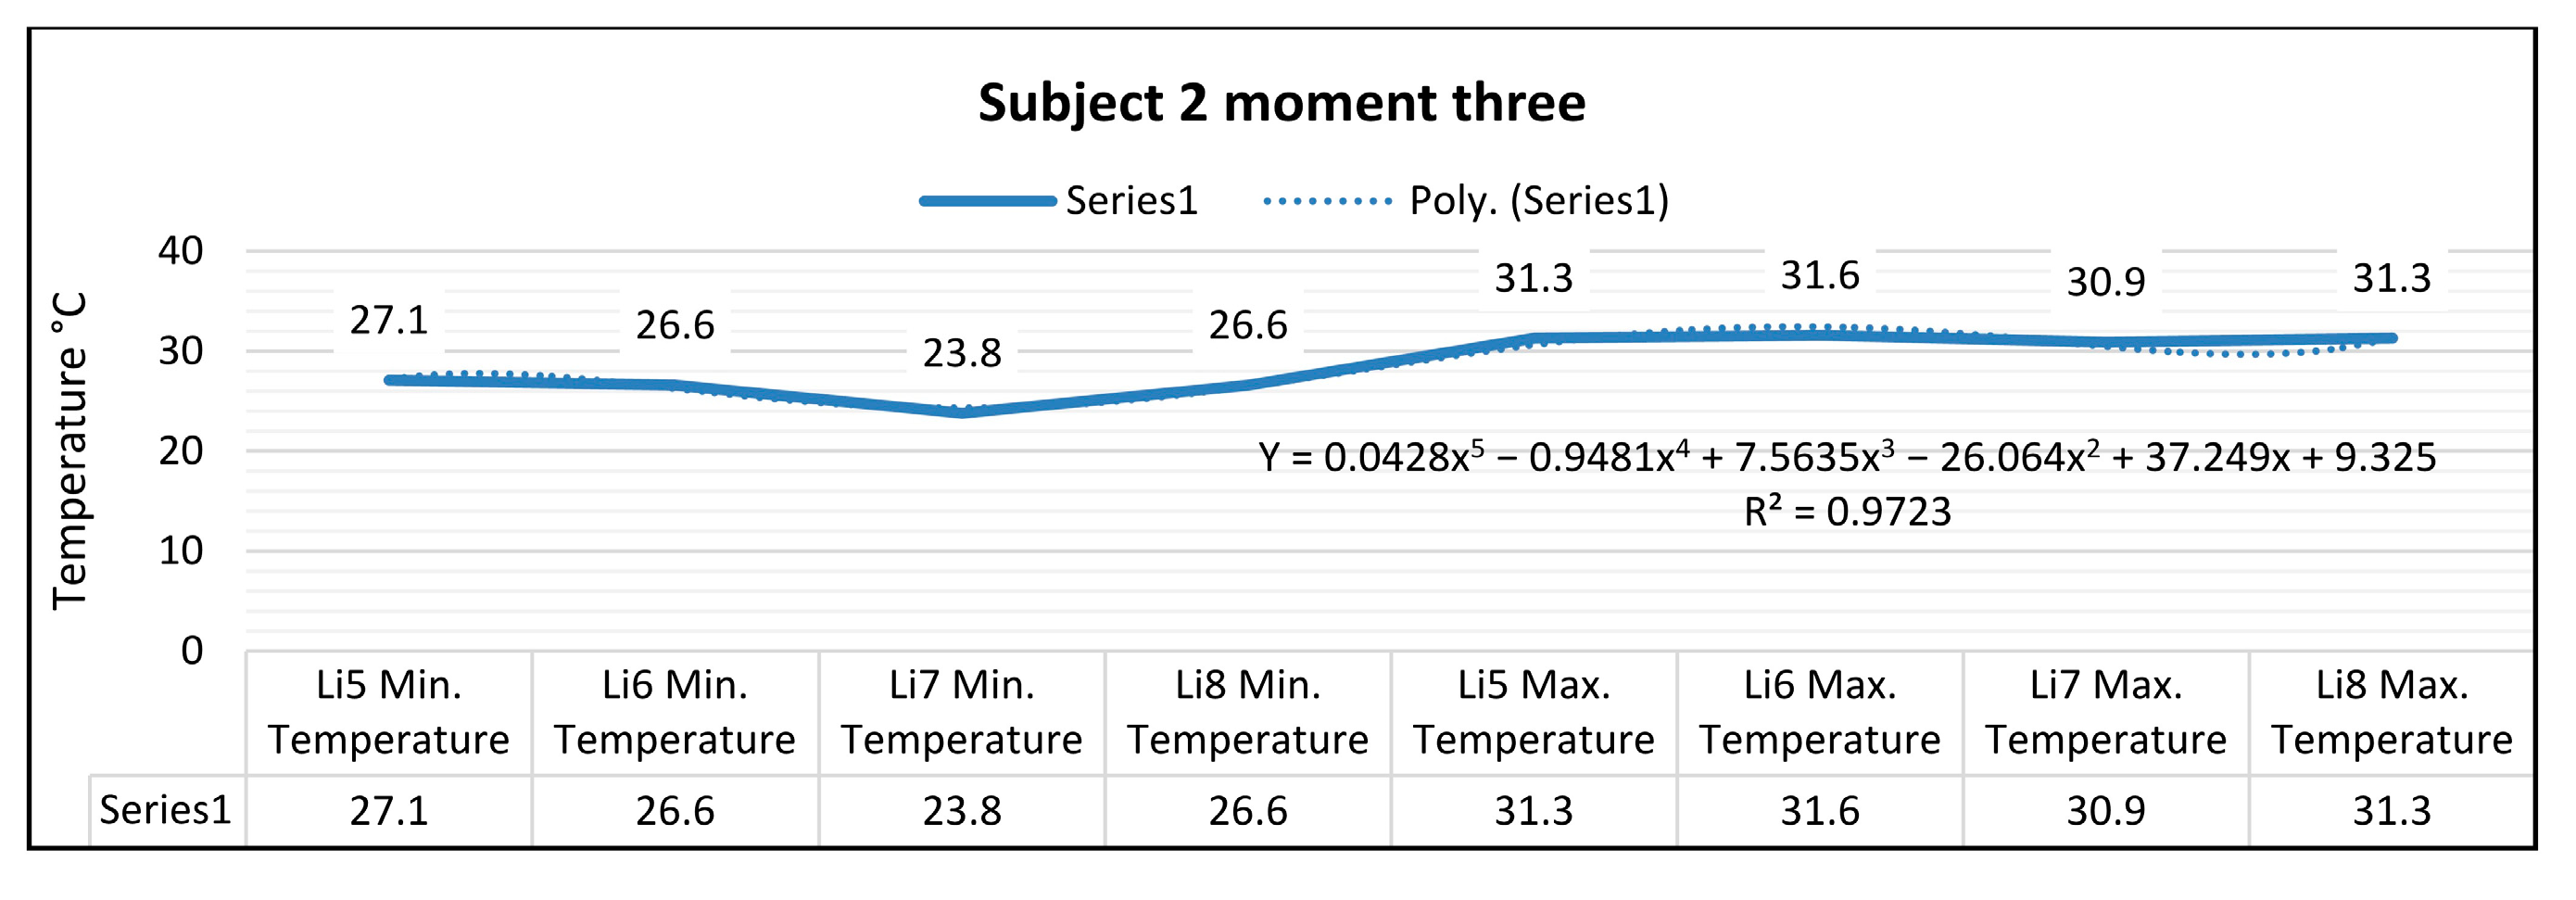
Figure 28, for the right foot of subject 2 at time three (15 min of training), the maximum temperature along the Li5 line, which is positioned on the center of the leg, is 31.3 °C, and the minimum temperature is 27.1 °C. The temperature variation along the Li5 line is 4.2 °C, and the emissivity is 0.83 at time three. On the side along the Li6 line, the maximum temperature is 31.6 °C, and the minimum temperature is 26.6 °C at time three.
The temperature variation along the Li6 line is 5.0 °C, and the emissivity is 0.83 at time three. For the left foot of subject 2 at time three, the maximum temperature along the Li7 line positioned on the central side is 30.9 °C, and the minimum temperature is 23.8 °C. The temperature variation along the Li7 line is 7.1 °C, and the emissivity is 0.83 at time three.
On the side along the Li8 line, the maximum temperature is 31.3 °C, and the minimum temperature is 26.6 °C at time three. The temperature variation along the Li8 line is 4.7 °C, and the emissivity is 0.83 at time three.
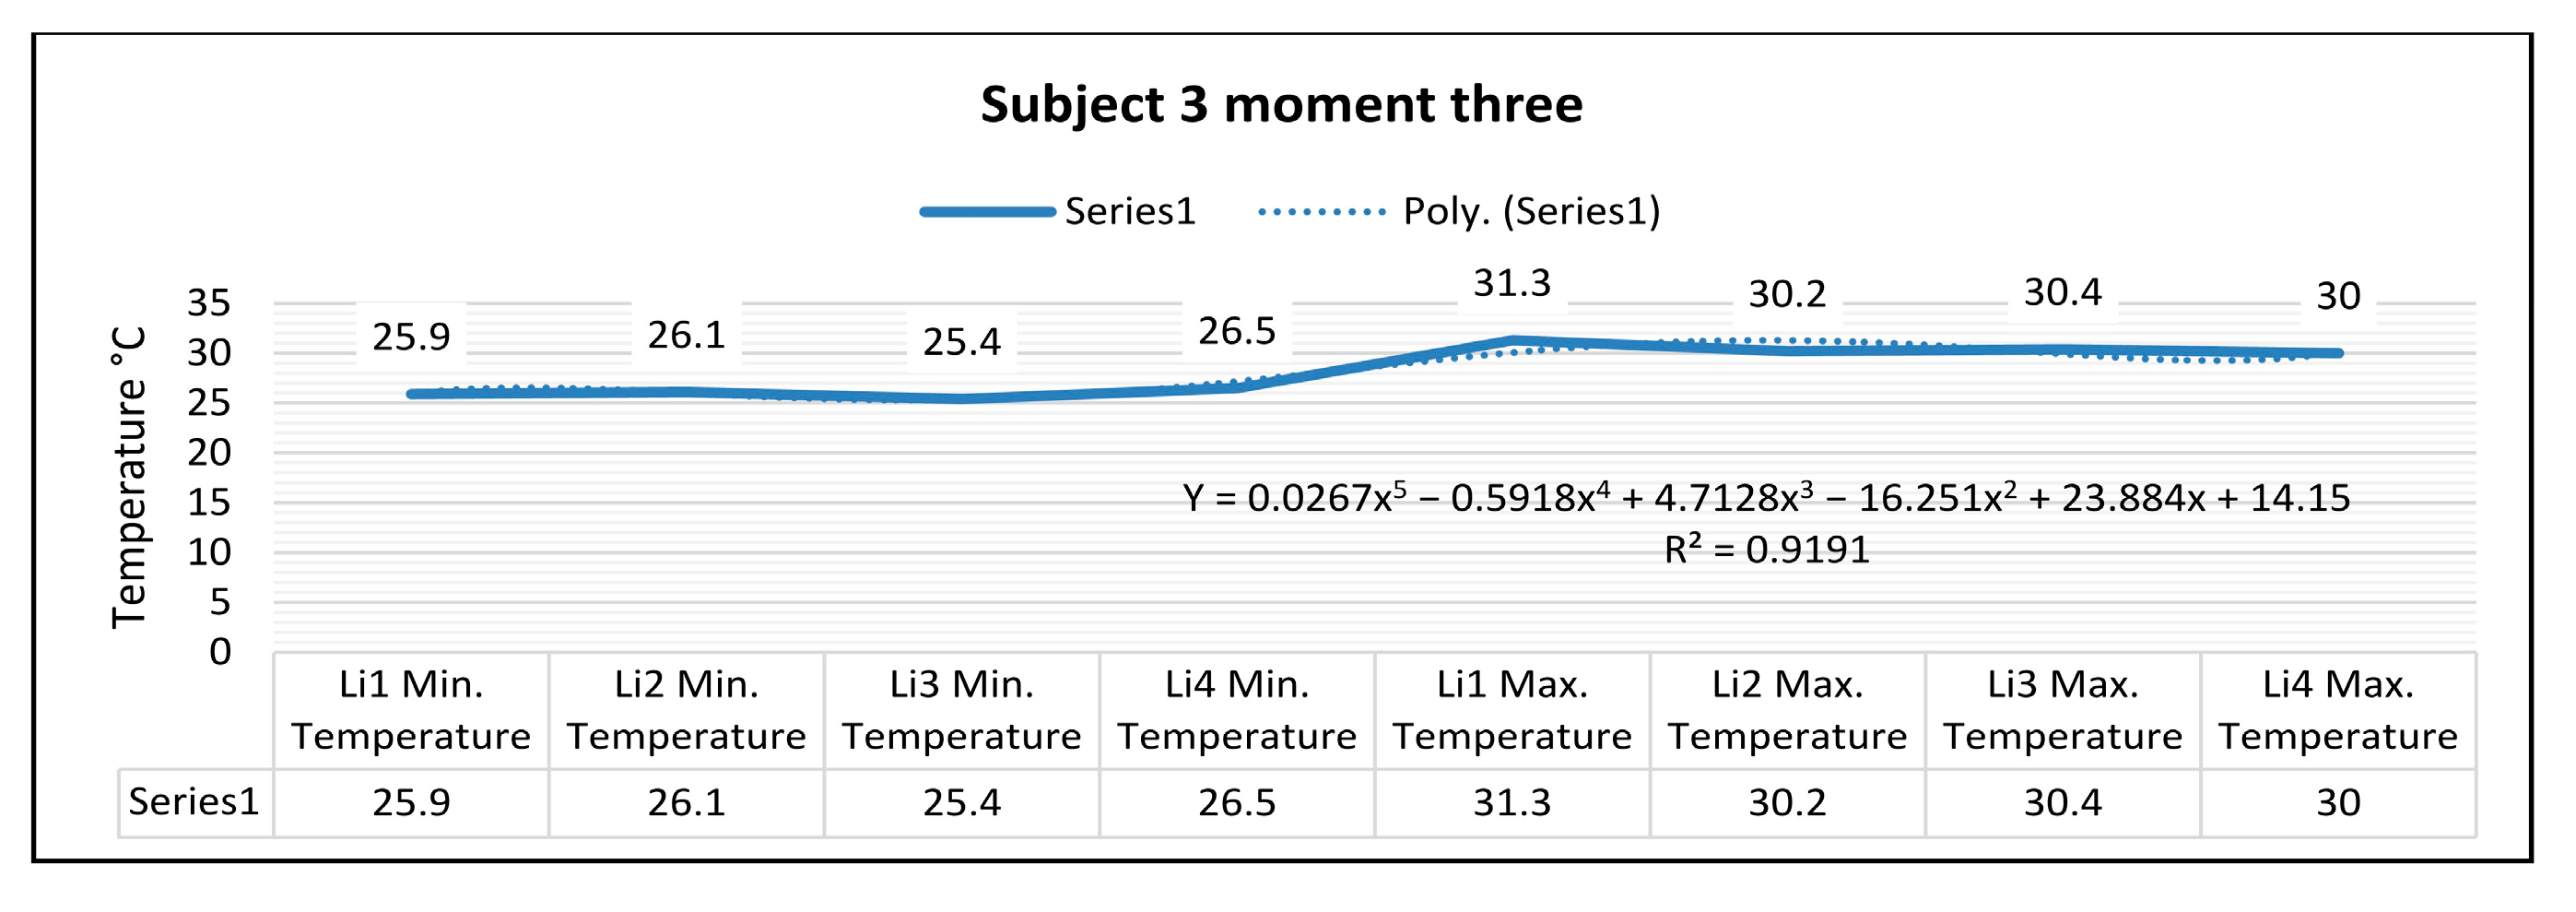
Thermography measurements for subject 3 for the right foot at time three (15 min of training) show that the maximum temperature along the Li1 line, which is positioned on the center of the foot, is 31.3 °C, and the minimum temperature is 25.9 °C.
The temperature variation along the Li1 line is 5.4 °C, and the emissivity is 0.83 at time three.
On the side along the Li2 line, the maximum temperature is 30.2 °C, and the minimum temperature is 26.1 °C at time three. The temperature variation along the Li2 line is 4.1 °C, and the emissivity is 0.83 at time three.
For the left foot of subject 3 at time three, the maximum temperature along the Li3 line positioned on the central side is 30.4 °C, and the minimum temperature is 25.4 °C. The temperature variation along the Li3 line is 5.0 °C, and the emissivity is 0.83 at time three.
On the side along the Li4 line, the maximum temperature is 30.2 °C, and the minimum temperature is 26.5 °C at time three. The temperature variation along the Li4 line is 3.5 °C, and the emissivity is 0.83 at time three.
In
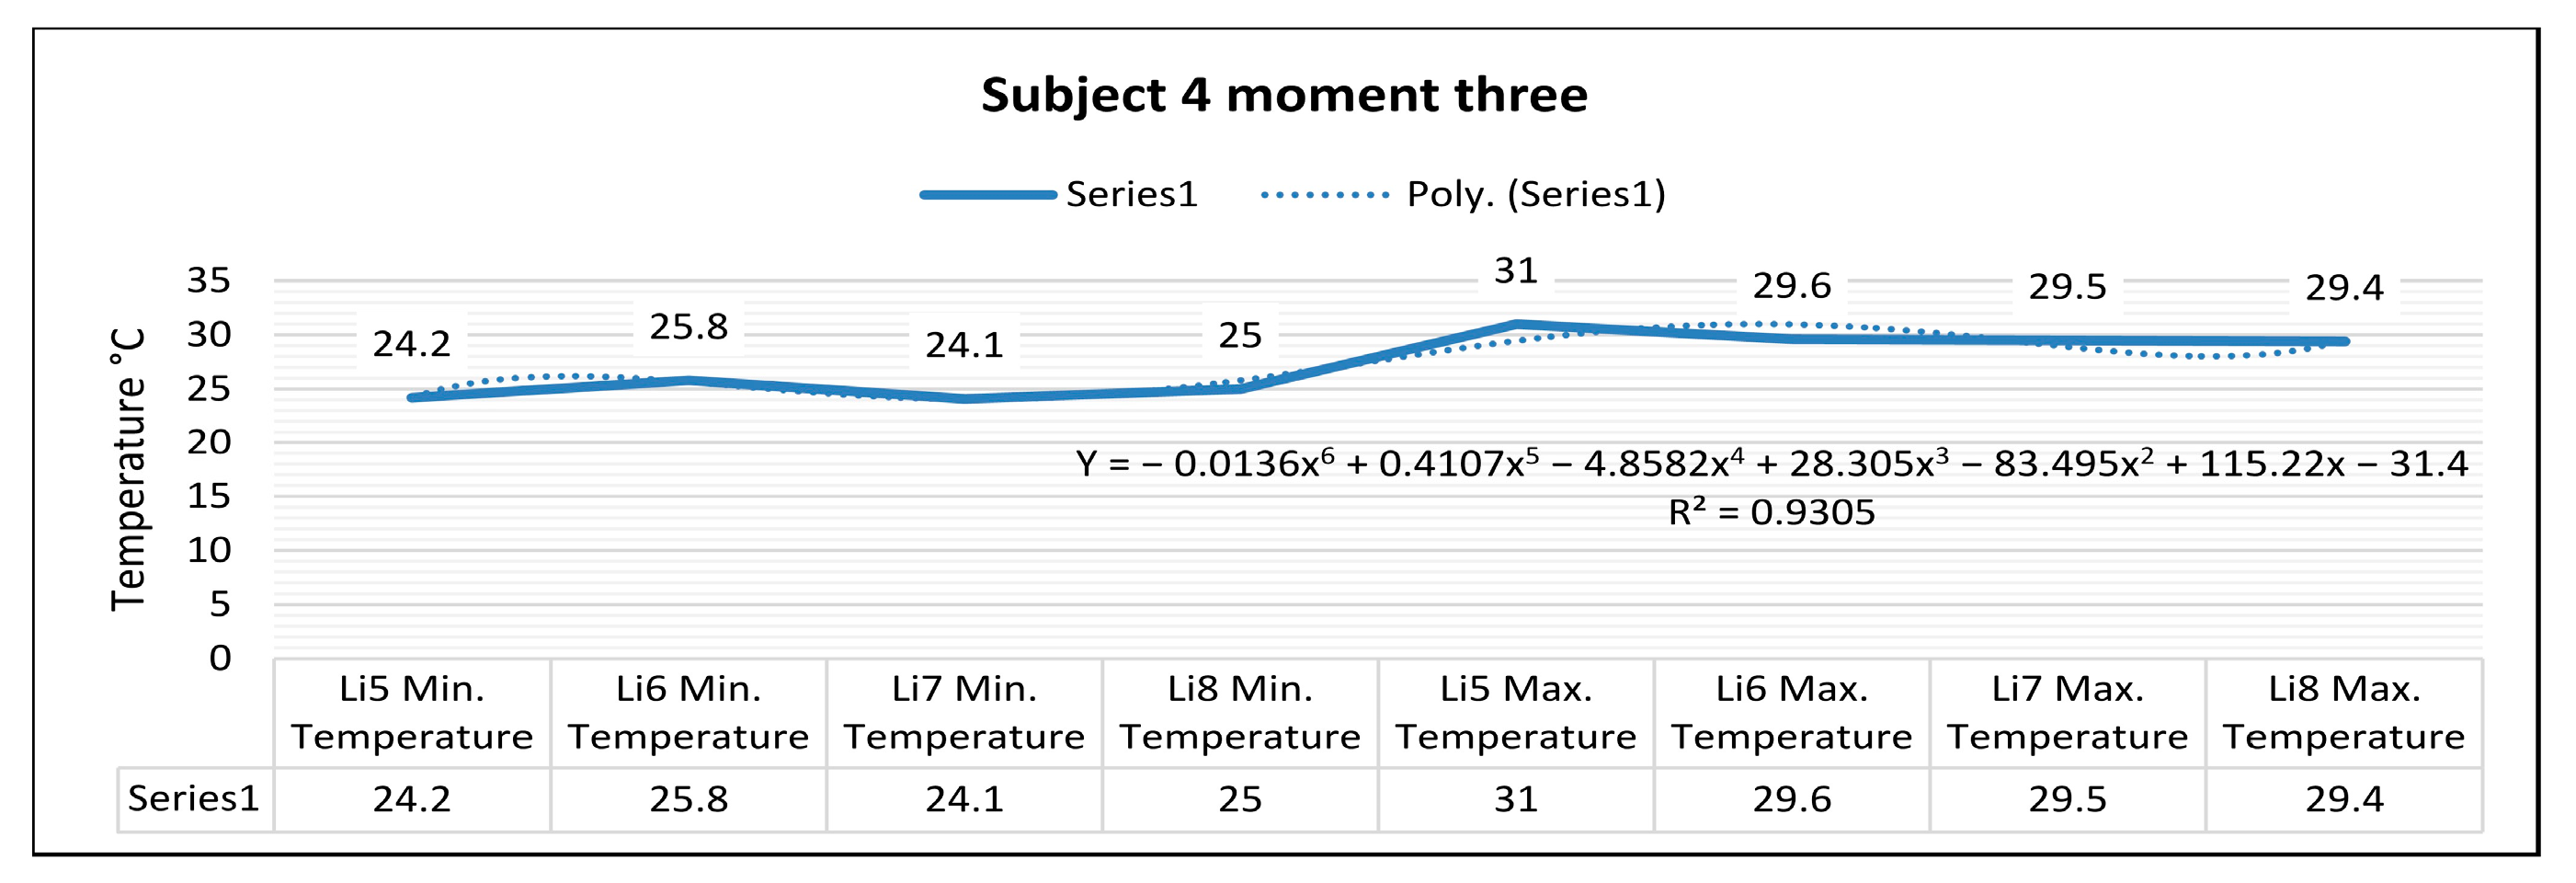
Figure 28, for the right foot of subject 4 at time three (15 min of training), the maximum temperature along the Li5 line, which is positioned on the central part of the leg, is 31.0 °C, and the minimum temperature is 24.2 °C.
The temperature variation along the Li5 line is 6.8 °C, and the emissivity is 0.83 at time three. On the side along the Li6 line, the maximum temperature is 29.6 °C, and the minimum temperature is 25.8 °C, at time three. The temperature variation along the line is 3.8 °C, and the emissivity is 0.83, at time three.
For the left foot of subject 4 at time three, the maximum temperature along the Li7 line positioned on the central side is 29.5 °C, and the minimum temperature is 24.1 °C. The temperature variation along the Li7 line is 5.4 °C, and the emissivity is 0.83 at time three.
On the side along the Li8 line, the maximum temperature is 29.4 °C, and the minimum temperature is 25.0 °C, at time three. The temperature variation along the Li8 line is 4.5 °C, and the emissivity is 0.83 at time three.
In
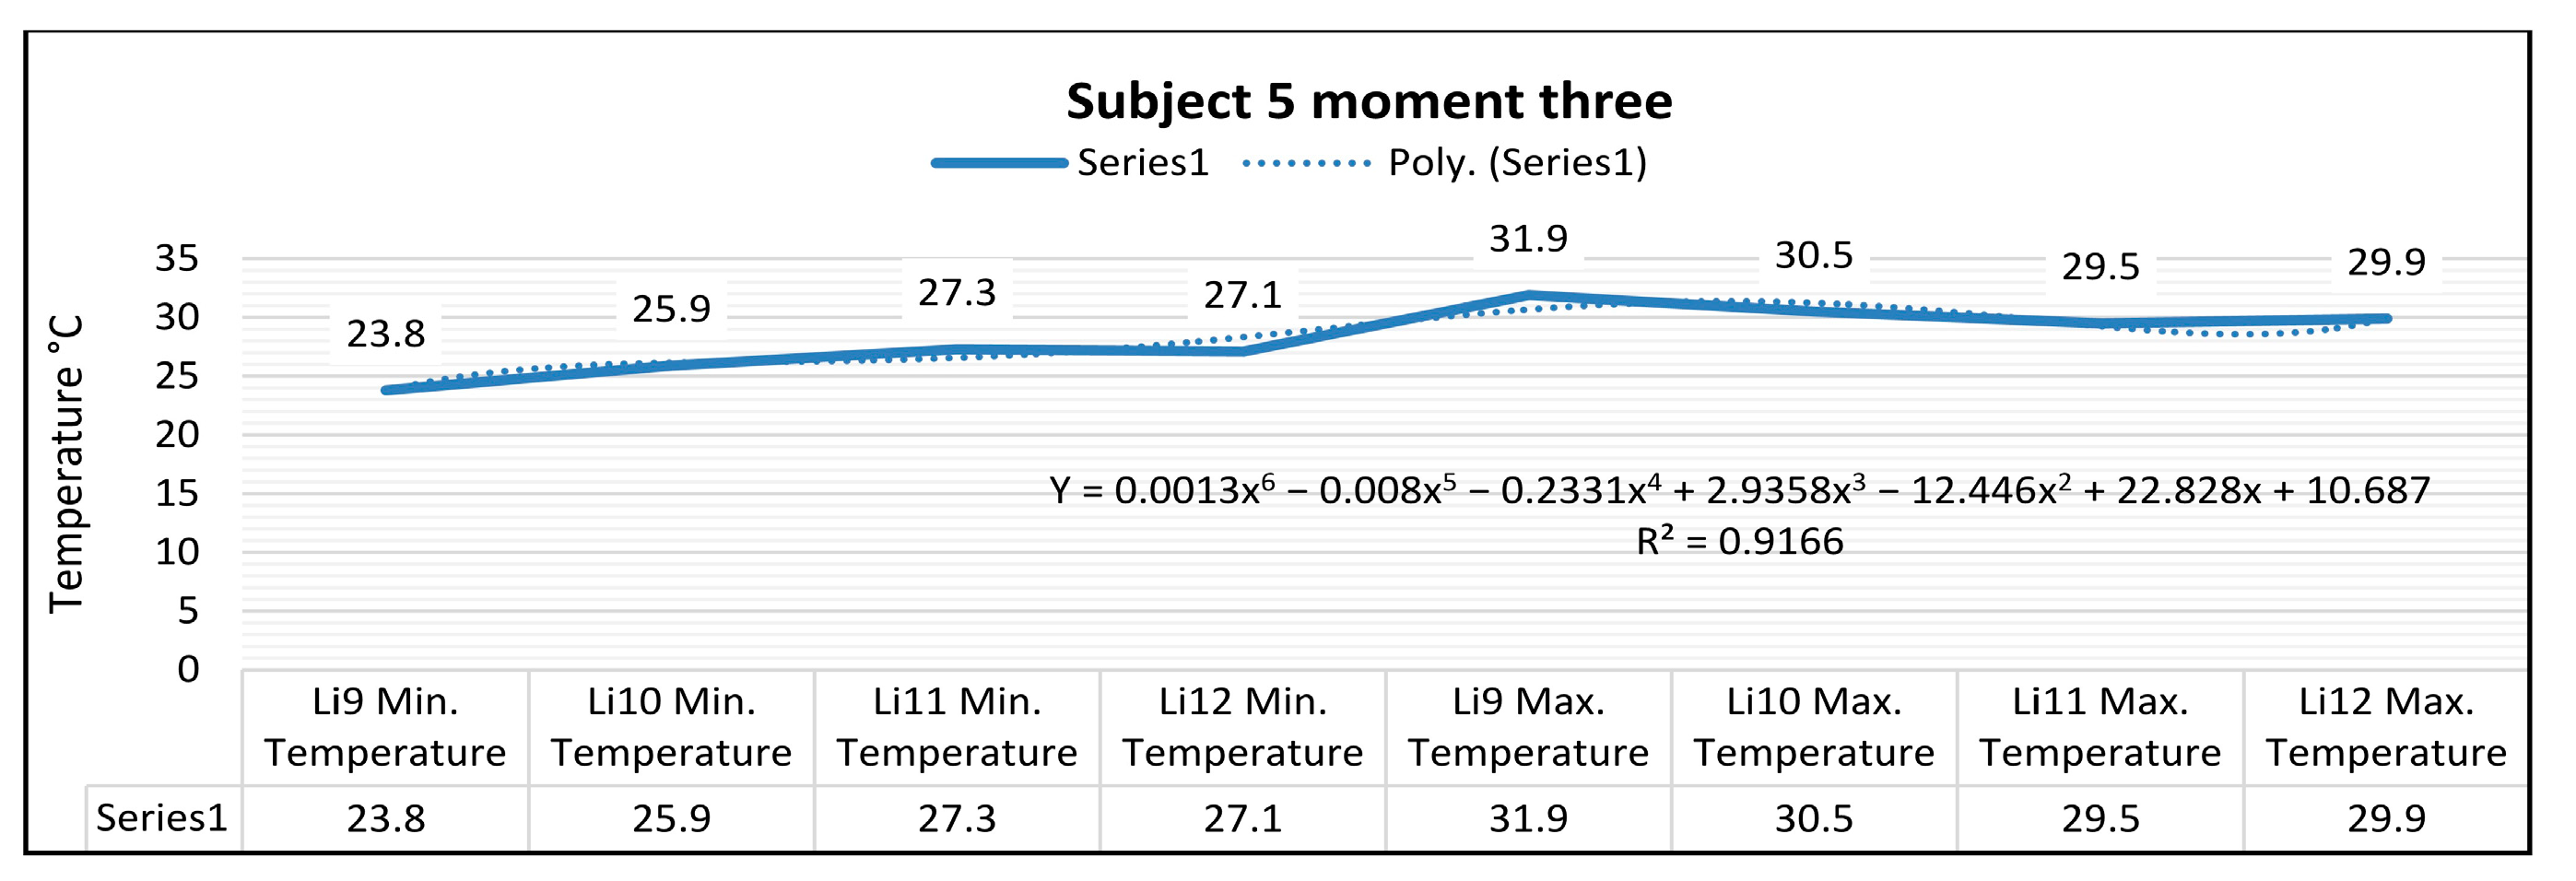
Figure 28, for the right foot of subject 5 at time three (15 min of training), the maximum temperature along the Li9 line, which is positioned on the center of the leg, is 31.9 °C, and the minimum temperature is 23.8 °C.
The temperature variation along the Li9 line is 8.0 °C, and the emissivity is 0.83 at time three. On the side along the Li10 line, the maximum temperature is 30.5 °C, and the minimum temperature is 25.9 °C at time three. The temperature variation along the Li10 line is 4.6 °C, and the emissivity is 0.83 at time three.
For the left foot of subject 5 at time three, the maximum temperature along the Li11 line positioned on the central side is 29.5 °C, and the minimum temperature is 27.3 °C. The temperature variation along the Li11 line is 2.2 °C, and the emissivity is 0.83 at time three.
On the side along the Li12 line, the maximum temperature is 29.9 °C, and the minimum temperature is 27.1 °C, at time three. The temperature variation along the Li12 line is 2.7 °C, and the emissivity is 0.83 at time three.
Figure 29 shows the temperature variation along the subject lines on each shoe at time three.
In the case of subject 1 at time three, as shown in
Figure 30, the relation obtained is a polynomial function of degree six (35).
The coefficient of determining R
2 established by the regression procedure is:
In the case of subject 2 at time three, as shown in
Figure 31, the relation obtained is a polynomial function of degree five (37).
The coefficient of determining R
2 established by the regression procedure is:
In the case of subject 3 at time three as shown in
Figure 32, the relation obtained is a polynomial function of degree five (39).
The coefficient of determining R
2 established by the regression procedure is:
In the case of subject 4 at time three, as shown in
Figure 33, the relation obtained is a polynomial function of degree six (41).
The coefficient of determining R
2 established by the regression procedure is:
In the case of subject 5 at time three, as shown in
Figure 34, the relation obtained is a polynomial function of degree six (43).
The coefficient of determining R
2 established by the regression procedure is:
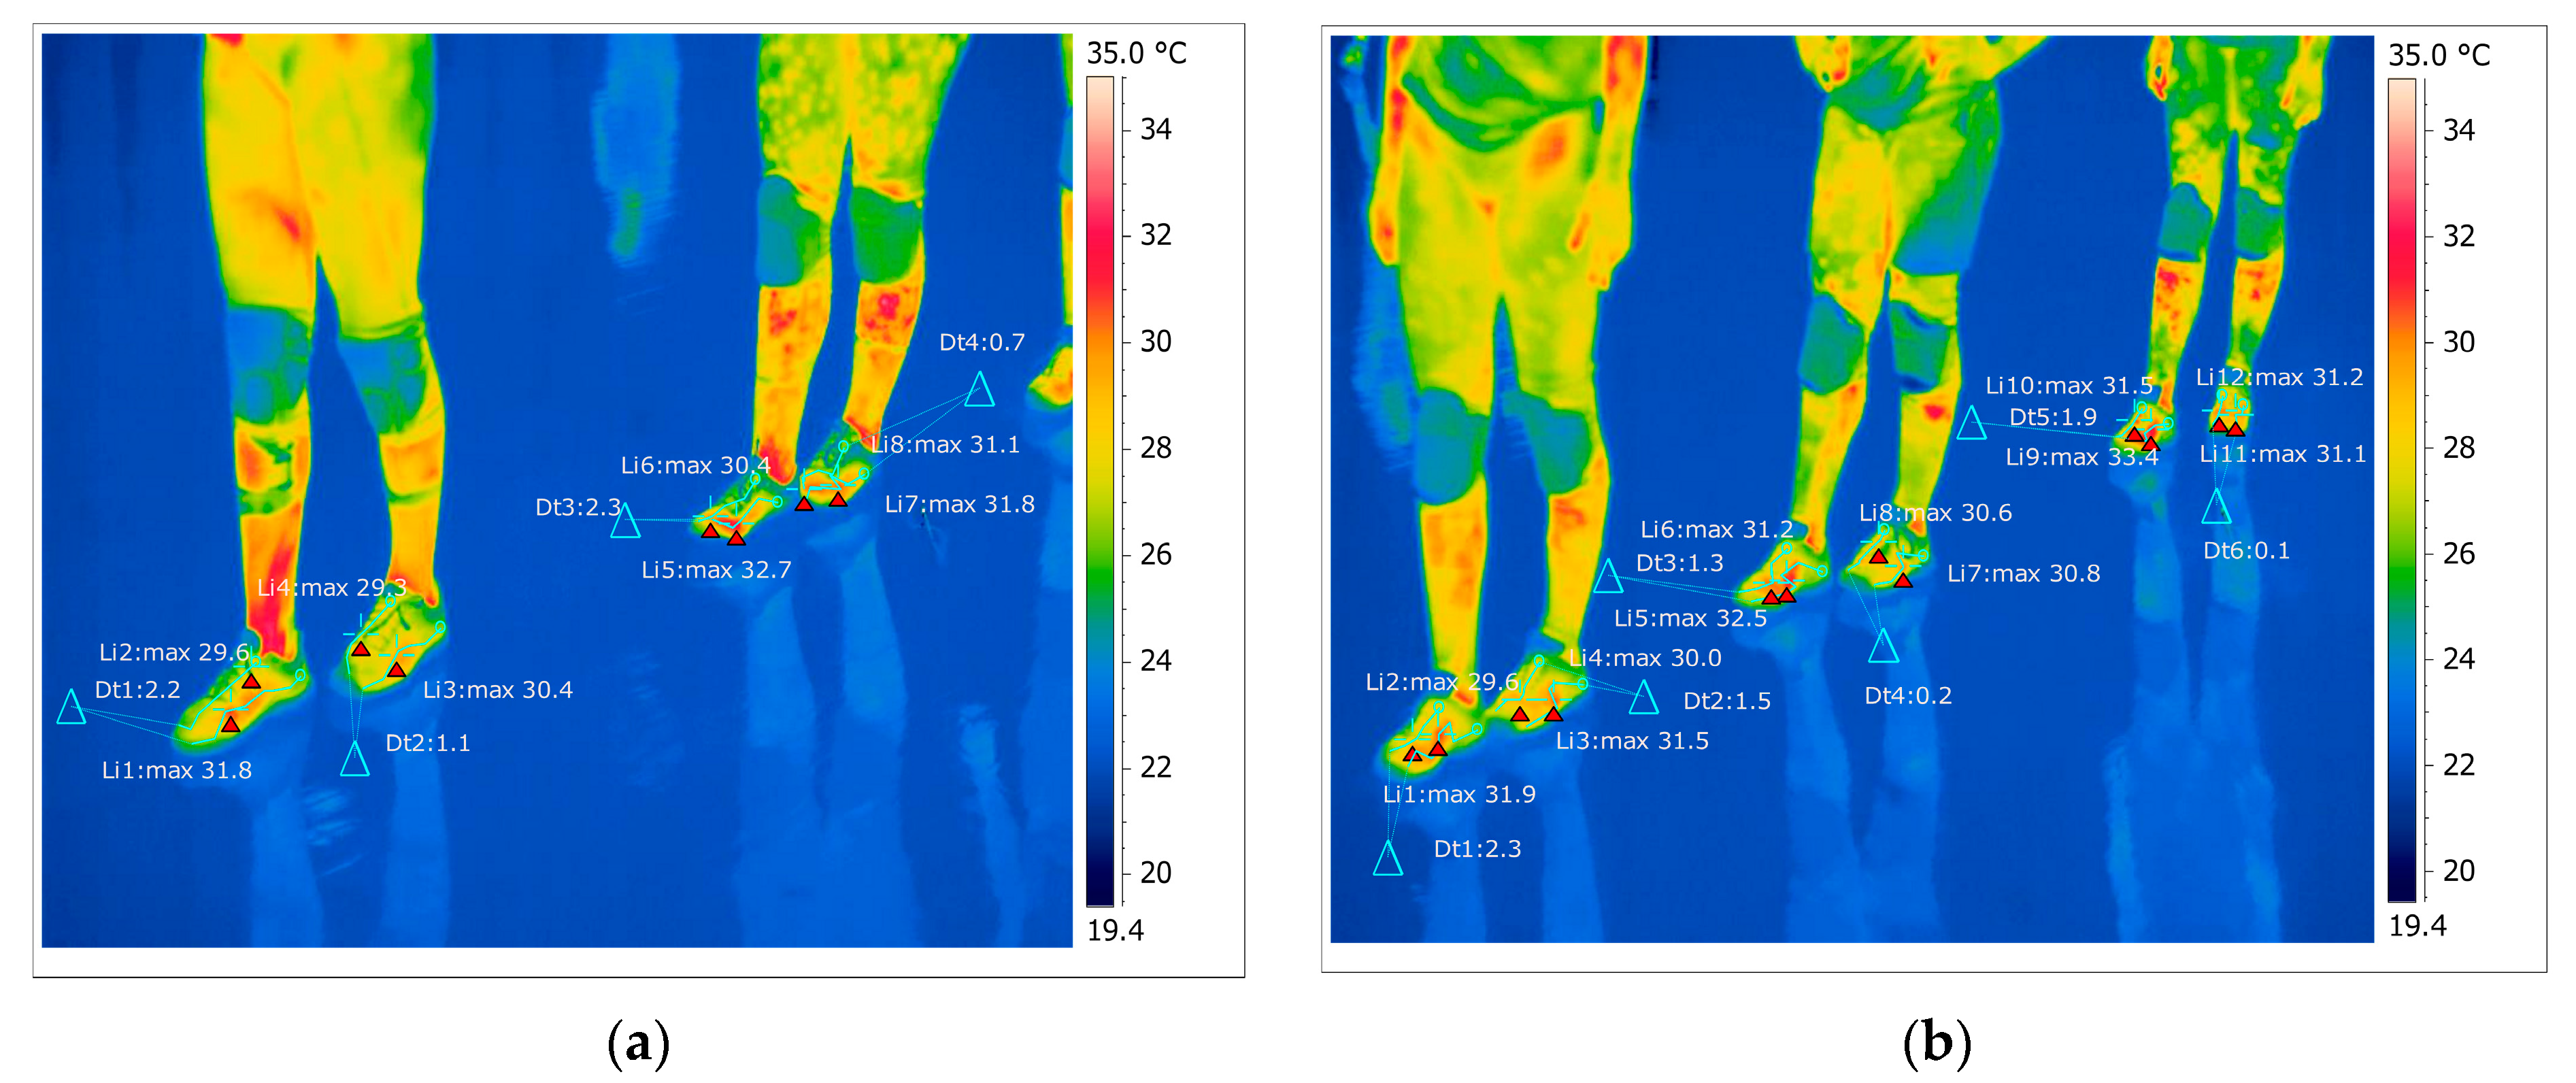
As shown in
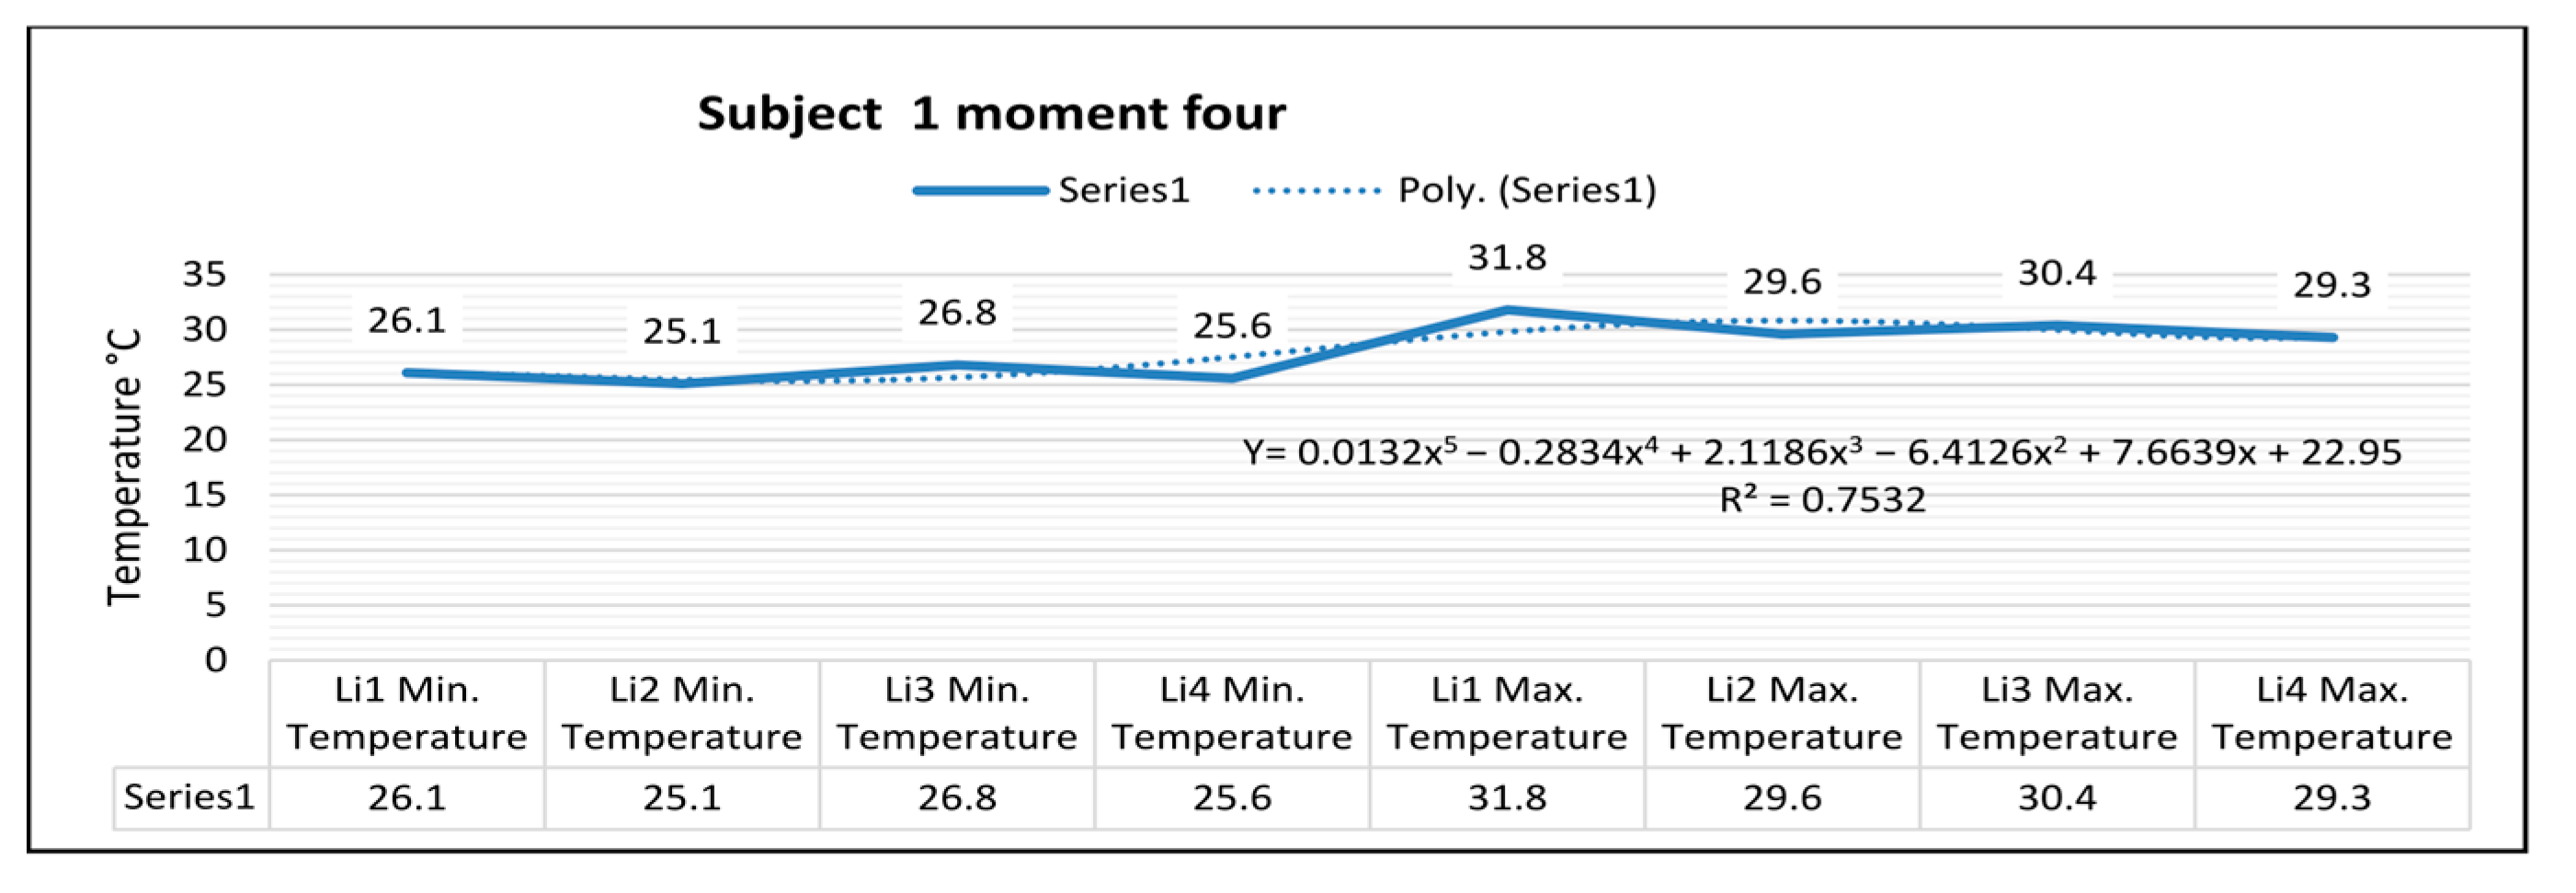
Figure 35, for the right foot of subject 1 at time four (at the end of volleyball training), the maximum temperature along the line Li1, which is positioned on the center of the foot, is 31.8 °C, and the minimum temperature is 26.1 °C. The temperature variation along the Li1 line is 5.7 °C, and the emissivity is 0.83 at time four. On the side along the Li2 line, the maximum temperature is 29.6 °C, and the minimum temperature is 25.1 °C at time four. The temperature variation along the Li2 line is 4.5 °C, and the emissivity is 0.83 at time four.
For the left foot of subject 1 at time four, the maximum temperature along the Li3 line positioned on the central side is 30.4 °C, and the minimum temperature is 26.8 °C. The temperature variation along the Li3 line is 3.5 °C, and the emissivity is 0.83, for subject 1 at time four. On the side along the Li4 line, the maximum temperature is 29.3 °C, and the minimum temperature is 25.6 °C, for subject 1 at time four. The temperature variation along the Li4 line is 3.7 °C, and the emissivity is 0.83, for subject 1 at time four.
In
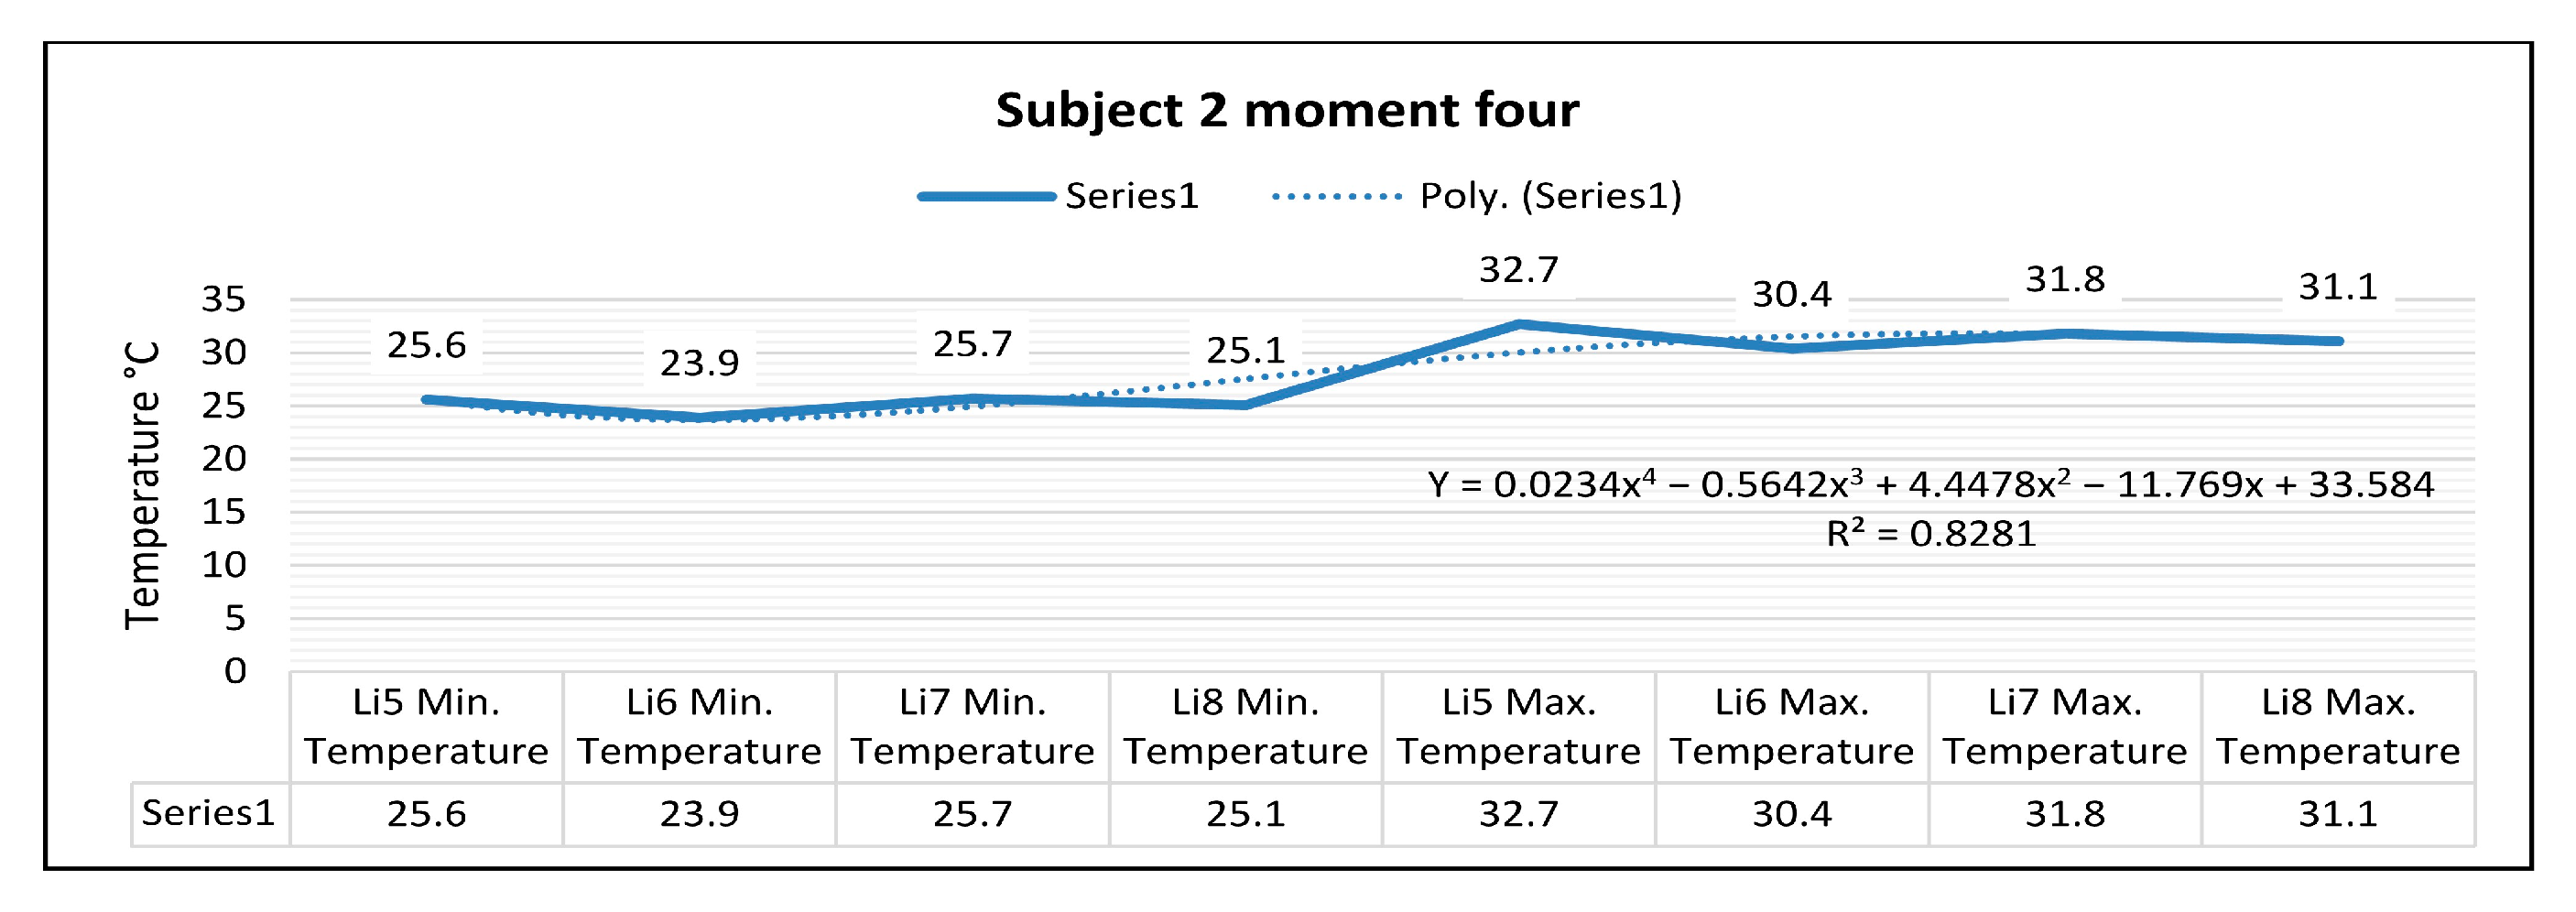
Figure 35, for the right foot of subject 2 at time four (at the end of the volleyball training), the maximum temperature along the line Li5, which is positioned on the central part of the foot, is 32.7 °C, and the minimum temperature is 25.6 °C.
The temperature variation along the Li5 line is 7.1 °C, and the emissivity is 0.83 at time four. On the side along the Li6 line, the maximum temperature is 30.4 °C, and the minimum temperature is 23.9 °C at time four. The temperature variation along the Li6 line is 6.5 °C, and the emissivity is 0.83 at time four.
For the left foot of subject 2 at time four, the maximum temperature along the Li7 line positioned on the central side is 31.8 °C, and the minimum temperature is 25.7 °C.
The temperature variation along the Li7 line is 6.0 °C, and the emissivity is 0.83 at time four.
On the side along the Li8 line, the maximum temperature is 31.1 °C, and the minimum temperature is 25.1 °C at time four. The temperature variation along the Li8 line is 5.9 °C, and the emissivity is 0.83 at time four.
Thermography measurements afferent for subject 3 for the right foot at time four (at the end of volleyball training) show that the maximum temperature along the Li1 line, which is positioned on the center of the foot, is 30.8 °C, and the minimum temperature is 26.8 °C.
The temperature variation along the Li1 line is 4.0 °C, and the emissivity is 0.83 at time four. On the side along the Li2 line, the maximum temperature is 29.4 °C, and the minimum temperature is 26.7 °C at time four.
The temperature variation along the Li2 line is 2.7 °C, and the emissivity is 0.83 at time four.
For the left foot of subject 3 at time four, the maximum temperature along the Li3 line positioned on the central side is 30.9 °C, and the minimum temperature is 26.9 °C.
The temperature variation along the Li3 line is 3.9 °C, and the emissivity is 0.83 at time four.
On the side along the Li4 line, the maximum temperature is 30.0 °C, and the minimum temperature is 27.5 °C, at moment four. The temperature variation along the Li4 line is 2.5 °C, and the emissivity is 0.83 at time four.
In
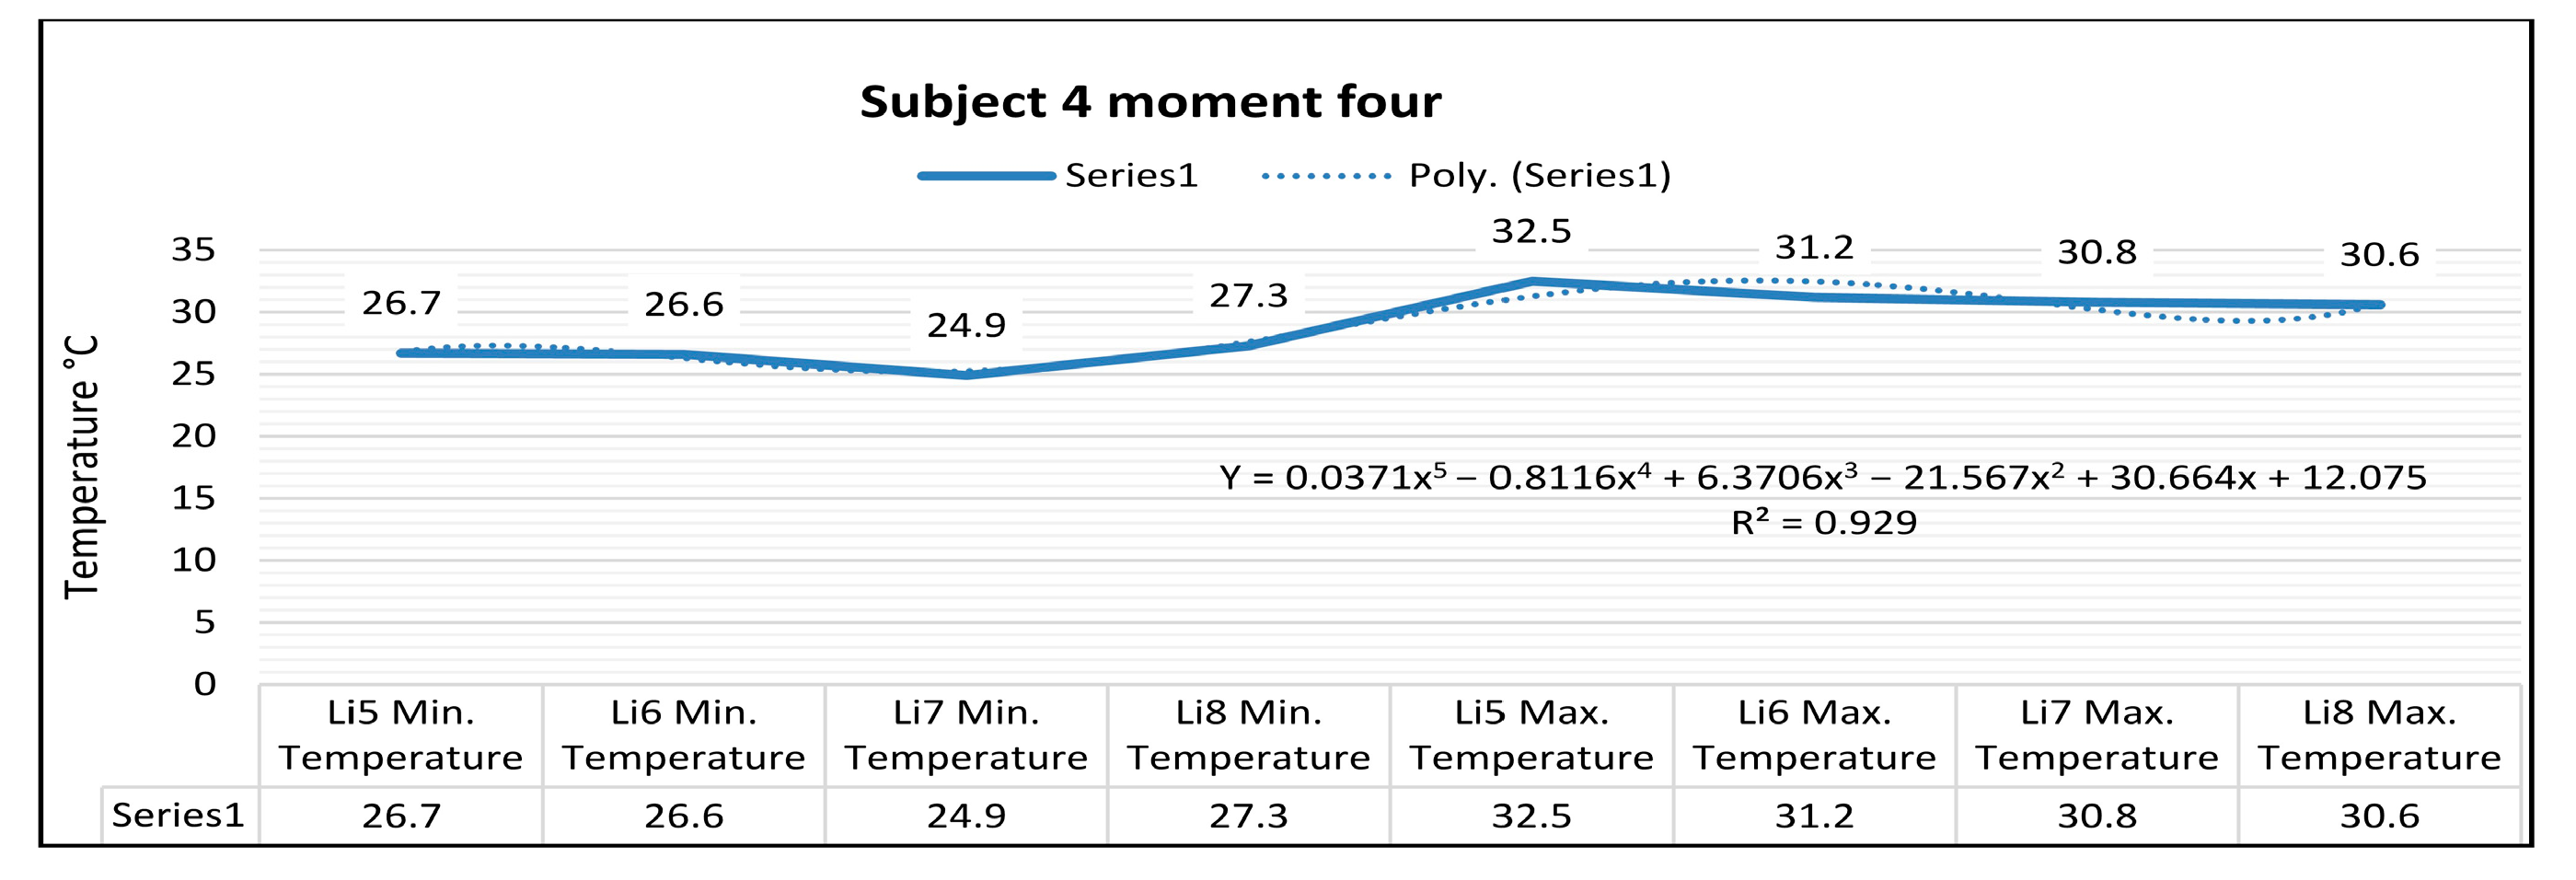
Figure 35, for the right foot of subject 4 at time four (at the end of volleyball training), the maximum temperature along the Li5 line, which is positioned on the center of the leg, is 32.5 °C, and the minimum temperature is 26.7 °C.
The temperature variation along the Li5 line is 5.8 °C, and the emissivity is 0.83 at time four. On the side along the Li6 line, the maximum temperature is 31.2 °C, and the minimum temperature is 26.6 °C at time four.
The temperature variation along the line is 4.6 °C, and the emissivity is 0.83 at time four. For the left foot of subject 4 at time four, the maximum temperature along the Li7 line positioned on the central side is 30.8 °C, and the minimum temperature is 24.9 °C.
The temperature variation along the Li7 line is 5.9 °C, and the emissivity is 0.83 at time four.
On the side along the Li8 line, the maximum temperature is 30.6 °C, and the minimum temperature is 27.3 °C at time four.
The temperature variation along the Li8 line is 3.3 °C, and the emissivity is 0.83 at time four.
In
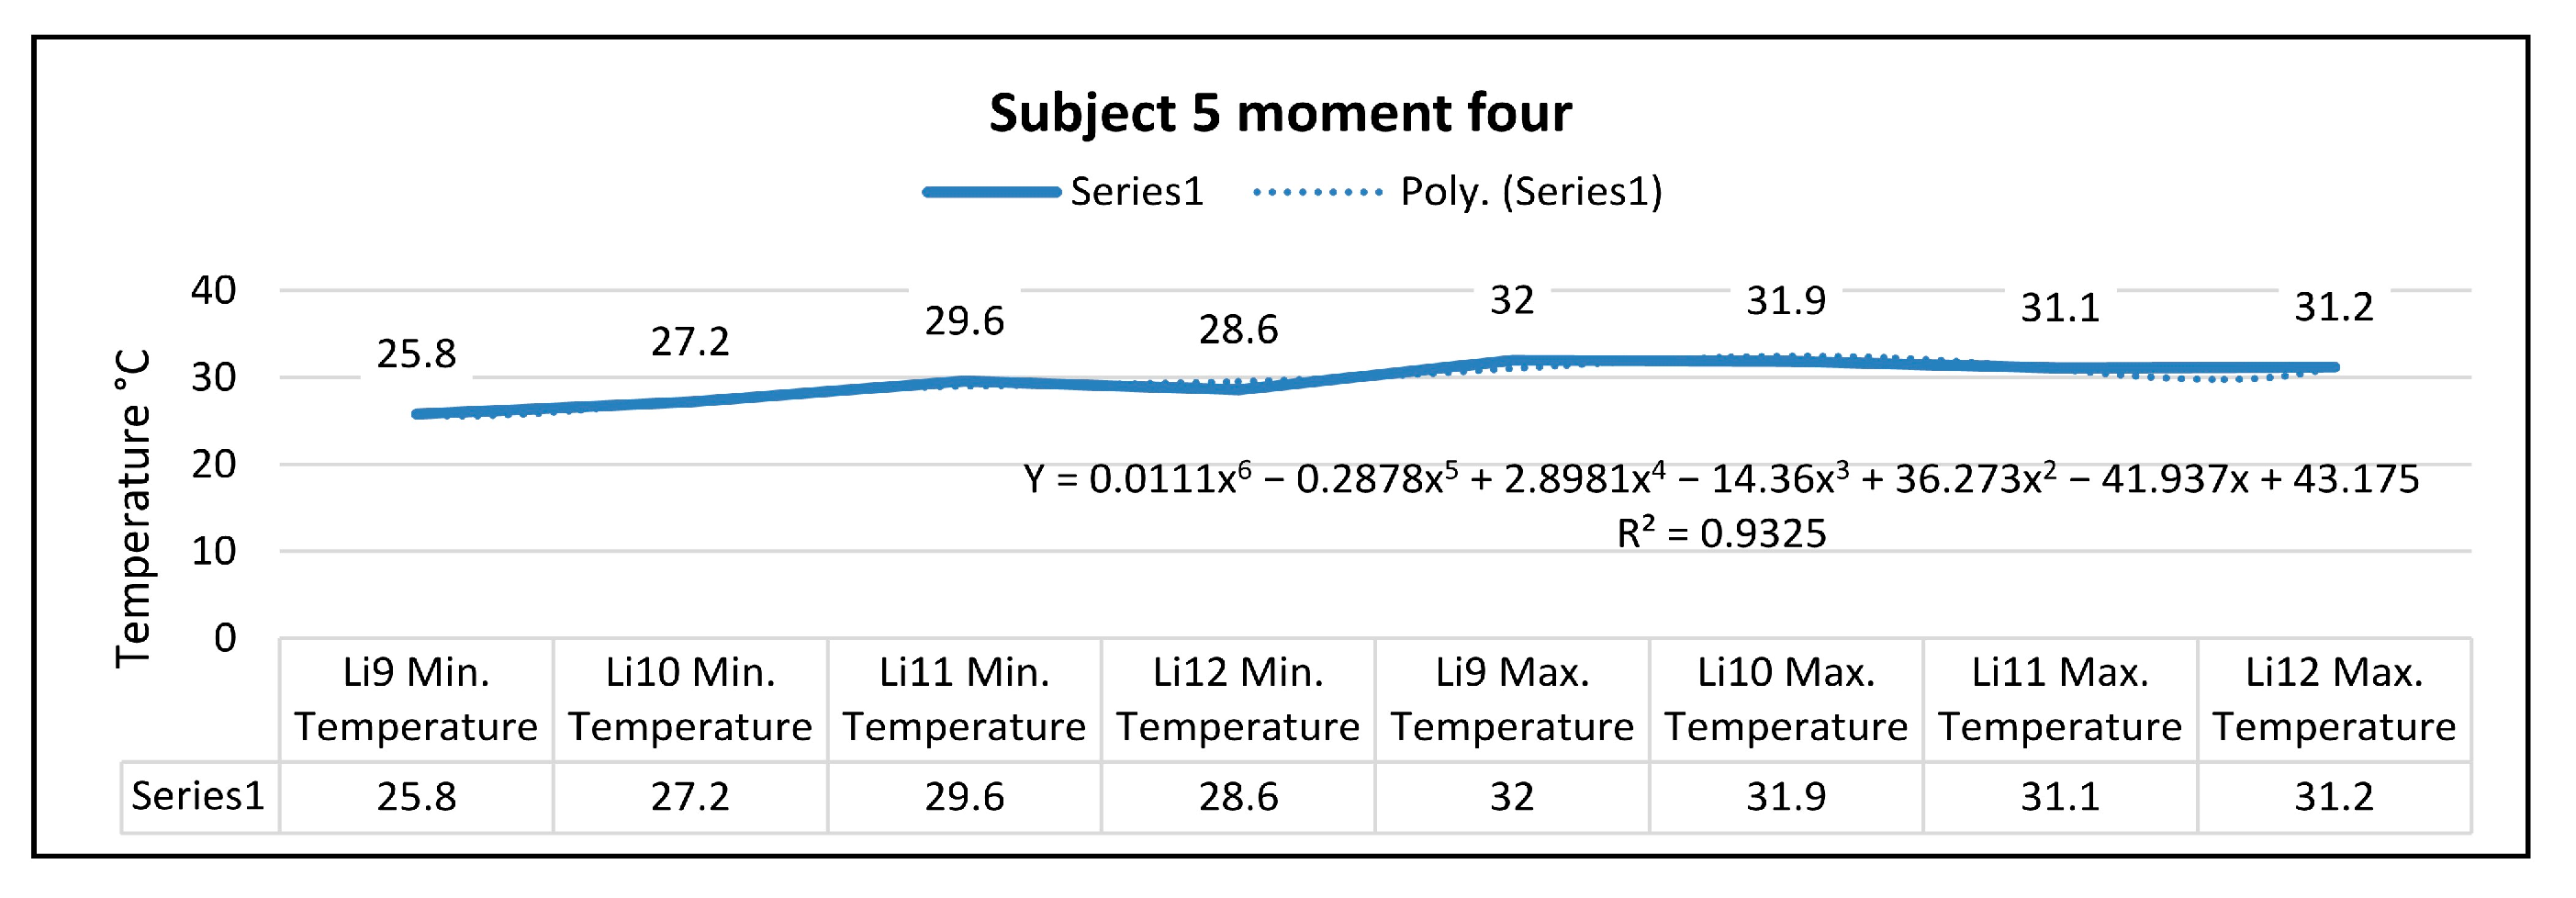
Figure 35, for the right foot of subject 5 at time four (at the end of the volleyball training), the maximum temperature along the line Li9, which is positioned on the central part of the foot, is 32.0 °C, and the minimum temperature is 25.8 °C.
The temperature variation along the Li9 line is 6.2 °C, and the emissivity is 0.83 at time four.
On the side along the Li10 line, the maximum temperature is 31.9 °C, and the minimum temperature is 27.2 °C at time four. The temperature variation along the Li10 line is 4.7 °C, and the emissivity is 0.83 at time four.
For the left foot of subject 5 at time four, the maximum temperature along the Li11 line positioned on the central side is 31.1 °C, and the minimum temperature is 29.6 °C.
The temperature variation along the Li11 line is 1.4 °C, and the emissivity is 0.83 at time four. On the side along the Li12 line, the maximum temperature is 31.2 °C, and the minimum temperature is 28.6 °C at time four.
The temperature variation along the Li12 line is 2.6 °C, and the emissivity is 0.83 at time four (at the end of the volleyball training).
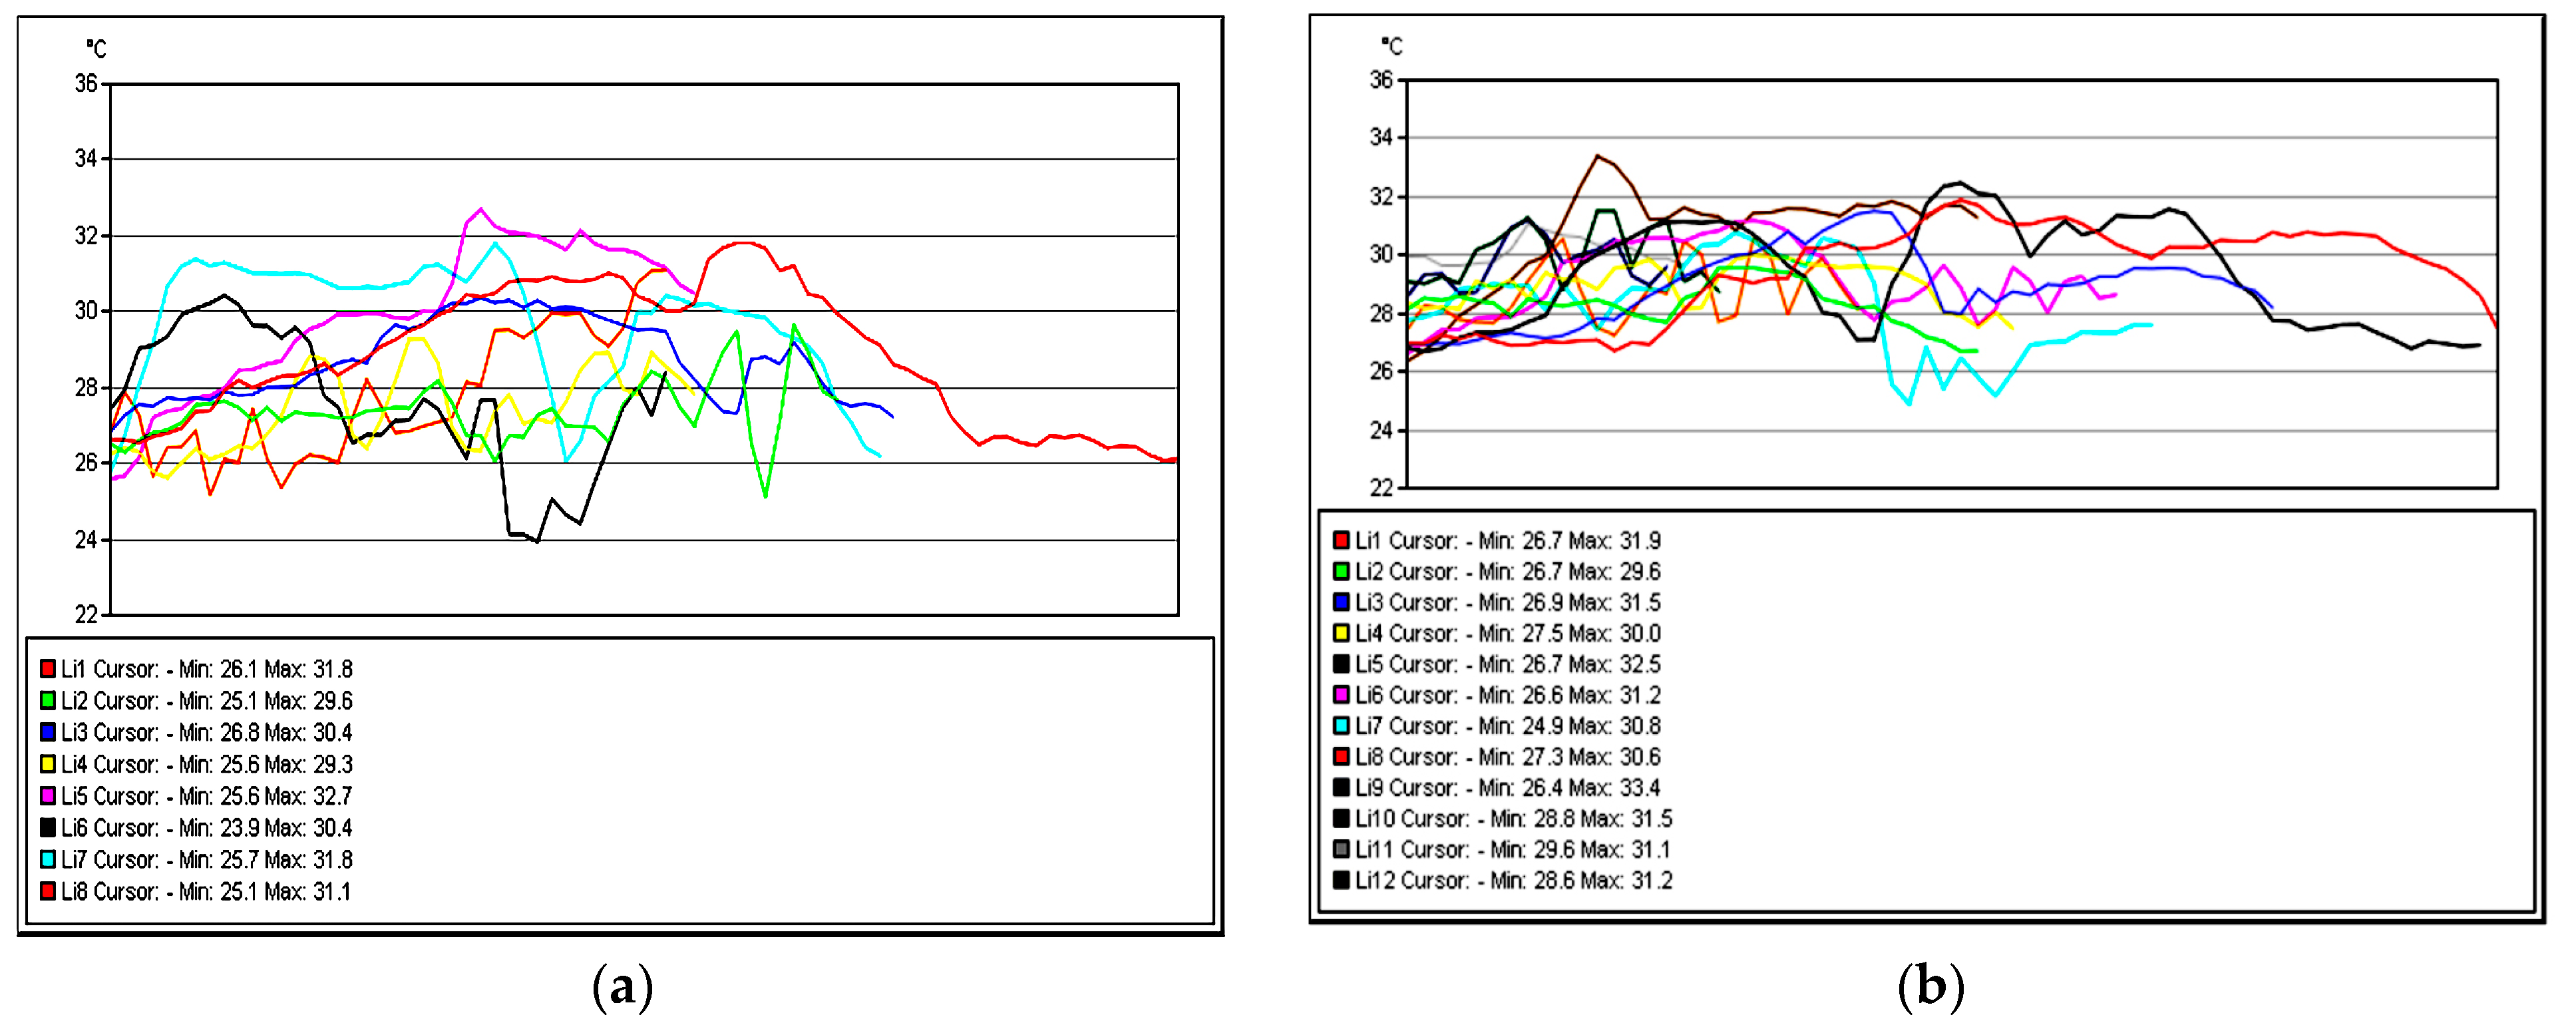
Figure 36 shows the temperature variation along the subject lines on each footwear at time four.
In the case of subject 1 at time four, as shown in
Figure 37, the relation obtained is a polynomial function of degree five (45).
The coefficient of determining R
2 established by the regression procedure is:
In the case of subject 2 at time four, as shown in
Figure 38, the relation obtained is a polynomial function of degree four (47).
The coefficient of determining R
2 established by the regression procedure is:
In the case of subject 3 at time four, as shown in
Figure 39, the relation obtained is a polynomial function of degree six (49).
The coefficient of determining R
2 established by the regression procedure is:
In the case of subject 4 at time four, as shown in
Figure 40, the relation obtained is a polynomial function of degree five (51).
The coefficient of determining R
2 established by the regression procedure is:
In the case of subject 5 at time four, as shown in
Figure 41, the relation obtained is a polynomial function of degree six (53).
The coefficient of determining R
2 established by the regression procedure is:
Polynomial regression is used to create a mathematical model based on polynomials of degree four, five, and six by processing the experimental data and to predict the temperature values outside this range for each individual subject; this method is sensible because, based on the analysis of the polynomial type, a difference in the degree of the polynomial was observed when comparing the shoes of subjects 1 and 2 with the shoes of subjects 3, 4, 5.
It is observed from this analysis that for subjects 1 and 2, wearing the same type of footwear, the degree of the polynomials for moments one and two is the same (of degree five), and for moments zero, three, and four, the difference is small (of one degree between them).
For subject 3, the degree of the polynomials for moments zero and four is the same (of degree six), and for moments one, two, and three, the difference is small (of one degree between them).
For subject 4, the degree of the polynomials for moments zero, two, and three is the same (of degree six); it is also the same for moments one and four (of degree five).
For subject 5, the degree of the polynomials for moments zero, one, and two is the same (of degree 5); it is also the same for moments three and four (of degree six).
It can be seen from this analysis that the difference in the degrees of the polynomials from one shoe to the other is greater than the difference between them.
Considering that these analyses have been done by other researchers in the field in different settings, in research laboratories on unused sports footwear intended for indoor sports activities, the authors wanted to analyze whether there are significant differences in temperature distribution compared to those studied in laboratory conditions where the environment is much better controlled.
The authors studied indoor volleyball footwear in real time on several subjects during several volleyball training sessions to monitor the heat exchange between the foot and the outdoor environment at different times of training intensity, since most research is conducted in research laboratories [
40].
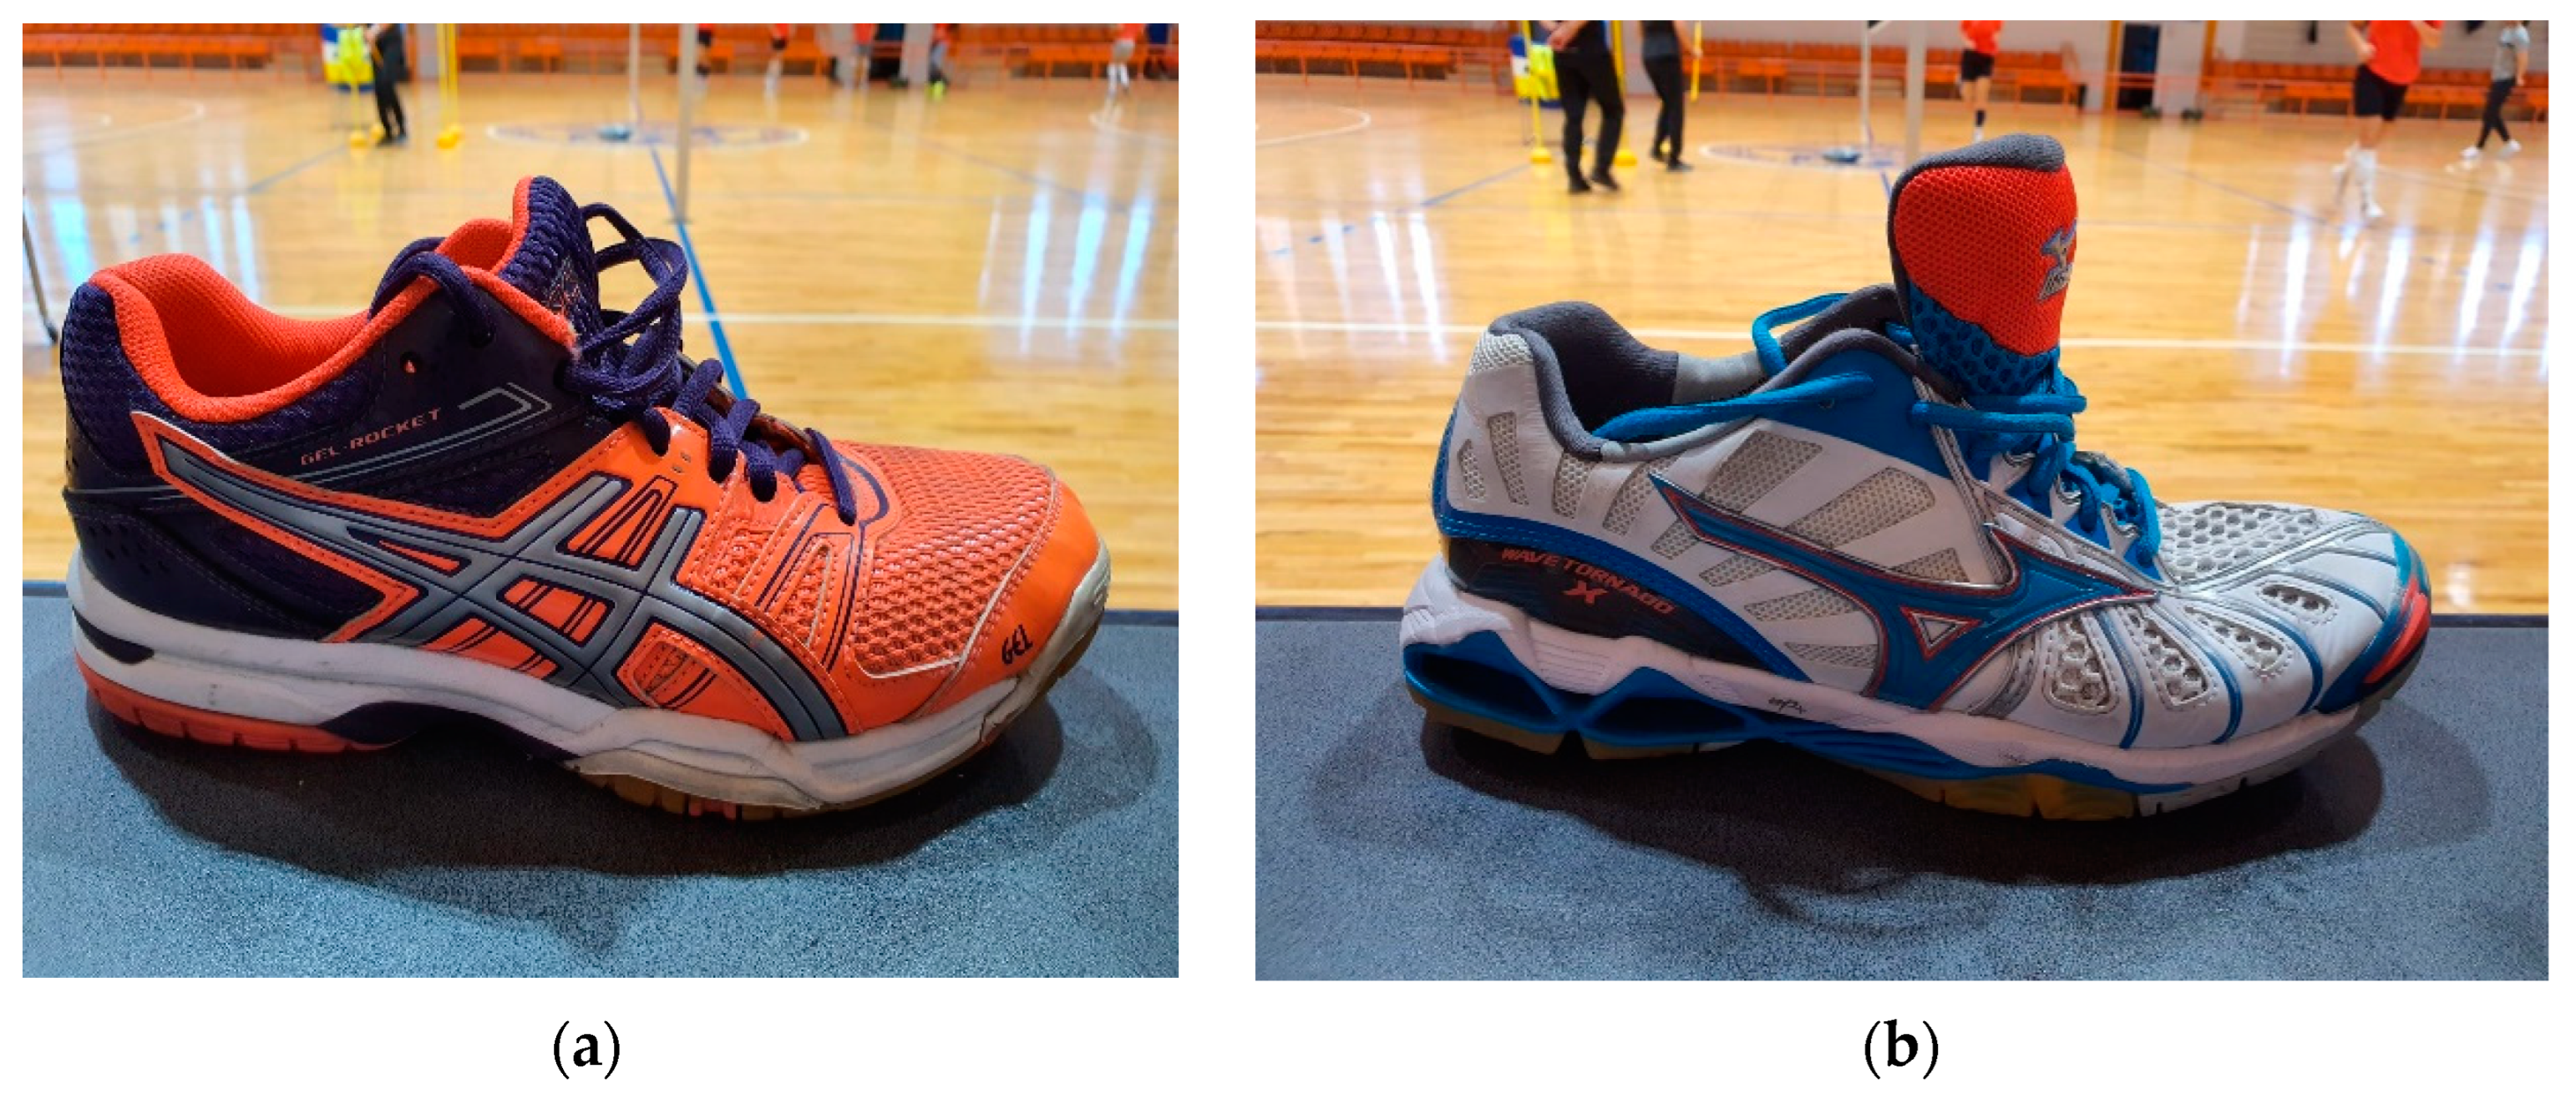
The authors measured the variation in sports footwear temperature during volleyball training for the eight subjects analyzed, of which three subjects had a different model of the same sports footwear.
The analysis shows that the thermal distribution values are within the minimum and maximum limits of the five subjects analyzed in the paper, and they are presented in
Table 3.
Sustainability in sports footwear includes many factors, such as design, supply chain, waste reduction, minimizing energy consumption, recycling, waste, and further innovation.
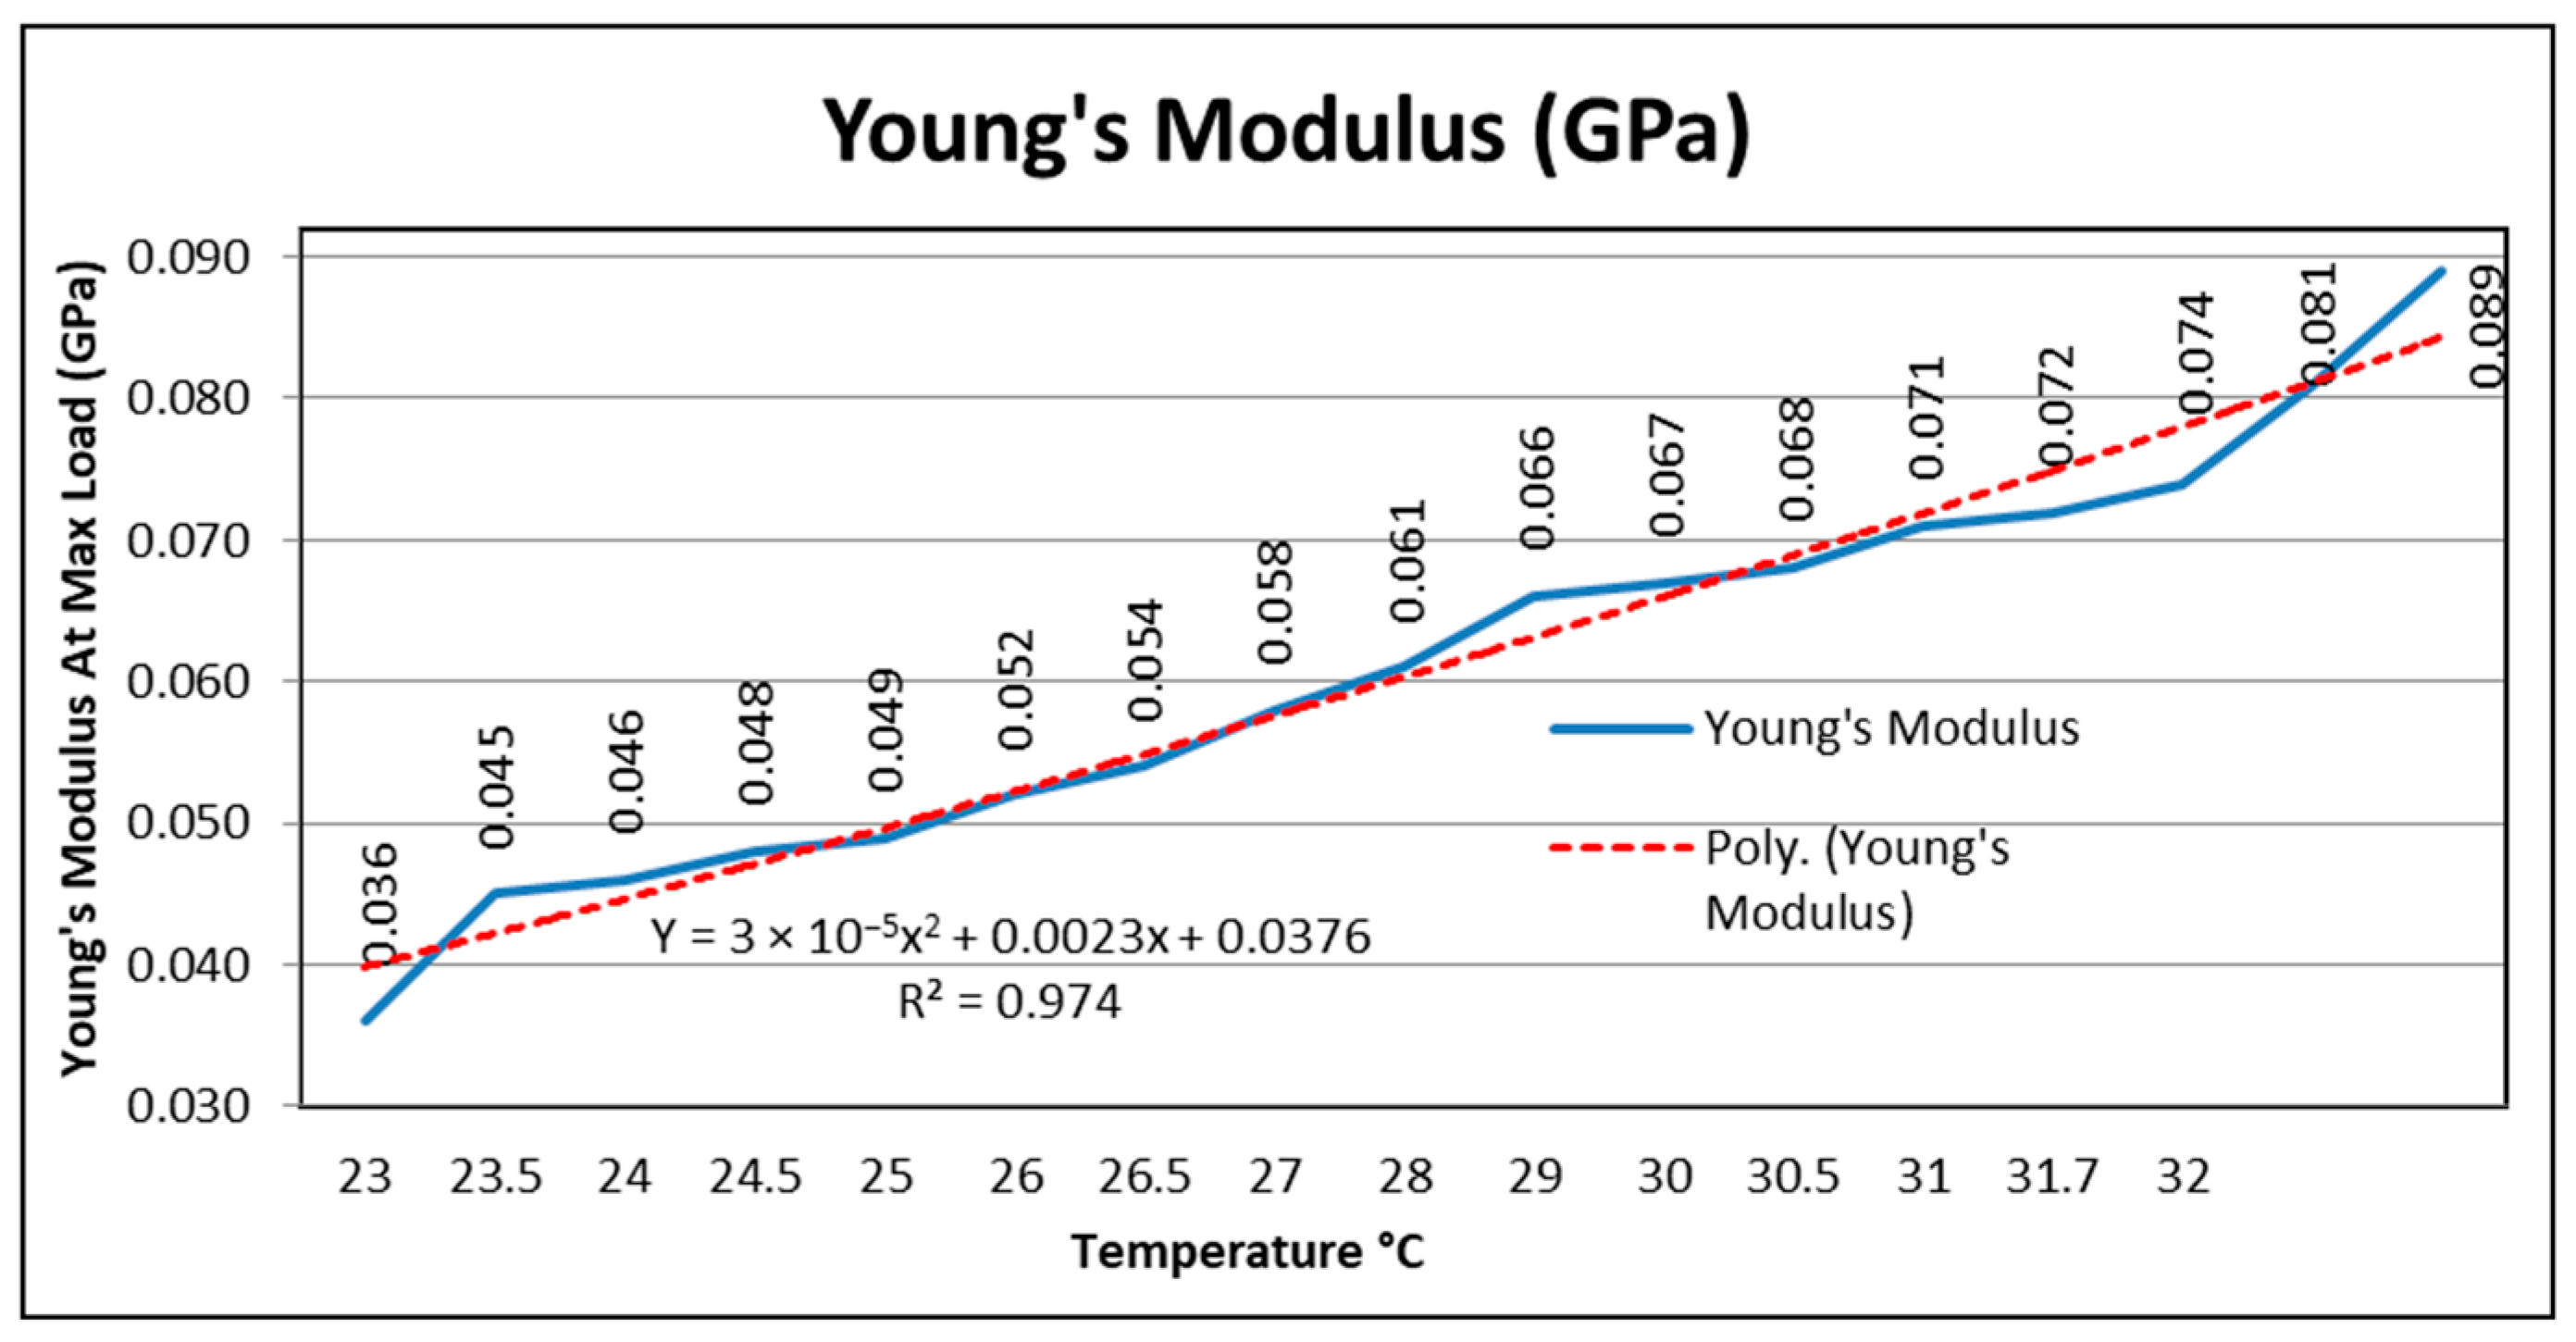
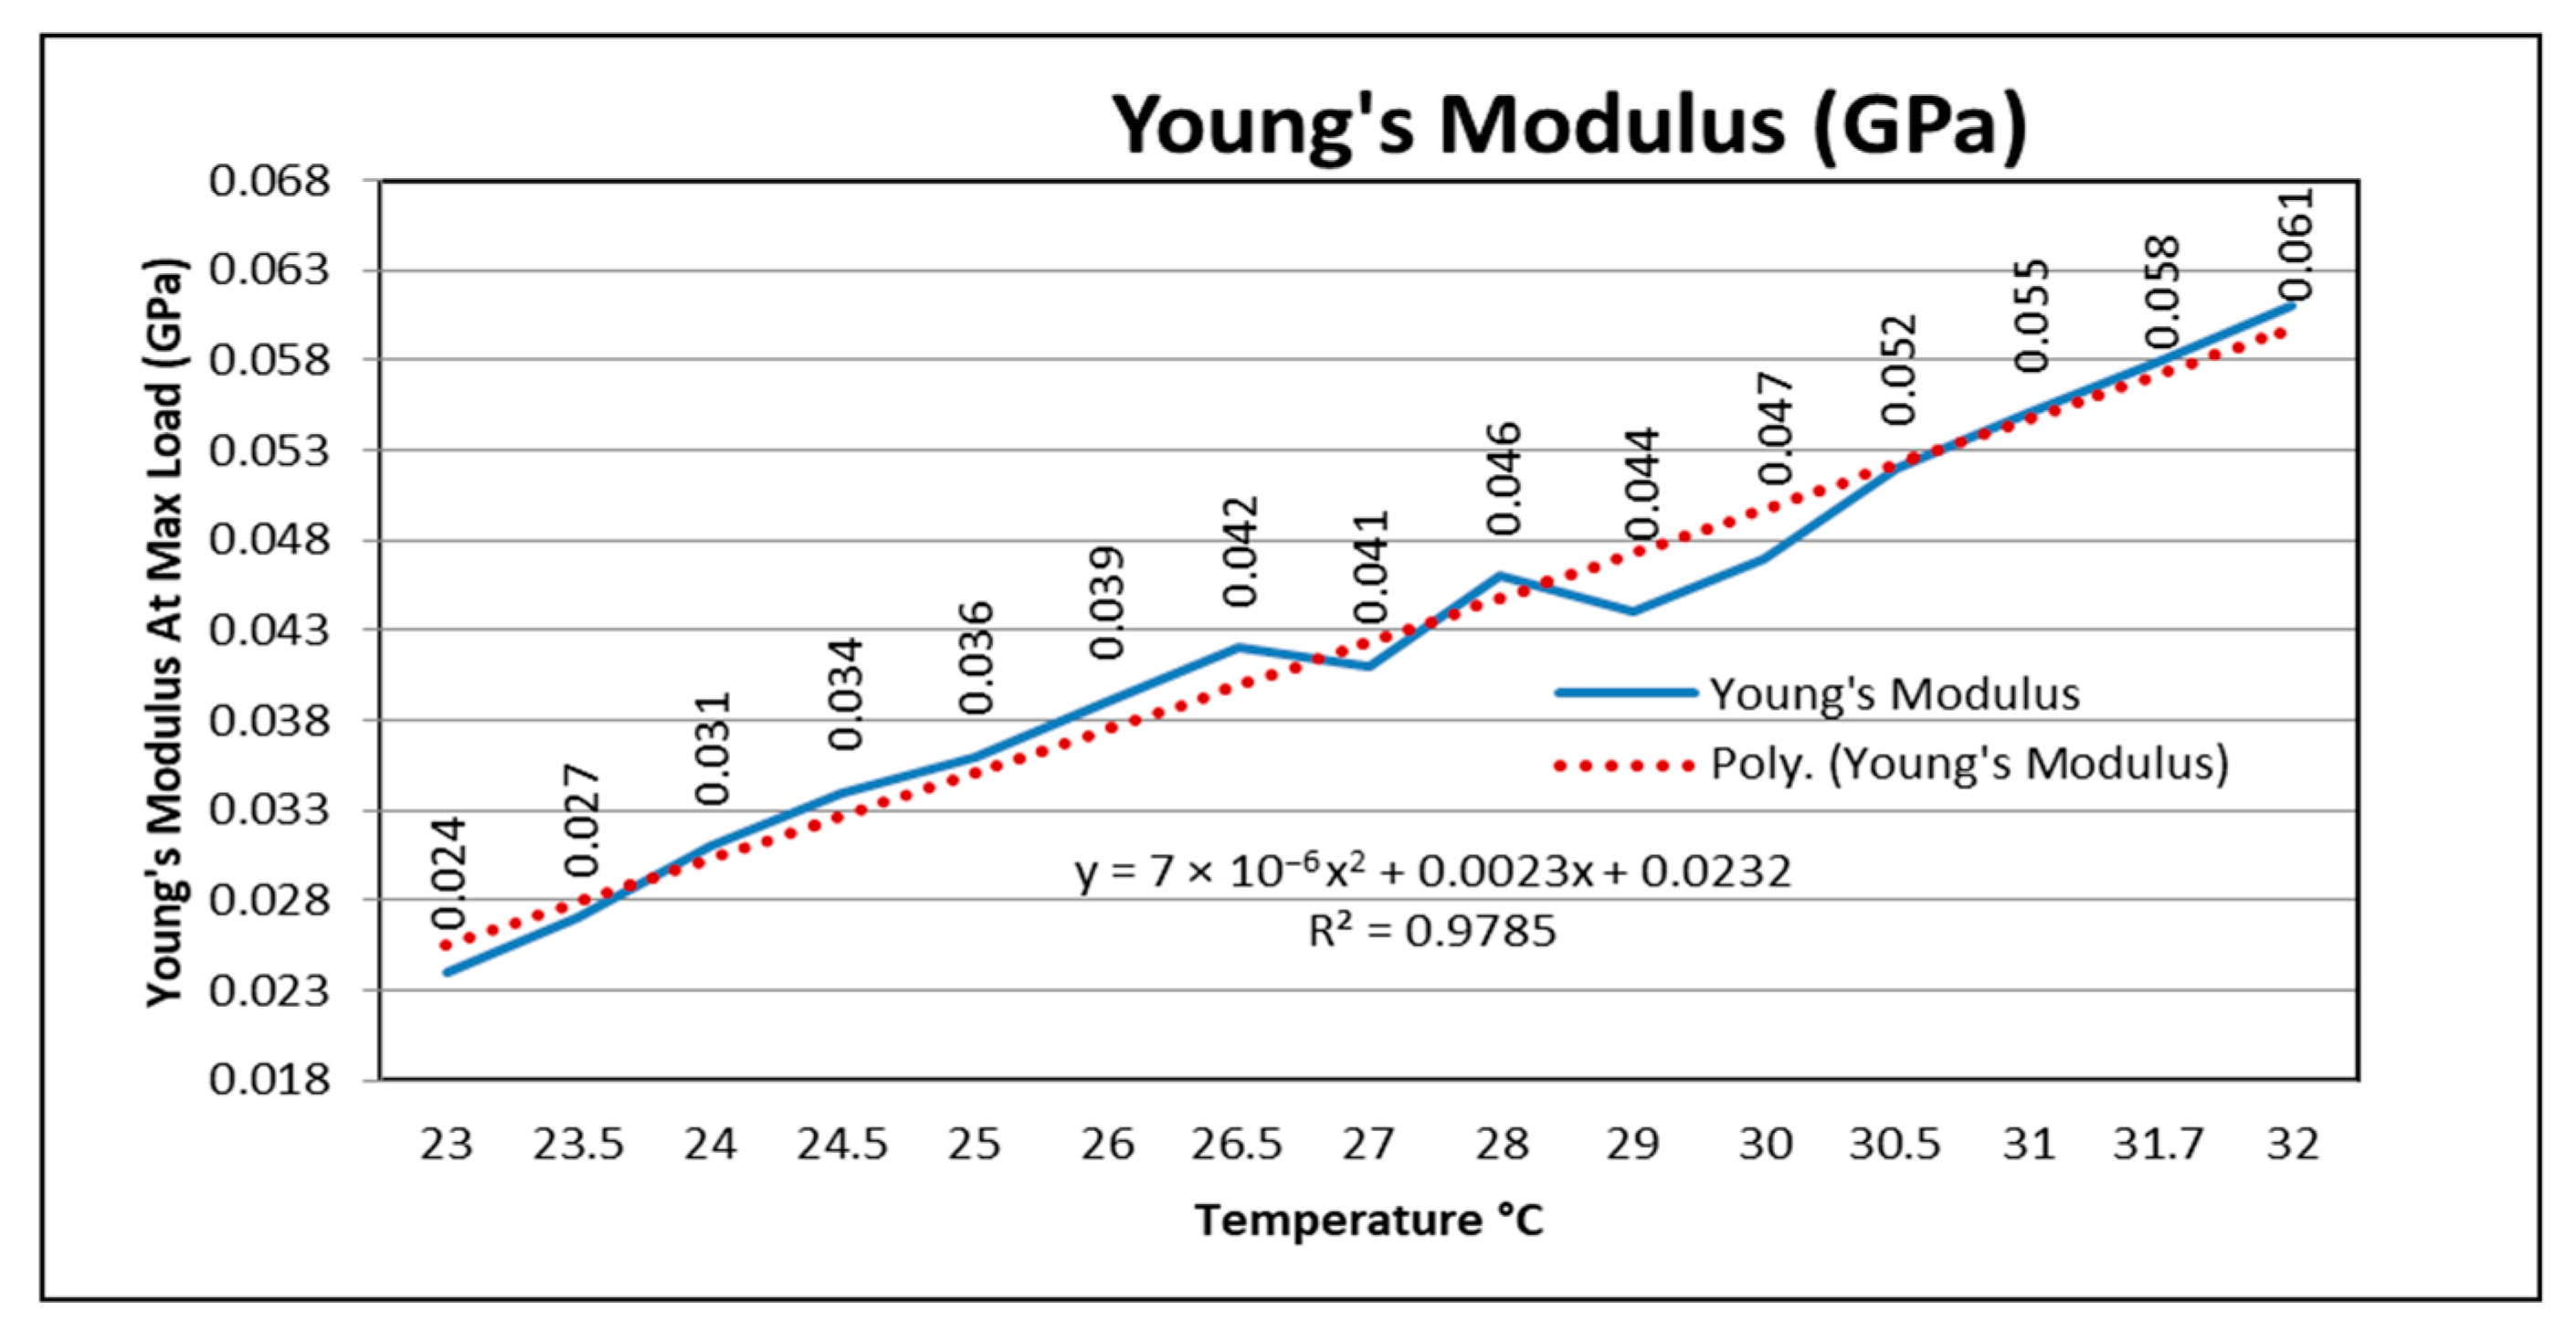
Based on the Young’s Modulus determined by 0.061 GPa for Asics sports footwear, it can be seen that the increase in temperature in the range of 23.1 °C–32.7 °C on the surface of the shoe influences the increase in Young’s modulus, which varies linearly with the increase in the temperature. Based on the Young’s Modulus determined by 0.039 GPa for Mizuno sports footwear, it can be observed that the temperature increase in the range of 23.1 °C–32.7 °C on the surface of the shoe influences the increase in Young’s modulus, which varies linearly with the increase in the temperature.
The polynomial regression is used to create a mathematical model based on processing the experimental data and to predict temperature values outside this domain.
In the mentioned cases when the regression of the polynomial function R2 has a value of less than 0.9, the mathematical model is less representative of the real situation, and the heat distribution on the analyzed surfaces of sports footwear is higher in the analyzed moments.
In the cases mentioned when the polynomial function regression R2 has a value higher than 0.9, the mathematical model represents the real situation, and the heat distribution on the analyzed areas of the sports footwear is higher.
In the case of subjects 1 and 2 using Asics footwear, it can be observed that the regression of the polynomial function R2 has a value of less than 0.9 at time zero (before starting the training). Following the measurements performed at time one (two minutes of training), only in the case of subject 2 did the regression of the polynomial function R2 have a value less than 0.9. In the case of time four (at the end of volleyball training), the regression of the polynomial function R2 had a value of less than 0.9 for subjects 1 and 2.
In the aforementioned cases, when the regression of the polynomial function R2 has a value of less than 0.9, the mathematical model is less representative of the real situation, and the heat distribution on the analyzed surfaces of sports footwear (Asics) is higher in the analyzed moments.
In the case of subjects 1 and 2 who use Asics sports footwear, there is an uneven distribution of temperature variation along the analyzed lines Li1, Li2, Li3, Li4, Li5, Li6, Li 7, and Li8 within the four moments in which the measurements were performed.
In the case of subjects 3, 4, and 5 who use Mizuno sports footwear, it can be observed that the polynomial function regression R2 has a value greater than 0.9 within the four moments analyzed.
In the cases mentioned when the polynomial function regression R2 has a value higher than 0.9, the mathematical model represents the real situation, and the heat distribution on the analyzed areas of the sports footwear (Mizuno) is higher only at moment four.
In the case of subjects 3, 4, and 5 who use Mizuno sports shoes, there is a uniform distribution of temperature variation along the analyzed lines Li1, Li2, Li3, Li4, Li5, Li6, Li 7, Li8, Li9, Li10, Li11, and Li12 during the four moments when the measurements were performed.
