Abstract
The foremost threat facing all living organisms is water pollution, which has a number of detrimental effects. Moreover, the search for alternative sources of clean water has become a high priority for all governments. The current study’s goal is to determine whether it is possible to use the treated wastewater found in wadi Al-Khumra effluent stream in Jeddah governorate in irrigating non-edible crops, gardens, and aromatic plants, instead of allowing it to flow into the sea without being put to any useful use. In light of its high nutritional value, notably in terms of Ca, Mg, and NO3, the results of the water analyses demonstrated the prevalence of its suitability for irrigation. The amount of potentially toxic elements in this water is markedly lower than the Saudi regulations’ permitted limit. Furthermore, the analysis results of soil samples collected from the sewage stream at the study sites showed the richness of this soil with various macro and micronutrients, though the level of some potentially toxic elements exceeded the permitted limits. Overall, before the competent authority decides to use these resources for reforestation and irrigation of some economically significant crops, the mineral content of irrigation water and the soil must be taken into consideration.
1. Introduction
Water is an essential element for the progress of nations and the establishment of permanent societies. However, there are numerous communities where the demand for freshwater surpasses the supply, leading to an insufficiency of freshwater [1,2]. While global water demand has expanded, and freshwater availability has considerably decreased since the 1950s; the agricultural sector nonetheless consumes the majority (∼80–90%) of freshwater [3]. Water scarcity continues to be a substantial challenge in arid and semi-arid regions, specifically in the Middle East and North Africa [4]. Due to their arid and semi-arid nature, these regions have limited access to freshwater resources. Due to the close relationship between the hydrological cycle and climate change, and, more specifically, with greenhouse gases in the atmosphere connected to global warming, and the quality and availability of water will be substantially impacted by climatic changes [5]. The Middle East is now experiencing a water crisis, with Saudi Arabia being designated by the United Nations as a country with an intense water shortage (500 m3/individual/year) [6].
Saudi Arabia, which makes up the bulk of the Arabian Peninsula, is one of the biggest dry countries located between the Red Sea and the Arabian Gulf, without any ongoing lakes or rivers [7]. In certain places, the temperature can exceed 50 °C, resulting in oppressively hot and dry environments [8]. Given that precipitation varies from 100 to 200 mm per year in the north but is less than 100 mm per year in the south, Saudi Arabia is one of the poorest countries in terms of natural sustainable freshwater resources [9]. Saudi Arabia employs a variety of water sources to satisfy its demands, including underground water, surface-water resources, desalinated seawater, and treated wastewater [10]. In Saudi Arabia, treated wastewater is typically used in industry, agriculture, and gardening. Although the wastewater is treated in about 70 plants across the kingdom, a sizable amount of it is still not put to good use [10].
Efficacious management of wastewater, which includes industrial effluents and household wastewater, to avoid the contamination of freshwater bodies has emerged as a major area of concern in all countries as a means of addressing the global water crisis due to the rapid industrialization and growth of the urban population. To fulfill the increasing agricultural demand, treated wastewater is still recognized as a reputable source of irrigation water [11]. Due to the special properties of treated wastewater, reusing it poses a lot of obstacles that cannot be neglected, including health concerns, poor water quality, and direct and indirect repercussions for both plant and soil health [12]. The concerns are mostly related to the presence of microbial pathogens and their ability to contaminate plants and the ecosystem [13], the development of bacterial drug-resistant strains [14], and the persistence of various organic pollutants in wastewater even after treatment [15]. Therefore, an effective wastewater treatment system must be implemented before wastewater may be used in field irrigation. The main factors in lowering the hazards associated with human and ecosystem safety are a reduction in microorganisms and pollutants in the treated wastewater [2]. Through effective wastewater treatment, it is possible to achieve sustainable food production that safeguards both human health and environmental resources. Thus, in order to ensure the safe reuse of treated wastewater, new regulations defining the minimum requirements for wastewater reuse should be implemented.
The reuse of treated wastewater in the agricultural sector has some financial and environmental advantages, in addition to reducing the load on freshwater resources. In particular, it provides nutrients (N, P, K, and Ca) and organic compounds, which boosts agricultural productivity while lowering the need for the application of synthetic fertilizers. It also helps protect freshwater quality by limiting wastewater leakage into the groundwater [16].
By 2040, the Saudi Vision 2030 urges to close the water supply and demand gap by employing 100% of treated wastewater for municipal, industrial, and agriculture activities in places comprising 5000 or more residents [17]. This vision attempts to promote the best and most efficient use of water resources by decreasing consumption and employing treated and sustainable water. Hence, Saudi Arabia is concerned about reusing treated wastewater while being mindful of the ecological, financial, and social implications to fill the gap in the water balance [18]. In relation to this concern, the current study aimed to explore the possibility of using wastewater effluent from wadi Al-Khumra in Jeddah governorate, Saudi Arabia, and the soil sediments in this water stream for growing different plant species representing woody trees, aromatic plants, and ornamentals, and the possibility of benefiting from these resources in achieving the vision of greenness proposed by the Saudi government. Thus, the study planned to highlight the principal mineral nutrients and potentially toxic elements in water and soil samples at various sampling sites along wadi Al-Khumra sewage stream.
2. Materials and Methods
2.1. Study Area
Five locations in the sewage water stream at wadi Al-Khumra in Jeddah governorate were used for water and soil samples during the winter season (February 2022) (Figure 1). The collected samples were obtained from sites designated by the following coordinates: S1 (21.338001N, 39.272374E), S2 (21.335993N, 39.275288E), S3 (21.331956N, 39.280306E), S4 (21.327120N, 39.282855E), and S5 (21.334311N, 39.278420E). As a reference sample for comparison, a soil sample from S6 (21.334311N, 39.278420E), a clean location adjacent to the effluent stream, was also taken in addition to the soil samples collected from the sewage stream. All of the soil samples were sandy loamy in nature, because the water stream in this area is newly developed and the types of soils in the stream and control samples are similar in nature. Figure 2 displays representative images for the research area. A total of 2 liters of water and 0.5 kg of soil were taken in triplicates from each sampling site in clean sterile plastic bottles or paper bags, respectively, and these samples were immediately transported to the laboratory for examination.
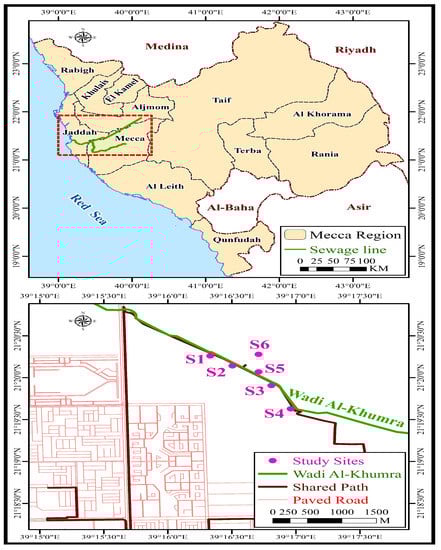
Figure 1.
Map of Saudi Arabia showing the study sites.
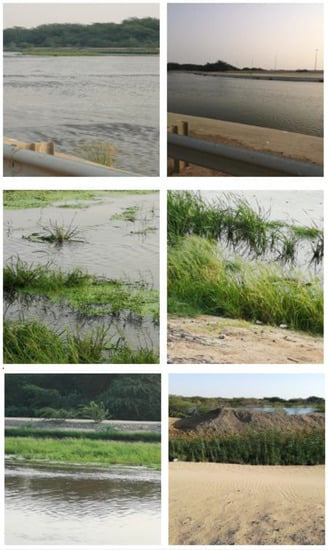
Figure 2.
Typical images of the study site, showing the stream of effluent water, the soil surrounding the stream, and the naturally occurring flora.
2.2. Determination of the Physical Characteristics of the Samples
The collected water samples were filtered using Whatman # 1 filter papers and stored at 4 °C until analysis. Samples of soil were air dried at room temperature, crushed, sieved through a 2 mm mesh, and enclosed in paper bags. To make soil paste, distilled water and soil were mixed at a ratio of 1:5 (w/v) over the course of two hours. The resultant slurry was filtered through Whatman # 1 filter paper, and the filtrate was kept in glass bottles at 4 °C. At the time of measurement, samples were allowed to adapt to room temperature.
Using a pH-conductivity/EC meter, the pH and electrical conductivity (EC) of water and soil samples were determined (JANEWAY 3540, Masa, Tipi, Japan) using EPA (Environmental Protection Agency) according to the method of Saad-Allah and Elhaak [19].
2.3. Determination of Chemical Properties of Water and Soil Samples
In water samples, the level of chemical oxygen demand (COD) was measured in the laboratory using the standard method prescribed by APHA [20]. The COD broad range kit (Hanna Instruments, HI839800, Woonsocket, RI, USA) was used to measure COD photometrically, based on the standard method (14XXXCOD), following the manufacturer’s instructions. For total phosphorus, nitrate, ammonia, sulfate, chloride, sodium, calcium, magnesium, and potassium, and different potentially toxic elements (Al, Cd, Cr, Co, Cu, Pb, Mn, Hg, Ni, and Zn), nitric acid with H2O2 digestion (wet digestion) was performed on 2 g of each soil sample.
The concentration of phosphate in soil and water samples was assessed using the ESS method 310.1 [21]. However, ammonia concentration was quantified using the standard phenate method (standard methods for the examination of water and wastewater, method 1689, APHA) [20], but nitrate concentration was measured using the method of [22]. Using barium chloride as a reagent, sulfate content in soil and water samples was estimated colorimetrically following the method of [23]. The analyses of some mineral ions (Na, Ca, Mg, and K), and some selected potentially toxic elements (Al, Cd, Cr, Co, Cu, Pb, Mn, Hg, Ni, and Zn), were conducted in triplicate using a PerkinElmer inductively coupled plasma optical emission spectrometry (ICP-OES) (Optima 3300, Shelton, CT, USA) according to [24]. However, the concentration of Cl ion was detected by EPA standard method using ion chromatography (EPA method 300) [22].
2.4. Statistical Analysis
Analysis of variance (ANOVA) was performed to compare the mean values of the investigated parameters for all of the different sampling sites using statistical analysis software (CoStat, CoHort, V.6.311) under Windows, with a 0.05 level of significance and LSD as the post hoc test. The two-tailed Pearson’s correlation analysis was used to establish the relationship between the physicochemical characteristics and the potentially toxic elements of the water and soil samples. The tabulated data were the average from three replicates, and the descriptive statistics used to derive the means of the data sets.
3. Results and Discussion
3.1. Water Samples Analysis
The findings presented in Table 1 include the physical characteristics (pH, EC, and COD), the content of inorganic salts (phosphate, nitrate, ammonia, sulfate, chloride, sodium, calcium, magnesium, and potassium), and the concentration of potentially toxic elements (aluminum, cadmium, chromium, cobalt, copper, lead, manganese, mercury, nickel, and zinc) in the water samples taken from the sewage water stream at wadi Al-Khumra in the Jeddah governorate during the winter season. The statistical analysis of the results revealed highly significant differences in the measured parameters between the control sample (unpolluted) and the samples taken from the treated wastewater stream at the five collection sites.

Table 1.
Physical and chemical properties of water samples collected from wadi Al-Khumra sewage stream.
According to the findings, the pH levels of the treated wastewater from the five collection sites were higher than 7.0 (7.18–7.51). As the control sample’s pH ranged from 6.5 to 8.5, it may be concluded that the samples of treated sewage water are alkaline in nature. According to [25], the pH of wastewater has a significant role in determining how readily available potentially toxic elements are to the plant, and how easily they dissolve in the soil. This result is in line with some earlier studies that established the alkaline composition of the effluent water stream in wadi Al-Khumra [26,27]. Plant growth is better at a pH of 7 or higher since all the nutrients of the soil become easily accessible at that pH value [28]. Likewise, some ions, such as Ca and Mg, become more bioavailable at pH levels higher than 7, which is appropriate for microbial activities that contribute to the bioavailability of nutrients for plants [29].
The quantity of soluble solutes in the water is determined by the electrical conductivity (EC). Measurements of the EC in water samples collected from Al-Khumra sewage stream showed high values (from 931 μS/cm in S2 to 942 μS/cm in site S5) as compared to the control value (NA). The presence of various ions in water, such as H+ and OH−, and various nutrients, such as phosphate and nitrate, contributes to the wastewater’s high EC values [30].
Chemical oxygen demand (COD) is an essential measure of the amount of contaminants in water, wastewater, and hazardous wastes. In this study, COD levels in water samples were measured, and the results revealed low levels (1–4 mg·dm−3), as compared to the recommended levels (90 mg·dm−3). This indicates that there are very few pollutants present in this sewage stream. The results of EC and COD show that nutrients that are soluble in water may be the reason for the variation in values of both measures rather than contaminants. The COD concentrations reported for surface water supplies commonly range from 20 mg·dm−3 or less in clean waters to over 200 mg·dm−3 in waters that are acquiring municipal wastewater [31]. Additionally, industrial effluents may exhibit COD in the range of 100–60,000 mg·dm−3 [32]. Due to the low COD, water samples taken from the sewage stream in Al-Khumra may be used for reforestation and agriculture.
The inorganic soluble ions and nutrients in the water reflect the possibility to employ this water as a source of nutrients in agriculture and forestry. Table 1 lists the results of the chemical analysis of a number of inorganic compounds identified in water samples taken from five locations along the sewage stream in wadi Al-Khumra, Saudi Arabia. There were highly significant differences in the amounts of phosphate (PO43−), nitrate (NO3−), ammonia (NH3+), sulfate (SO42−), chloride (Cl−), sodium (Na+), calcium (Ca2+), magnesium (Mg2+), and potassium (K+) depending on the ion type and the sampling site. The concentration of these ions was in the following order: Cl− ˃ Na+ ˃ Ca2+ ˃ SO42− ˃ Mg2+ ˃ NO3− ˃ K+ ˃ PO43−. Despite the almost identical inorganic compound concentrations across all sites, S5 stood out due to its higher concentration of Cl−, Na+, Ca2+, NO3−, K+, and PO43−, in comparison to the other sampling sites. As Na+ is an element that is challenging to remove during wastewater treatment, its high level in sewage water harms plants, and irrigation with Na-rich water converts soil to alkaline soil [33]. Additionally, irrigation water with excessive chloride concentrations may cause plant toxicity [34]. In fact, even plants with considerable tolerance to chloride are adversely affected by concentrations between 140 and 350 mg·dm−3 [35]. Nonetheless, calcium is primarily responsible for preserving soil structure or enhancing the physical characteristics of soils, including those affected by salt [36]. However, magnesium is essential for the processes of photosynthesis and protein synthesis in plants. The abundance of both cations in the water samples implies that they can be used to benefit soil quality and plant health.
Table 1 provides an overview of the analysis of potentially toxic elements in the water samples obtained from five sampling points along wadi Al-Khumra sewage stream. All of the potentially toxic elements evaluated revealed relatively low abundances in their composition in the water samples, which is below the level of the reference sample. Even though potentially toxic elements are pivotal plant nutrients, their excessive amounts have damaging consequences for both plants and animals and humanity. If their concentrations in the water exceeded the levels permitted for agricultural use, they would become harmful and would slow plant development. Advanced technical approaches, such as ionic exchange or the irreversible collision of salts, are used to remove these ions from sewage water [27]. In this investigation, none of the potentially toxic elements examined (Al, Cd, Cr, Co, Cu, Pb, Mn, Hg, Ni, and Zn) was found in concentrations above the permissible levels [37]. Therefore, it is acceptable to reuse this water to irrigate ornamentals and non-feeding plants growing close to the sewage stream where the water samples were collected. These findings corroborate those of the authors of [27], who found that treated wastewater in some treatment plants in Saudi Arabia can be used to irrigate agricultural fields simply and safely in terms of pH, EC, inorganic solutes, and potentially toxic elements.
3.2. Soil Samples Analysis
Table 2 lists the results of the physical and chemical investigation of six soil samples taken from wadi Al-Khumra sewage stream. The results show that, whereas the control sample had a pH of 8.5, the soil samples from the six collection sites ranged in pH from 6.36 to 8.10. As previously discussed, plant growth is higher at a pH of 7 or more because the nutrients in the soil become more easily obtainable at that pH level [28]. The accessibility of some cations, such as Ca and Mg, increases at pH values greater than 7, which is suitable for microbial processes that assist in the bioavailability of nutrients [29]. Due to this, the soil from sites S2, S3, and S5 are appropriate for plant growth and sustaining soil physical properties. The pH of these sites ranged from 7.62 (S2) to 7.76 (S3). However, soil samples from sites S1 and S6 had a somewhat acidic nature (6.83 and 6.36, respectively), which classifies these locations as unfavorable for plant growth and the preservation of soil structure. On the other side, the soil at site S4 was alkaline (pH 8.10), which could likewise be detrimental to plant growth. High alkaline soils (pH > 8.0) frequently contribute to reduced plant viability, associated with toxic boron levels and primarily due to iron deficiency, which puts plants under nutritional stress [38]. Moreover, the extremely high soil pH impairs seed germination, limits nutrient use efficiency and uptake, damages root cell integrity, and significantly diminishes crop yields [39,40]. Additionally, high pH levels limit the availability of many plant nutrients, and Ca, Mg, and several micronutrients combine with PO43− and produce less or unavailable forms of the nutrients under high pH circumstances [41].
Table 2.
Physical and chemical properties of soil samples’ collected from wadi Al-Khumra sewage stream.
The electrical conductivity (EC) of the soil solution is a criterion of its content of soluble ions and salts. The results of EC of six soil samples collected from wadi Al-Khumra sewage stream showed highly significant variations in its values, ranging from 421.5 to 4870.0 μS/cm. The order of EC values (salinity level) in the sampling sites was S6 (421.5 μS/cm), S4 (425.0 μS/cm), S1 (1220.0 μS/cm), S5 (2465.0 μS/cm), S3 (2790.0 μS/cm), and S2 (4870.0 μS/cm). According to this finding, sites S6 and S4 are the best places to grow plants in terms of salinity, considering how their pH values can be altered through various agricultural practices.
The concentrations of inorganic salts in the soil samples of six localities along wadi Al-Khumra sewage stream are listed in Table 2. According to the abundance level, S1 had the highest concentration of PO43−, NO3−, and Ca2+ (17.0, 58.0, and 257.0 mg·dm−3, respectively). However, S2 possessed the highest level of SO42− (655.0 mg·dm−3) and Na+ (1288.0 mg·dm−3). Furthermore, S3 was the richest in Cl−, Mg2+, and K+ (688.0, 89.0 and 71.0 mg·dm−3, respectively). The largest concentration of NH3+ (1.90 mg·dm−3) was attained at S6. Nonetheless, out of all the sample sites under study, sites S4 and S5 had the lowest concentration of inorganic substances. Due to its low level of Na+ and Cl- ions and the presence of significant amounts of essential macronutrients, S6 was found to be the most ideal in this regard for cultivating a variety of plant species for the purposes of agriculture and afforestation. Given these results, we can take advantage of the high inorganic solutes content in the sewage stream to utilize it as a source of mineral fertilizers in the agricultural sector, in particular P, N, S, Ca, Mg, and K.
Potentially toxic elements analysis of the soil samples along the sewage stream of wadi Al-Khumra is represented in Table 2. Except for Pb2+ and Zn2+, the soil from S4 showed the highest content of potentially toxic elements. Among the examined sampling locations, this site had the highest values for Al3+ (11,294 mg·dm−3), Cr (32.0 mg·dm−3), Co2+ (11.0 mg·dm−3), Cu2+ (49.0 mg·dm−3), Mn2+ (511 mg·dm−3), and Ni2+ (39.0 mg·dm−3). In addition, compared to the control sample, the concentration of Al and Mn in this site was beyond the acceptable range, but the concentrations of the other metals were within the acceptable range. On the other hand, S1 was the most contaminated location in terms of Pb2+ and Zn2+ (8.0 and 68.0 mg·dm−3, respectively), while their levels were still lower than those of the control sample. Al3+ and Mn2+ were the most prevalent contaminating metals in all test sites in terms of concentration, whereas Hg2+ and Cd2+ were the less prevalent potentially toxic elements. According to these findings, S1 is the least risky of the investigated sites for growing pants in terms of the concentration of potentially toxic elements. However, the concentration of all potentially toxic elements in all sampling sites was above Saudi Arabia standards. As a result, the soil needs to be decontaminated from the polluting metals using varied and appropriate approaches, such as precipitation, co-precipitation, or phytoremediation.
Based on the results of water and soil analysis in this study, the wastewater and soil collected from the sewage stream in wadi Al-Khumra area of southern Jeddah governorate can be employed in accomplishing the Saudi governorate vision by utilizing this wastewater in afforestation and the cultivation of non-edible economic plant species. The most significant positive characteristics that should be considered during species selection are plant species uses, environmental factors withstanding, and the ability for propagation under non-optimal conditions. Pine, eucalyptus, poplar, mahogany, teak, and beechwood are some of the tree species that can be cultivated utilizing sewage water for economic purposes, according to [42]. In addition, [43] demonstrated how several container-grown plants, such as juniper, myrtle, and cypress, can be grown by employing treated wastewater. These plants have favorable economic and environmental effects connected to the decrease in the consumption of synthetic fertilizers. Additionally, it has been reported that many grass species have a high phytoremediation capacity and are effective hyperaccumulators when growing in wastewater containing potentially toxic elements [44]. Moreover, sewage water can be used in the production of aromatic plants, whereas [45] demonstrated that the production of sweet marjoram, peppermint, geranium, fennel, and chamomile oils did not suffer from any reduction in the quantity or quality of volatile oils when grown in treated municipal wastewater. Additionally, it is possible to use the wastewater that has been treated to grow horticultural plant species [46].
3.3. Correlation Coefficient of Water Parameters
Based on the physical and chemical analyses of water samples collected from various sampling locations along wadi Al-Khumra sewage stream, 231 correlation coefficients were assessed (Table 3). All of the measured parameters, except for the pH value, showed highly significant values (p < 0.01 and r ≥ 0.62). The association of COD with Cl, Na, Al, Cd, Cr, Co, Cu, Pb, Mn, Hg, Ni, and Zn exhibited the strongest positive correlation. Moreover, the positive correlation was meaningful when Cl was correlated with Na, Cd, Cr, Co, Cu, Mn, Hg, Ni, and Zn. Likewise, Na was shown to be positively correlated with Al, Cd, Cr, Co, Cu, Pb, Mn, Hg, Ni, and Zn. The most relevant negative correlation was established due to the association of EC with all of the assessed physical and chemical parameters. Moreover, some of the strongest negative associations with pH, EC, PO4, NO3, NH3, SO4, Ca, Mg, and K were found for Zn, Ni, Hg, Mn, Pb, Cu, Co, Cr, Cd, and Pb.
Table 3.
Pearson’s correlation coefficient analysis of the analyzed water samples’ physical and chemical properties.
3.4. Correlation Coefficient of Soil Parameters
Two hundred and ten (210) correlation coefficients were evaluated based on the physical and chemical examinations of soil samples obtained from six sampling points along wadi Al-Khumra sewage stream (Table 4). Among these properties, 71 showed highly significant values (p < 0.01) with r ≥ 0.62, and 82 showed significant relationships (p < 0.05) with r ≥ 0.36. In this situation, our attention would be drawn to the data set’s most reliable correlation. The soil pH is positively correlated with Cd, Cr, Co, Cu, Pb, Hg, Ni, and Zn (0.57, 0.69, 0.66, 0.89, 0.57, 0.57, 0.70, and 0.62, respectively). However, pH was inversely correlated with PO4, NH3, Ca and Mg (−0.49, −0.46, −0.36, and −0.42, respectively). At the sometime, EC of the soil solution was positively correlated with NO3 (0.66), SO4 (0.91), Cl (0.53), Na (0.98), Ca (0.60), Mg (0.55), and K (0.54), but negatively associated with Cd (−0.44), Cr (−0.49), Co (−0.47), Pb (−0.43), Hg (−0.44), and Ni (−0.51). Furthermore, PO4 showed a positive association with the content of Ca and Mg (0.40 and 0.44, respectively), but showed a negative correlation with Cd, Cr, Co, Cu, Pb, Hg, Ni, and Zn (−0.54, −0.56, −0.69, −0.46, −0.50, −0.54, −0.56, and −0.54, respectively). Concerning NO3 correlation with the other parameters, it was positively correlated with SO4, Ca, Mg, and K (0.82, 0.94, 0.50, and 0.60, respectively), but inversely correlated with NH3 (−0.37), Cd (−0.45), Cr (−0.58), Co (−0.67), Cu (−0.53), Pb (−0.41), Hg (−0.45), and Ni (−0.71). Ammonium (NH3) concentration showed a strong positive correlation with Al (0.72) and Mn (0.69), but a negative one with Cd, Cr, Cu, Pb, Hg, and Zn (−0.64, −0.52, −0.40, −0.68, −0.64, and −0.64, respectively). Sulphate (SO4) was positively correlated with Cl, Na, Ca, Mg, K, and Mn (0.72, 0.83, 0.85, 0.62, 0.76, and 0.40, respectively); however, it was negatively correlated with Cd, Cr, Co, Cu, Pb, and Hg (−0.55, −0.62, −0.64, −0.41, −0.53, and −0.55, respectively).
Table 4.
Pearson’s correlation coefficient analysis of the analyzed soil samples’ physical and chemical properties.
4. Conclusions
Water scarcity is a major issue for agricultural production globally, particularly given impending climatic changes. Thus, the exploration of alternative water sources has received international attention with a focus on groundwater and wastewater. The findings of the current study demonstrated that the water stream of wadi Al-Khumra is a potential source of water that could be used in growing plants for the purpose of afforestation, horticulture, and some economically significant plant species. This is due to its high content of nutritional components, such as Ca, Mg, and NO3, in addition to the less potentially toxic elements, particularly Cd, Co, Cu, Pb, Ni, and Hg, which is less than the Saudi standards. The prospect of using sewage water in the agricultural sector does, however, need more extensive research. This research must be expanded to include additional research on the physical and chemical qualities of effluent water to include the entire kingdom.
Funding
This research received no external funding.
Institutional Review Board Statement
Not applicable.
Informed Consent Statement
Not applicable.
Data Availability Statement
Not applicable.
Conflicts of Interest
The authors declare no conflict of interest.
References
- Xiao, Y.; Shao, J.; Cui, Y.; Zhang, G.; Zhang, Q. Groundwater circulation and hydrogeochemical evolution in Nomhon of Qaidam Basin, northwest China. J. Earth Syst. Sci. 2017, 126, 1–16. [Google Scholar] [CrossRef]
- Hussain, M.I.; Muscolo, A.; Farooq, M.; Ahmad, W. Sustainable use and management of non-conventional water resources for rehabilitation of marginal lands in arid and semiarid environments. Agric. Water Manag. 2019, 221, 462–476. [Google Scholar] [CrossRef]
- Gleick, P.H. Global freshwater resources: Soft-path solutions for the 21st century. Science 80 2003, 302, 1524–1528. [Google Scholar] [CrossRef] [PubMed]
- Fedoroff, N.V.; Battisti, D.S.; Beachy, R.N.; Cooper, P.J.M.; Fischhoff, D.A.; Hodges, C.N.; Knauf, V.C.; Lobell, D.; Mazur, B.J.; Molden, D.; et al. Radically rethinking agriculture for the 21st century. Science 80 2010, 327, 833–834. [Google Scholar] [CrossRef] [PubMed]
- Denicola, E.; Aburizaiza, O.S.; Siddique, A.; Khwaja, H.; Carpenter, O.D. Climate change and water scarcity: The case of Saudi Arabia. Ann. Glob. Health 2015, 81, 342–353. [Google Scholar] [CrossRef]
- Samad, N.A.; Bruno, V.L. The urgency of preserving water resources. Environ. News. 2013, 21, 3–6. [Google Scholar]
- AQUASTAT Saudi Arabia. FAO Organization Website. 2021. Available online: https://www.fao.org/aquastat/en/ (accessed on 2 July 2022).
- Shayboub, M.; Mahmoud, A. Water–demand management in the kingdom of Saudi Arabia for enhancement environment. Am. J. Comput. Technol. Appl. 2013, 1, 101–127. [Google Scholar] [CrossRef]
- Al-Suhaimy, U. Saudi Arabia: The Desalination Nation. Available online: https://eng-archive.aawsat.com/abeedalsuhaimy/features/the-desalination-nation (accessed on 2 July 2022).
- Chowdhury, S.; Al-Zahrani, M. Characterizing water resources and trends of sector wise water consumptions in Saudi Arabia. J. King Saud Univ.-Eng. Sci. 2015, 27, 68–82. [Google Scholar] [CrossRef]
- Batarseh, M.I.; Rawajfeh, A.; Ioannis, K.K.; Prodromos, K.H. Treated municipal wastewater irrigation impact on olive trees (Olea europaea L.) at Al-Tafilah, Jordan. Water, Air, Soil Pollut. 2011, 217, 185–196. [Google Scholar] [CrossRef]
- Ahmadi, L.; Merkley, G.P. Planning and management modeling for treated wastewater usage. Irrig. Drain. Syst. 2009, 23, 97–107. [Google Scholar] [CrossRef]
- Capra, A.; Scicolone, B. Recycling of poor quality urban wastewater by drip irrigation systems. J. Clean. Prod. 2007, 15, 1529–1534. [Google Scholar] [CrossRef]
- Svobodová, K.; Semerád, J.; Petráčková, D.; Novotný, Č. Antibiotic resistance in Czech urban wastewater treatment plants: Microbial and molecular genetic characterization. Microb. Drug Resist. 2018, 24, 830–838. [Google Scholar] [CrossRef] [PubMed]
- Kostich, M.S.; Batt, A.L.; Lazorchak, J.M. Concentrations of prioritized pharmaceuticals in effluents from 50 large wastewater treatment plants in the US and implications for risk estimation. Environ. Pollut. 2014, 184, 354–359. [Google Scholar] [CrossRef] [PubMed]
- Chojnacka, K.; Witek-Krowiak, A.; Moustakas, K.; Skrzypczak, D.; Mikula, K.; Loizidou, M. A transition from conventional irrigation to fertigation with reclaimed wastewater: Prospects and challenges. Renew. Sustain. Energy Rev. 2020, 130, e109959. [Google Scholar] [CrossRef]
- Government of Saudi Arabia. Saudi Vision 2030-Kingdom of Saudi Arabia 2022. Available online: https://vision2030.gov.sa/download/file/fid/417 (accessed on 2 July 2022).
- Husain, T.; Ahmed, A.H. Environmental and economic aspects of wastewater reuse in Saudi Arabia. Water Int. 2009, 22, 108–112. [Google Scholar] [CrossRef]
- Saad-Allah, K.M.; Elhaak, M.A. Hyperaccumulation activity and metabolic responses of Solanum nigrum in two differentially polluted growth habitats. J. Saudi Soc. Agric. Sci. 2017, 16, 227–235. [Google Scholar] [CrossRef]
- APHA Standard Methods for the Examination of Water and Wastewater; Apha: Washington, DC, USA, 2001.
- USEPA, (U.S. Environmental Protection Agency). Method 310.1: Ortho-Phosphorus, Dissolved Automated, Ascorbic Acid; US EPA: Washington, DC, USA, 1992. [Google Scholar]
- O’Dell, J.W. Method 351.2 Determination of Total Kjeldahl Nitrogen by Semi–Automated Colorimetry, Rev. 2.0; US Environmental Protection Agency: Columbus, OH, USA, 1993. [Google Scholar]
- Ogner, G.; Haugen, A. Automatic determination of sulphate in water samples and soil extracts containing large amounts of humic compounds. Analyst 1977, 102, 453–457. [Google Scholar] [CrossRef]
- Song, O.Y.; Islam, M.A.; Son, J.H.; Jeong, J.Y.; Kim, H.E.; Yeon, L.S.; Khan, N.; Jamila, N.; Kim, K.S. Elemental composition of pork meat from conventional and animal welfare farms by inductively coupled plasma-optical emission spectrometry (ICP-OES) and ICP-mass spectrometry (ICP-MS) and their authentication via multivariate chemometric analysis. Meat Sci. 2021, 172, e108344. [Google Scholar] [CrossRef]
- Wallace, A.; Cha, J.W. Trace metals in two garden products derived from sewage sludge. Commun. Soil Sci. Plant Anal. 1977, 8, 819–821. [Google Scholar] [CrossRef]
- Al-Farraj, S.; El-Gendy, A.; Al Kahtani, S.; El-Hedeny, M. The impact of sewage pollution on polychaetes of Al Khumrah, South of Jeddah, Saudi Arabia. Res. J. Environ. Sci. 2012, 6, 77–87. [Google Scholar] [CrossRef]
- Neamatallah, A.A. Possibility of using sewage effluent from different water treatment plants in different cities of Saudi Arabia for agricultural reuse. Int. J. Eng. Res. Technol. 2018, 7, 8–13. [Google Scholar]
- Hayman, D.S.; Tavares, M. Plant growth responses to vesicular-arbuscular mycorrhiza. New Phytol. 1985, 100, 367–377. [Google Scholar] [CrossRef]
- Ditzler, C.A.; Tugel, A.J. Soil quality field tools: Experiences of USDA-NRCS soil quality institute. Agron. J. 2002, 94, 33–38. [Google Scholar] [CrossRef]
- Levlin, E. Conductivity Measurements for Controlling Municipal Waste-water Treatment. In Proceedings of the Proceedings of a Polish-Swedish-Ukrainian seminar, Ustron, Poland, 23–24 November 2007. [Google Scholar]
- Jain, S.K.; Singh, V.P. Water Quality Modeling. In Water Resources Systems Planning and Management; Jain, S.K., Singh, V.P., Eds.; Developments in Water Science; Elsevier: Amsterdam, The Netherlands, 2003; pp. 743–786. [Google Scholar]
- Chapman, D. Water Quality Assessments: A Guide to the Use of Biota, Sediments and Water in Environmental Monitoring; CRC Press: London, UK, 1996. [Google Scholar]
- Minhas, P.S.; Qadir, M.; Yadav, R.K. Groundwater irrigation induced soil sodification and response options. Agric. Water Manag. 2019, 215, 74–85. [Google Scholar] [CrossRef]
- Bouaroudj, S.; Menad, A.; Bounamous, A.; Ali-Khodja, H.; Gherib, A.; Weigel, D.E.; Chenchouni, H. Assessment of water quality at the largest dam in Algeria (Beni Haroun Dam) and effects of irrigation on soil characteristics of agricultural lands. Chemosphere 2019, 219, 76–88. [Google Scholar] [CrossRef]
- Brindha, K.; Vaman, K.V.N.; Srinivasan, K.; Sathis Babu, M.; Elango, L. Identification of surface water-groundwater interaction by hydrogeochemical indicators and assessing its suitability for drinking and irrigational purposes in Chennai, Southern India. Appl. Water Sci. 2014, 4, 159–174. [Google Scholar] [CrossRef]
- Oster, J.; Sposito, G.; Smith, C. Accounting for potassium and magnesium in irrigation water quality assessment. Calif. Agric. 2016, 70, 71–76. [Google Scholar] [CrossRef]
- Cao, X.; Zeng, W.; Wu, M.; Li, T.; Chen, S.; Wang, W. Water resources efficiency assessment in crop production from the perspective of water footprint. J. Clean. Prod. 2021, 309, e127371. [Google Scholar] [CrossRef]
- Brown, J.C. Physiology of Plant Tolerance to Alkaline Soils. In Crop Tolerance to Suboptimal Land Conditions; Jung, G.A., Ed.; Wiley Online Library: Hoboken, NJ, USA, 1978; pp. 257–276. [Google Scholar]
- Goulding, K.W.T. Soil acidification and the importance of liming agricultural soils with particular reference to the United Kingdom. Soil Use Manag. 2016, 390–399. [Google Scholar] [CrossRef]
- Peng, Y.; Gao, Z.; Gao, Y.; Liu, G.; Sheng, L.; Wang, D. Eco-physiological characteristics of alfalfa seedlings in response to various mixed salt-alkaline stresses. J. Integr. Plant Biol. 2008, 50, 29–39. [Google Scholar] [CrossRef]
- Gentili, R.; Ambrosin, R.; Montagnani, C.; Caronni, S.; Citterio, S. Effect of soil pH on the growth, reproductive investment and pollen allergenicity of Ambrosia artemisiifolia L. Front. Plant Sci. 2018, 9, 1–12. [Google Scholar] [CrossRef] [PubMed]
- Jr, R.S.Z.; Stanturf, J.A.; Evett, S.R.; Kandil, N.F.; Soriano, C. Opportunities for woody crop production using treated wastewater in Egypt. I. afforestation strategies. Int. J. Phytoremediation 2011, 13, 102–121. [Google Scholar]
- Lubello, C.; Gori, R.; Nicese, F.P.; Ferrini, F. Municipal-treated wastewater reuse for plant nurseries irrigation. Water Res. 2004, 38, 2939–2947. [Google Scholar] [CrossRef]
- Mishra, T.; Pandey, V.C.; Praveen, A.; Singh, N.B.; Singh, N.; Singh, D.P. Phytoremediation ability of naturally growing plant species on the electroplating wastewater-contaminated site. Environ. Geochem. Health 2020, 42, 4101–4111. [Google Scholar] [CrossRef] [PubMed]
- Khalifa, R.K.M. Nutritional status of some aromatic plants grown to produce volatile oils under treated municipal wastewater irrigation. Aust. J. Basic Appl. Sci. 2009, 5, 2999–3007. [Google Scholar]
- Emongor, V.E.; Ramolemana, G.M. Treated sewage effluent (water) potential to be used for horticultural production in Botswana. Phys. Chem. Earth Parts A/B/C 2004, 29, 1101–1108. [Google Scholar] [CrossRef]
Disclaimer/Publisher’s Note: The statements, opinions and data contained in all publications are solely those of the individual author(s) and contributor(s) and not of MDPI and/or the editor(s). MDPI and/or the editor(s) disclaim responsibility for any injury to people or property resulting from any ideas, methods, instructions or products referred to in the content. |
© 2022 by the author. Licensee MDPI, Basel, Switzerland. This article is an open access article distributed under the terms and conditions of the Creative Commons Attribution (CC BY) license (https://creativecommons.org/licenses/by/4.0/).