Abstract
Selenium (Se) is an essential trace element for human health, and humans mainly consume Se through diet. China is recognized as a Se-deficient country, and the study of Se migration and accumulation relationships between crops and soils is essential for Se-deficient areas. In this experiment, the greenhouse pot experiment of Chinese cabbage (Brassica rapa L. ssp. pekinensis), wheat (Triticum aestivum L.) and pepper (Capsicum annuum L.) were carried out with the Guanzhong region of Shaanxi Province and common farmland soils from Beijing Province. The relationship between the Se content in soil and crops organs (e.g., roots, stems, leaves, grain and fruit) and the differences in the Se-enriching capacity of the organs were analyzed. The following results were obtained: (1) all three field crops could absorb Se from soil, including Se-rich and -regulated soil and reach the standard of Se-enriched vegetables; (2) different organs of Chinese cabbage had different Se-enriching capacity, which can be arranged as leaf > stem > root, while the Se enrichment capacity of wheat was root > leaf > stem > grain, and for pepper it was root > leaf > fruit > stem; (3) when the soil Se regulation content reached 1.0–1.5 mg/kg, the utilization rate of Se in Chinese cabbage and pepper were higher, but when the soil Se regulation reached 4.0–5.0 mg/kg, the utilization rate of Se in wheat was higher.
1. Introduction
Selenium (Se), an important trace element in the human body, is an important part of some antioxidant enzymes and selenoproteins in the human body [1]. Se deficiency can induce Keshan disease, skeletal muscle necrosis and cardiac dysfunction [2,3]. The human body cannot synthesize Se, and obtains Se through diet and other means [4]. The World Health Organization (WHO) sets the recommended intake of Se for healthy adults at 55 μg/d [5]; however, dietary Se deficiency may affect approximately 1 billion people worldwide [6]. Thus, the demand for dietary Se has increased in healthcare and agriculture in recent years [7,8]. A certain range of Se intake can not only improve the function of thyroid cells and immune cells as well as promote the production of thyroid hormone metabolic enzymes [9]; it can also enhance the individual immunity, improve the production of antibodies, increase the activation and proliferation of B lymphocytes and promote the penetration of Se into the spleen and other immune organs [10]. It can also affect allergic reactions by acting on immune cells [11].
Farm crops are the main sources of dietary Se [12]. The Se enrichment capacity of different crops varies greatly, with field crops ranked as: cruciferous > ryegrass > legumes > cereals [13]. Wheat has higher Se bioavailability and has been recommended as a good source of Se in cereals [14,15]. The global Se content of wheat ranged from 0–8.27 mg/kg (mean of 347.30 μg/kg) [16]. However, the Se content of wheat in China ranges from 0–0.821 mg/kg (mean of 64.6 μg/kg) [17], lower than the global average. This is mainly attributed to wheat varieties, basic soil properties, Se biofortification measures and weather conditions [16,18]. In addition to the main food crops, vegetable crops also supplement humans with scarce Se. Bañuelos et al. [19] showed that the Se content in Brassica campestris (B. campestris) leaves reached 3.5 mg/kg. The Se-enriching capacity of B. campestris leaves was higher than that of Indian mustard and Brassica rapa var. perviridis [20]. Peppers are one of the main ingredients in Chinese recipes, but there were few reports of Se enrichment studies on peppers in China. The total Se content of peppers in the Se-rich area of Fengcheng City, Jiangxi Province, ranged from 0.026 to 0.046 mg/kg [21]. The intake of dietary Se could be increased by enhancing the agronomic trait of Se content in crops [22]. Thus, the soil Se content and Se enrichment capacity of crops were the main factors influencing Se content in crops [23].
Differences in climate (precipitation), bedrock and soil organic matter lead to differences in soil Se content in different regions [24]. The soil Se content is mainly obtained from various parent materials of the crust [25]. Favorito, J.E. et al. [26] showed that the level of Se content in the soil affected the Se content in plants. Hu et al. [27] applied sodium selenite in a tea garden with low-Se soil, and the Se content of tea increased from 0.096 mg/kg to 1.4 mg/kg. The average Se content of Chinese cabbage in the Se-rich area of Enshi City, Hubei Province is much higher than that in the Se-deficient area of Suzhou, Jiangsu Province [28,29]. In Se-deficient areas, the addition of 2.5 mg/kg sodium selenite (Na4SeO3) nutrient solution significantly improves the total and organic Se content of Chinese cabbage, and the organic Se conversion rate reaches 92.63% [30]. The application of sodium selenite Se fertilizer increases the soybean Se concentration by an average of 0.01 mg/kg [31], and Flammulina velutipes accumulates nearly 108 mg/kg of organic Se under the treatment with 20 mg/kg selenite treatment, accounting for more than 97% of the total Se [32]. In pot trials, the total Se content of wheat grains with soil applied Se fertilizer (17.35 mg/kg) is much higher than that of the control (2 mg/kg) [33]. However, the relationship between the application of organic Se fertilizer and its optimal application rate on the enrichment of Se in various crops remains unclear.
The degree of Se deficiency in China is relatively severe. The soil Se content in China ranges from 0.01 mg/kg to 16.24 mg/kg, with an average of 0.171 mg/kg [34]. The total area of Se-rich land (>0.4 mg/kg) reached 1.09 million km2, only accounting for approximately 11.2% of the total land area [35]. A discontinuous flaky low-Se belt is observed from eastern Inner Mongolia to the Qinghai-Tibet Plateau, and the Se-deficient area accounts for approximately 31.6% of the land area [35]. According to a survey conducted by the Chinese Nutrition Society, the average Se intake of adults is only 26.63 μg/d, which is far below the standard intake of Se (55 μg/d) [36]. Shaanxi Province is a major agricultural province in China, and Guanzhong area is rich in natural Se-rich land resources.
In this study, the sensitivity of Chinese cabbage, wheat and pepper to the Se in soil was investigated by conducting pot trials on natural Se-rich soil and field soil adding Se fertilizer. In addition, the enrichment capacity of crop organs to Se was discussed by analyzing the Se absorption and correlation of crop organs. The main objectives of this study are (1) to determine the relationship between the crop Se content and the soil Se content, (2) to clarify the Se enrichment effect of crop organs and (3) to reveal the optimal Se application rate to crops. The findings herein help to explain the absorption of Se in soil by crops, and provide a scientific basis for the development of Se-rich agriculture.
2. Materials and Methods
2.1. Study Area
The Guanzhong area is located in the middle of Shaanxi Province, with an area of 55,500 km2 [37]. It has four distinct seasons, sufficient sunshine and a temperate semi-arid continental climate [38]. The annual average temperature is 13.7 °C, and the annual average precipitation is 600 mm [37]. The Se-rich area of the topsoil is 8938.74 km2, accounting for 22.37% of the total area. The Se-rich area of the deep soil is only 53.32 km2, accounting for 0.13% of the total area [39]. The average Se content of topsoil in the Sanyuan–Yanliang Se-rich area is 0.32 mg/kg, the Se content of the soil 1.4 m below is more than 0.3 mg/kg and the average Se content in the Se-rich area of Zhouzhi–Huyi is 0.35 mg/kg [40].
2.2. Experimental Material
The Se-rich soil in the experiment was taken from the surface soil of Huyi North District, Huyi South District, Jingyang County and Sanyuan County in the Guanzhong area of Shaanxi Province, labeled as A1, A2, A3 and A4, respectively. Soil total phosphorus content is 0.052–0.07%, total potassium content is 1.9–2.6%, slow-release potassium content is 750–1160 mg/kg, organic matter is 1–1.5%, pH is 7.5–8.5. Se-regulated experiment soil (denoted as B) was from farmland tillage surface soil in Beijing, and no Se content was detected in the soil. The mechanical composition of soil was determined by Malvin MS 2000 laser particle size analyzer, and the Se content of the soil was determined by atomic absorption spectrophotometry. According to China’s soil Se standard (0.1–0.2 mg/kg for low-Se soil, 0.2–0.4 mg/kg for sufficient-Se soil, higher than 0.4 mg/kg for Se-rich soil [41]), the soil was classified. The specific data are shown in Table 1.

Table 1.
Soil basic properties.
Chinese cabbage seeds were produced by Nanjing Qiutian Seed Research Institute, wheat seeds were Zhoumai 21 developed by Zhoukou Agricultural Science Academy in Henan Province and pepper seeds were from Jingyan Yinong (Beijing) Sci-Tech Co., Ltd (No.101, Floor 1, Building 33, Banjing Village Vegetable Research Center, Zizhuyuan Street, Haidian District, Beijing). The Se fertilizer was obtained from Tangshan Jinguo Agricultural Technology Development Company Ltd (Sluice commercial area of the eighth farm in Caofeidian District). The main components were amino acids (100 mg/L), trace elements such as iron, potassium, boron and zinc (≥20 mg/L), and organic Se synthesis agent (>6 g/L).
2.3. Experimental Design
The pot experiment was carried out in a constant temperature and humidity greenhouse at 26 °C. The test device is shown in Figure 1. A round plastic flowerpot with an inner diameter of 22 cm and a depth of 20 cm was used for the cultivation of Chinese cabbage. Eight treatments were set up. Four Se-rich soils with different Se contents (0.172, 0.258, 0.323, 0.364) were set as one group, marked as A1C, A2C, A3C and A4C, and the other group was common farmland soils with different Se contents (1.0, 1.5, 2.0, 2.5), marked as B1C, B2C, B3C and B4C. Pepper was planted in the same circular flowerpot, and four treatments were set up. The same Se fertilizer content was added to the pot experiment, labeled as B1P, B2P, B3P and B4P. Wheat was planted in a 40 cm × 15 cm × 20 cm-long flowerpot, and eight groups were set up. Among them, the Se-riched soils with different Se contents (0.172, 0.258, 0.323, 0.364) were labeled as A1W, A2W, A3W and A4W, respectively. The other group was ordinary farmland soil with different Se fertilizer contents (1.0, 2.5, 4.0, 5.0), marked as B5W, B6W, B7W and B8W. The specific design is shown in Table 2. Each treatment was repeated three times, a total of 60 pots.
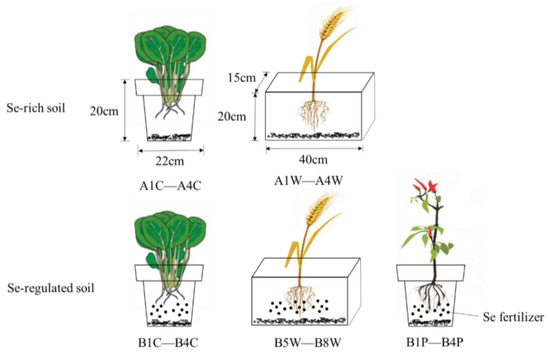
Figure 1.
The pots of different treatments in the experiment.
Table 2.
Pot experiment treatment.
Before loading, an appropriate amount of gravel is paved on the basin floor in advance as a drainage filler to cover the drainage hole. Each pot is filled with soil according to the designed bulk density. After filling the soil in pots, an appropriate amount of water was added to balance the soil. Sowing began after 7 days, and Se fertilizer was applied in the corresponding treatment before sowing. A total of 20 seeds were sown per pot at a depth of 0.5 cm. After sowing, irrigate to field water holding capacity until emergence. When the seedlings grew 2 true leaves, thinning was carried out, with 10 seedlings per pot for Chinese cabbage and wheat, and 3 seedlings per pot for pepper. The soil moisture content of all treatments was maintained at about 70% of the field water holding rate during the crop growth period, and no other fertilizers were applied during the period.
2.4. Sample Collection and Indicator Determination
Determination of crop Se content: the crops were harvested according to each organ (root, stem, leaf, fruit), with distilled water to clean the roots and leaves, which were dried with absorbent paper. After weighing the fresh weight, the plant samples were killed at 105 °C for 30 min, then dried at 75 °C to a constant weight, and the biomass of each organ was measured by electronic balance. The samples were digested with HNO3-HClO4 (volume ratio of 4:1) and reduced with 6 mol/L hydrochloric acid, and then determined by hydride generation–atomic fluorescence spectrometry (Beijing Jitian AFS-930 dual-channel atomic fluorescence spectrometer) [42].
Determination of soil Se content: soil samples were naturally air dried and sieved (20 mesh). Using HNO3-HClO4 (volume ratio of 3:2): digestion, the subsequent steps were the same as the determination of Se in crop samples.
Enrichment coefficient is used to represent the ability of crops to absorb Se from soil, namely crop Se absorption rate [43]. The formula is as follows:
where K is the enrichment coefficient of Se; Ccrop is the Se content in crops (mg/kg); Csoil is the Se content in soil (mg/kg).
2.5. Data Analysis
Data were organized with Excel 2019; SPSS software was used for statistical analysis. Duncan’s ANOVA was used to determine whether the difference of crop Se content and soil Se content among different treatments was significant, and the Se-rich ability of each crop was analyzed.
3. Results
3.1. Uptake and Utilization of Se by Chinese Cabbage
3.1.1. Se Content of Chinese Cabbage in Soils with Different Se Content
Figure 2 shows the Se content of Chinese cabbage in Se-rich and -regulated soil. In the low-Se-content soil (A1C), the Se content in Chinese cabbage was 0.01 mg/kg. In the sufficient-Se-content soil (A2C, A3C and A4C), the Se content of Chinese cabbage was more than 0.03 mg/kg. Notably, when the Se content in soil was more than 0.258 mg/kg, the Se content of Chinese cabbage remarkably increased. Compared with A1C, the Se content of Chinese cabbage in A2C, A3C and A4C increased by 3.49, 17.02, and 6.91 times, respectively. With the increase of the soil Se content, the Se content in Chinese cabbage increased firstly and then decreased, and the turning point was 0.323 mg/kg Se in soil (A3C).
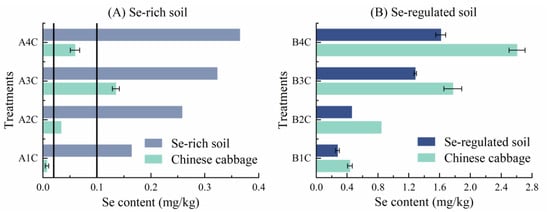
Figure 2.
Se content of Se-rich soil and Se-regulated soil and Chinese cabbage. (A) represents the Se content of Se-rich soil and Chinese cabbage; (B) represents the Se content of Se-regulated soil and Chinese cabbage. Blackline interval represents Se-rich vegetable standard of Shaanxi Province.
In Se-regulated soil, when the added Se in the soil increased from 1.0 mg/kg to 2.5 mg/kg, the Se content in Chinese cabbage increased from 0.43 mg/kg to 2.61 mg/kg correspondingly. The results showed that the Se content in Chinese cabbage increased with the increase of Se content in soil.
3.1.2. Se Content of Chinese Cabbage Organs in Different Se Content Soils
Figure 3 shows the Se content in different organs of Chinese cabbage in Se-rich and -regulated soil. In A1C, the Se content was not observed in roots and stems, but a small amount of Se content was found in leaves. In A2C and A4C, the leaves accumulated higher Se content at 0.05 mg/kg and 0.08 mg/kg, respectively. The amount of Se in the roots and stems contended about 1/2 as leaves in A2C and A2C. In A3C, the Se accumulation in leaves, roots and stems were highest than other treatments in Se-rich soil. In Se-regulated soil (B1C–B4C), with the increase of Se fertilizer, the Se content in leaves increased from 0.55 mg/kg to 4.06 mg/kg, and the Se in the roots and stems was about 1/2 of leaves. In B1C, B2C and B3C, the Se content was about the same in the stems and roots.
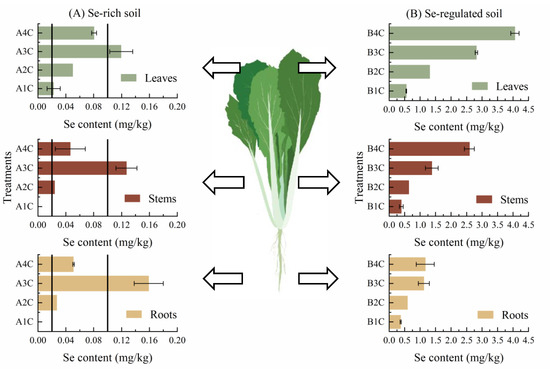
Figure 3.
Comparison of Se content in the soil and different parts of Chinese cabbage. (A) represents the Se content of different parts of Chinese cabbage in Se-rich soil; (B) represents the Se content of different parts of Chinese cabbage in Se-regulated soil. Blackline interval represents Se-rich vegetable standard of Shaanxi Province.
3.1.3. Se enrichment Capacity of Chinese Cabbage for Soil Se
Figure 4 shows the Se absorption rate of Chinese cabbage in the Se-rich soil and Se-regulated soil. In the Se-rich soil, the Se absorption rate of Chinese cabbage increased firstly and then decreased with the increase of Se content in soil. The average utilization rate of Se in the soil by the leaves was the highest, ranging from 13% to 35%. In A3C, the root had the highest utilization rate of Se, but in other treatments, the leaves had the highest utilization rate of Se. In the Se-regulated soil, the Se absorption rate of the leaves was proportional to the Se content in soil approximately, but the root had a low tolerance to a high concentration of Se, which would decrease with the increase of Se concentration in the soil.
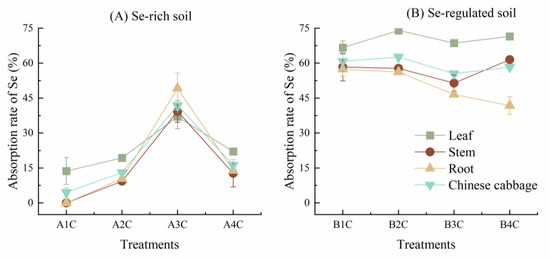
Figure 4.
Correlation of Se content with soil and absorption rate of Se by Chinese cabbage in Se-rich soil and Se-regulated soil. (A) represents absorption rate of Se by Chinese cabbage in Se-rich soil; (B) represents absorption rate of Se by Chinese cabbage in Se-regulated soil.
3.2. Uptake and Utilization of Se by Wheat
3.2.1. Se Content of Wheat in Soils with Different Se Content
Figure 5 shows the Se content of wheat in Se-rich and -regulated soil. In the low-Se-content soil (A1W), the Se content in wheat was 0.046 mg/kg. In the sufficient-Se-content soil (A2W, A3W and A4W), the Se content of wheat was more than 0.05 mg/kg. Notably, when the Se content in soil was more than 0.258 mg/kg, the Se content of wheat remarkably increased. Compared with A1W, the Se content of wheat in A2W, A3W and A4W increased by 0.17, 4.04, and 1.77 times, respectively. With the increase of the soil Se content, the Se content in wheat increased firstly and then decreased, and the turning point was 0.323 mg/kg Se content in soil (A3W).
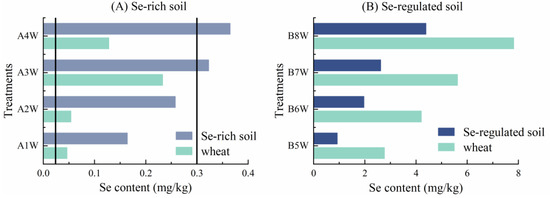
Figure 5.
Se content of Se-rich soil and Se-regulated soil and wheat. (A) represents the Se content of Se-rich soil and wheat; (B) represents the Se content of Se-regulated soil and wheat. Blackline interval represents Se-rich wheat standard of Shaanxi Province.
When the added Se in the soil increased from 1.0 mg/kg to 5.0 mg/kg, the Se content in wheat increased from 2.77 mg/kg to 7.82 mg/kg correspondingly. The results showed that with the increase of the soil Se content, the Se content in wheat increased firstly and then decreased, which was consistent with the Se-rich soil experiment.
3.2.2. Se Content of Wheat Organs in Different Se Content Soils
Figure 6 shows the Se content in different organs of wheat in Se-rich soil and Se-regulated soil. In general, the highest Se accumulation was in the roots and the lowest was in the grains in Se-rich soil. In A1W, there was no observable Se content in grain, but a small amount of Se content in the stems, leaves and roots. In A2W and A4W, the roots’ Se content was 0.074 mg/kg and 0.23 mg/kg, respectively, which was higher than that in leaves and stems. In A3W, Se uptake was highest in the roots (0.31 mg/kg) and lowest in the grains. However, the grains and roots accumulated more Se fertilizer than the leaves and stems in general.
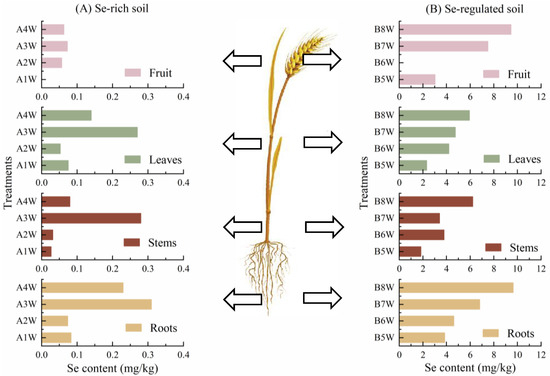
Figure 6.
Comparison of Se content in the soil and different parts of wheat. (A) represents the Se content of different parts of wheat in Se-rich soil; (B) represents the Se content of different parts of wheat in Se-regulated soil.
When the amount of Se fertilizer added to the soil increased from 1.0 mg/kg to 5.0 mg/kg, the Se content in the grains increased from 3.04 mg/kg to 9.46 mg/kg and the Se content in the roots increased from 3.86 mg/kg to 9.65 mg/kg. The Se content of the leaves and stems was not very different.
3.2.3. Se Enrichment Capacity in Organs of Wheat
Figure 7 shows the Se absorption rate of wheat in the Se-rich soil and Se-regulated soil. In the Se-rich soil, the rate of Se absorption by wheat showed a decreasing–increasing–decreasing fluctuation with the increasing of Se content in the soil. The roots had the highest average Se absorption rate, ranging from 28% to 96%, and the grains and stems had the lowest average Se absorption rate. It was worth noting that the wheat in A3W had the highest Se absorption rate. In the Se-regulated soil, the Se absorption rate of wheat showed an increasing–decreasing–increasing fluctuation with the increasing of Se content in the soil, although the trend was not significant.
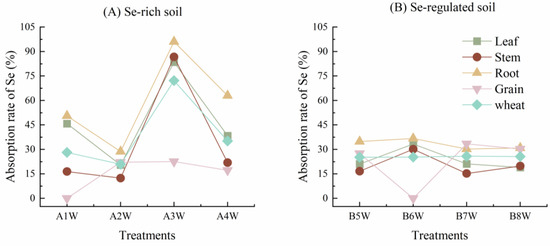
Figure 7.
Correlation of Se content with soil and absorption rate of Se by wheat in Se-rich soil and Se-regulated soil. (A) represents absorption rate of Se by wheat in Se-rich soil; (B) represents absorption rate of Se by wheat in Se-regulated soil.
3.3. Uptake and Utilization of Se by Pepper
3.3.1. Se Content of Pepper in Soils with Different Se Content
Figure 8 shows the Se content in different organs of pepper in Se-regulated soil. The Se content of pepper was 3.04 mg/kg to 5.51 mg/kg when the added Se fertilizer was 1.0 mg/kg to 2.5 mg/kg. With the increase of Se fertilizer added, the Se content of different organs of pepper showed an increasing–decreasing–increasing fluctuating trend. When the added Se fertilizer amount was 1.0 mg/kg to 2.5 mg/kg, the Se content of roots was the highest, and leaves and fruits contented almost same amount of Se.
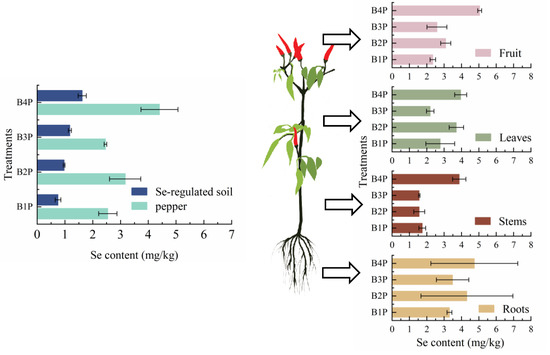
Figure 8.
Comparison of Se content in the soil and different organs of pepper.
3.3.2. Se Enrichment Capacity in Organs of Pepper
Figure 9 shows the Se absorption rate of pepper in the Se-regulated soil. In the Se-regulated soil, the Se absorption rate of pepper showed an increasing fluctuation with the increasing amount of Se fertilizer added. The roots had the highest average absorption rate of Se, ranging from 23% to 32%. The stems had a lower average absorption rate of Se. Notably, the fruit in B4P had the highest Se absorption rate of Se than other organs; however, the roots in other treatments had the highest Se absorption rate of Se than other organs.
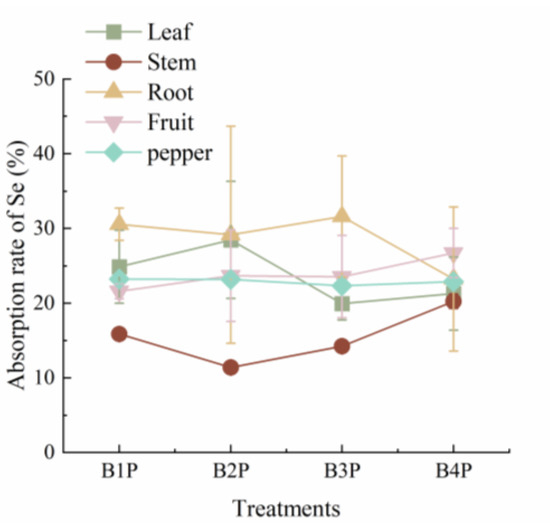
Figure 9.
Correlation of Se content with soil and absorption rate of Se by pepper in Se-regulated soil.
4. Discussion
4.1. Effect of Soil Se Content on the Se Accumulation of Vegetations
Increasing the Se content in the soil can promote the Se content and yield of vegetations [44]. In the present study, the Se content in vegetations generally increased with the increase of Se content in soil. Yang et al. [45] found that the Se content in the aboveground and underground parts of Chinese cabbage gradually increased with the increase of Se concentration in soil. Wheat fertilized with 0.2 mg/kg of Se in the soil had a Se content of 0.732 mg/kg, which was higher than in fertilized soil with 0.05 mg/kg of Se (0.155 mg/kg) [46]. These findings were consistent with the results of the present experiment.
The Se content of Chinese cabbage and wheat was significantly higher in the Se-regulated soils than in the natural Se-rich soils, indicating that the addition of exogenous Se was more beneficial to the uptake of Se in both vegetations. Tang et al. [47] also found that the higher the addition of exogenous Se into the soil, the more obvious the Se enrichment effect of Chinese cabbage. However, excessive levels of Se in the soil can also have some negative effects. In this experiment, the Se content of the crop decreased under the A4C, A4W and B4W. The results indicate that the uptake of Se by vegetation and even its growth and development can be inhibited when the Se concentration in the soil exceeds a certain range, which was consistent with the results of Guo [48] and Zhang et al. [49]. This phenomenon occurred because the change in the permeability coefficient of certain ions in the biofilm reduces the uptake of nutrients by vegetables [50], leading to a decrease in the crop’s own Se content. Therefore, for areas with low Se content such as A2, organic Se or Se fertilizer could be appropriately added to increase the absolute Se content, improve the soil properties, and promote the increase of available Se in the soil.
4.2. Se Enrichment Capacity of Different Organs of Vegetations
The Se enrichment ability of each organ in different vegetation is different. In this study, Chinese cabbage had the highest Se enrichment in its leaves, followed by stems and roots, the Se enrichment ability of wheat was root > leaf > stem > grain and pepper showed root > leaf > fruit > stem. This phenomenon was mainly related to the redistribution mechanism of Se. After it was absorbed by roots, inorganic Se was transported to the aboveground tissues through the xylem, and then redistributed through the phloem [51]. During respiration in the root system, a small proportion of the Se absorbed by the roots were translocated to the above-ground branches and leaves, with the majority translocated to the roots [52]. Harvey et al. [53] found that Se mainly accumulates in the young leaves, pods, and main roots of soybeans, with lower concentrations of Se in fine roots and stems. Wan et al. [54] found that the edible parts of tomato and beet have lower Se content than their non-edible parts. the distribution of Se in different parts of wheat under foliar spraying of Se can be arranged as leaf > root > grain > glume > stem [55]. The above results prove this theory.
The addition of Se fertilizer also promoted the accumulation of Se in crops. When the content of Se in soil reached 1.0–1.5 mg/kg, the utilization rate of Se was higher in Chinese cabbage and wheat. When the content of Se in soil reached 4.0–5.0 mg/kg, the utilization rate of Se in wheat was higher. The absorption and accumulation of Se by crops mainly depend on the bioavailability of Se in soil [56]. The addition of Se fertilizer can regulate soil properties, further improve the interaction between soil microbial community structure and microbial vegetation, and increase the bioavailability of Se in soil, thereby increasing the Se enrichment capacity of crops [57]. In summary, Chinese cabbage, wheat and pepper were suitable for high-quality Se-rich field crops as a human Se supplement.
5. Conclusions
Chinese cabbage, wheat and pepper could absorb Se from Se-rich soil and Se-regulated soil successfully, and the Se enrichment capacity in different organs was different. The Se content in the leaves was the highest in Chinese cabbage in the Se-rich soil. The Se content in the roots was the highest in wheat in the Se-rich soil and the Se content in the grain met the standard of Se enrichment. Therefore, when planting vegetables in Se-rich soil, cruciferous vegetables whose edible parts are leaves should be used. Wheat grain in Jingyang county had a high Se content, and the crops in this area had the highest utilization of soil Se. In the Se-regulated soil, wheat had a higher Se utilization rate when the soil Se regulation content reached 4.0–5.0 mg/kg, and Chinese cabbage and pepper had a higher Se utilization rate when the soil Se regulation content reached 1.0–1.5 mg/kg. Although the individual organs of the three crops differed in their Se content, they all contained Se in their edible parts to meet the Se intake required by humans.
Therefore, when targeting field crops in Se-rich areas, peppers and cruciferous large-leaf vegetables with edible parts of leaves and cereals such as wheat can be chosen so that the Se in the soil can be better utilized and more amounts of Se can be absorbed by humans and animals after consumption. Based on the results of the trial, it is suggested to plant Chinese cabbage in Sanyuan County and wheat in Jingyang County, so as to develop Se-rich agriculture in Guanzhong area.
Author Contributions
Data curation, Y.W.; project administration, Z.T.; supervision, C.W., Y.L.; writing—original draft preparation, Q.S.; writing—review and editing, Y.W., C.W., Y.L. All authors have read and agreed to the published version of the manuscript.
Funding
The study was financially supported by the Basic Research Program of Jiangsu Province (Grant No. BK20210824), the Natural Science Research of Higher Education in Jiangsu Province (Grant No. 20KJD416004), and Yangzhou Talent Project of Jiangsu Province (Grant No. YZLYJF2020PHD096).
Institutional Review Board Statement
Not applicable.
Informed Consent Statement
Not applicable.
Data Availability Statement
Not applicable.
Acknowledgments
The study was financially supported by the Basic Research Program of Jiangsu Province, the Natural Science Research of Higher Education in Jiangsu Province, and Yangzhou Talent Project of Jiangsu Province.
Conflicts of Interest
The authors declare no conflict of interest.
References
- Zhu, Y.G.; Elizabeth, A.H.P.; Zhao, F.J.; Paul, N.W.; Andrew, A.M. Selenium in higher plants: Understanding mechanisms for biofortification and phytoremediation. Trends Plant Sci. 2009, 14, 436–442. [Google Scholar] [CrossRef]
- Vinceti, M.; Filippini, T.; Wise, L.A. Environmental Selenium and Human Health: An Update. Curr. Environ. Health Rep. 2018, 5, 464–485. [Google Scholar] [CrossRef]
- Song, T.J.; Su, X.S.; He, J.; Liang, Y.K.; Zhou, T.; Liu, C. Selenium (Se) uptake and dynamic changes of Se content in the soil-plant systems. Environ. Sci. Pollut. Res. Int. 2018, 25, 34343–34350. [Google Scholar] [CrossRef]
- Qiao, H.; Yin, J.M.; Jiang, F.; Yuan, H.L.; Tan, W.M. Se-enrichment characteristics of Enterobacter mori and its Se strengthening effect on corn grain. Trans. Chin. Soc. Agric. Eng. 2018, 34, 284–290. [Google Scholar]
- Wesselink, E.; Koekkoek, W.A.C.; Grefte, S.; Witkamp, R.F.; Van Zanten, A.R.H. Feeding mitochondria: Potential role of nutritional components to improve critical illness convalescence. Clin. Nutr. 2019, 38, 982–995. [Google Scholar] [CrossRef]
- Jones, G.D.; Droz, B.; Greve, P.; Gottschalk, P.; Poffet, D.; Mcgrath, S.P.; Seneviratne, S.I.; Smith, P.; Winkel, L.H.E. Selenium deficiency risk predicted to increase under future climate change. Proc. Natl. Acad. Sci. USA 2017, 114, 2848–2853. [Google Scholar] [CrossRef]
- Joseph, C.A.; Peter, R.H. Selenium, Selenoproteins, and Immunity. Nutrients 2018, 10, 1203. [Google Scholar]
- Ismael, M.A.; Elyamine, A.M.; Moussa, M.G.; Cai, M.; Zhao, X.; Hu, C. Cadmium in plants: Uptake, toxicity, and its interactions with selenium fertilizers. Met. Integr. Biometal Sci. 2019, 11, 255–277. [Google Scholar] [CrossRef]
- Schomburg, L. Selenium, selenoproteins and the thyroid gland: Interactions in health and disease. Nat. Rev. Endocrinol. 2011, 8, 160–171. [Google Scholar] [CrossRef]
- Zhao, X.; Hogenkamp, A.; Li, X.; Chen, H.; Garssen, J.; Knippels, L.M.J. Role of selenium in IgE mediated soybean allergy development. Crit. Rev. Food Sci. Nutr. 2022, 20, 1–9. [Google Scholar] [CrossRef]
- Zhu, K.; Yang, S.; Li, T.; Huang, X.; Dong, Y.; Wang, P.; Huang, J. Advances in the Study of the Mechanism by Which Selenium and Selenoproteins Boost Immunity to Prevent Food Allergies. Nutrients 2022, 14, 3133. [Google Scholar] [CrossRef] [PubMed]
- Natasha; Shahid, M.; Niazi, N.K.; Khalid, S.; Murtaza, B.; Bibi, I.; Rashid, M.I. A critical review of selenium biogeochemical behavior in the soil-plant system with an inference to human health. Environ. Pollut. 2018, 234, 915–934. [Google Scholar] [CrossRef] [PubMed]
- Xu, W. Bio-availability of Selenium and Its Absorption for Plants. Anhui Agric. Sci. Bull. 2009, 15, 46–47+67. [Google Scholar]
- Anjum, K.; Kalpana, P. Bioaccessibility of selenium, selenomethionine and selenocysteine from foods and influence of heat processing on the same. Food Chem. 2016, 194, 1293–1299. [Google Scholar]
- Thiry, C.; Ruttens, A.; De Temmerman, L.; Schneider, Y.J.; Pussemier, L. Current knowledge in species-related bioavailability of selenium in food. Food Chem. 2012, 130, 767–784. [Google Scholar] [CrossRef]
- Wang, M.; Li, B.; Li, S.; Song, Z.; Kong, F.; Zhang, X. Selenium in Wheat from Farming to Food. J. Agric. Food Chem. 2021, 69, 15458–15467. [Google Scholar] [CrossRef]
- Liu, Q.; Tian, X.; Shi, Y.X. Effect of exogenous Se mineral powder on the accumulation of Se and the absorption of mineral elements in maize. J. Plant Nutr. Fertil. 2016, 22, 403–409. [Google Scholar]
- Liu, Y.X.; Huang, S.H.; Jiang, Z.H.; Wang, Y.Z.; Zhang, Z.M. Selenium Biofortification Modulates Plant Growth, Microelement and Heavy Metal Concentrations, Selenium Uptake, and Accumulation in Black-Grained Wheat. Front. Plant Sci. 2021, 12, 748523. [Google Scholar] [CrossRef]
- Bañuelos, G.S.; Mayland, H.F. Absorption and Distribution of Selenium in Animals Consuming Canola Grown for Selenium Phytoremediation. Ecotoxicol. Environ. Saf. 2000, 46, 322–328. [Google Scholar] [CrossRef]
- Ayako, Y.; Yasuko, O.; Yasumi, A.; Yasumitsu, O. Comparison of Selenium Metabolism in Three Brassicaceae Plants. J. Health Sci. 2010, 56, 699–704. [Google Scholar]
- Zhang, X.X.; Lv, A.Q.; Cheng, C.; Liu, S.; Li, A.N. Study on Selenium Content in Peppers from Different Regions. Anhui Agric. Sci. Bull. 2021, 27, 58–59+125. [Google Scholar]
- Mathers, A.W.; Young, S.D.; McGrath, S.P.; Zhao, F.J.; Crout, N.M.J.; Bailey, E.H. Determining the fate of selenium in Wheat biofortification: An isotopically labelled field trial study. Plant Soil 2017, 420, 61–77. [Google Scholar] [CrossRef]
- Boldrin, P.F.; Faquin, V.; Clemente, A.D.C.S.; De Andrade, T.; Guilherme, L.R.G. Genotypic Variation and Biofortification with Selenium in Brazilian Wheat Cultivars. J. Environ. Qual. 2018, 47, 1371–1379. [Google Scholar] [CrossRef] [PubMed]
- Williams Araújo do Nascimento, C.; Bruno Viera da Silva, F.; de Brito Fabricio Neta, A.; Miranda Biondi, C.; Aparecida da Silva Lins, S.; Bezerra de Almeida Júnior, A.; Preston, W. Geopedology-climate interactions govern the spatial distribution of selenium in the soils: A case study in northeastern Brazil. Geoderma 2021, 399, 115119. [Google Scholar] [CrossRef]
- Reynolds, R.J.B.; Pilon-Smits, E.A. Plant selenium hyperaccumulation- Ecological effects and potential implications for selenium cycling and community structure. BBA-Gen. Subj. 2018, 1862, 2372–2382. [Google Scholar] [CrossRef]
- Favorito, J.E.; Grossl, P.R.; Davis, T.Z.; Eick, M.J.; Hankes, N. Soil-plant-animal relationships and geochemistry of selenium in the Western Phosphate Resource Area (United States): A review. Chemosphere 2020, 266, 128959. [Google Scholar] [CrossRef]
- Hu, Q.H.; Pan, G.X.; An, X.X.; Zhu, J.C.; Ding, R.X. Study on selenium relative bioavailability of Se-enriched tea and its effect on rat phagocytic cell function. J. Nanjing Agric. Univ. 2000, 14, 89–92. [Google Scholar]
- Li, M.L.; Yang, B.Y.; Xu, K.Y.; Zheng, D.S.; Tian, J.C. Distribution of Se in the rocks, soil, water and crops in Enshi County, China. Appl. Geochem. 2020, 122, 104707. [Google Scholar] [CrossRef]
- Gao, J.; Liu, Y.; Huang, Y.; Lin, Z.Q.; Gary, S.B.; Michael, H.L.; Yin, X.B. Daily selenium intake in a moderate selenium deficiency area of Suzhou, China. Food Chem. 2011, 126, 1088–1093. [Google Scholar] [CrossRef]
- Xie, W.W. Comparative Study on Selenium Enrichment Ability among Different Brassica Vegetables; Southwest University: Chongqing, China, 2016. [Google Scholar]
- Ngigi, P.B.; Lachat, C.; Masinde, P.W.; Du Laing, G. Agronomic biofortification of maize and beans in Kenya through selenium fertilization. Environ. Geochem. Health 2019, 41, 2577–2591. [Google Scholar] [CrossRef]
- Dong, Z.; Xiao, Y.; Wu, H. Selenium accumulation, speciation, and its effect on nutritive value of Flammulina velutipes (Golden needle mushroom). Food Chem. 2020, 350, 128667. [Google Scholar] [CrossRef] [PubMed]
- Li, T.; Sun, F.Y.; Gong, P.; Wang, A.; Yuan, L.X.; Yin, X.B. Effects of nano-selenium fertilization on selenium concentration of Wheat grains and quality-related traits. J. Plant Nutr. Fertil. 2017, 23, 427–433. [Google Scholar]
- Liu, H.L.; Wang, X.Q.; Zhang, B.M.; Han, Z.X.; Wang, W.; Chi, Q.H.; Zhou, J.; Nie, L.S.; Xu, S.F.; Liu, D.S.; et al. Concentration and distribution of selenium in soils of mainland China, and implications for human health. J. Geochem. Explor. 2021, 220, 106654. [Google Scholar] [CrossRef]
- Wang, Q.X.; Liu, Q.Q.; Liu, H.L.; Hu, Q.H.; Wu, H.; Wang, W. Key elements and human health: Is China’s arable land selenium-deficient? Earth Sci. Front. 2021, 28, 412–423. [Google Scholar]
- Gu, W.; Zhou, B.; Huang, L.C.; Wang, W.; Zhu, Y.B.; Zhao, D.; Fang, Y.Q.; Zhang, R.H. A research on the dietary intake of selenium among rural and urban residents. Prev. Med. 2014, 26, 977–981. [Google Scholar]
- Liu, N.; Wang, M.; Zhou, F.; Zhai, H.; Qi, M.X.; Liu, Y.; Li, Y.N.; Zhang, N.C.; Ma, Y.Z.; Huang, J.; et al. Selenium bioavailability in the soil-Wheat system and its dominant influential factors: A field study in Shaanxi province, China. Sci. Total Environ. 2021, 770, 144664. [Google Scholar] [CrossRef]
- Zhang, S.X.; Li, B.; Luo, K.L. Differences of selenium and other trace elements abundances between the Kaschin-Beck disease area and nearby non-Kaschin-Beck disease area, Shaanxi Province, China. Food Chem. 2021, 373, 131481. [Google Scholar] [CrossRef]
- Ren, R.; Wang, M.X.; Chen, J.P.; Chao, X.; Wang, H.; Xie, Y.; Meng, Q.Y. Distribution of soil selenium in Guanzhong Area and its influencing factors. Miner. Explor. 2018, 9, 1827–1833. [Google Scholar]
- Wang, D.S.; He, L.; He, L.; Xie, H.P. Development Prospect of Selenium-rich Industry in Guanzhong Area of Shaanxi Province. West-China Explor. Eng. 2018, 30, 149–151. [Google Scholar]
- Li, J.; Zhang, G.; Ge, X. Geochemical Environmental Characteristics and Prediction of Selenium Deficiency and Excess in Human Body; Geological Publishing House: Beijing, China, 2000. [Google Scholar]
- Ban, L.; Ding, Y.F. Distribution Characteristics of Selenium in Soil of Guangxi; Environmental Monitoring in China: Beijing, China, 1992.
- Gu, Q.; Yang, Z.; Yu, T.; Ji, J.; Hou, Q.; Zhang, Q. Application of ecogeochemical prediction model to safely exploit seleniferous soil. Ecotoxicol. Environ. Saf. 2019, 177, 133–139. [Google Scholar] [CrossRef]
- Xue, M.; Chen, Y.; Liu, H.Q.; Xia, J.; Sun, H.J.; Zong, L.G.; Pei, F.; Hu, Q.H.; Fang, Y. Study of selenium-enriched fertilizer and its application. Soil Fertil. Sci. China 2016, 1, 1–6. [Google Scholar]
- Yang, H.; Yang, X.; Ning, Z.; Kwon, S.Y.; Li, M.; Tack, F.M.G.; Kwon, E.E.; Rinklebe, J.; Yin, R. The beneficial and hazardous effects of selenium on the health of the soil-plant-human system: An overview. J. Hazard. Mater. 2021, 422, 126876. [Google Scholar] [CrossRef] [PubMed]
- Ducsay, L.; Ložek, O.; Varga, L. The influence of selenium soil application on its content in spring Wheat. Plant Soil Environ. 2009, 64, 80–84. [Google Scholar] [CrossRef]
- Tang, J.; Xiao, K.C.; Duan, P.; Li, D.J.; Liu, Y.X. Effects of selenium fertilization on selenium uptake of pakchoi and soil biological activities. Res. Agric. Mod. 2021, 42, 755–763. [Google Scholar]
- Guo, K.X.; Yao, C.X.; Zhou, S.B.; Wang, J.M. Effects of Selenium Application on the Selenium Content, Yield, Qualities and Biological Characteristics of Greens. J. Soil Water Conserv. 2010, 24, 195–198+203. [Google Scholar]
- Zhang, W.; Geng, Z.C. Research Progress Regarding the Effect of Exogenous Selenium on Vegetables. Acta Hortic. Sin. 2012, 39, 1749–1756. [Google Scholar]
- Fahim, N.; Fahim, N.; Muhammad, N.T.; Muhammad, Y.A.; Muhammad, N.; Bilal, Z.; Muhammad, S.; Rana, N.S.; Muhammad, A. Selenium Supplementation Affects Physiological and Biochemical Processes to Improve Fodder Yield and Quality of Maize (Zea mays L.) under Water Deficit Conditions. Front. Plant Sci. 2016, 7, 1438. [Google Scholar]
- Yang, H.T. Effects of Different Selenium Sources on the Quality, Nutrient Absorption, Yield Andantioxidant Capacity of Pakchoi; Gansu Agricultural University: Lanzhou, China, 2021. [Google Scholar]
- Li, C.X.; Cao, H. The research overview of the nutrition characteristics, absorption and transformation of the plant selenium. J. Agric. Sci. 2006, 27, 72–76. [Google Scholar]
- Harvey, M.; Erskine, P.D.; Harris, H.H.; Brown, G.K.; Pilon-Smits, E.A.H.; Casey, L.W.; Echevarria, G.; Van Der Ent, A. Distribution and chemical form of selenium in Neptunia amplexicaulis from Central Queensland, Australia. Met. Integr. Biometal Sci. 2020, 12, 514–527. [Google Scholar] [CrossRef]
- Wan, H.F.; Mikkelsen, R.L.; Page, A.L. Selenium Uptake by Some Agricultural Crops from Central California Soils. J. Environ. Qual. 1988, 17, 269–272. [Google Scholar] [CrossRef]
- Wang, M.; Ali, F.; Wang, M.; Dinh, Q.T.; Zhou, F.; Bañuelos, G.S.; Liang, D.L. Understanding boosting selenium accumulation in Wheat (Triticum aestivum L.) following foliar selenium application at different stages, forms, and doses. Environ. Sci. Pollut. Res. Int. 2020, 27, 717–728. [Google Scholar] [CrossRef] [PubMed]
- Peng, Q.; Guo, L.; Ali, F.; Li, J.; Qin, S.; Feng, P.Y.; Liang, D.L. Influence of Pak choi plant cultivation on Se distribution, speciation and bioavailability in the soil. Plant Soil 2016, 403, 331–342. [Google Scholar] [CrossRef]
- De Feudis, M.; Massaccesi, L.; D’Amato, R.; Businelli, D.; Casucci, C.; Agnelli, A. Impact of Na-selenite fertilization on the microbial biomass and enzymes of a soil under corn (Zea mays L.) cultivation. Geoderma 2020, 373, 114425. [Google Scholar] [CrossRef]
Disclaimer/Publisher’s Note: The statements, opinions and data contained in all publications are solely those of the individual author(s) and contributor(s) and not of MDPI and/or the editor(s). MDPI and/or the editor(s) disclaim responsibility for any injury to people or property resulting from any ideas, methods, instructions or products referred to in the content. |
© 2022 by the authors. Licensee MDPI, Basel, Switzerland. This article is an open access article distributed under the terms and conditions of the Creative Commons Attribution (CC BY) license (https://creativecommons.org/licenses/by/4.0/).