Article

The Enabling Effect of Intellectual Property Strategy on Total Factor Productivity of Enterprises: Evidence from China’s Intellectual Property Model Cities

1
Glorious Sun School of Business and Management, Donghua University, Shanghai 200051, China
2
The College of Economic and Management, Tarim University, Alar 843300, China
*
Author to whom correspondence should be addressed.
Sustainability 2023, 15(1), 549; https://doi.org/10.3390/su15010549
Submission received: 18 October 2022 / Revised: 17 December 2022 / Accepted: 23 December 2022 / Published: 28 December 2022
(This article belongs to the Section Economic and Business Aspects of Sustainability)

Abstract

:
Does intellectual property (IP) strategy improve the total factor productivity of enterprises (TFP)? This paper uses 21,930 enterprise-year observations of China’s A-share listed enterprises from 2010–2020, adopts a multi-period difference-in-differences model, and constructs a quasi-natural experiment on the impacts of intellectual property model cities (IPMC) on TFP. The findings are as follows: (1) IPMC significantly improves TFP. (2) It has lag effects and long-term effects. (3) The promotion effect is stronger for state-owned enterprises and enterprises implementing organizational political strategies. (4) The close government-business relationship and clean government-business relationship play positive regulating roles in IPMC on TFP. (5) IPMC promotes TFP by increasing urban fiscal expenditure on science and technology and enterprise technological innovation. This study enriches the theory and evidence of policy effect assessment for IPMC at the enterprise level, and provides policy inspiration for the promotion of IPMC and TFP, to help China achieve high-quality economic development.

1. Introduction

IP has become a strategic resource for national and regional development and a core element to maintain competitiveness. China is at a stage of high-quality development that emphasizes innovation, how to improve TFP through IP strategy is an important path to achieve high-quality economic development. In 2008, the “National Intellectual Property Strategy Outline” was promulgated to create an innovative institutional environment and market environment, encourage enterprises to innovate, and punish IP infringement. China’s IP awareness, management, and application capabilities have been significantly improved. However, due to the late construction of the IP system and its wide-ranging content, the IP system environment has not been fundamentally improved. The patent protection is lagging and its effectiveness is insufficient [1]. In 2011, the “National Intellectual Property Pilot and Model Cities Evaluation Method” was implemented, which upgraded the construction of the IP system to the urban development strategy, and comprehensively promoted the creation, utilization, protection, management and service of urban IP rights. Through the evaluation of IP system construction and management, such as government IP system construction, social IP environment construction, and enterprise IP awareness cultivation, 77 IPMCs were selected in six years in 2012, 2013, 2015, 2016, 2018, and 2019. After IPMC is selected, it will be subject to joint supervision, evaluation and management at the national, provincial and municipal levels. Dynamic adjustment every three years, failing the assessment will be canceled. Therefore, this IP policy will continue to promote the implementation of the IP strategy and the construction of a strong IP country by strengthening the construction of IP management systems, improving the urban IP policy system and services, and deepening the cultivation of IP talents and enterprises awareness. It will also further improve the business environment, stimulate innovation and entrepreneurship vitality, and improve TFP. However, there is a lack of research on the relationship between IP strategy and TFP. Therefore, the question is raised: Does IP strategy promote TFP? How does the policy impact brought by IPMC affect the TFP?
Research on the effect of IP strategy on regional economic development, regional innovation and entrepreneurship, and enterprise innovation. First, IP strategy affects regional economic growth, and scholars mainly believe that the relationship between the two is uncertain or non-linear. The promotion effect of IP strategy on economic growth is characterized by heterogeneity and uncertainty of economic development, innovation ability, and imitation ability among countries, and there is a regional R&D investment threshold [2]. Second, IP strategy can promote the vitality of regional innovation and entrepreneurship. IP strategy induces independent innovation activities of enterprises and other organizations and individuals to attract FDI and cross-border technology transfer and reduces information asymmetry in the capital market. Improve the vitality of regional innovation and entrepreneurship by alleviating financial constraints and promoting the digital economy and regional innovation and development [3]. Thirdly, the influence of IP strategy on enterprise innovation. IP incentive policies significantly increase the quantity but inhibit the quality of enterprise innovation. IP strategy promotes enterprise R&D investment and innovation by increasing government investment in innovation, infringement costs, patent information disclosure, and easing financing constraints [4,5]. IP strategy activates enterprise innovation by improving the level of informatization, diversity of capital channels, and market competition [6].
Regarding the evaluation and analysis of the policy effects of IPMC, scholars have mainly researched industrial structure adjustment, innovation and entrepreneurship, and enterprise innovation. Qin and Gao [7] used the difference-in-differences (DID) method and found that IPMC has technological innovation effects and economic environment optimization effects on the upgrading of urban industrial structure, and there is regional heterogeneity. Ji and Gu [8] used DID model to find that IPMC can upgrade the quality of urban innovation by strengthening government guidance, supplying IP systems, and optimizing innovation elements. Zhao and Li [9] used the multi-period DID method and found that IPMC promotes urban entrepreneurial activity by stimulating innovation vitality, attracting FDI, and reducing institutional transaction costs. Policy implementation time, entrepreneurship type, Internet development, financial development, and macroeconomic environment have a moderating effect on it. Xu and Wei [10] used DID method and found that IPMC has an obvious quantity and quality improvement effect on enterprise patents, showing an inverted U-shaped trend. There are heterogeneities in ownership, competition intensity, and industry attributes.
Existing studies have discussed the policy effects of IP strategy from different perspectives but still have limitations: (1) Existing studies have conducted a wealth of research on the impact of IP strategies on regional development and enterprise innovation. However, as an important part of the national institutional system, IP strategy is also an important factor affecting the TFP in theory. The research on the relationship between IP strategy and TFP is still limited. (2) The existing research mainly examines a single IP policy, but there is insufficient research on the policy effect of a comprehensive IP strategy such as IPMC. (3) Recent studies have used DID method to evaluate the policy effects of IPMC, but mainly focus on the national and city levels. At the enterprise level, the research is only from the perspective of enterprise innovation. The content is relatively lacking. The research on the mechanism of IP strategy on TFP is not deep enough.
This study aims to fill the lack of research on the impact mechanism of IP strategy on TFP. First, it makes a theoretical analysis of the policy effect of IP strategy on TFP, as well as its possible heterogeneity, moderating mechanism, and mediating mechanism, and proposes hypotheses. Second, Take the IPMC as the quasi-natural experiment to construct the empirical model. Based on the data of 21,930 Chinese listed enterprises from 2010 to 2020, this paper adopts the multi-period DID method to explore the mechanism of IP strategy on TFP. Third, Combining theoretical analysis with empirical results, the study proposes policy recommendations for IP strategy to promote TFP.
There are some contributions. (1) It provides micro-empirical evidence for evaluating the effect of IPMC policy and expands the research on the relationship between IP strategy and TFP. (2) This paper discusses the heterogeneous impact of IPMC on TFP in period dynamics, enterprise ownership, and organizational political strategy. (3) It identifies the moderating effect of the government-business relationship on TFP. (4) The mediating effect of urban fiscal expenditure on science and technology and enterprise technological innovation is identified. It provides new ideas for the in-depth understanding of TFP empowered by IP strategy and inspires expanding the policy effect of IPMC.
This paper proceeds as follows. Section 2 presents related literature and hypotheses development. Section 3 constructs the empirical model and describes the samples and variables. Section 4 presents the empirical results. Section 5 provides heterogeneity, moderating effect and mediating effect tests. Section 6 gives conclusions and policy recommendations.

2. Theory and Hypothesis

2.1. IPMC and TFP

According to the institutional theory, the national (regional) institutional can affect enterprise operation behavior by regulating economic activities and reducing transaction costs [11]. The IPMC is an institutional innovation practice at the regional level. Through a series of institutional reforms and cultural innovations, IPMC creates a favorable urban business environment to protect and stimulated enterprise innovation to promote TFP [12]. Firstly, the IPMC regulates the development, application, and transfer of IP rights by optimizing the IP protection system. Publicize IP policies through multiple channels to improve social awareness of IP rights. It has created a favorable institutional and market competition environment for enterprises to improve TFP through innovation [13]. Secondly, IPMC ensures the return of enterprise innovation by strengthening urban IP protection. It makes up enterprise R&D costs by reducing or exempting R&D tax and giving R&D subsidies and incentives [14]. It increases enterprise income from the self-use or sale of patents and promotes the efficient flow of technical factors by establishing and optimizing the IP trading platform. These increase the market value of patents and innovation power of enterprises [15]. Thirdly, IPMC reduces the risk of being infringed by strengthening enterprise IP protection. It is conducive to the disclosure of enterprise R&D information to reduce information asymmetry and the cost of knowledge acquisition [16]. Through business training and publicity, IPMC improves the government operation efficiency of intellectual property review, evaluation and rights protection, and the openness and fairness of intellectual property work, effectively reducing institutional transaction costs. Finally, IPMC expands enterprise financing channels through patent pledges and insurance, and reserves special funds such as patent subsidy and entrepreneurial risks cushion, which can help ease the constraints on innovation financing [17].
The hypothesis is proposed:
Hypothesis H1: 
The construction of IPMC significantly promotes TFP.
IPMC is a practical process of reforming the IP system at the city level. It has a gradual and dynamic adjustment, and the impact on TFP may vary over time [18]. First, IPMC is established in batches. The early reform work is in the exploratory stage. The “Measures for the Evaluation and Management of IPMC” is constantly being updated to expand the scope and depth and solve problems of the IP system. It takes time to accumulate urban fiscal expenditure on science and technology and enterprise technological innovation, and there is a lagging effect on the promotion of TFP. Secondly, IPMC is restricted by the supervision, assessment, and management system within three years after being selected. Local governments need continuously optimize IP systems. With the deepening of the construction of IPMC, the promotion of urban fiscal expenditure on science and technology and the innovation vitality of enterprises will have a continuous promotion effect on TFP.
The hypothesis is proposed:
Hypothesis H2: 
The impact of IPMC on TFP has a lag effect in the short term and a continuous promotion effect in the long term.
Enterprises with different ownership have different positions and roles in economic development and market competition [19], and the impact of IPMC on TFP may have ownership heterogeneity. State-owned enterprises have multiple business goals, and they undertake social policy goals such as ensuring growth and employment, providing quasi-public goods, and promoting social stability. Therefore, some development space is squeezed, resulting in operating efficiency generally lower than that of non-state-owned enterprises [20]. However, the policy implementation of state-owned enterprises is mandatory, demonstrative and resource acquisition priority. It also makes them better benefit from the IPMC policy and promotes TFP. First, state-owned enterprises have a certain compulsion in responding to and implementing the IPMC policy, and are subject to government supervision. It needs to adjust the production and operation of enterprises in a timely and in-depth comparison with the policy themes and guiding opinions, and cooperate with the policy advancement. Secondly, in the assessment and evaluation of IPMC, state-owned enterprises have demonstrative effects. It urges state-owned enterprises to strengthen the research and development, management and application of IP rights, and improves TFP. Finally, state-owned enterprises can obtain competitive advantages by preferentially obtaining scarce resources in IPMC at a lower cost, such as financial subsidies, government orders, tax incentives, financing facilitation, and internal information.
The hypothesis is proposed:
Hypothesis H3: 
Compared with non-state-owned enterprises, IPMC is more conducive to TFP of state-owned enterprises.
In terms of obtaining resources and legitimacy through IPMC policies, whether or not to implement organizational political strategies may have different effects on TFP [21]. The organizational political strategy is that the enterprise embeds the formal institution with the government as the implementation object. Its purpose is to obtain policy support and protection to achieve enterprise goals [22]. Implementing organizational political strategy can strengthen resource occupation and the legitimacy of enterprises in IPMC, reduce the impact of environmental uncertainty, and create a relaxed regulatory environment [23]. And it is constrained by formal institutions, effectively suppressing rent-seeking tendencies and opportunistic motivation to promote TFP [24]. First, enterprises implementing organizational political strategies can establish formal institutional relations with the government. They can obtain stable, continuous, and comprehensive IP policy information, participate more in and influence IPMC policies and government decisions, and strive for favorable policies to promote corporate performance and development [25]. Second, participating in the construction of IPMC through a formal institution is open and enhances the reputation of enterprises implementing organizational political strategies, obtaining support from the government and stakeholders, and legitimacy in the IP system. Finally, bound by formal institutions, enterprises implementing organizational political strategies are linked to the government out of economic interests and compliance needs. This associate is stable and has no lock-in effect, allowing enterprises to maintain flexibility, effectively deal with uncertainties in the IP system, and suppress rent-seeking and opportunistic motivations.
The hypothesis is proposed:
Hypothesis H4: 
Compared with enterprises that do not implement organizational political strategies, IPMC is more conducive to TFP of enterprises implementing organizational political strategies.

2.2. Moderating Mechanism

The construction of a new type of government-business relationship includes two levels: close and clean. The government promotes the efficient operation of the market mechanism through public services and macro-control to create a fair competition environment for enterprises, It reduces rent-seeking corruption caused by excessive dependence due to high intervention. It not only allows the government to do something but also prevents the transfer of benefits, which greatly improves the business environment [26]. The new type of government-business relationship provides enterprises with good property rights protection and contract implementation. It improves the ability of enterprises to capture innovation opportunities in IPMC, stimulates innovation vitality, enhances long-term competitiveness, and provides strong driving force support for TFP.
The close government-business relationship requires the government to improve service awareness and efficiency and play a promising role. It can help enterprises to reduce production and operation costs and risks, improve innovation capabilities [27], and strengthen the role of IPMC in promoting TFP. First, improve government service awareness and the government-business communication mechanism. The close government-business relationship makes officials more active in inspecting and discussing enterprises and developing intermediary agencies such as business services and information consulting. It is helpful to convey the policy orientation of IPMC to enterprises, optimize the allocation of resources according to enterprise needs, and reduce the risk of enterprise decision-making caused by information asymmetry [28]. It is conducive to promoting the implementation of the IPMC policy and TFP. Second, improve the efficiency of government services. The close government-business relationship enables the government to improve service efficiency and quality by improving infrastructure, financial service levels, and e-government efficiency. It reduces institutional transaction costs and innovation “crowding-out effect” to stimulate enterprise innovation, improve TFP.
Clean government-business relationship require improving government integrity and transparency and strictly prohibit the transfer of interests between officials and enterprises. It can help create a business environment for fair competition, protect IP rights, and enhance the impact of IPMC on TFP. First, improve government integrity. The clean government-business relationship makes a clear boundary between the government and the enterprise. The government does not interfere in the operation of the enterprise. It effectively eliminates the innovation “crowding-out effect” and “substitution effect” of rent-seeking corruption [29]. It is conducive to creating a fair competitive business environment for IPMC, optimizing the allocation of scientific and technological resources, stimulating innovation power. Second, improve government transparency. The clean government-business relationship enables the interaction between the government and enterprises to be supervised. The government publishes fiscal data, policy interpretation and other government affairs information in a timely and comprehensive manner, effectively avoiding policy changes caused by officials’ personal preferences [30,31]. The transparency, stability and continuity of the IPMC policies have been strengthened, and the government’s protection of IP rights has been strengthened, which is conducive to IPMC on TFP.
Hypotheses are put forward:
Hypothesis H5a: 
The close government-business relationship strengthens the promotion of IPMC to TFP.
Hypothesis H5b: 
The clean government-business relationship strengthens the promotion of IPMC to TFP.

2.3. Mediating Mechanism

The construction and assessment of IPMC can effectively increase the amount and efficiency of urban fiscal expenditure on science and technology. First, in the construction of IPMC, it is necessary to increase R&D subsidies such as patent application funding and authorization awards to stimulate IP creation [32]. And it is necessary to establish IP transformation centers, trading centers, and knowledge-sharing platforms to improve the use and management of IP rights. These can improve the urban IP service and innovation environment and will inevitably increase the urban fiscal expenditure on science and technology [33]. Second, IPMC is supervised and assessed at the national, provincial, and municipal levels and faces continuous assessment and dynamic adjustment pressure. The city government focuses on protecting IP rights and supporting scientific research innovation to ensure the policy effect of IPMC. It will effectively increase fiscal expenditure on science and technology and improve the efficiency of financial resources [34].
The unique efficiency and targeting of urban fiscal expenditure on science and technology can more directly affect operating costs and technological innovation and promote TFP. First, through measures such as fiscal interest discounts and tax deductions and exemptions, urban fiscal expenditure on science and technology can effectively share the cost of R&D and smooth the risks of R&D and innovation activities [35,36]. It drives enterprises to improve the quality of their main business [37], increase technological innovation, and promote TFP. Second, the support of urban fiscal expenditure on science and technology for specific enterprises has the role of market “certification”. It can help enterprises gain a higher market position, optimize the allocation of factors, and improve production efficiency.
The hypothesis is proposed:
Hypothesis H6: 
IPMC promotes TFP by increasing urban fiscal expenditure on science and technology.
IPMC creates a favorable urban business environment to protect and stimulate the technological innovation of enterprises. First, IPMC improves the efficiency, openness, and fairness of government services in IP work, establishes systems such as patent pledge financing and patent insurance, and provides a bottom line for patent risks, effectively reducing innovation risks. At the same time, IPMC optimizes IP protection and regulates the development, application, and transfer of IP rights of enterprises [38]. It reduces the infringement of technology imitators and produces a technological innovation protection effect. Second, IPMC improves government informatization, fiscal transparency, and financial services. And it provides R&D subsidies, tax reductions, and exemptions for enterprises [39]. These effectively reduce knowledge acquisition costs, institutional transaction costs, and financing constraints, reducing and making up for enterprise R&D costs [40]. At the same time, IPMC increases fiscal expenditure on science and technology to establish IP trading centers, transformation centers, and IP information-sharing platforms. These improve the efficiency of technical factors allocation, increase the technological innovation income, and generate technological innovation incentives.
Enterprise technological innovation promotes changes in power, efficiency, and quality of enterprises, and promotes TFP. First, enterprise technological innovation is the driving force for TFP [41]. Enterprise technological innovation provides new equipment, advanced production technology, and process for production and operation, promoting the improvement of production methods and the business philosophy of enterprises. It brings about a significant increase in production efficiency in a green and low-energy manner [42], generates huge economic benefits, and promotes TFP. Second, enterprise technological innovation is the efficiency driver of TFP [43]. As an important way to affect TFP, enterprise technological innovation effectively promotes the circulation of technical factors in the production sector and the efficiency of resource allocation and factor utilization [44]. It accelerates the transformation of enterprises to high value-added, environmental protection, innovation, and efficient growth methods that continue to drive TFP. Finally, enterprise technological innovation is the quality guarantee for TFP. Enterprise technological innovation can effectively improve the quality competitiveness of enterprises. It increases enterprise quality investment, such as purchasing quality inspection and special equipment, introducing quality management methods, quality function development, and scientific and technological personnel funds. It improves the quality of the main business, products, enterprise value, and market competitiveness [45], and promotes TFP.
The hypothesis is proposed:
Hypothesis H7: 
IPMC promotes TFP by stimulating enterprise technological innovation.
The theoretical model is shown in Figure 1.

3. Study Design

3.1. Model

This study takes IPMC as a quasi-natural experiment. Since 2012, the State Intellectual Property Office of China has selected 77 IPMCs in six batches. Therefore, the multi-period DID method is used to demonstrate the impact of IP strategy on TFP. By comparing the differences in TFP in IPMC (treated group) and those in non-IPMC (untreated group) before and after the IPMC were selected, the net policy effect of the IP strategy was identified. The model is as follows:
TFP i , t = β 0 + β 1 TRAET _ POST i , t + ρ X i , t + γ t + μ i + ε i , t
TFP i , t is the TFP of enterprise i in year t; TRAET _ POST i , t is the IPMC, if the city to which enterprise belongs and the year is undergoing a model, take 1, otherwise take 0; X i , t is the control variable; γ t is the time fixed effect, μ i is the individual fixed effect; ε i , t is the disturbance term. β 1 is the net policy effect of IPMC, indicating the impact of the IP strategy on TFP, and β 1 is expected to be significantly positive.

3.2. Samples and Data

The research sample is China’s Shanghai and Shenzhen A-share listed companies from 2010 to 2020. In 2012, IPMC started to be implemented. Therefore, 2010, two years before 2012, was chosen as the starting year for the sample study. The data of the list and the year of the IPMC are from the website of China Intellectual Property Office. Data on listed enterprises are from the CSMAR database. In the “company research series-financial statements”, screening 2010–2020 Shanghai and Shenzhen a-share listed enterprises. To improve the validity and accuracy, financial enterprises, ST enterprises and enterprises with missing data were excluded. The continuous variables were processed with winsorize by 1% bilaterally. 21,930 enterprise-year sample observations were obtained.

3.3. Variables

Use LP method to measure TFP. OLS method, OP method [46], and LP method [47] are common methods to measure TFP. OLS method may have endogeneity problems. OP method uses investment as a proxy variable, resulting in a large loss of samples. LP method is based on the OP method, and the intermediate product input is used as a proxy variable to reduce sample losses, and the estimation results are more accurate. Therefore, LP method is used to measure TFP. OLS method and OP method are used for robustness test.
Referring to the related research on TFP, the control variables are enterprise profitability, Tobin’s Q, leverage ratio, age, asset size, ownership attributes, and fixed assets ratio [48]. Variable definitions are in Table 1, and descriptive statistics are in Table 2.

4. Empirical Analysis

4.1. Propensity Score Matching (PSM) Results

Use the 1:1 nearest neighbor matching method of PSM to exclude the influence of other characteristics between the enterprises in the treated group and the untreated group on the research results. Use control variables as matching variables to select and match the control group. The untreated group sample closest to the characteristics of each treated group sample was obtained. The PSM balance test is shown in Table 3.
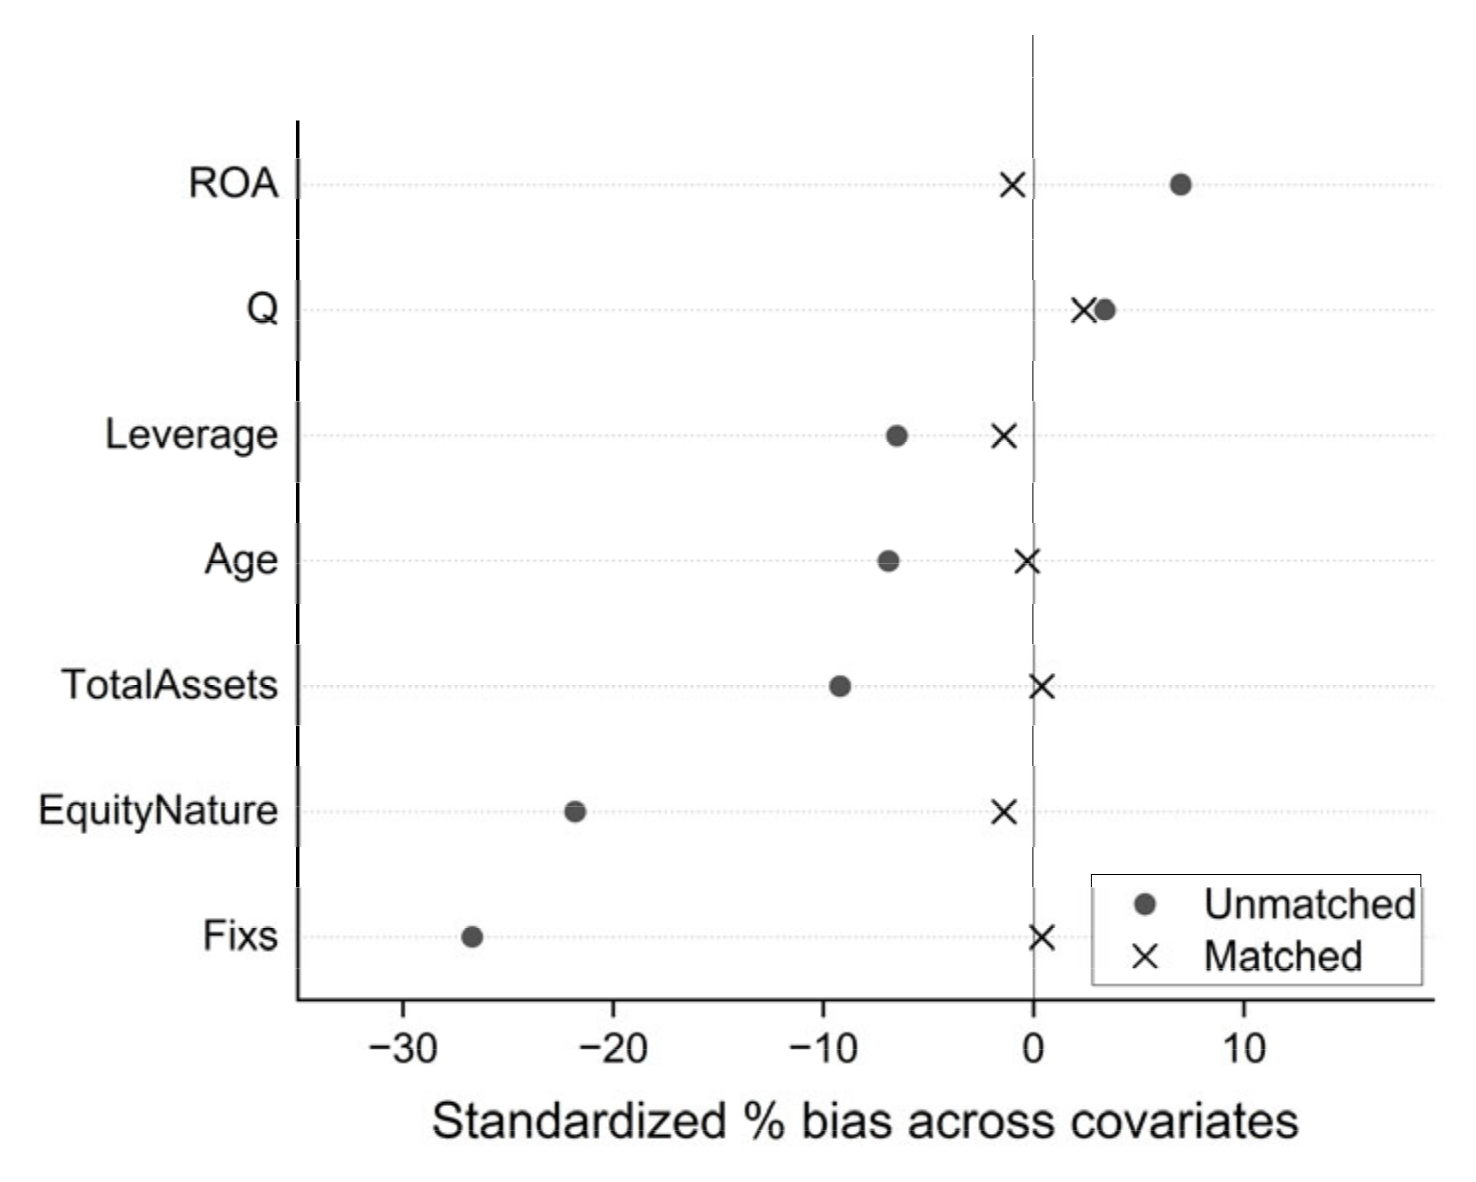
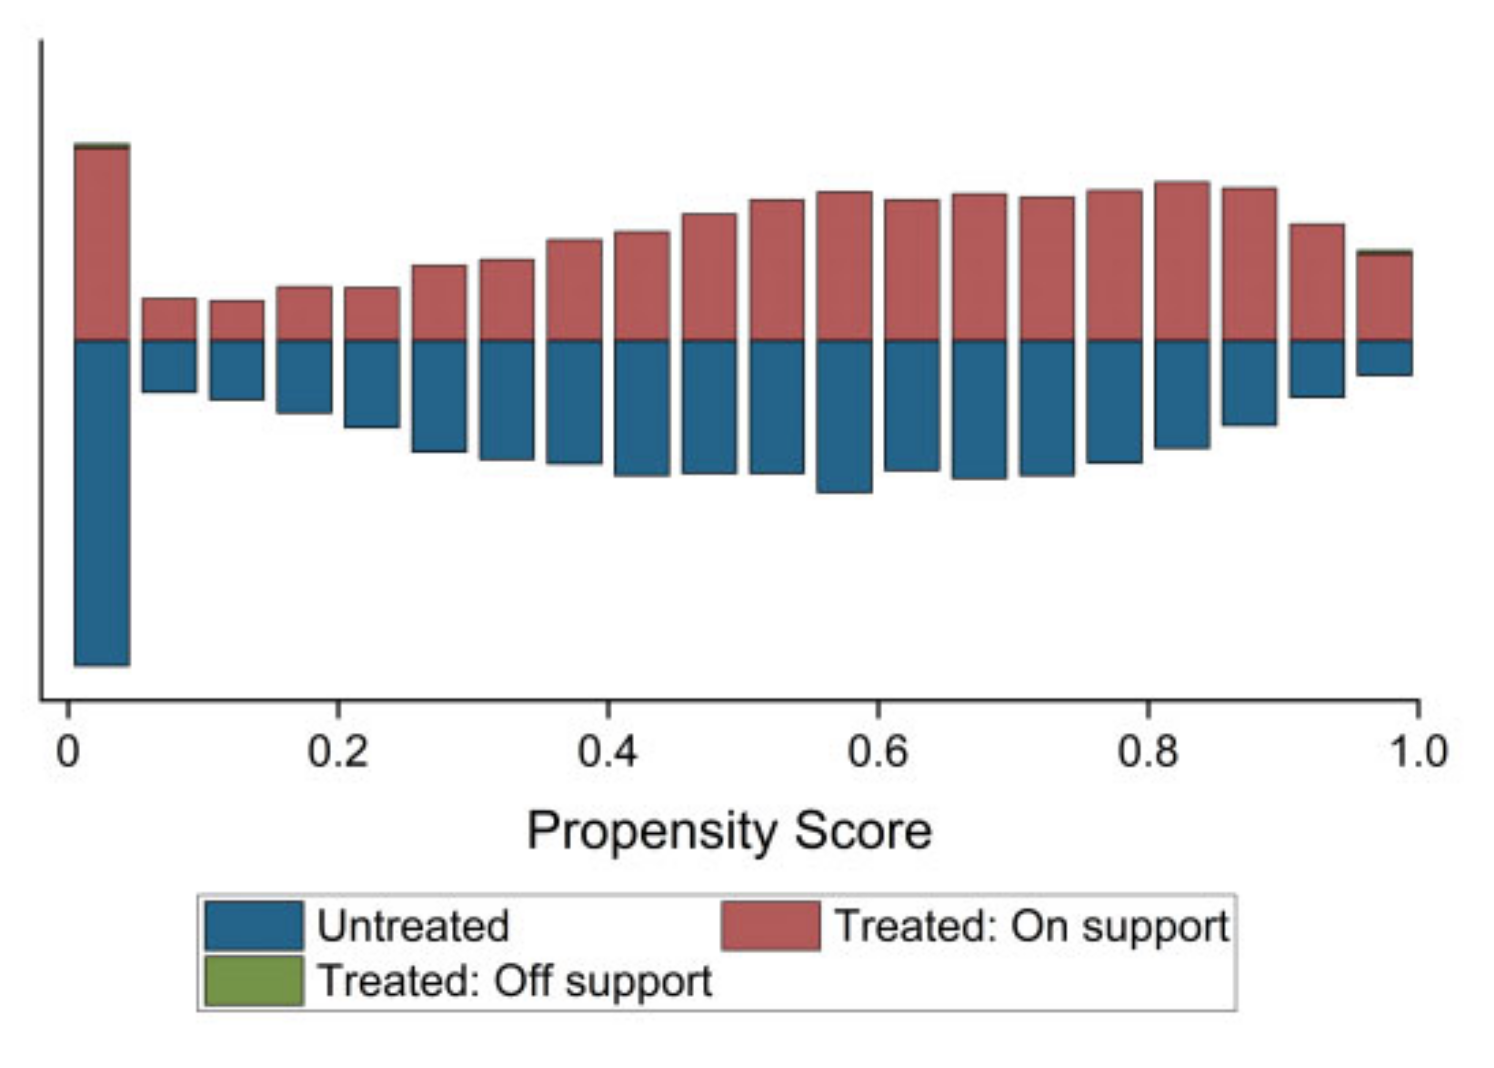
From Table 3 that before PSM, the mean values of each variable in the treated group and the untreated group were significantly different at the level of 1% or 5%. After PSM, the difference was greatly reduced, and the standardized deviation was less than 2.4%. The T-test was not significant. Standardized deviations before and after PSM are shown in Figure 2. The common value range of PSM is shown in Figure 3.
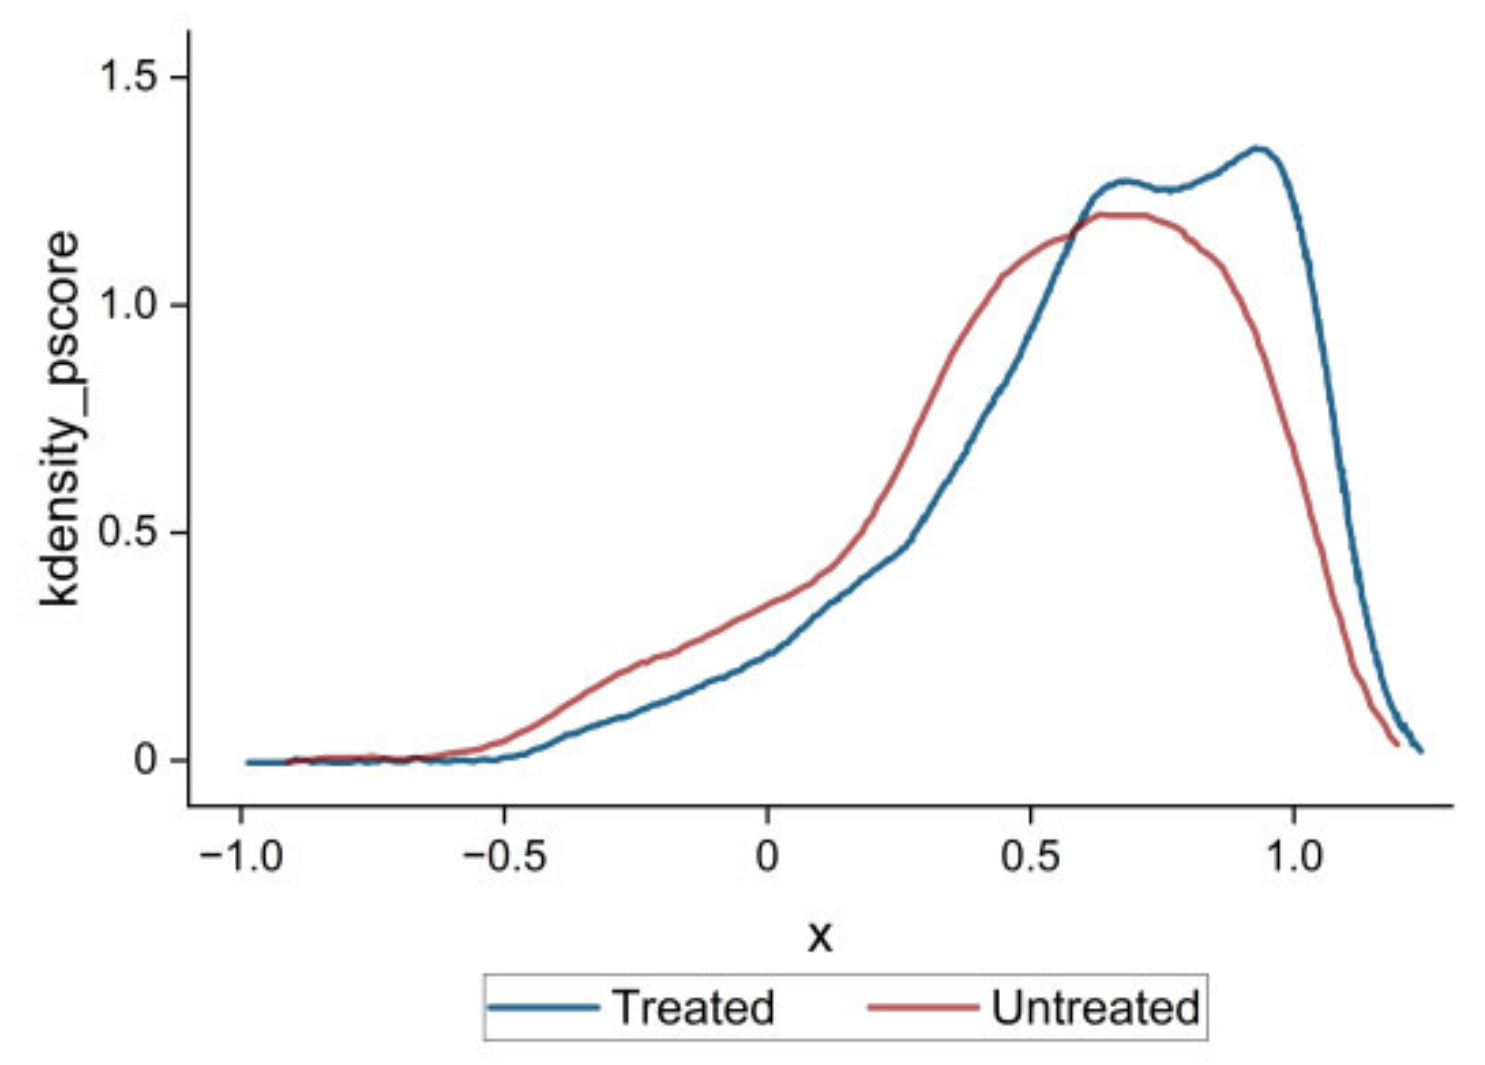
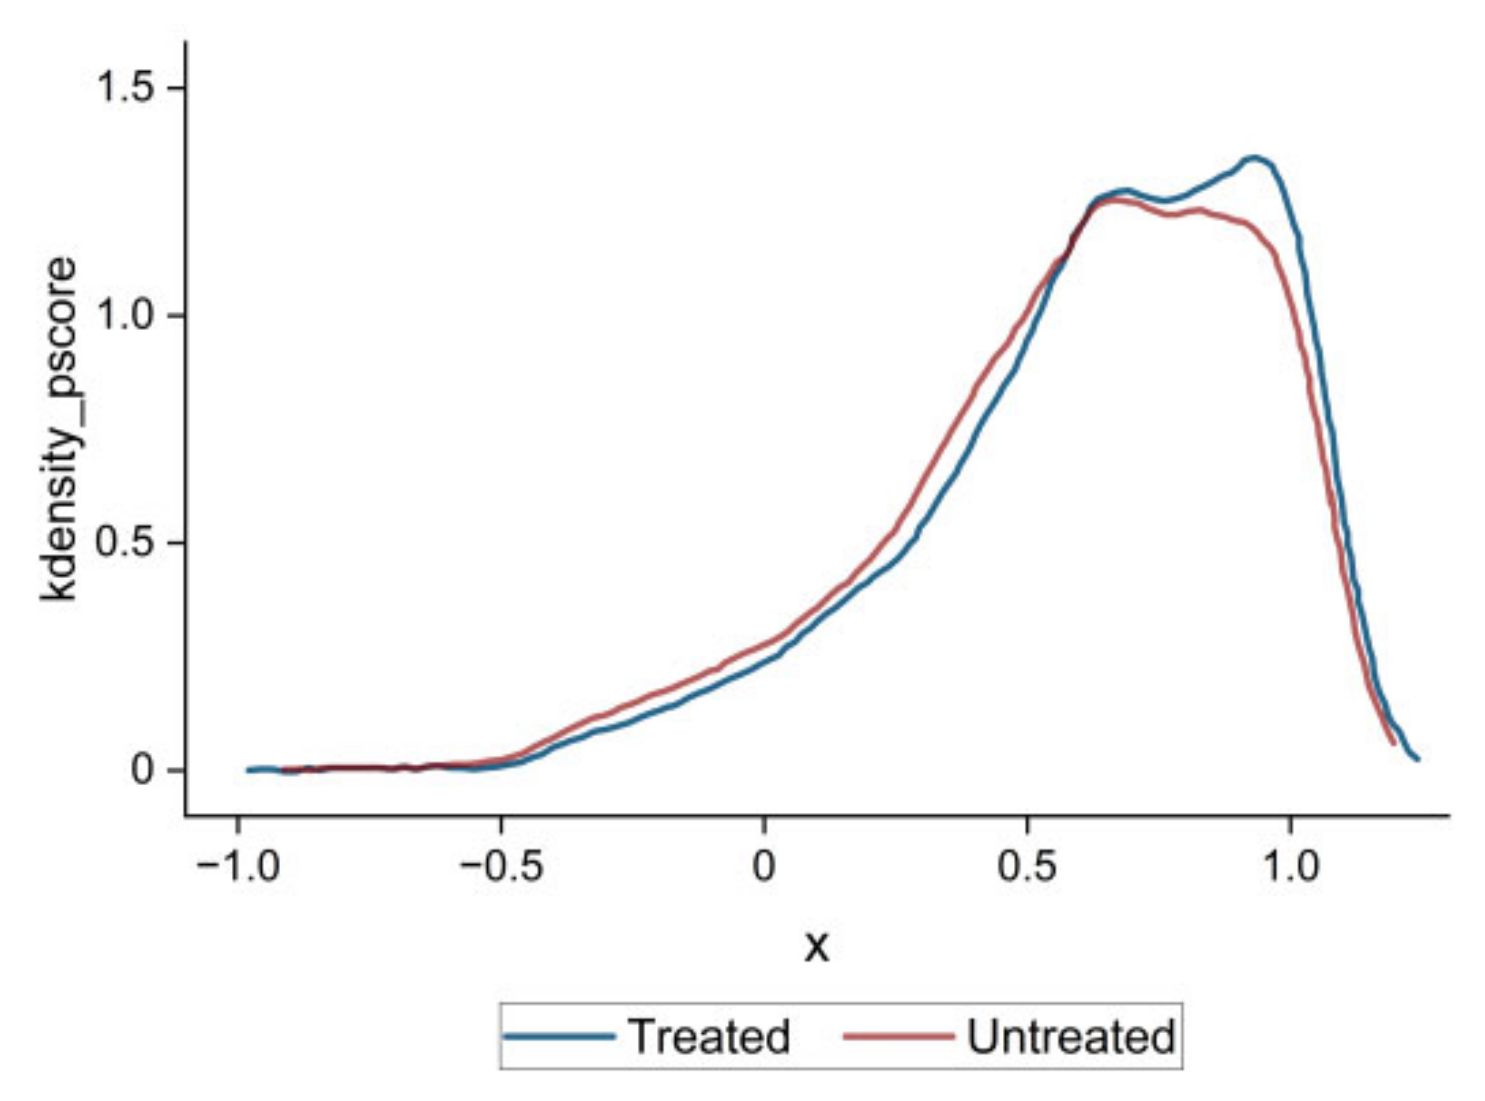
Figure 4 and Figure 5 are the kernel density maps of the treated group and the untreated group before and after PSM. Comparing Figure 4 and Figure 5, the difference in propensity scores between the two groups of samples before and after PSM can be seen more intuitively. Compared with before PSM, the propensity scores after PSM are closer, improving the comparability of the two groups of samples.

4.2. Benchmark Regression Results

Table 4 reports the benchmark regression results of IPMC on TFP. Columns (1) and (2) are the regression results of the full sample without adding and adding control variables. The TREAT_POST regression coefficients are 0.0412 (p < 0.01) and 0.0346 (p < 0.01). Columns (3) and (4) are the regression results of PSM without control variables and with control variables after control sample selection deviation. The TREAT_POST regression coefficients are 0.0423 (p < 0.01) and 0.0357 (p < 0.01). The results show that IPMC has a positive impact on TFP. Compared with non-IPMC, the TFP in IPMC is 3.57 percentage points higher. H1 passed the test.

4.3. Robustness Test

4.3.1. Parallel Trend Test

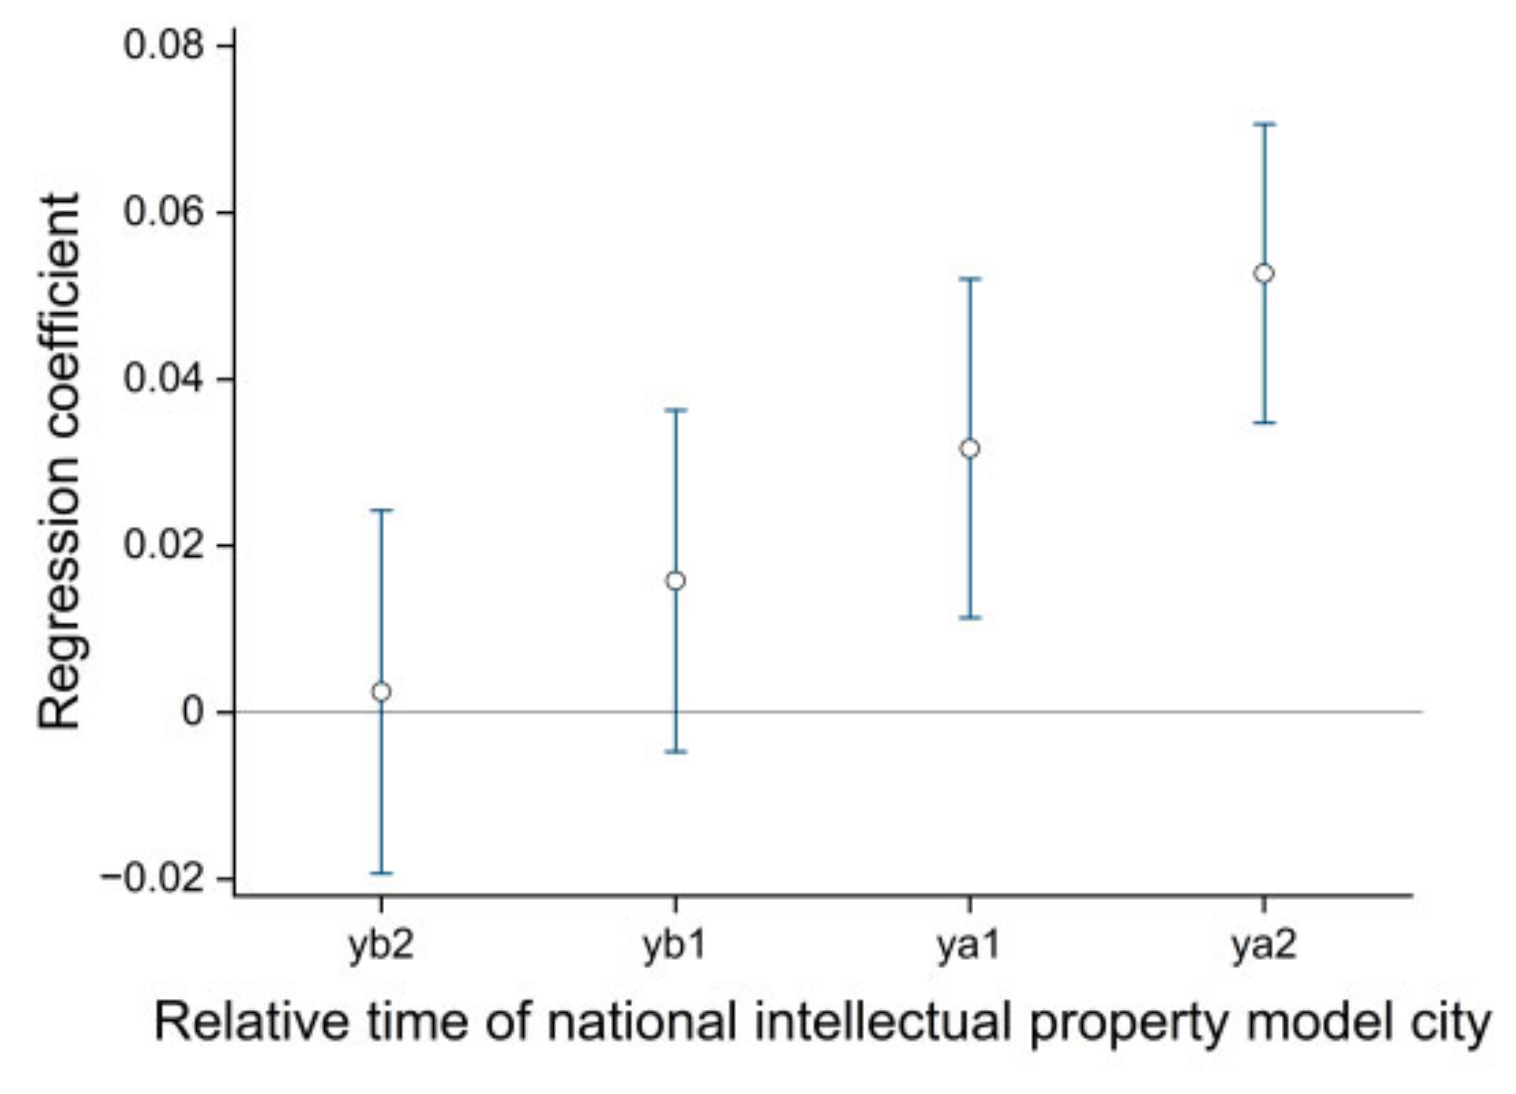
The DID method requires that the treated and the untreated group meet the parallel trend assumption. The TFP in IPMC should be parallel to the trend of non-IPMC before the pilot. In this study, the dummy variables of the period are constructed with reference to the selection time of the IPMC, including the two years before and two years after the selection. The interaction terms (yb2, yb1, ya1, ya2) of dummy variables of the period and the dummy variables of IPMC are included in the benchmark model. Take the year when the IPMC has been selected as the benchmark year to analyze the dynamic effects. The results show that the coefficient is not significant before the IPMC is selected. It is significantly positive one year after the selection. The parallel trends assumption is satisfied.
In addition, it can also be observed whether the dynamic effect coefficient is significantly different from 0 to test the parallel trend, as shown in Figure 6. Before the IPMC is selected, the 95% confidence interval of the dynamic effect coefficient includes 0. It indicates no significant difference in TFP in the IPMC and the non-IPMC, and the parallel trend test is passed. After the IPMC is selected, its confidence interval does not include 0. It indicates IPMC has indeed promoted TFP and has shown an upward trend.

4.3.2. Placebo Test

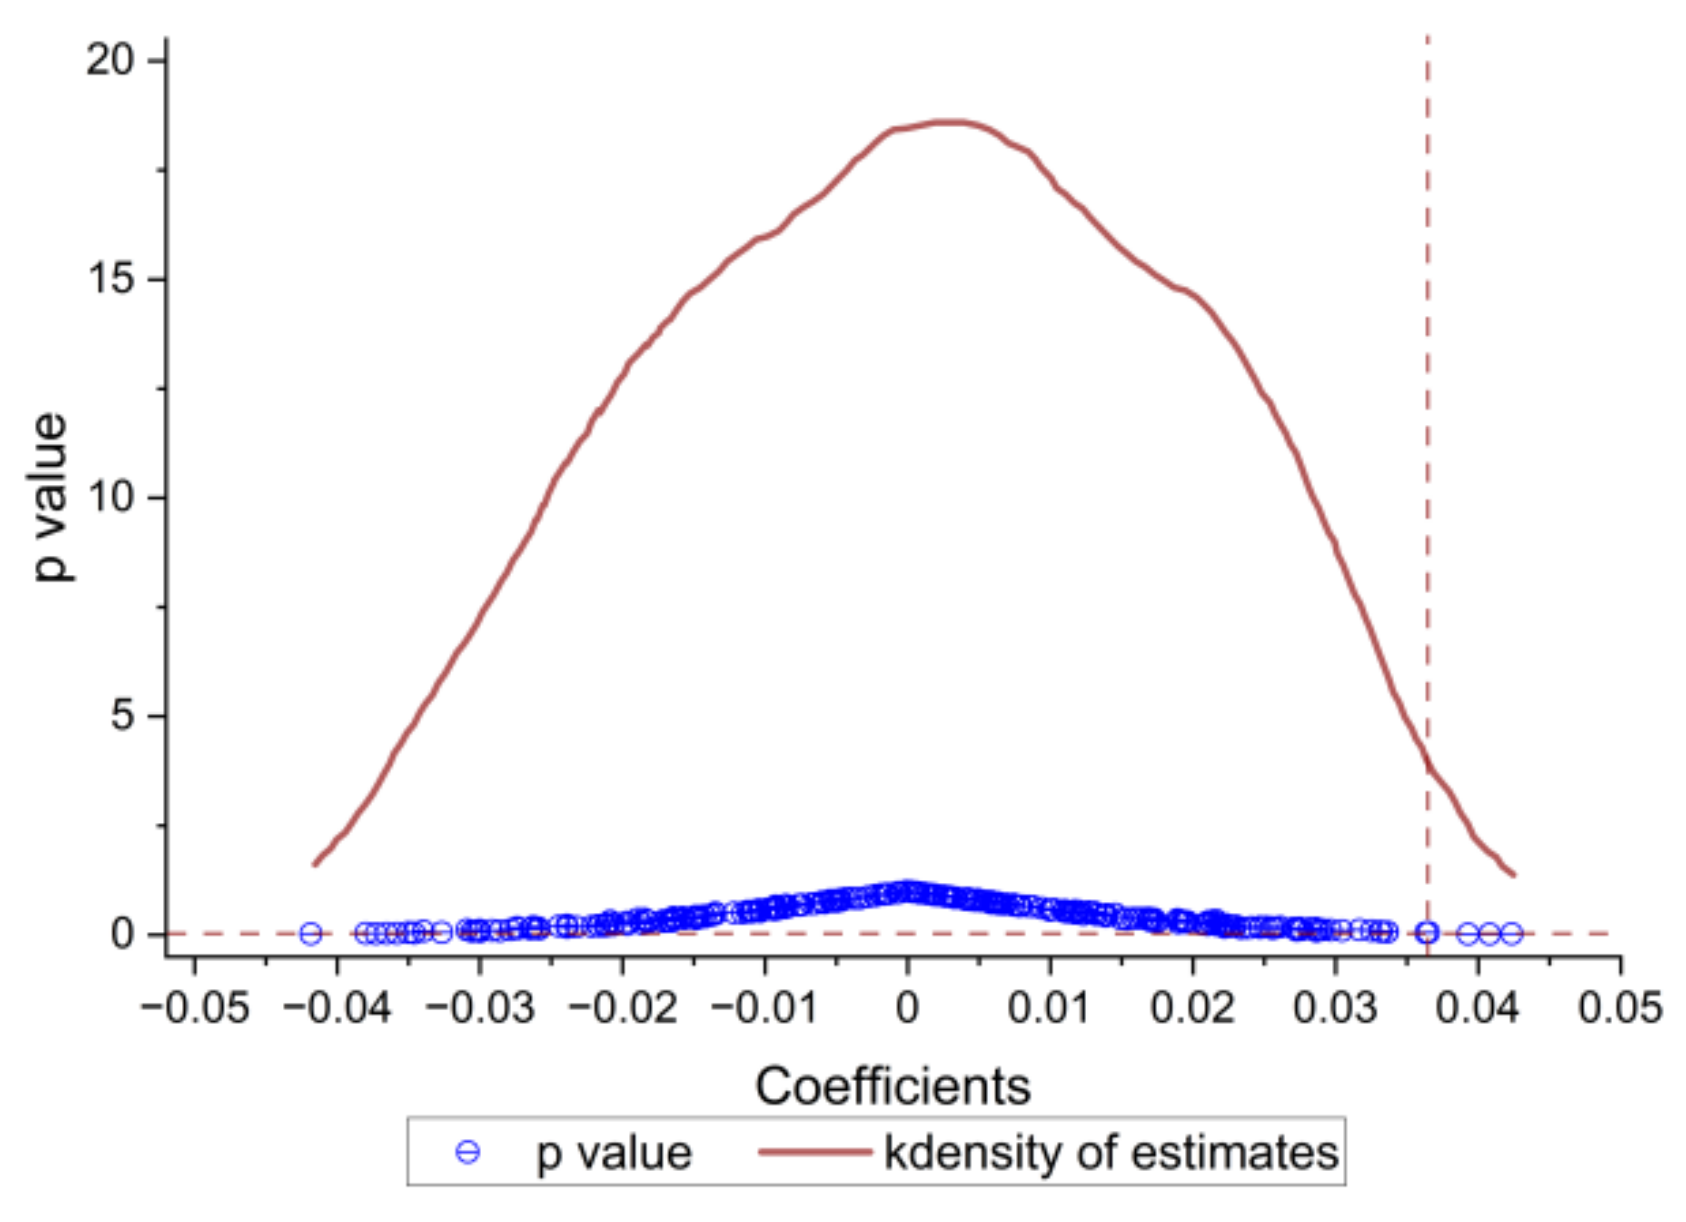
The placebo test can exclude other unobservable factors that interfere with the DID and test the robustness. A list of 77 IPMCs was randomly generated to form a counterfactual placebo, and DID after PSM. Repeat 500 times to improve the reliability of the placebo test. The results are shown in Figure 7. The regression coefficients of IPMC for TFP are concentrated around 0. The standard deviation of the 500th regression coefficient is 0.0184, and the DID benchmark regression coefficient (0.0357) is outside 95% of the estimated results of the 500th coefficient. It can be ruled out that the DID benchmark regression coefficient (0.0357) is due to unobservable factors.

4.3.3. Other Robustness Tests

Substitute the measurement of the dependent variable. The OP method and the OLS method are used to measure the TFP. Columns (1) and (2) in Table 5 show that the results obtained by different methods are still robust.
Exclude municipalities. The municipalities directly under the Central Government have certain particularities, with obvious advantages in economic and political resources. The implementation and effect of IP strategies are different from those of other cities, and the degree of impact on TFP is different. Excluding the municipalities (Beijing, Shanghai, Chongqing, Tianjin) sample, column (3) in Table 5 shows that the results are robust.
Time trend test. The interaction terms between province (industry) and time dummy variable (Province × Year, Industry × Year) are introduced to control the influence of the province (industry) characteristic factors over time on the results. Columns (4) and (5) in Table 5 show that the results are robust.
In addition, the independent variables and control variables are treated with one lag, and the results are robust in column (6) of Table 5.

5. Heterogeneity, Moderating Effect and Mediating Effect Tests

5.1. Period Heterogeneity

The construction of IPMC is gradual and dynamic and may have a long-term impact on TFP. The year when IPMC was start implemented as the base period, construct the time dummy variable TREAT_POSTk of IPMC. By comparing the significance of the coefficients of dummy variables in different periods, the period changes of the influence effect are tested, and the results are shown in column (1) in Table 6. In the year when the IPMC policy was start implemented (year 0), the impact of IPMC on TFP was not significant, indicating a lagging effect. From the first year to the eighth year after, the impact of IPMC on TFP was significant, and it increased rapidly in the third year, and then remained stable, indicating a long-term promotion effect. H2 passed the test.

5.2. Enterprise Ownership Heterogeneity

The speed of response, the degree of implementation, and the effectiveness of the IPMC will be different for enterprises with different ownership, and the impact on TFP will be different. Divide the PSM sample into state-owned enterprises and non-state-owned enterprises to verify the ownership heterogeneity. The results are shown in column (2) and column (3) of Table 6. The TREAT_POST coefficient in column (2) is significantly positive, indicating that IPMC is conducive to the TFP of state-owned enterprises. The coefficient in column (3) is positive but not significant, indicating that IPMC has little effect on the TFP of non-state-owned enterprises. H3 passed the test.

5.3. Organizational Political Strategy Heterogeneity

Using the political identity of enterprise executives to measure organizational political strategy [24]. Executives with political identities can exert influence in the formulation and implementation of policies and strive for the interests of enterprises. The enterprise has implemented the organizational political strategy if the senior executive is a current NPC deputy or CPPCC member. Otherwise, the enterprise does not implement it. The results are shown in columns (4) and (5) of Table 6. The coefficients of TREAT_POST are all significantly positive, and 0.0382 > 0.0242. It indicates that IPMC has a greater role in promoting the TFP that implements organizational political strategy than those that do not implement it. H4 passed the test.

5.4. Moderating Effect Test

Using the closeness index (Close) and cleanness index (Clean) of 292 cities in the “China City Government-business Relationship Ranking 2020”, A dummy variable was constructed with the median, and model (2) was constructed to verify the moderating effect of the government-business relationship. The results are shown in Table 7. The coefficients of TREAT_POST *Close, and TREAT_POST *Clean in columns (1) and (2) are all significantly positive. It shows that the close government-business relationship and the clean government-business relationship have played a positive moderating role in the promotion effect of IPMC on TFP. H5a and H5b passed the test.
TFP i , t = β 0 + β 1 TRAET _ POST i , t + β 2 MOD   Close j ,   Clean j + β 3 TRAET _ POST i , t × MOD   Close j ,   Clean j + ρ X i , t + γ t + μ i + ε i , t .  

5.5. Mediating Effect Test

The three-step method [49] is used to test the intermediary mechanism of “IPMC-urban fiscal expenditure on science and technology, enterprise technological innovation-TFP”. Model (3) and model (4) are constructed based on model (1).
MED i , t FiscalExp i , t   , Innovation i , t = α 0 + α 1 TRAET _ POST i , t + ρ X i , t + γ t + μ i + ε i , t
TFP i , t = γ 0 + γ 1 MED i , t FiscalExp i , t   , Innovation i , t + γ 2 TRAET _ POST i , t + ρ X i , t + γ t + μ i + ε i , t
FiscalExp i , t represents the urban fiscal expenditure on science and technology. Innovation i , t is the enterprise technological innovation. The control variables are the same as model (1).
The ratio of urban fiscal expenditure on science and technology to GDP is used to measure urban fiscal expenditure on science and technology (FiscalExp). Model (1), model (3), and model (4) are regressed in turn. Columns (1), (2), and (3) in Table 8 are the regression results. The coefficient of TREAT_POST in column (1) is significantly positive, indicating that IPMC improves TFP. The coefficient of TREAT_POST in column (2) is significantly positive, indicating that IPMC increases urban fiscal expenditure on science and technology. The FiscalExp coefficient in column (3) is significantly positive, indicating that the urban fiscal expenditure on science and technology improves TFP. Therefore, it proves that IPMC promotes TFP by increasing the urban fiscal expenditure on science and technology. H6 passed the test.
The ratio of enterprise R&D investment to total assets is used to measure enterprise technological innovation (Innovation). Model (1), model (3), and model (4) are regressed in turn. The results are shown in columns (4), (5), and (6) of Table 8. The coefficients of TREAT_POST and Innovation are all significantly positive, indicating that IPMC promotes TFP by improving enterprise technological innovation. H7 passed the test.

6. Conclusions and Implications

Can IP strategy improve TFP? This paper takes IPMC as a quasi-natural experiment and 21,930 observations of China’s listed enterprises from 2010 to 2020 as the research object. It uses the multi-period DID method to explore the impact of IP strategy on TFP. The research findings have theoretical contributions and policy implications for the enabling effect of IPMC on TFP.

6.1. Theoretical Contributions

There are three theoretical contributions. (1) The theoretical framework of IP strategy enabling TFP has been constructed, which makes up for the lack of theoretical research on the relationship between IP strategy and TFP. (2) The promotion effect of IPMC to TFP has a lagging effect and a long-term effect. The effect on state-owned enterprises is more significant than on non-state-owned enterprises. The effect on enterprises that implement organizational political strategies is significantly stronger than that do not. The findings expand the heterogeneity research of the enabling effect of IP strategy on TFP. (3) The close and clean government-business relationship positively moderate the relationship between IPMC and TFP. IPMC promotes TFP by increasing urban fiscal expenditure on science and technology and enterprise technological innovation. The findings enrich the research on the moderating mechanism and mediating mechanism.

6.2. Implications

The study has several policy implications.
(1)
IPMC has a significant positive effect on TFP. The government should deepen the construction of IPMC, expand the scale of IPMC and the scope of influence of policy effects, stimulate TFP, and help China achieve high-quality IP rights and high-quality economic development.
(2)
The government should continuously optimize the IPMC policies for the period heterogeneity and enterprise heterogeneity of IPMC impact on TFP. First, the government should further establish and improve the selection, dynamic supervision, incentive, and exit mechanism of IPMC. It will form a variety of measures to promote TFP, alleviate the lagging effect, and play long-term effects. Second, the government should stabilize the status of state-owned enterprises in economic development. Give full play to the positive response and demonstration effect of state-owned enterprises to IPMC policies, and promote TFP. Third, the government should encourage enterprises to implement organizational political strategies and let more entrepreneurs participate in policy formulation and implementation. It helps to improve the practicability of the policy and the accuracy of the enterprise’s interpretation of the policy. It will expand the policy benefit effect of IPMC on TFP.
(3)
The government should accelerate the establishment of a new type of government-business relationship and optimize the urban business environment. First, the government should deepen the reform of administrative examination and approval, simplify the examination and approval process, improve the efficiency and quality of government services, and reduce institutional transaction costs. And improve the close government-business relationship, and promote the role of IPMC in TFP. Second, the government must improve the long-term mechanism for preventing corruption and eradicate the negative impact of rent-seeking and rent-setting on enterprises. At the same time, disclose financial information to improve the information transparency of enterprises and reduce government interference. It will promote fair competition in the market and fair allocation of resources, improve the clean government-business relationship, and promote the role of IPMC in TFP.
(4)
The TFP should be promoted by increasing urban fiscal expenditure on science and technology and improving enterprise technological innovation. The government should effectively increase the fiscal expenditure on science and technology to increase investment in R&D subsidies, talent introduction policies, and knowledge-sharing platforms and create a business environment that encourages innovation. It will provide multi-faceted guarantees and incentives for enterprises to carry out innovation activities and promote TFP. Enterprises should fully strive for and use the policy and financial support of IPMC, pay attention to the innovative talents introduction, establishment of R&D teams, and the investment of R&D funds. Adhere to the innovation-driven development strategy, actively carry out technological innovation, and give full play to the role of IPMC in promoting TFP.

6.3. Limitations and Future Research

This paper has some limitations. The IP advantages and resource factor endowments of different industries and regions vary greatly, which may cause heterogeneity in the relationship between IP strategy and TFP. However, this paper does not analyze it. This paper only considers the establishment background of IPMC from the perspective of government-business relationships, and the research content is not rich enough. Here are some future research directions. Further rich heterogeneity research, such as high-tech industry (information technology, biomedicine, digital economy, high-end equipment manufacturing, integrated circuit, new materials, new energy, etc.), urban location, urban scale, etc. Further fully study the implementation scenarios of IP strategy, such as the moderating effects of urban digital finance level, opening level, environmental regulation, etc. Further expand the research on policy effects of IPMC, such as product upgrading, industrial chain optimization, high-quality development of export trade, and aggregation of innovation elements.

Author Contributions

Conceptualization, Y.Z. and M.S.; methodology, Y.Z.; software, Y.Z.; validation, Y.Z.; formal analysis, Y.Z.; investigation, Y.Z.; resources, Y.Z.; data curation, Y.Z.; writing—original draft preparation, Y.Z.; writing—review and editing, Y.Z. and M.S.; visualization, Y.Z.; supervision, M.S.; project administration, M.S.; funding acquisition, M.S. All authors have read and agreed to the published version of the manuscript.

Funding

The research was funded by the MOE (Ministry of Education in China) Project of Humanities and Social Sciences, grant number 17YJA630087.

Institutional Review Board Statement

Not applicable.

Informed Consent Statement

Not applicable.

Data Availability Statement

Not applicable.

Conflicts of Interest

The authors declare no conflict of interest.

References

  1. Wei, S.J.; Xie, Z.; Zhang, X.B. From “made in China” to “innovated in China”: Necessity, prospect, and challenges. J. Econ. Perspect. 2017, 31, 49–70. [Google Scholar] [CrossRef] [Green Version]
  2. Shaikh, I.A.; Randhawa, K. Industrial R&D and national innovation policy: An institutional reappraisal of the US national innovation system. Ind. Corp. Chang. 2022, 31, 1152–1176. [Google Scholar] [CrossRef]
  3. Jiang, N.; Li, P.Y.; Ou, Z.H. Intellectual property protection, digital economy and regional entrepreneurial activity. China Soft Sci. 2021, 36, 171–181. [Google Scholar] [CrossRef]
  4. Fang, L.H.; Lerner, J.; Wu, C.P. Intellectual property rights protection, ownership, and innovation: Evidence from China. Rev. Financ. Stud. 2017, 30, 2446–2477. [Google Scholar] [CrossRef] [Green Version]
  5. Amin, M.R.; Chung, C.Y.; Kang, S. Does information quality matter in corporate innovation? Evidence from the Korean market. Econ. Innov. New Technol. 2021, 1871271. [Google Scholar] [CrossRef]
  6. Van Der Wouden, F. Are Chinese cities getting smarter in terms of knowledge and technology they produce? World Dev. 2022, 150, 105729. [Google Scholar] [CrossRef]
  7. Qin, B.; Gao, A.K. The impact of intellectual property city pilots on industrial structure upgrading: Empirical evidence based on DID. Ind. Econ. Res. 2020, 19, 45–57. [Google Scholar] [CrossRef]
  8. Ji, X.Y.; Gu, N.H. Does the establishment of intellectual property model cities affect innovation quality? J. Financ. Econ. 2021, 47, 49–63. [Google Scholar] [CrossRef]
  9. Zhao, F.S.; Li, L. Research on the entrepreneurial effect of intellectual property regimes: Empirical evidence based on the construction of intellectual property city pilots in China. Ind. Econ. Res. 2021, 20, 44–57. [Google Scholar] [CrossRef]
  10. Xu, Y.; Wei, D.M. Urban intellectual property strategy and enterprise innovation: A quasi-natural experiment from national intellectual property model city. Ind. Econ. Res. 2021, 20, 99–114. [Google Scholar] [CrossRef]
  11. Qiu, W.; Zhang, J.; Wu, H. The role of innovation investment and institutional quality on green total factor productivity: Evidence from 46 countries along the “Belt and Road”. Environ. Sci. Pollut. Res. 2022, 29, 16597–16611. [Google Scholar] [CrossRef] [PubMed]
  12. Hu, X.T.; Yin, X.P. Do stronger intellectual property rights protections raise productivity within the context of trade liberalization? Evidence from China. Econ. Model. 2022, 110, 105791. [Google Scholar] [CrossRef]
  13. Su, Z.F.; Wang, C.F.; Peng, M.W. Intellectual property rights protection and total factor productivity. Int. Bus. Rev. 2022, 31, 101956. [Google Scholar] [CrossRef]
  14. Chen, Z.Y.; Zhang, J.; Zi, Y. A cost-benefit analysis of R&D and patents: Firm-level evidence from China. Eur. Econ. Rev. 2020, 133, 103633. [Google Scholar] [CrossRef]
  15. Dai, X.Y.; Chapman, G. R&D tax incentives and innovation: Examining the role of programme design in China. Technovation 2022, 113, 102419. [Google Scholar] [CrossRef]
  16. Contractor, F.J. Can a firm find the balance between openness and secrecy? Towards a theory of an optimum level of disclosure. J. Int. Bus. Stud. 2019, 50, 261–274. [Google Scholar] [CrossRef]
  17. Kale, S.; Rath, B.N. Does innovation matter for total factor productivity growth in India? Evidence from ARDL bound testing approach. Int. J. Emerg. Mark. 2018, 13, 1311–1329. [Google Scholar] [CrossRef]
  18. Mao, K.; Failler, P. Does Stronger Protection of Intellectual Property Improve Sustainable Development? Evidence from City Data in China. Sustainability 2022, 4, 14369. [Google Scholar] [CrossRef]
  19. Clo, S.; Florio, M.; Rentocchini, F. Firm ownership, quality of government and innovation: Evidence from patenting in the telecommunication industry. Res. Policy 2020, 49, 103960. [Google Scholar] [CrossRef]
  20. Rong, Z.; Wu, X.K.; Boeing, P. The effect of institutional ownership on firm innovation: Evidence from Chinese listed firms. Res. Policy 2017, 46, 1533–1551. [Google Scholar] [CrossRef]
  21. Huang, M.; Liao, Z.H.; Lin, H. Do politically connected CEOs promote Chinese listed industrial firms’ green innovation? The mediating role of external governance environments. J. Clean. Prod. 2020, 278, 123634. [Google Scholar] [CrossRef]
  22. Wei, J.; Zhao, Q.Y.; Liu, Y. The new type of government-business relationship and corporate performance stability: Evidence from Chinese listed companies. J. Ind. Eng. Manag. 2021, 35, 1–13. [Google Scholar] [CrossRef]
  23. Li, J.H.; Huang, J.H. Network embeddness, innovation legitimacy and radical innovation resource acquisition. Sci. Res. Manag. 2017, 38, 10–18. [Google Scholar] [CrossRef]
  24. Zhu, Y.; Sun, M.G. How to improve the government-enterprise relationships to retain enterprise? Econ. Res.-Ekon. Istraživanja 2022, 35, 6345–6363. [Google Scholar] [CrossRef]
  25. Li, S.Y.; Shahzadi, A.; Zheng, M.B.; Chang, C.P. The impacts of executives’ political connections on interactions between firm’s mergers, acquisitions, and performance. Econ. Chang. Restruct. 2021, 55, 653–679. [Google Scholar] [CrossRef]
  26. Zhao, X.Y.; Yi, C.J. Can state-owned capital intervention prohibit real enterprises shifting from real to virtual economy: On the regulating role of the intimate and clean relationship between politics and business relations. Bus. Manag. J. 2021, 43, 61–74. [Google Scholar] [CrossRef]
  27. Liu, S.Y.; Du, J.; Zhang, W.K.; Tian, X.L.; Kou, G. Innovation quantity or quality? The role of political connections. Emerg. Mark. Rev. 2021, 48, 100819. [Google Scholar] [CrossRef]
  28. Díaz-Díaz, N.L.; López-Iturriaga, F.J.; Santana-Martín, D.J. The role of political ties and political uncertainty in corporate innovation. Long Range Plan. 2022, 55, 102111. [Google Scholar] [CrossRef]
  29. Wang, G.H.; Wang, Y.Q.; Rui, X.Q. Effects of political networking capability and strategic capability on exploratory and exploitative innovation: Evidence from traditional manufacturing firms in China. J. Manuf. Technol. Manag. 2022, 33, 618–642. [Google Scholar] [CrossRef]
  30. Chen, C.; Gu, J.J.; Luo, R.X. Corporate innovation and R&D expenditure disclosures. Technol. Forecast. Soc. Chang. 2022, 174, 121230. [Google Scholar] [CrossRef]
  31. Lu, F.F.; Zhu, Z.; Gao, H. Political tie hot potato: The contingent effect of China's anti-corruption policy on cash and innovation. Res. Policy 2022, 51, 104476. [Google Scholar] [CrossRef]
  32. Sweet, C.; Eterovic, D. Do patent rights matter? 40 years of innovation, complexity and productivity. World Dev. 2019, 115, 78–93. [Google Scholar] [CrossRef]
  33. Pedro, C.N.; Oscar, A.; Diana, S.; Elena, S. The link between intellectual property rights, innovation, and growth: A meta-analysis. Econ. Model. 2021, 97, 196–209. [Google Scholar] [CrossRef]
  34. Männasoo, K.; Hein, H.; Ruubel, R. The contributions of human capital, R&D spending and convergence to total factor productivity growth. Reg. Stud. 2018, 52, 1598–1611. [Google Scholar] [CrossRef]
  35. Chen, Z.; Liu, Z.K.; Xu, D.Y. Notching R&D investment with corporate income tax cuts in China. Am. Econ. Rev. 2021, 111, 2065–2100. [Google Scholar] [CrossRef]
  36. Liu, S.Y.; Du, J.; Zhang, W.K.; Tian, X.L. Opening the box of subsidies: Which is more effective for innovation? Eurasian Bus. Rev. 2021, 25, 813–837. [Google Scholar] [CrossRef]
  37. Lin, J.; Wu, H.M.; Wu, H. Could government lead the way? Evaluation of China’s patent subsidy policy on patent quality. China Econ. Rev. 2021, 69, 101663. [Google Scholar] [CrossRef]
  38. Hou, Q.S.; Chen, Z.H.; Teng, M. Today’s baton and tomorrow’s vision: The effect of strengthening patent examination system on corporate innovation strategies. J. Bus. Res. 2022, 144, 614–626. [Google Scholar] [CrossRef]
  39. Tian, B.B.; Yu, B.X.; Chen, S.; Ye, J.J. Tax incentive, R&D and firm innovation: Evidence from China. J. Asian Econ. 2020, 71, 101245. [Google Scholar] [CrossRef]
  40. Chen, T.Y.; Wang, Y.; Zhao, X.S. Business Environment, Enterprises Confidence and high-quality development: Empirical evidence from the 2018 China Enterprise General Survey (CEGS). J. Macro-Qual. Res. 2020, 8, 110–128. [Google Scholar] [CrossRef]
  41. Chen, Z.Y.; Zhang, J. Types of patents and driving forces behind the patent growth in China. Econ. Model. 2018, 80, 294–302. [Google Scholar] [CrossRef]
  42. Dai, X.Y.; Sun, Z. Does firm innovation improve aggregate industry productivity? Evidence from Chinese manufacturing firms. Struct. Chang. Econ. Dyn. 2021, 56, 1–9. [Google Scholar] [CrossRef]
  43. Wong, K.K.G.; Fleisher, B.M.; McGuire, W.H. Technical progress and induced innovation in China: A variable profit function approach. J. Product. Anal. 2022, 57, 177–191. [Google Scholar] [CrossRef]
  44. Fang, J.; He, H.; Li, N. China's rising IQ (Innovation Quotient) and growth: Firm-level evidence. J. Dev. Econ. 2020, 147, 102561. [Google Scholar] [CrossRef]
  45. Dong, B.; Guo, Y.; Hu, X. Intellectual property rights protection and export product quality: Evidence from China. Int. Rev. Econ. Financ. 2022, 77, 143–158. [Google Scholar] [CrossRef]
  46. Olley, G.S.; Pakes, A. The dynamics of productivity in the telecommunications equipment industry. Econometrica 1996, 64, 1263–1297. [Google Scholar] [CrossRef]
  47. Levinsohn, J.; Petrin, A. Estimating production functions using inputs to control for unobservables. Rev. Econ. Stud. 2003, 70, 317–342. [Google Scholar] [CrossRef]
  48. Qian, X.S.; Kang, J.; Tang, Y.L.; Cao, X.P. Industrial policy, efficiency of capital allocation and firm’s total factor productivity: Evidence from a natural experiment in China. China Ind. Econ. 2018, 36, 42–59. [Google Scholar] [CrossRef]
  49. Baron, R.M.; Kenny, D.A. The moderator–mediator variable distinction in social psychological research: Conceptual, strategic, and statistical considerations. J. Personal. Soc. Psychol. 1986, 51, 1173–1182. [Google Scholar] [CrossRef]
Figure 1. Theoretical model.
Sustainability 15 00549 g001
Figure 2. Standardized deviations before and after PSM.
Sustainability 15 00549 g002
Figure 3. PSM common value range.
Sustainability 15 00549 g003
Figure 4. Pre-PSM kernel density.
Sustainability 15 00549 g004
Figure 5. Post-PSM kernel density.
Sustainability 15 00549 g005
Figure 6. Parallel trend test.
Sustainability 15 00549 g006
Figure 7. Placebo test.
Sustainability 15 00549 g007
Table 1. Variable definition.
TypeVariablesDefinition
Dependent variableTFPLP method is used to measure total factor productivity, OP method and OLS method are used for robustness test
Independent variableTREAT_POSTIntellectual property model city. The interaction terms of grouping dummy variables and policy enforcement dummy variables
Control variableROAProfitability. Return on Assets
QTobin’s Q
LeverageLeverage ratio. Total liabilities/Total assets
AgeEnterprise age
TotalAssetsTotal assets
EquityNatureOwnership attributes. For state-owned enterprises, take 1; otherwise, take 0
FixsFixed assets ratio. Fixed assets/Total assets
Table 2. Descriptive statistics (n = 21,930).
VariablesMeanSDMinMax
TFP9.11.0016.87212.1
TREAT_POST0.4710.49901
ROA0.04020.0494−0.2510.191
Q1.9681.0750.8658.264
TotalAssets98.812144.7212502
Age17.15.759162
EquityNature0.3690.48201
Leverage0.4240.1940.05460.885
Fixs0.2150.150.002070.694
Table 3. PSM balance test.
VariablesSampleMean%Bias%Reductt-test
TreatedUntreated|Bias|tp > |t|
ROAUnmatched0.02671−0.043417 5.050.000
Matched0.026010.03594−185.8−0.830.407
QUnmatched0.013−0.021123.4 2.450.014
Matched0.01373−0.010042.430.31.950.051
LeverageUnmatched−0.024610.03998−6.5 −4.650.000
Matched−0.02583−0.01208−1.478.7−1.130.259
AgeUnmatched−0.026240.04263−6.9 −4.950.000
Matched−0.02434−0.0217−0.396.2−0.220.829
TotalAssetsUnmatched−0.035590.05783−9.2 −6.730.000
Matched−0.03712−0.040770.496.10.340.732
EquityNatureUnmatched0.32840.43387−21.8 −15.810.000
Matched0.328690.33525−1.493.8−1.150.251
FixsUnmatched−0.101990.16571−26.7 −19.420.000
Matched−0.10095−0.105010.498.50.350.727
Table 4. Benchmark regression results.
Variables(1)
TFP
(2)
TFP
(3)
TFP
(4)
TFP
TREAT_POST0.0412 ***0.0346 ***0.0423 ***0.0357 ***
(0.011)(0.00952)(0.011)(0.00953)
ROA 0.144 *** 0.144 ***
(0.00316) (0.00316)
Q −0.0377 *** −0.0377 ***
(0.00352) (0.00352)
Leverage 0.247 *** 0.247 ***
(0.00502) (0.00502)
Age 0.325 *** 0.325 ***
(0.00787) (0.00788)
TotalAssets 0.174 *** 0.175 ***
(0.00573) (0.00575)
EquityNature 0.0238 0.0245
(0.0192) (0.0192)
Fixs −0.175 *** −0.175 ***
(0.0052) (0.0052)
Year FEYesYesYesYes
Enterprise FEYesYesYesYes
Constant8.689 ***9.065 ***8.687 ***9.063 ***
(0.0112)(0.0098)(−0.0112)(0.00981)
Observations21,93021,93021,91221,912
Enterprises3268326832683268
R-squared0.2840.4670.2850.468
Standard errors in parentheses. *** p < 0.01.
Table 5. Other robust tests.
Variables(1)
TFP_OP
(2)
TFP_OLS
(3)
TFP
(4)
TFP
(5)
TFP
(6)
TFP
TREAT_POST0.0283 ***0.0370 ***0.0195 *0.0237 **0.0181 *0.0310 ***
(0.0088)(0.0103)(0.0109)(0.011)(0.0094)(0.0107)
ROA0.131 ***0.153 ***0.143 ***0.142 ***0.137 ***0.105 ***
(0.00288)(0.00342)(0.00347)(0.00319)(0.00313)(0.00409)
Q−0.0207 ***−0.0522 ***−0.0335 ***−0.0394 ***−0.0426 ***−0.00769 *
(0.00324)(0.0038)(0.0039)(0.00354)(0.00353)(0.00437)
Leverage0.186 ***0.290 ***0.247 ***0.244 ***0.224 ***0.226 ***
(0.00458)(0.00544)(0.00547)(0.00507)(0.00497)(0.00601)
Age0.268 ***0.409 ***0.326 ***1.179 ***−0.01210.288 ***
(0.0072)(0.00852)(0.00881)(0.248)(0.108)(0.0096)
TotalAssets0.112 ***0.223 ***0.212 ***0.175 ***0.186 ***0.157 ***
(0.00531)(0.00617)(0.00665)(0.0058)(0.00592)(0.00786)
EquityNature−0.01960.02510.01320.025−0.009060.0216
(0.0174)(0.0207)(0.0208)(0.0195)(0.0186)(0.0227)
Fixs−0.149 ***−0.0743 ***−0.167 ***−0.174 ***−0.167 ***−0.109 ***
(0.00479)(0.00562)(0.0056)(0.00523)(0.00517)(0.00616)
Year FEYesYesYesYesYesYes
Enterprise FEYesYesYesYesYesYes
Constant6.652 ***10.97 ***9.057 ***9.874 ***9.025 ***9.179 ***
(0.00886)(0.0106)(0.0106)(0.213)(0.0906)(0.0114)
Observations23,26421,97217,90321,91221,91217,714
Enterprises337732722656326832683033
R-squared0.3830.5030.4790.4850.5480.379
Standard errors in parentheses. *** p < 0.01, ** p < 0.05, * p < 0.1.
Table 6. Heterogeneity test.
Variables(1)
TFP
(2)
TFP
(3)
TFP
(4)
TFP
(5)
TFP
TREAT_POST 0.0421 ***0.009650.0382 **0.0242 *
(0.0147)(0.0123)(0.0181)(0.0128)
TREAT_POST00.0173
(0.0124)
TREAT_POST10.0373 ***
(0.0127)
TREAT_POST20.0225 *
(0.0136)
TREAT_POST30.0636 ***
(0.0143)
TREAT_POST40.0815 ***
(0.0144)
TREAT_POST50.0697 ***
(0.0152)
TREAT_POST60.0651 ***
(0.0161)
TREAT_POST70.0711 ***
(0.0167)
TREAT_POST80.0872 ***
(0.0191)
ControlsYesYesYesYesYes
Year FEYesYesYesYesYes
Enterprise FEYesYesYesYesYes
Constant9.049 ***9.279 ***8.971 ***9.238 ***9.185 ***
(0.0105)(0.00993)(0.00887)(0.0226)(0.0159)
Observations21,912808113,831422711,589
Enterprises32681091236810362134
R-squared0.4690.4030.5220.4670.441
Standard errors in parentheses. *** p < 0.01, ** p < 0.05, * p < 0.1.
Table 7. Moderating effect test.
Variables(1)
TFP
(2)
TFP
TREAT_POST0.0251 **0.0365 ***
(0.0124)(0.0120)
GBRelationship1
TREAT_POST*GBRelationship
Close−0.0522 **
(0.0228)
TREAT_POST*Close0.0520 ***
(0.0157)
Clean 0.00901
(0.0229)
TREAT_POST*Clean 0.0299 *
(0.0156)
ControlsYesYes
Year FEYesYes
Enterprise FEYesYes
Constant8.976 ***8.946 ***
(0.0179)(0.0177)
Observations20,66120,661
Enterprises30593059
R-squared0.4510.450
Standard errors in parentheses. *** p < 0.01, ** p < 0.05, * p < 0.1.
Table 8. Mediating effect test.
Variables(1)
TFP
(2)
FiscalExp
(3)
TFP
(4)
TFP
(5)
Innovation
(6)
TFP
TREAT_POST0.0333 ***0.0253 ***0.0327 ***0.0341 ***0.0349 **0.0311 ***
(0.0103)(0.00887)(0.0103)(0.0107)(0.0173)(0.0106)
FiscalExp 0.0209 **
(0.00935)
Innovation 0.0851 ***
(0.00548)
ControlsYesYesYesYesYesYes
Year FEYesYesYesYesYesYes
Enterprise FEYesYesYesYesYesYes
Constant9.065 ***−0.031 ***9.065 ***9.093 ***−0.0596 **9.098 ***
(0.0108)(0.00926)(0.0108)(0.0173)(0.0280)(0.0172)
Observations18,48418,48418,48415,39015,39015,390
Enterprises303930393039280228022802
R-squared0.4760.0910.4760.5250.0660.534
Standard errors in parentheses. *** p < 0.01, ** p < 0.05.
Disclaimer/Publisher’s Note: The statements, opinions and data contained in all publications are solely those of the individual author(s) and contributor(s) and not of MDPI and/or the editor(s). MDPI and/or the editor(s) disclaim responsibility for any injury to people or property resulting from any ideas, methods, instructions or products referred to in the content.