Article

A Crack Width Measurement Method of UAV Images Using High-Resolution Algorithms

1
Architectural Engineering, Hanyang University ERICA, 55, Hanyangdaehak-ro, Sangnok-gu, Ansan 15588, Republic of Korea
2
Center for AI Technology in Construction, Hanyang University ERICA, 55, Hanyangdaehak-ro, Sangnok-gu, Ansan 15588, Republic of Korea
3
ICT Convergence Research Division, Korea Expressway Corporation Research Institute, 24 Dongtansunhwan-daero 17-gil, Dongtan-myeon, Hwaseong 18489, Republic of Korea
4
Division of Smart Convergence Engineering, Hanyang University ERICA, 55, Hanyangdaehak-ro, Sangnok-gu, Ansan 15588, Republic of Korea
*
Author to whom correspondence should be addressed.
Sustainability 2023, 15(1), 478; https://doi.org/10.3390/su15010478
Submission received: 4 November 2022 / Revised: 16 December 2022 / Accepted: 23 December 2022 / Published: 27 December 2022

Abstract

:
The need for maintenance is increasing due to the aging of facilities. In this study, we proposed a crack width measurement method for images collected at safe distances using UAVs (Unmanned Aerial Vehicles). It is a method of measuring the widths of cracks using a high-resolution (VDSR) algorithm, which measures by increasing the resolution of images taken at 3 m intervals on the wall where cracks exist. In addition, the crack width measurement value was compared with a general photographed image and a high-resolution conversion image. As a result, it was confirmed that the crack width measurement of the image to which the high resolution was applied was similar to the actual measured value. These results can help improve the practical applicability of UAVs for facility safety inspections by overcoming the limits of camera resolution and distances between UAVs and facilities introduced in the facility safety inspection. However, more detailed image resolution is required to quantitatively measure the crack width; we intend to improve this through additional studies.

1. Introduction

Recently, the maintenance of aging facilities in Europe and the United States has become an urgent issue, as their disintegration causes financial damage and life loss [1]. Structural maintenance is becoming important in South Korea as well, because the rate of facilities that have been used for 30 years or more (10.3% in 2017) is predicted to increase to 44.4% by 2037. The above example shows that the importance of structural maintenance as a result of the aging of facilities is increasing worldwide [2]. Concrete fractures, which are a criterion for structural maintenance, occur due to various factors, including materials, construction, environment, and structural and external forces. Depending on the composition and impact of these factors, the durability of structures may decline, faults in structures may occur, and reinforcing rods may corrode. Therefore, assessing the state of concrete cracks is critical to the lifespan of the structure [3,4].
Repair and reinforcement strategies depend on the crack width; thus, a quantitative assessment is required to establish an economic and efficient maintenance plan [5]. An existing method of examining cracks involves a visual inspection and assessment of cracks through measurement tools (crack scale). However, locations that are difficult to access are inspected on the basis of the examiner’s experience, and subjective assessments may lack reliability. Furthermore, the method is unsafe because there is a risk of fall during the inspection [6].
Therefore, unmanned aerial vehicle (UAV)-based external inspection of structures can be performed to improve the safety of structural inspections. Moreover, several studies have objectively inspected cracks by analyzing images [7,8]. UAV-based inspections can reduce the safety risks of direct human-based examinations, and the inspection efficiency is higher than that of human-based examinations [9,10]. A deep learning object detection algorithm for detecting and analyzing the cracks in images was demonstrated to be more objective than the existing inspection method [11,12]. The study used an artificial intelligence method, which was previously trained with crack images, and had learned the features of cracks within images, in order to analyze collected crack images. The application of deep learning and quantitative training data reportedly increased the reliability of the inspection. However, this method of crack detection relies on the image quality, which depends on the shooting conditions (e.g., luminous intensity and environment). Therefore, further research on improving the crack detection by increasing the image quality has been conducted [13]. A high-resolution algorithm that uses images with clear object definitions as training data to increase the resolution of the images was applied. Consequently, the rate of recognition increased, which increased the quantification reliability of the crack area. A study on the quantification of the crack width was conducted to analyze the crack size [14]. As a method of quantifying the crack within the image, the image resolution of the captured area is measured through the geometrical relationship between the shooting distance and camera performance [15,16]. This method segments the image into pixels to count the pixels of the crack width area, which is an effective, noncontact quantification of the crack size. Analyzing the pixels was considered to stabilize the reliability of the crack assessment through objective numerical analysis. However, pixel count accuracy decreases with an increase in the image area; deviations from the actual crack width may occur. Therefore, the error value for pixels including the crack and wall was analyzed using a formula that uses the color values of the image. The results showed a reduced range of error for the crack width measurement while quantifying the crack [17]. Thus, the crack width can be effectively measured. Nonetheless, the pixel number that includes the crack width within the image must be five or above for a low error rate. For this to occur, shooting at a close range is required.
Additionally, noncontact crack monitoring has been advanced by generating a 3D model through image measurement [18]. Based on a 3D model that copied the actual object shape based on overlapped image patterns, an inspector could easily identify the locations and sizes of cracks. In addition, the area of a crack could be easily measured through image detection and damage assessment from the collected images. However, studies that quantitatively assess cracks encounter difficulties when assessing small cracks. Images taken by fixed cameras close to the cracks are of high definition, but UAVs maintaining a flight distance for efficient filming cannot generate the resolution attained by fixed cameras. Low-quality images are assessed to have a greater crack size than the actual object, hence using them for the quantitative assessment of cracks is difficult.
Other fields of research applied high-resolution algorithms to improve the degraded image quality [19,20]. The high-quality algorithm has been applied in the fields of medicine and recognition, and has been used to enhance the image resolution in cases where a clear object extraction is not possible due to camera performance and environmental conditions [21,22]. In the field of structural inspection, image improvement studies have also advanced through applying the high-resolution algorithm [23]. These studies have successfully increased the detection performance for crack objects. Additionally, a comparison of the number of image crack pixels and the number of pixels obtained after application of the high-resolution algorithm showed a higher recognition rate after using the algorithm than with the original image. However, no research has been performed on the measurement of an actual crack width based on pixel count in the crack images. This study uses the pixel size of high-resolution images to measure the crack width, and compares it with the actual crack width for evaluation. Furthermore, the use of the very deep super-resolution (VDSR) algorithm for measuring the width of the crack images collected by UAVs at a safe flight distance is presented. The crack area pixels in high-resolution images after transformation are compared with the actual crack width. Finally, the results and improvement prospects are discussed.

2. Methods

To express the information of the image area, the captured area was segmented into pixels based on the camera performance. The information of the segmented area was represented as quantified RGB values. The quality of the pixel value increases as the actual area included in one pixel value decreases. The boundary between the object and background becomes blurry in low-quality images. Therefore, images that could include as many pixels as possible within the 0.1–0.4 mm crack sizes that occur in structures must be collected for accurate detection. However, images collected by UAVs, which must maintain a safe distance, cannot include the crack width within a pixel. Currently, the number of pixels that can be included in the crack width is low, owing to the performance of the cameras attached to UAVs. Therefore, the object detection analysis has limitations. In this study, the image shot from a safe flight distance was defined as having low resolution (LR). By contrast, an image was defined as high resolution (HR) when it included three or more pixels for the crack width. Finally, an image resolution (SR) in which an LR image is generated with high resolution was defined. The procedure of transforming an LR image into an SR image to compare the pixel count of the crack width is shown in Figure 1.

2.1. Step 1: Very Deep Super-Resolution (VDSR)

VDSR architecture is an algorithm that learns the relationship between LR and HR images. It can maintain a suitable convergence speed and create a deeper network. Its structure comprises 20 layers, and the image data are segmented into YCbCr channels to use Y channel images as network training data. YCbCr is a color space used in an imaging system, wherein Y represents luminance, and Cb and Cr represent color difference components. Mean squared error loss is used for training to reduce the difference between the Y channel of the HR image, and the image generated by adding the LR image reconstructed as an interpolated LR image to the Y channel of the interpolated LR image after passing the network. Therefore, the VDSR output naturally becomes a residual image [24].
In this study, as mentioned above, an image (HR) containing three or more pixels of crack width was reconstructed into LR images and used as learning data. The Y channel separated LR images into Y, Cb, and Cr channels. Prior to separation, learning was advanced to generate SR images by adding channels of RGB and Y channels of LR images, and to reduce differences compared to Y channels of HR images. To evaluate the performance of the learned algorithm, we compared the HR image with the reconstructed SR image. Therefore, we examined how similar an image containing actual information was reconstructed. As a result, the higher the reconstruction quality of SR images, the better the performance of the algorithm.
To assess the quality of the VDSR-transformed image, peak signal-to-noise ratio (PSNR) and structural similarity index map (SSIM) were used. The transformed image through the trained VDSR algorithm was compared with the previously defined LR image to assess the similarity between the two images [25]. When used to assess the loss of image resolution, PSNR showed higher value at a lower loss. The loss data of an image were obtained via the mean squared error (MSE) value. Here, the error referred to the difference between the value predicted by the algorithm and the actual value. Consequently, the MSE value decreased as the algorithm prediction approached the actual value. Additionally, a lower MSE value could indicate a higher PSNR value. SSIM assessed the quality in terms of the brightness, contrast, and structure of an image. If the transformed image was identical to the original, the SSIM had a value of 1. The formulas for MSE, PSNR, and SSIM are shown below.
M S E   = X , Y [ I 1 ( x , y ) I 2 ( x , y ) ] 2 X × Y  
In Equation (1), I 1   represents the image transformed by the VDSR algorithm, and I 2   represents the original image. X × Y represents the image resolution, and MSE is determined by the pixel difference between the two images.
P S N R   =   10 log 10 ( P 2 M S E )
In Equation (2), MSE is applied as the denominator. An MSE value of 0 indicates no loss, and PSNR cannot be defined. The range of P as the maximum pixel is 0–255.
S S I M ( x , y )   =     ( 2 μ x μ y + C 1 ) ( 2 σ x y + C 2 ) ( μ x 2 + μ y 2 + C 1 ) ( σ x 2 + σ y 2 + C 2 )  
In Equation (3), μ x and μ y represent the average values of image I 1 and image I 2 , respectively. σ x   and σ y represent the variance of images I 1   and I 2 ,   respectively; σ x y   represents the covariance of images I 1 and I 2 .
Equations (1) and (2) analyze the image data quality, and determine the loss value between two images to show their degree of similarity. It does not represent a difference in quality detected by humans; thus, good quality values may not indicate high visual quality [26]. Unlike PSNR, SSIM (Equation (3)) assesses the difference in quality from the perspective of human vision, and its quality assessment accounts for the luminance, contrast, and structure. A higher value indicates a higher-quality result from the human perspective [27]. The two abovementioned assessment methods are generally used for evaluating the training performance of the VDSR algorithm.

2.2. Step 2: Crack Pixel Estimation through Image Binarization

Image binarization was used to differentiate the background and object [28]. When the crack width was measured based on image binarization, the RGB value was transformed into greyscale for effective computation as shown in Figure 2. Different RGB values express different colors. Significant computation is required for acquiring the average value for distinguishing black and white. Therefore, greyscale images that transform the RGB values into identical values were used to facilitate the computation. Later, a threshold value was determined using the average and standard deviation to classify each pixel into black or white. Greyscale includes the identical RGB values, and sets the standard from a range of 0–255. The boundary of the crack was extracted by indicating values greater than the standard set as white and lower than the black standard. Since the images were transformed into high-resolution images based on the RGB values of the original image, the experimental data were transformed based on the threshold including the crack width during binarization of the original image.

2.3. Step 3: Image Resolution Measurement

The actual size of one pixel was determined through the geometrical relationship for images collected from cameras. The focal distance, sensor size, and resolution of the camera varied according to the manufacturer, and the necessary information could be extracted from the image file format. To set a certain shooting distance, masking tape was used. A fixed camera was used for accurate shooting at a 3-meter distance from the object to collect experimental data. The camera had a sensor size of 7.76 × 5.81 mm, focal distance of 5.7 mm, and a resolution of 4032 × 3024.
P Ι Χ   =   S S × L R × F  
In Equation (4), which presents the actual size included in one pixel, FL indicates the focal distance of the camera, and SS indicates the sensor size. L is the shooting distance, and R is the resolution of the image.

3. Experiments

3.1. VDSR Training Dataset

Table 1 shows the summary of the training data used in this study. The training data updated the model parameters based on the determined loss between the input LR image and the corresponding HR image. The HR training dataset DIV2K that contained high-resolution images of various contents s and crack data with crack width of at least 3 pixels were used as training data. The DIV2K dataset included RGB images with various contents, provided HR and LR images for the downgrading operator of 2, 3, and 4 stages from 800 HR images (2040 × 1356 and 1284 × 2040). High-frequency areas were characterized by rapid changes in brightness within an image, and they were primarily found at the boundaries or edges. Data that well represented the high-frequency area were used as training data. The crack dataset in which the crack width accounted for 3 or more pixels, and images with crack widths of 0.5 mm or less, were collected. The images, with resolutions of 5472 × 3648 and 3024 × 4032 that were collected with close-range shooting, were used as training data.

3.2. High-Resolution Application

Table 2 shows the results of VDSR algorithm-based image quality assessment (PSNR and SSIM). HR images identical to the training data were transformed into LR images for quality assessment. Data loss can occur during the transformation from HR to LR images. The crack areas were extracted from close-range HR images (5472 × 3648) at resolutions of 1008 × 1008, 336 × 448, and 1296 × 972 for quality assessment. The corresponding images were defined as HR, and each image was transformed into LR images. The resolutions of the transformed LR images were changed to one half (504 × 504, 168 × 224, and 648 × 486), and one quarter (252 × 252, 84 × 112, and 324 × 243). The LR images were fed into the trained VDSR algorithm to reconstruct them into the size of the SR image. PSNR showed a high similarity, as all images had a value of 30 or above. A SSIM value close to 1 represented high quality, and human vision recognizes the SR x2 (1008 × 1008, 336 × 448, and 1296 × 972) and x4 (1008 × 1008, 336 × 448, and 1296 × 972) reconstruction of the images as having high quality.
Figure 3 presents images used in quality assessment. The images were transformed into LR images by arbitrarily switching HR images shot at close range to one-half and one-quarter resolutions. Additionally, high resolution was applied to transform LR images to SR images. The cracks in SR x2 and SR x4 images that were transformed from one-half and one-quarter resolution images to images shot at close range were clearly formed. Considering the loss during SR image degradation, the SR x2 and SR x4 images were visually inspected to determine that the definition in SR x2 was higher than HR images at identical resolutions. SR x4 images were relatively lower in quality than OG images. However, the SR images were significantly improved when compared with LR/1/4. During the transformation from HR to LR, loss occurred for the LR/1/2 and LR/1/4 images, and the loss was expected to be greater in LR/1/4 than in LR/1/2. Additionally, the crack form reviewed after transformation into SR was similar to that of the SR x2 and SR x4 images. Therefore, two transformed images were found to be similar to the actual image.

3.3. Crack Pixel Measurement

Figure 4 shows a comparison of the images after applying binarization to determine the crack width. Images (LR) shot at a 3-meter distance from the location of the actual crack were transformed into HR/x2 and HR/x4. Then, binarization was applied to distinguish the image background and crack shape. The binarization threshold value was based on the expressed crack value of the LR image, and the HR/x2 and HR/x4 images had similar cracks to the LR images. In the case of HR/x4 binarization shown in Figure 4f, the crack framework was partially lost during the transformation from LR to HR/x4 image, as predicted. The remaining shape was properly retained.
To establish the actual size of the image resolution, the actual values of the pixels based on the used information were determined. To validate the experimental results, they were determined with the actual crack size from the data. A camera with a resolution of 3024 × 4032 and 5.81 × 7.76 mm sensor size was used. The focal distance of the camera was set to 5.7–6 mm so that it could collect object images with the highest clarity at a 3-m shooting distance. The size of one pixel was found to account for 0.96 mm2, 1.01 mm2, and 0.84 mm2 by determining the pixel size through the geometrical relationship of the camera performance and shooting area. A greater range is occupied by 1 mm2 than the average crack width. Therefore, the image resolution was transformed into x2 and x4 using the VDSR algorithm to include the size of one pixel within the range of measurable crack size, and to reconstruct the size of one pixel. The results are shown in Figure 5.
Figure 5 shows images that transformed the crack area of LR images shot at a 3-m distance into SR images. Overall, the framework of the cracks was well-expressed, but it was partially lost in some images. The loss was generated in low-frequency areas during reconstruction into SR. As predicted, certain parts were not extracted, as they were beyond the existing threshold value. SR images were reconstructed based on 15 images, and the average pixel numbers were determined from the extracted framework, as shown in Table 3.
The results show that the crack width after application of the VDSR algorithm was measured closer to the actual value than the measurements from the previous images. In the case of SR x2, no differences occurred from the LR image. This was attributed to the LR image pixel values including a greater amount of data than the actual crack width measurement. In the case of SR x4, the size of one pixel was similar to the size of the actual crack width measurement. Therefore, most were considered to have accurate values. In conclusion, images in which it was difficult to measure the actual crack width of one pixel were transformed into a high-resolution x4, from which a measurement value similar to the actual crack width could be estimated.
However, the measurement was based on a fixed-size pixel, hence there was a range of error from the actual crack width. This error value was considered to have occurred from parts that contained the crack wall within the area of the pixel. This was judged to be an error value occurring in the part where the area included in the pixel includes both the crack width and the wall surface, as shown in Figure 6. This resulted in a high error rate, as shown in Table 3. Additionally, parts in which the crack framework was not extracted were seemingly blurred areas, which were believed to have been lost during the SR transformation process.

4. Conclusions

In order to solve the difficulty of measuring crack width due to low resolution in images collected at safe intervals for crack width inspection with unmanned aircraft, this study proposed a high-resolution image-based crack width measurement method using the VDSR algorithm. The purpose was to analyze how crack widths could be measured by increasing the resolution corresponding to the crack area of an image photographed at a safe interval distance. First, VDSR algorithms were applied to reconstruct LR images into SRs. After that, in order to measure the crack width pixels of the reconstructed image, the crack width and the background area were divided on the basis of image binarization. Finally, the crack width was measured based on the actual size of the pixel region through geometric relationships, and it was confirmed that the measurement was similar to the actual crack width.
The quality of reconstructed images in high resolution was examined through the naked eye, and through PSNR and SSIM. In order to evaluate the performance of the VDSR algorithms refined from the training set, the HR images identical to the learning data were converted into LR images (1/2, 1/4). Then, the LR images were reconstructed into SR images (SR x2, SR x4) utilizing the VDSR algorithm to evaluate the quality between the SR and HR images. The evaluation results showed that the value of SR x2 showed the highest similarity, and in the case of SR x4, it was relatively lower than the value of SR x2. When evaluating an image with the naked eye, it was confirmed that both values of SR x2 and SR x4 were reconstructed more clearly than before when reconstructed with the LR image in comparison to the SR image.
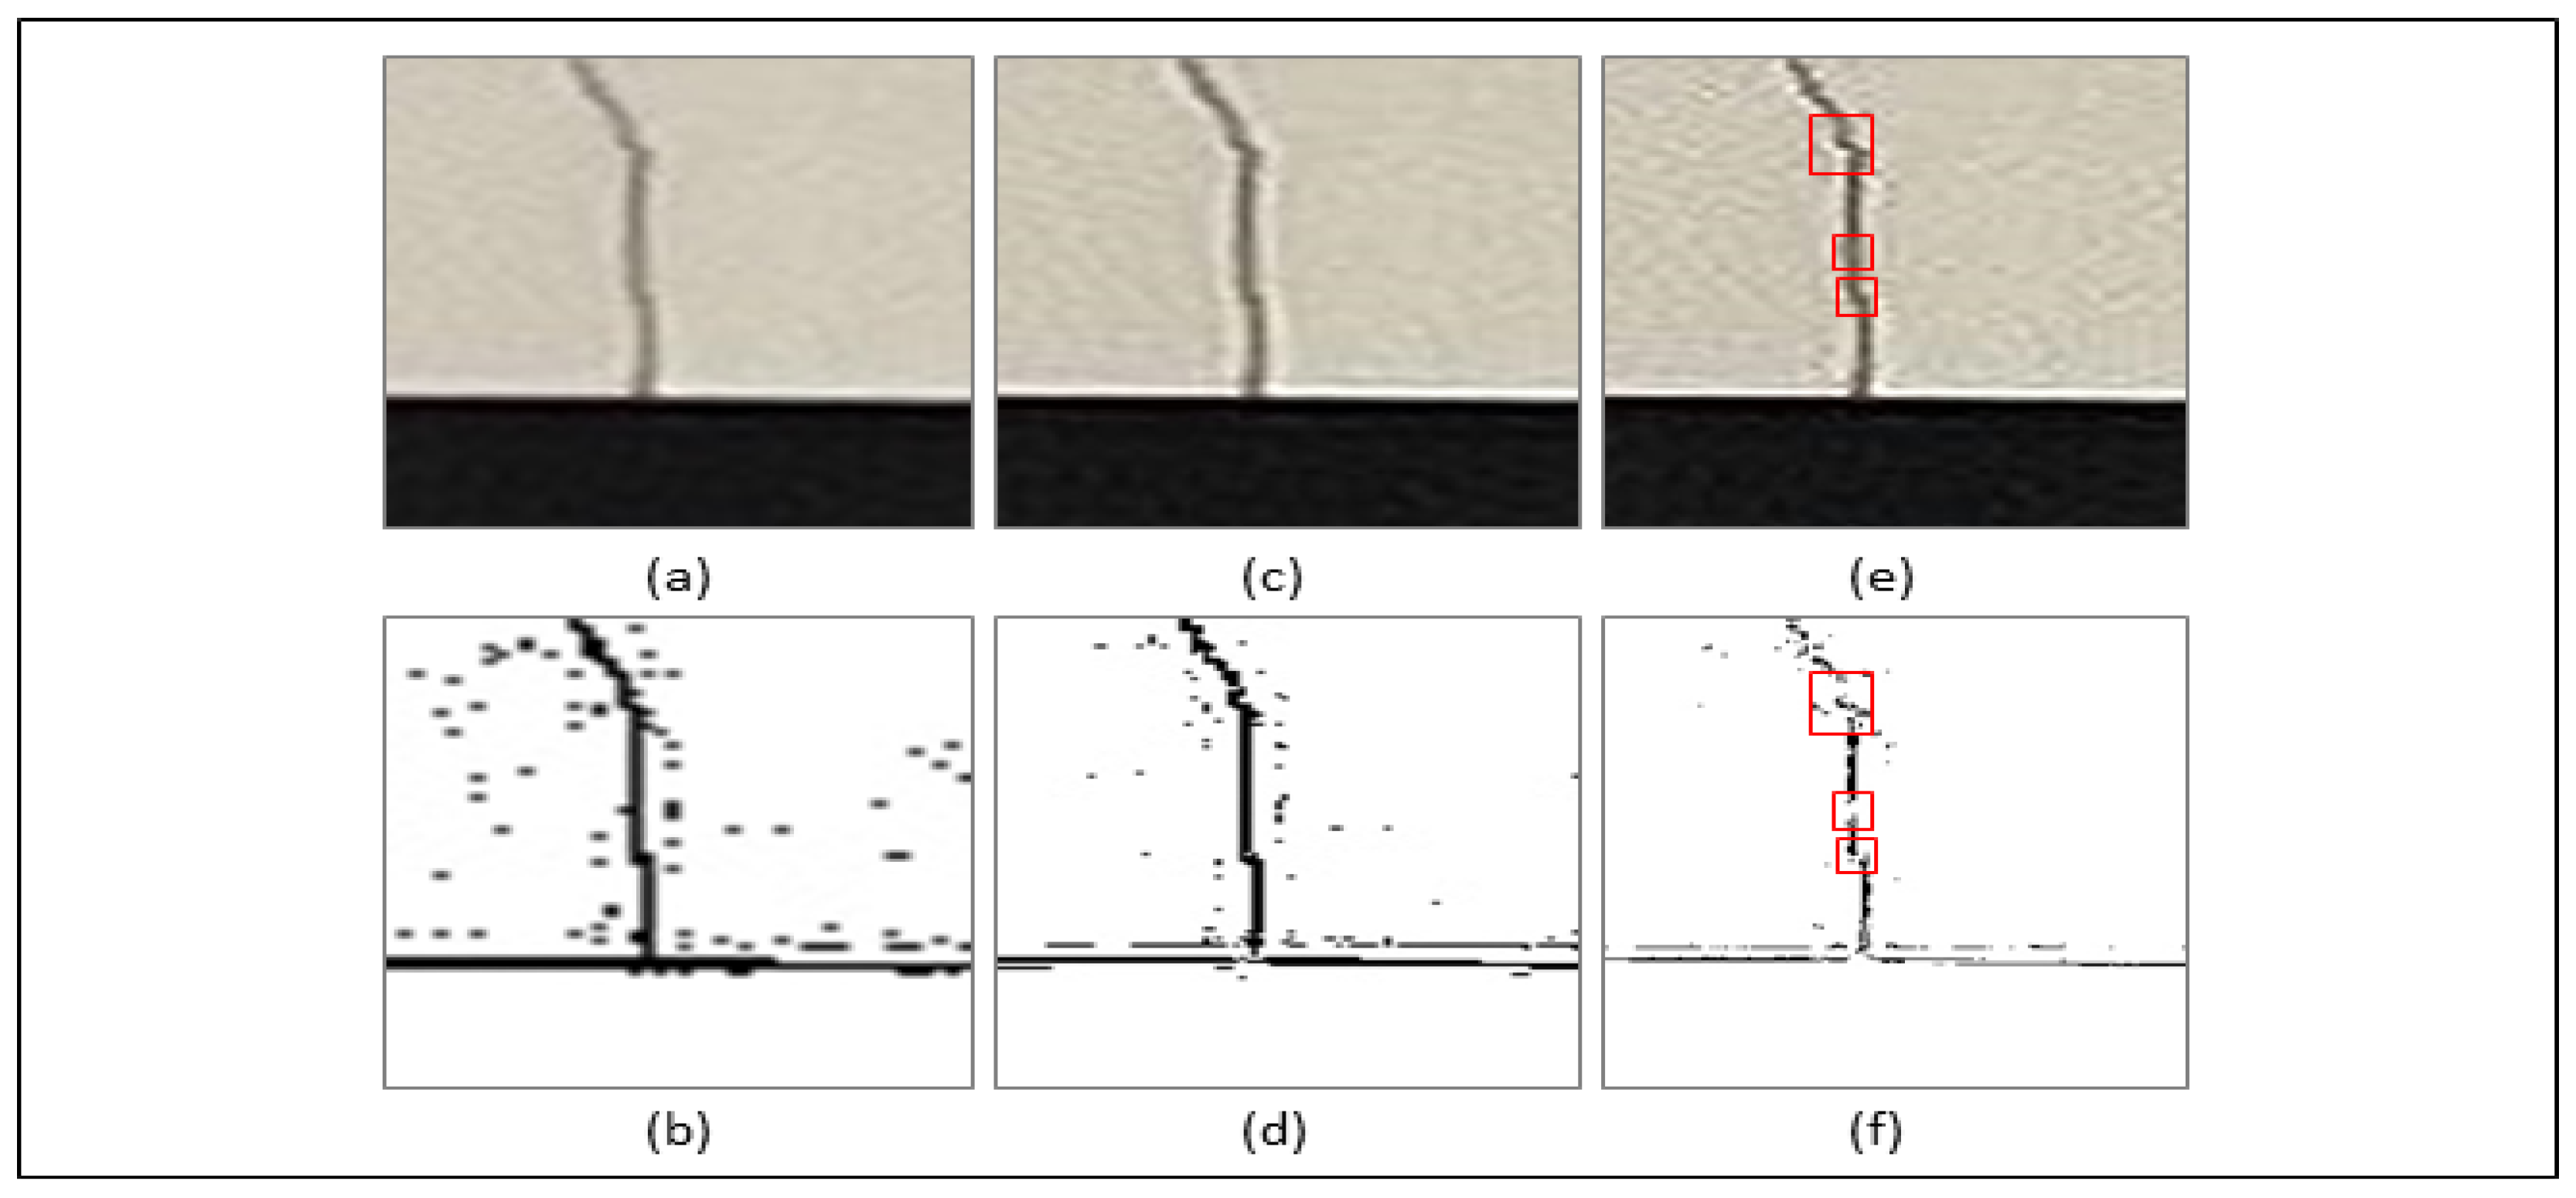
An SR image using the VDSL algorithm was reconstructed based on an image (LR) photographed 3 m away from a position where actual measurements of crack width could be obtained. Subsequently, binarization was applied to distinguish the background from the crack shape, and it was confirmed that all three images, LR, SR x2, and SR x4, correctly extracted the crack shape. Afterwards, the size of one pixel was calculated through the geometric relationship between camera performance and photographic area, and three values were derived: 0.96 mm2, 1.01 mm2, and 0.84 mm2. After that, the pixel value was adjusted to match the reconstructed image magnification to measure the crack width. As a result, when the high resolution was applied, it was confirmed that it was derived similarly to the measured crack width value. However, the two areas of the crack width and the wall surface were calculated together using pixels of a fixed size, and there was a limit to the measurement, showing a high error rate.
The above limitations could be addressed through additional research that would measure the crack width by transforming HR images to super high-resolution images, and by applying various methods to include more pixels corresponding to the crack width. Moreover, the crack width can be quantitatively measured by applying additional methods that measure the crack width.
The VDSR algorithm-based crack width measurement method showed significant results. However, additional measures are required to resolve problems in quantitatively assessing the crack width. It is considered necessary to search for methods of analyzing images shot at a safe UAV distance by applying image quality improvement methods, and using various methods of crack width measurement.

Author Contributions

J.Y. developed the concept and drafted the manuscript. H.S. revised the manuscript. S.L. supervised the overall research. M.S. and H.G. reviewed the manuscript. All authors have read and agreed to the published version of the manuscript.

Funding

This research is supported by the Korea Agency for Infrastructure Technology Advancement (KAIA) grant funded by the Ministry of Land, Infrastructure and Transport (Grant RS-2021-KA163951(22CTAP-C163951-02)).

Institutional Review Board Statement

Not applicable.

Informed Consent Statement

Not applicable.

Data Availability Statement

Not applicable.

Acknowledgments

The authors would like to thank the Ministry of Trade Industry and Energy of the Korean government for funding this research project.

Conflicts of Interest

The authors declare no conflict of interest.

References

  1. Ayele, Y.Z.; Aliyari, M. Automatic crack segmentation for uav-assisted bridge inspection. Energies 2020, 13, 6250. [Google Scholar] [CrossRef]
  2. Lee, Y.H.; Bae, S.J. Performance Evaluation Method for Facility Inspection and Diagnostic Technologies. Korean Soc. Disaster Inf. 2020, 16, 178–191. [Google Scholar] [CrossRef]
  3. Yue, P.; Gaowei, Z. A spatial-channel hierarchical deep learning network for pixel-level automated crack detection. Autom. Constr. 2020, 119, 103357. [Google Scholar] [CrossRef]
  4. Li, C.Q.; Yang, S.T. Prediction of Concrete Crack Width under Combined Reinforcement Corrosion and Applied Load. J. Eng. Mech. 2011, 137, 722–731. [Google Scholar] [CrossRef] [Green Version]
  5. Borosnyói, A.; Snóbli, I. Crack width variation within the concrete cover of reinforced concrete members. J. Silic. Based Compos. Mater. 2010, 62, 70–74. [Google Scholar] [CrossRef]
  6. Lee, B.Y.; Kim, Y.Y. Automated image processing technique for detecting and analysing concrete surface cracks. Struct. Infrastruct. Eng. 2013, 9, 567–577. [Google Scholar] [CrossRef]
  7. Zhong, X.; Peng, X. Assessment of the feasibility of detecting concrete cracks in images acquired by unmanned aerial vehicles. Autom. Constr. 2018, 89, 49–57. [Google Scholar] [CrossRef]
  8. Mahama, E.; Karimoddini, A. Testing and Evaluating the Impact of Illumination Levels on UAV-assisted Bridge Inspection. In Proceedings of the IEEE Aerospace Conference, Big Sky, MT, USA, 5–12 March 2022. [Google Scholar] [CrossRef]
  9. Brandon, J.P.; Rebecca, A.A. Streamlined bridge inspection system utilizing unmanned aerial vehicles (UAVs) and machine learning. Measurement 2020, 164, 108048. [Google Scholar] [CrossRef]
  10. Hubbard, B.; Hubbard, S. Unmanned Aircraft Systems (UAS) for Bridge Inspection Safety. Drone 2020, 4, 40. [Google Scholar] [CrossRef]
  11. Kang, D.; Benipal, S.S.; Gopal, D.L.; Cha, Y.J. Hybrid pixel-level concrete crack segmentation and quantification across complex backgrounds using deep learning. Autom. Constr. 2020, 118, 103291. [Google Scholar] [CrossRef]
  12. Kim, I.H.; Jeon, H. Application of crack identification techniques for an aging concrete bridge inspection using an unmanned aerial vehicle. Sensors 2018, 18, 1881. [Google Scholar] [CrossRef] [PubMed] [Green Version]
  13. Bae, H.; Jang, K. Deep super resolution crack network (SrcNet) for improving computer vision-based automated crack detectability in in situ bridges. Struct. Health Monit. Int. J. 2021, 20, 1428–1442. [Google Scholar] [CrossRef]
  14. Jahanshahi, M.R.; Masri, S.F. A new methodology for non-contact accurate crack width measurement through photogrammetry for automated structural safety evaluation. Smart Mater. Struct. 2013, 22, 035019. [Google Scholar] [CrossRef]
  15. Jin, S.; Lee, S.E. A vision-based approach for autonomous crack width measurement with flexible kernel. Autom. Constr. 2020, 110, 103019. [Google Scholar] [CrossRef]
  16. Kim, H.J.; Lee, J.H. Concrete Crack Identification Using a UAV Incorporating Hybrid Image Processing. Sensors 2017, 17, 2052–2065. [Google Scholar] [CrossRef] [PubMed] [Green Version]
  17. Ni, F.T.; Zhang, J. Zernike-moment measurement of thin-crack width in images enabled by dual-scale deep learning. Comput. Aided Civ. Infrastruct. Eng. 2019, 34, 367–384. [Google Scholar] [CrossRef]
  18. Zhao, S.Z.; Kang, F. Structural health monitoring and inspection of dams based on UAV photogrammetry with image 3D reconstruction. Autom. Constr. 2021, 130, 103832. [Google Scholar] [CrossRef]
  19. Jithin, S.I.; Ramesh, K. Super resolution techniques for medical image processing. In Proceedings of the 2015 International Conference on Technologies for Sustainable Development (ICTSD), Mumbai, India, 4–6 February 2015. [Google Scholar] [CrossRef]
  20. Rajput, S.S.; Arya, K.V. A robust face super-resolution algorithm and its application in low-resolution face recognition system. Multimed. Tools Appl. 2020, 79, 23909–23934. [Google Scholar] [CrossRef]
  21. Zhang, S.; Liang, G. A Fast Medical Image Super Resolution Method Based on Deep Learning Network. IEEE Access 2019, 7, 12319–12327. [Google Scholar] [CrossRef]
  22. Wang, P.J.; Bayram, B. A comprehensive review on deep learning based remote sensing image super-resolution methods. Earth-Sci. Rev. 2022, 232, 104110. [Google Scholar] [CrossRef]
  23. Inzerillo, L.; Acuto, F. Super-Resolution Images Methodology Applied to UAV Datasets to Road Pavement Monitoring. Drones 2022, 6, 171. [Google Scholar] [CrossRef]
  24. Vint, D.; Di Caterina, G. Evaluation of Performance of VDSR Super Resolution on Real and Synthetic Images. In Proceedings of the 2019 Sensor Signal Processing for Defence Conference (SSPD), Brighton, UK, 9–10 May 2019. [Google Scholar] [CrossRef]
  25. Xiang, C.; Wang, W. Crack detection algorithm for concrete structures based on super-resolution reconstruction and segmentation network. Autom. Constr. 2022, 140, 104346. [Google Scholar] [CrossRef]
  26. Winkler, S.; Mohandas, P. The Evolution of Video Quality Measurement: From PSNR to Hybrid Metrics. IEEE Trans. Broadcast. 2008, 54, 660–668. [Google Scholar] [CrossRef]
  27. Setiadi, D. PSNR vs SSIM: Imperceptibility quality assessment for image steganography. Multimed. Tools Appl. 2020, 80, 8423–8444. [Google Scholar] [CrossRef]
  28. Zhang, L.X.; Shen, J.K. A research on an improved Unet-based concrete crack detection algorithm. Struct. Health Monit. Int. J. 2020, 20, 1864–1879. [Google Scholar] [CrossRef]
Figure 1. Crack measurement procedure after image conversion.
Sustainability 15 00478 g001
Figure 2. Crack area extraction transformation: (a) crack image, (b) crack image grayscale, (c) image binarization.
Sustainability 15 00478 g002
Figure 3. Image comparison: (a) HR image, (b) LR half image, (c) LR one quarter image, (d) SR x2 image, (e) SR x4 image.
Sustainability 15 00478 g003
Figure 4. Crack skeleton comparison: (a) LR crack image, (b) LR image binarization, (c) SR x2 image binarization, (d) SR x2 image binarization, (e) SR x4 crack image and loss position estimation, and (f) SR x4 image binarization and loss position estimation.
Sustainability 15 00478 g004
Figure 5. (1)–(3) Results of SR image crack estimation using image binarization.
Sustainability 15 00478 g005
Figure 6. Case of crack width measurement error.
Sustainability 15 00478 g006
Table 1. Configuring algorithmic learning data.
TrainingValidation
Image Dataset50711324
Resolution(5472 × 3648), (3024 × 4032), (2040 × 1356), (1284 × 2040)
Table 2. Quality assessment of high-resolution conversion images.
ImageSR
(1008 × 1008)
SR
(336 × 448)
SR
(1296 × 972)
x2x4x2x4x2x4
PSNR31.731.132.431.432.030.7
SSIM0.780.650.780.690.850.77
MSE65.590.861.4101.162.9116.8
PSNR: peak signal-to-noise ratio, SSIM: structural similarity index map; MSE: mean square error.
Table 3. Comparison of crack measurement results of LR and SR images.
No.Actual Measurement (mm)LRSR x2SR x4Error (%)
pxMeasurement (mm)pxMeasurement (mm)pxMeasurement (mm)
10.4511.012120.50510%
20.4511.012120.50510%
30.610.8420.8430.634.7%
40.4511.012120.50510%
50.4511.0110.520.50510%
60.3510.9620.9620.4827%
70.3510.9620.9620.4827%
80.2511.0121.0120.50550%
90.2511.0121.0110.2520.7%
100.2510.9620.9610.244%
110.3510.9620.9620.4827%
120.3510.9620.9620.4827%
130.3511.0121.0110.25239%
140.3511.0121.0120.50531%
150.3511.0121.0120.50531%
Disclaimer/Publisher’s Note: The statements, opinions and data contained in all publications are solely those of the individual author(s) and contributor(s) and not of MDPI and/or the editor(s). MDPI and/or the editor(s) disclaim responsibility for any injury to people or property resulting from any ideas, methods, instructions or products referred to in the content.

