1. Introduction
Food waste is recognized as one of the most important global manifestations of the inefficiencies of food systems. The UN Food System Summit 2021 emphasized the multiple impacts of food waste in terms of environmental and economic impacts. Its call for action has been further spotlighted by the UN Framework Convention on Climate Change’s 26th Conference of the Parties (COP26), which emphasized how climate change responses require the coupling of public interventions with individual actions. Additionally, EUROSTAT estimated that in 2020, approximately 127 kg of food waste was generated per inhabitant in the EU, making a total of almost 57 million tons across all the member states [
1].
A large part of the literature is dedicated to consumers being responsible for producing a higher proportion of food waste both in industrialized [
2] and non-industrialized countries [
3]. As a result, growing attention has been paid to the consumption stage, which has been recognized as an essential behavioral issue where multiple inter-related and competing drivers play an influential role [
4].
Food waste behavioral drivers include personal preferences such as taste and cultural issues [
5]; habits such as the frequency of shopping [
6]; attitudes related to thoughts and feelings [
7]; social norms [
8]; and knowledge and skills. Food can be wasted due to poor understanding of date labels or of food storing practices aiming to maximize shelf life [
9]. Similarly, food waste can be related to a lack of ability in food preparation and portioning [
10,
11]. Some attention has been given to consumers’ individual concerns regarding food waste implications, and therefore, to their understanding of the environmental [
12], economic, and social impacts of food waste [
13,
14]. In addition to individual capacity and concerns, several authors have suggested considering opportunities such as local shopping options [
15] and the availability of high-tech kitchen appliances [
16]. Demographics also play a role in the generation of food waste. Such factors include household size [
17,
18]; household composition, including age; the presence of children; the relationship structure in the house [
18]; employment status [
19]; income [
20]; and education level [
16].
The scientific literature has explored the relationships between dietary patterns, their drivers of choice, and pro-environmental behavior, such as an increase in fruit and vegetable consumption and a decrease in meat intake [
21,
22,
23]. Many studies have analyzed dietary choices in relation to personal factors such as instruction level [
24,
25,
26], personal psychological factors [
26,
27,
28], personal motivations, attitudes, health concerns [
29,
30,
31], the availability of healthy food [
32], and exposure to news and advertising related to food consumption [
33]. Among the individual factors, mindfulness, considered as the ability to live in the present moment without judging the situation, seems to be relevant to the definition of dietary choices [
34,
35,
36]. Finally, socio-demographic factors were found to be correlated with dietary choices [
37].
In addition to individual factors, macroeconomic factors seem to influence individual dietary choices. The economic development status of countries appears to be correlated with the widespread adoption of standardized diets based on the overconsumption of meat and over-processed food [
38,
39]. The economic affordability of diets is also correlated with the frequency of their adoption [
40,
41].
Dietary choices, however, have rarely been studied as possible drivers of household food waste. Recent research has focused on the link between diets in terms of nutrient intake and pro-environmental behaviors both at aggregate [
42] and consumer level [
29] indirectly addressing the association with food waste [
43]. Additionally, Reynolds et al. [
44] showed that effective strategies for reducing food waste at the consumer level include changes in the sizes and types of plates and interventions aiming to increase the consumption of vegetables, while Qi et al. [
45] highlighted the positive role of information on the social cost of food waste and its reduction. This might indicate that the shift toward healthy diets can be part of food waste reduction strategies [
44]. From prior research, some promising insights seem to suggest that the research gap between dietary patterns and food waste is worth investigating because it should be considered when developing waste reduction strategies.
Building on an original survey conducted in eight countries in 2021 (Canada, China, Germany, Italy, Russia, Spain, the UK, and the USA) by Waste Watcher International, this study explored the relationship between food waste at the household level and dietary habits, and their related food choices, through a cross-country comparative perspective.
The paper is structured as follows:
Section 2 outlines the survey and the methodology applied in the study; in
Section 3 and
Section 4, the results are shown and analyzed in the frame of the existing literature; finally,
Section 5 discusses the conclusions and implications for research and policy.
3. Results
3.1. Descriptive Statistics
The sample composition in terms of demographics is illustrated in
Table 2. The European countries, plus the UK and Canada, were similar in terms of the mean age; this varied between 47.8 and 49.9 years old. China and Russia presented lower mean ages (39.7 and 44.6 years, respectively), whereas the USA presented a mean age quite close the sample average.
The proportion of males was similar across countries, with a balanced proportion with females. On the other hand, the proportion of households with children living there (both underage and of age) was considerably different across countries: it ranged from 63% in China down to 22% in the USA. Germany, Canada, and the UK also presented a percentage of families with children living in the house of below 30%, whereas Italy, Spain, and Russia were above 40%. This clearly reflects the distinct cultural habits in terms of living standards and traditions. Notably, countries also differed regarding their living arrangements: in China, nearly 78% of the respondents lived in couples, whereas only 22% lived on their own or in other living conditions. Other countries with higher shares of people living in couples were Italy, Spain, and Russia. In contrast, in Germany, only 53% of the sample declared living in couples, whereas 33.1% declared living on their own, and 13.5% had other living arrangements.
Regarding education, most of the sample was split between medium and high education with a residual share of respondents who had only achieved a low level of education. Across countries, these shares varied considerably. The greatest proportion of people with a high education level was in China (78%); these types of surveys tend to over-represent the urban population in this country, thus supporting the comparability of populations across the selected countries.
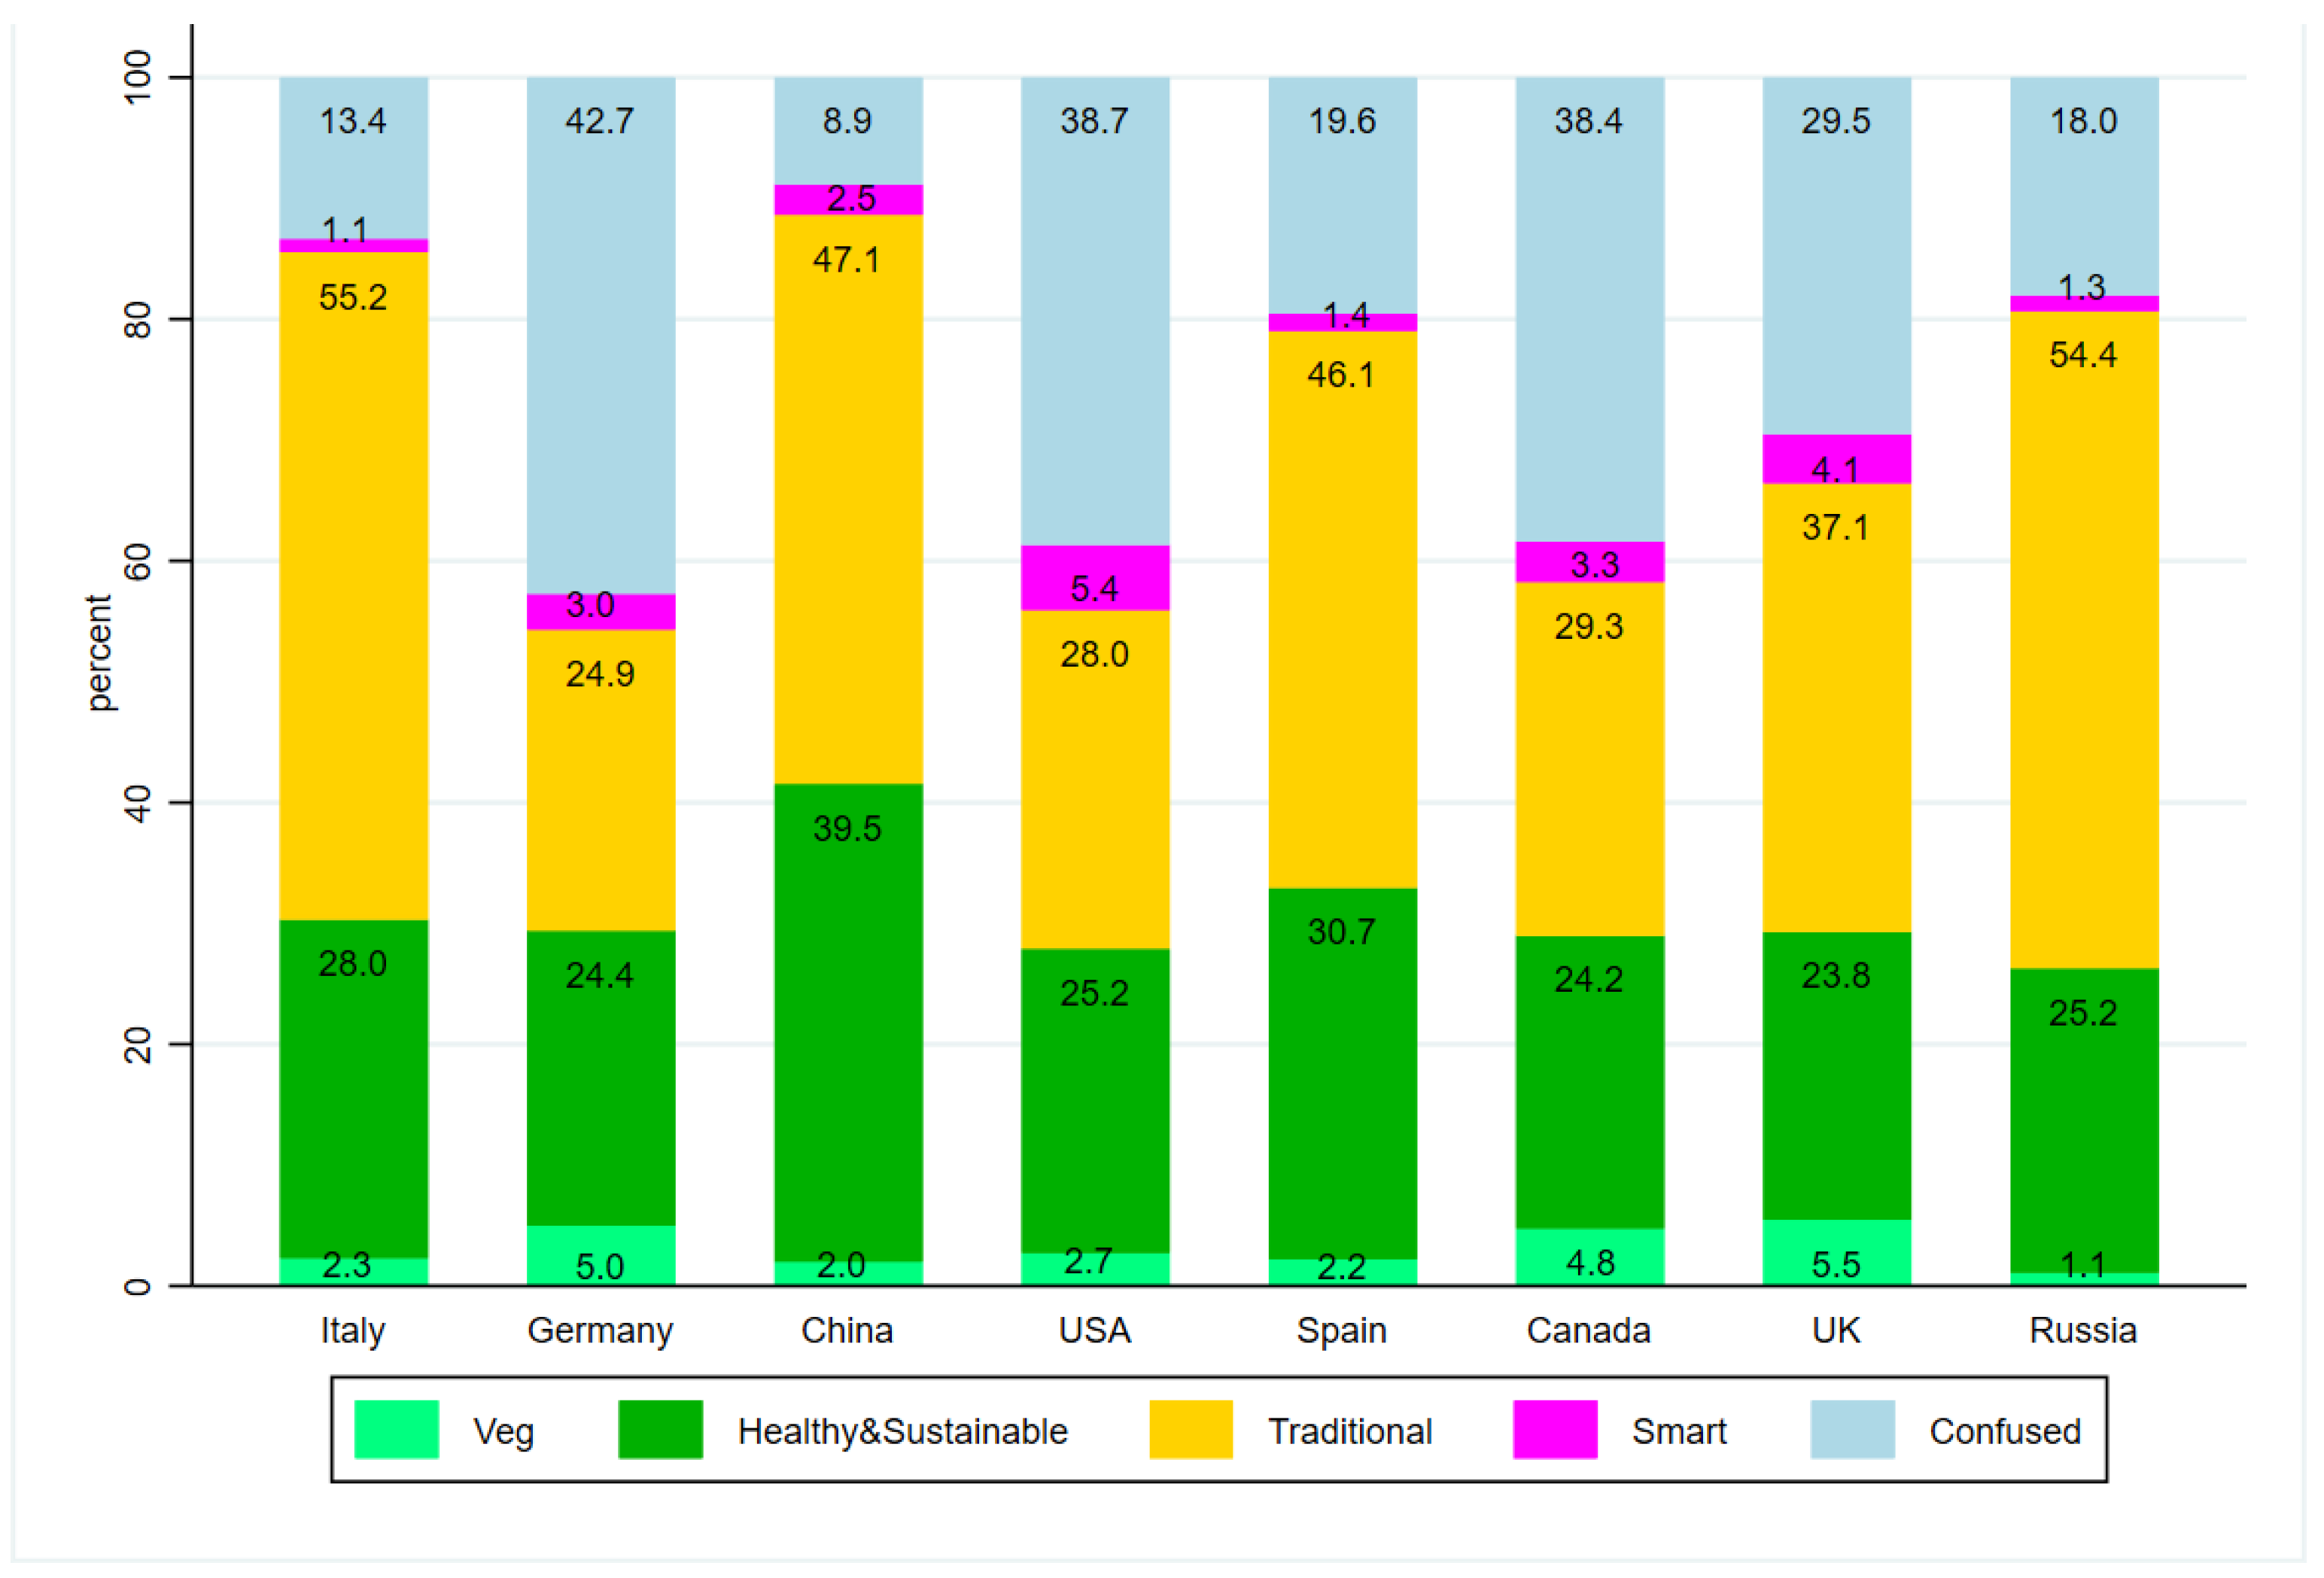
Regarding dietary habits across countries (presented in
Figure 1), more than half of the population in Italy (55.2%) and Russia (54.4%) followed a traditional type of diet, with Spain (46.1%) and China (47.1%) just below. China also presented the largest share of respondents who declared following a healthy and sustainable diet (39.5%), with Spain (30.7%), Germany (16.0%), and Italy (28.0%) closely following. Respondents self-declaring as vegetarians were more frequent in the UK (5.5%), Germany (5.0%), and Canada (4.8%). The USA (5.4%), the UK (4.1%), Canada (3.3%), and Germany (3.0%) presented higher proportions of respondents who declared following a smart diet. Similarly, Germany (42.7%), the USA (38.7%), Canada (38.4%), and the UK (29.5%) had higher shares of confused diets.
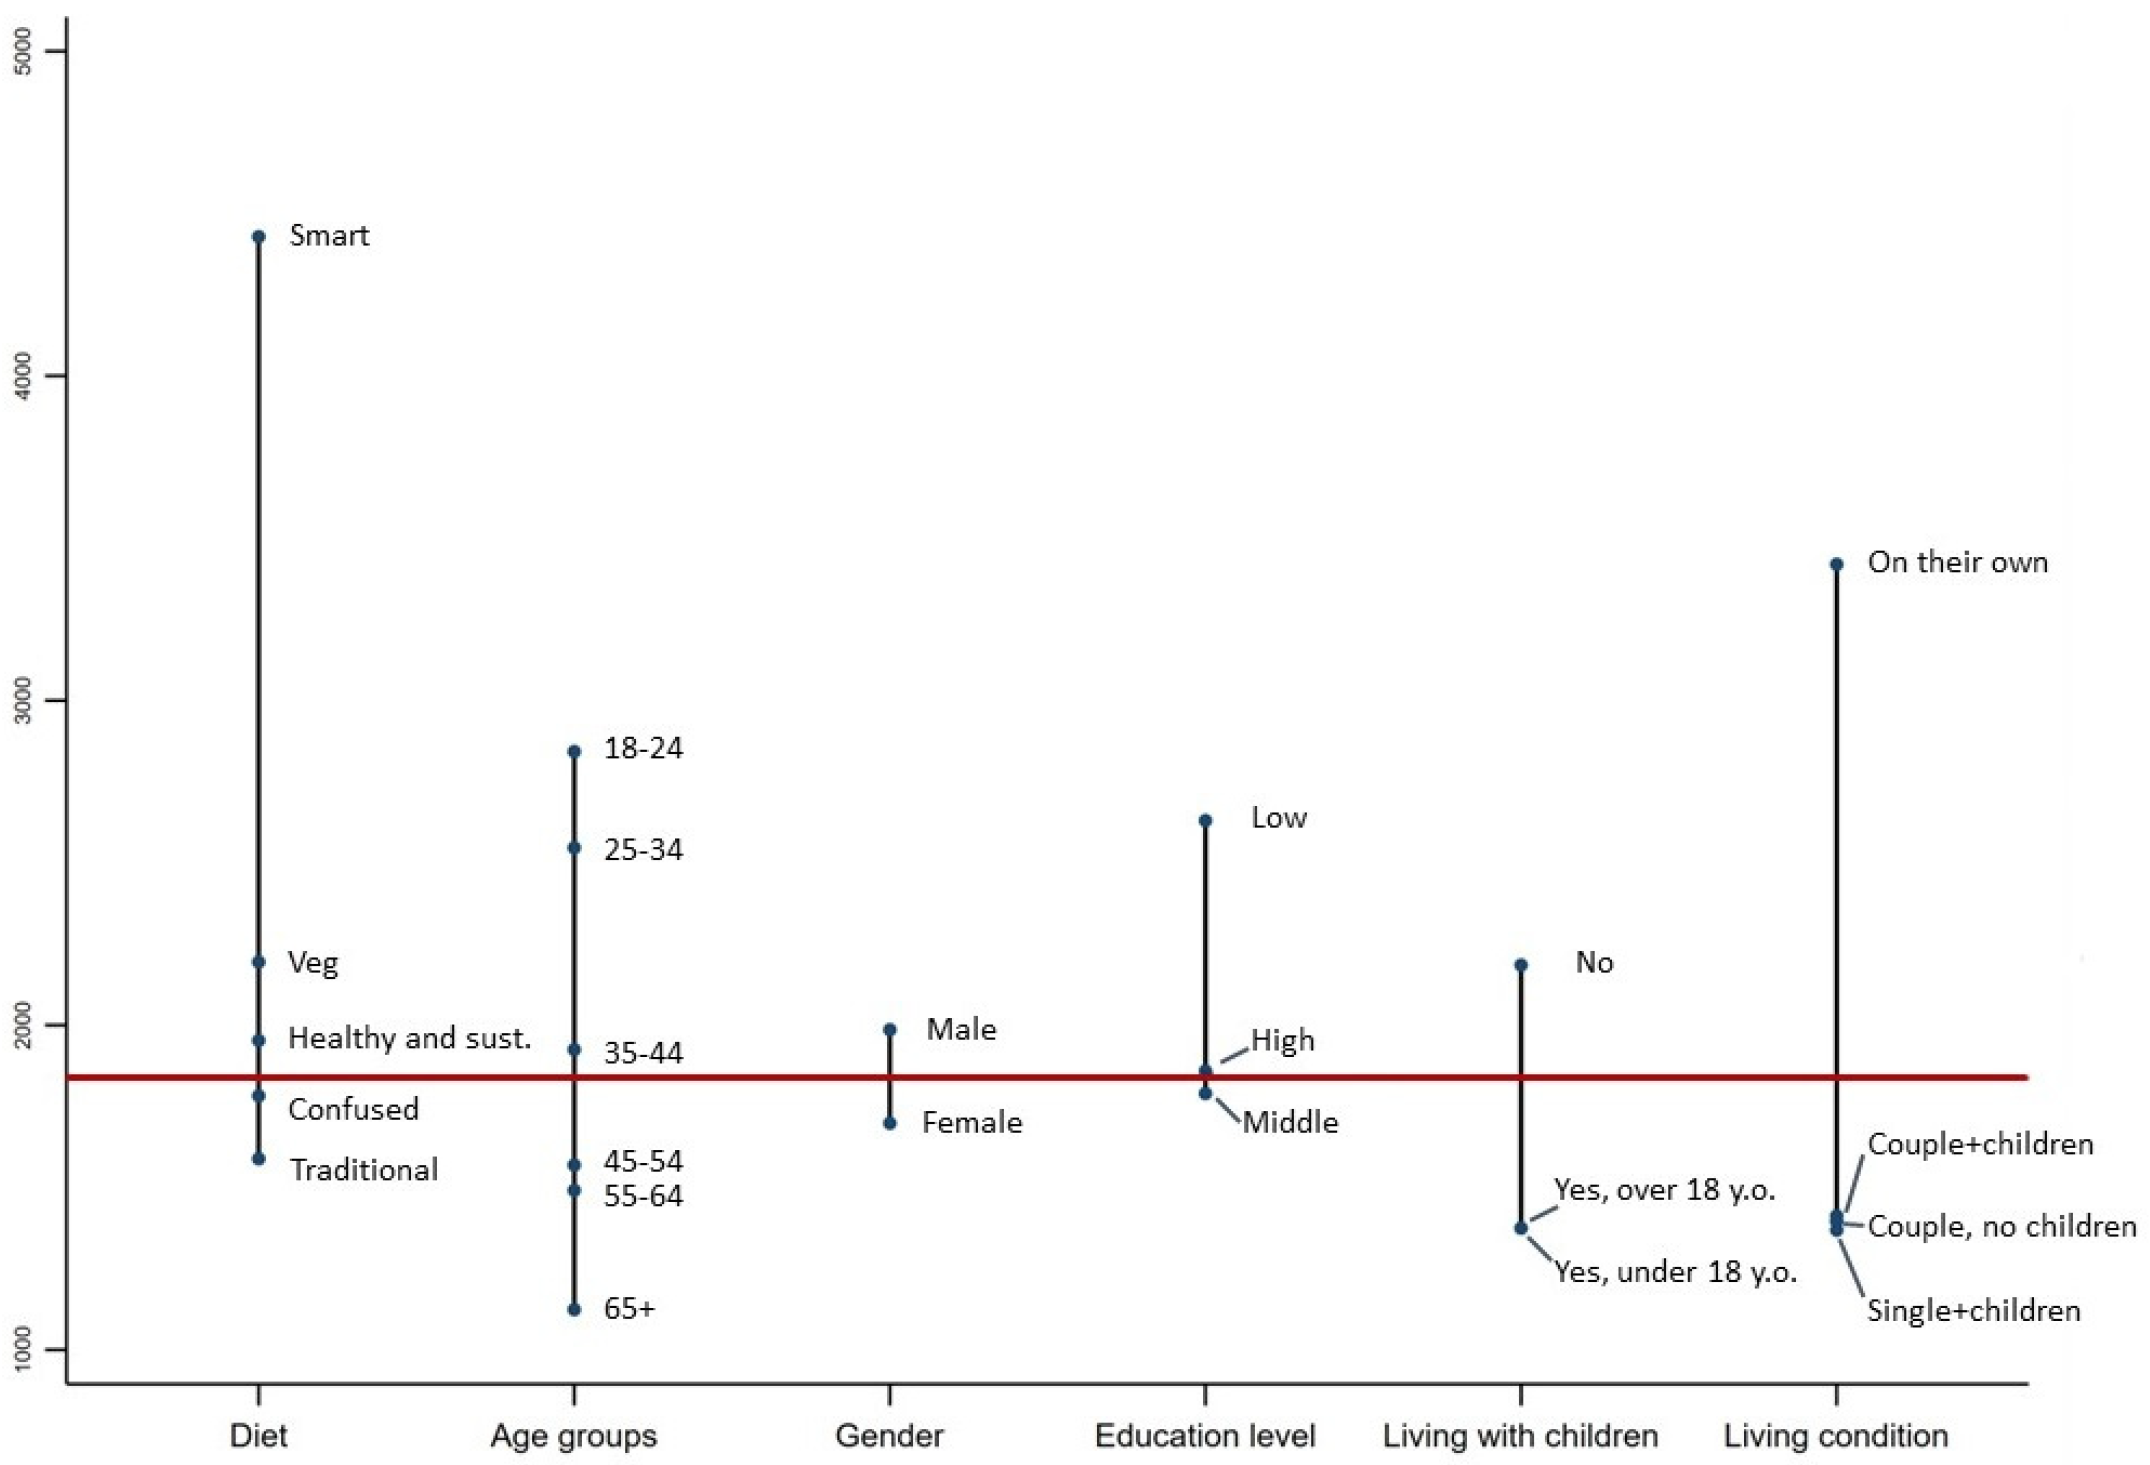
Analyzing food waste measured in Kcal per person (
Figure 2), it was possible to notice that people following a smart diet profile were those who declared the highest value of calories wasted (4428.6). Below this, but still above the sample average, were those who declared following a vegetarian diet (2647.7). In contrast were people who declared following a traditional type of diet (1588.3). Around the sample average were individuals who followed healthy and sustainable (1952.7) and confused (1782.3) diets.
Age appeared to be negatively associated with the number of Kcal wasted; the older the cohort, the fewer kilocalories wasted (from 2886.8 to 1123.6). Of course, this might be connected to the fact that elderly people usually need fewer calories per day [
54]. According to previous results in the literature, men waste more food than women (2018.0 vs. 1711.7), as do people with a lower education level (2624.2) compared with those with medium (1823.9) and high (1871.4) levels of education [
32,
33]. A clear difference was also observed between people who did not live with their children (2216.2) and those who had sons/daughters living in the house (1385.8, with no significant difference regarding the age of children). According to the relationship status and/or the living arrangement, it is worth noting that people who live on their own significantly wasted more food (3475.6) than people living in couples (1412.3) or in other living/relationship arrangements, such as single parents or those living with friends or roommates (1389.7). Finally, across countries, the USA presented the highest level of food waste (2854.9), whereas Russia presented the lowest (1114.6). Canada (2213.0), China (2181.4), and Germany (2048.8) presented levels above the sample average (1860.1); the UK (1771.6), Spain (1421.0), and Italy (1275.4) presented levels below the sample average.
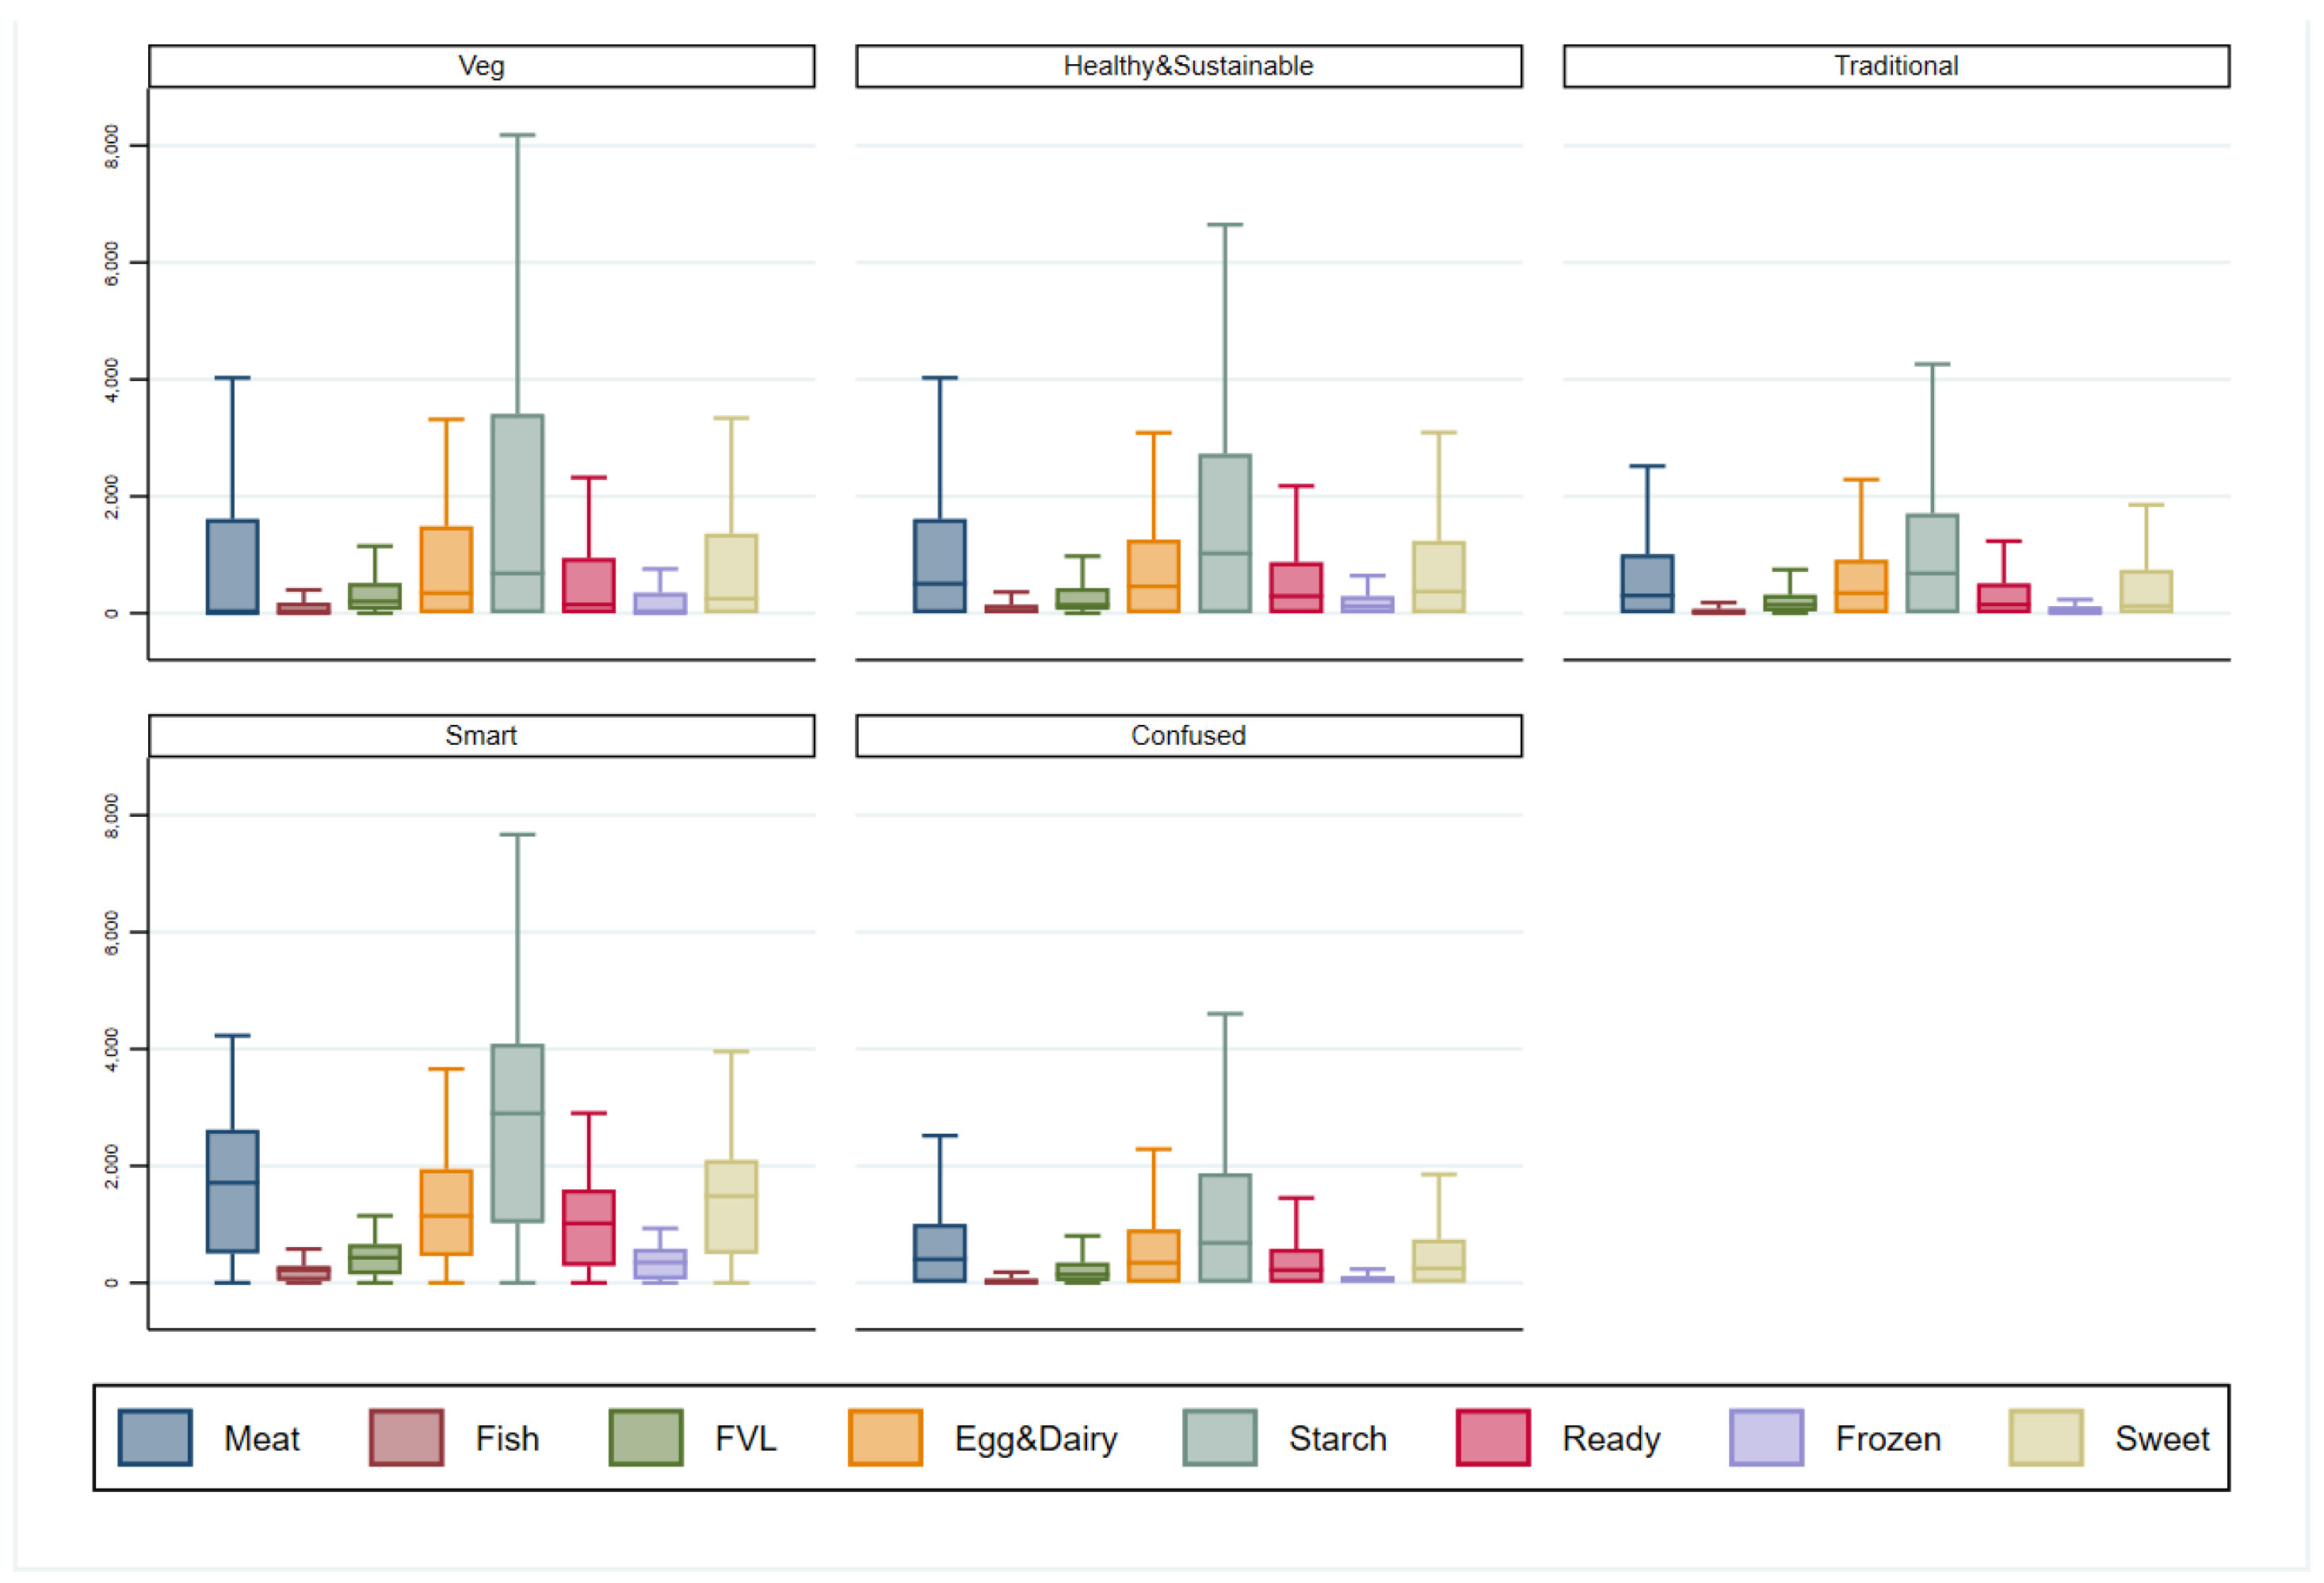
When analyzing the distribution of food waste (measured in kilocalories) with respect to diets and food categories (see
Figure 3), it is worth noting that, across all diet profiles, the type of food most commonly wasted in terms of calories is starch. Regarding meat, vegetarian respondents declared a certain number of wasted calories from meat, even though the median was set to zero. As stated before, although the question on diet directly addressed those interviewed, the amount of food waste was measured at the household level, where people with different types of diet may live together. Additionally, regarding meat, the group that presented a distribution more prone to higher values was the smart diet group. The same also happened for the other food categories, particularly egg and dairy, ready, and sweet products, which seemed to be wasted more for this type of diet. In contrast, for people following a traditional type of diet, the distribution presented lower maximum values for almost all of the food categories. Fish and frozen products were those foods which seemed to generate less waste across all diets. Regarding FVL, when measured in weight, waste for this food category was higher for the vegetarian and healthy and sustainable types of diet. It is worth noting that these foods are low in calories, and contribute very little to global waste.
The adoption of food waste-reducing behaviors by respondents was fairly frequent among respondents from all countries, where over half of the respondents declared observing them always or often. However, some differences were identified related to the typologies of self-declared dietary habits, as reported in
Table 3.
Among food waste reduction behavior, the use of food products after the expiry date was the most frequently reported among respondents of all countries, followed by the awareness of food stock content and organization. The use of a shopping list, although still relatively widely adopted, was the least frequently adopted behavior.
Respondents who declared adopting a smart diet were the least likely to use a shopping list (58.7%), to have proper knowledge of the content and the organization of their food stock (60.1%), and to use edible food products even after the expiration date if they were still deemed safe (70.7%).
In contrast, respondents who declared adopting traditional and healthy and sustainable diets adopted behaviors that have a positive impact on food waste reduction more frequently. They presented the highest levels of awareness about the content and organization of their food stock (78.4% and 70.7%, respectively), of the proper use and storage of leftovers (75.7% and 76.2%, respectively), and of the use of food products after the expiration date if they were still deemed edible (73.9% and 75%, respectively).
3.2. Regression Results
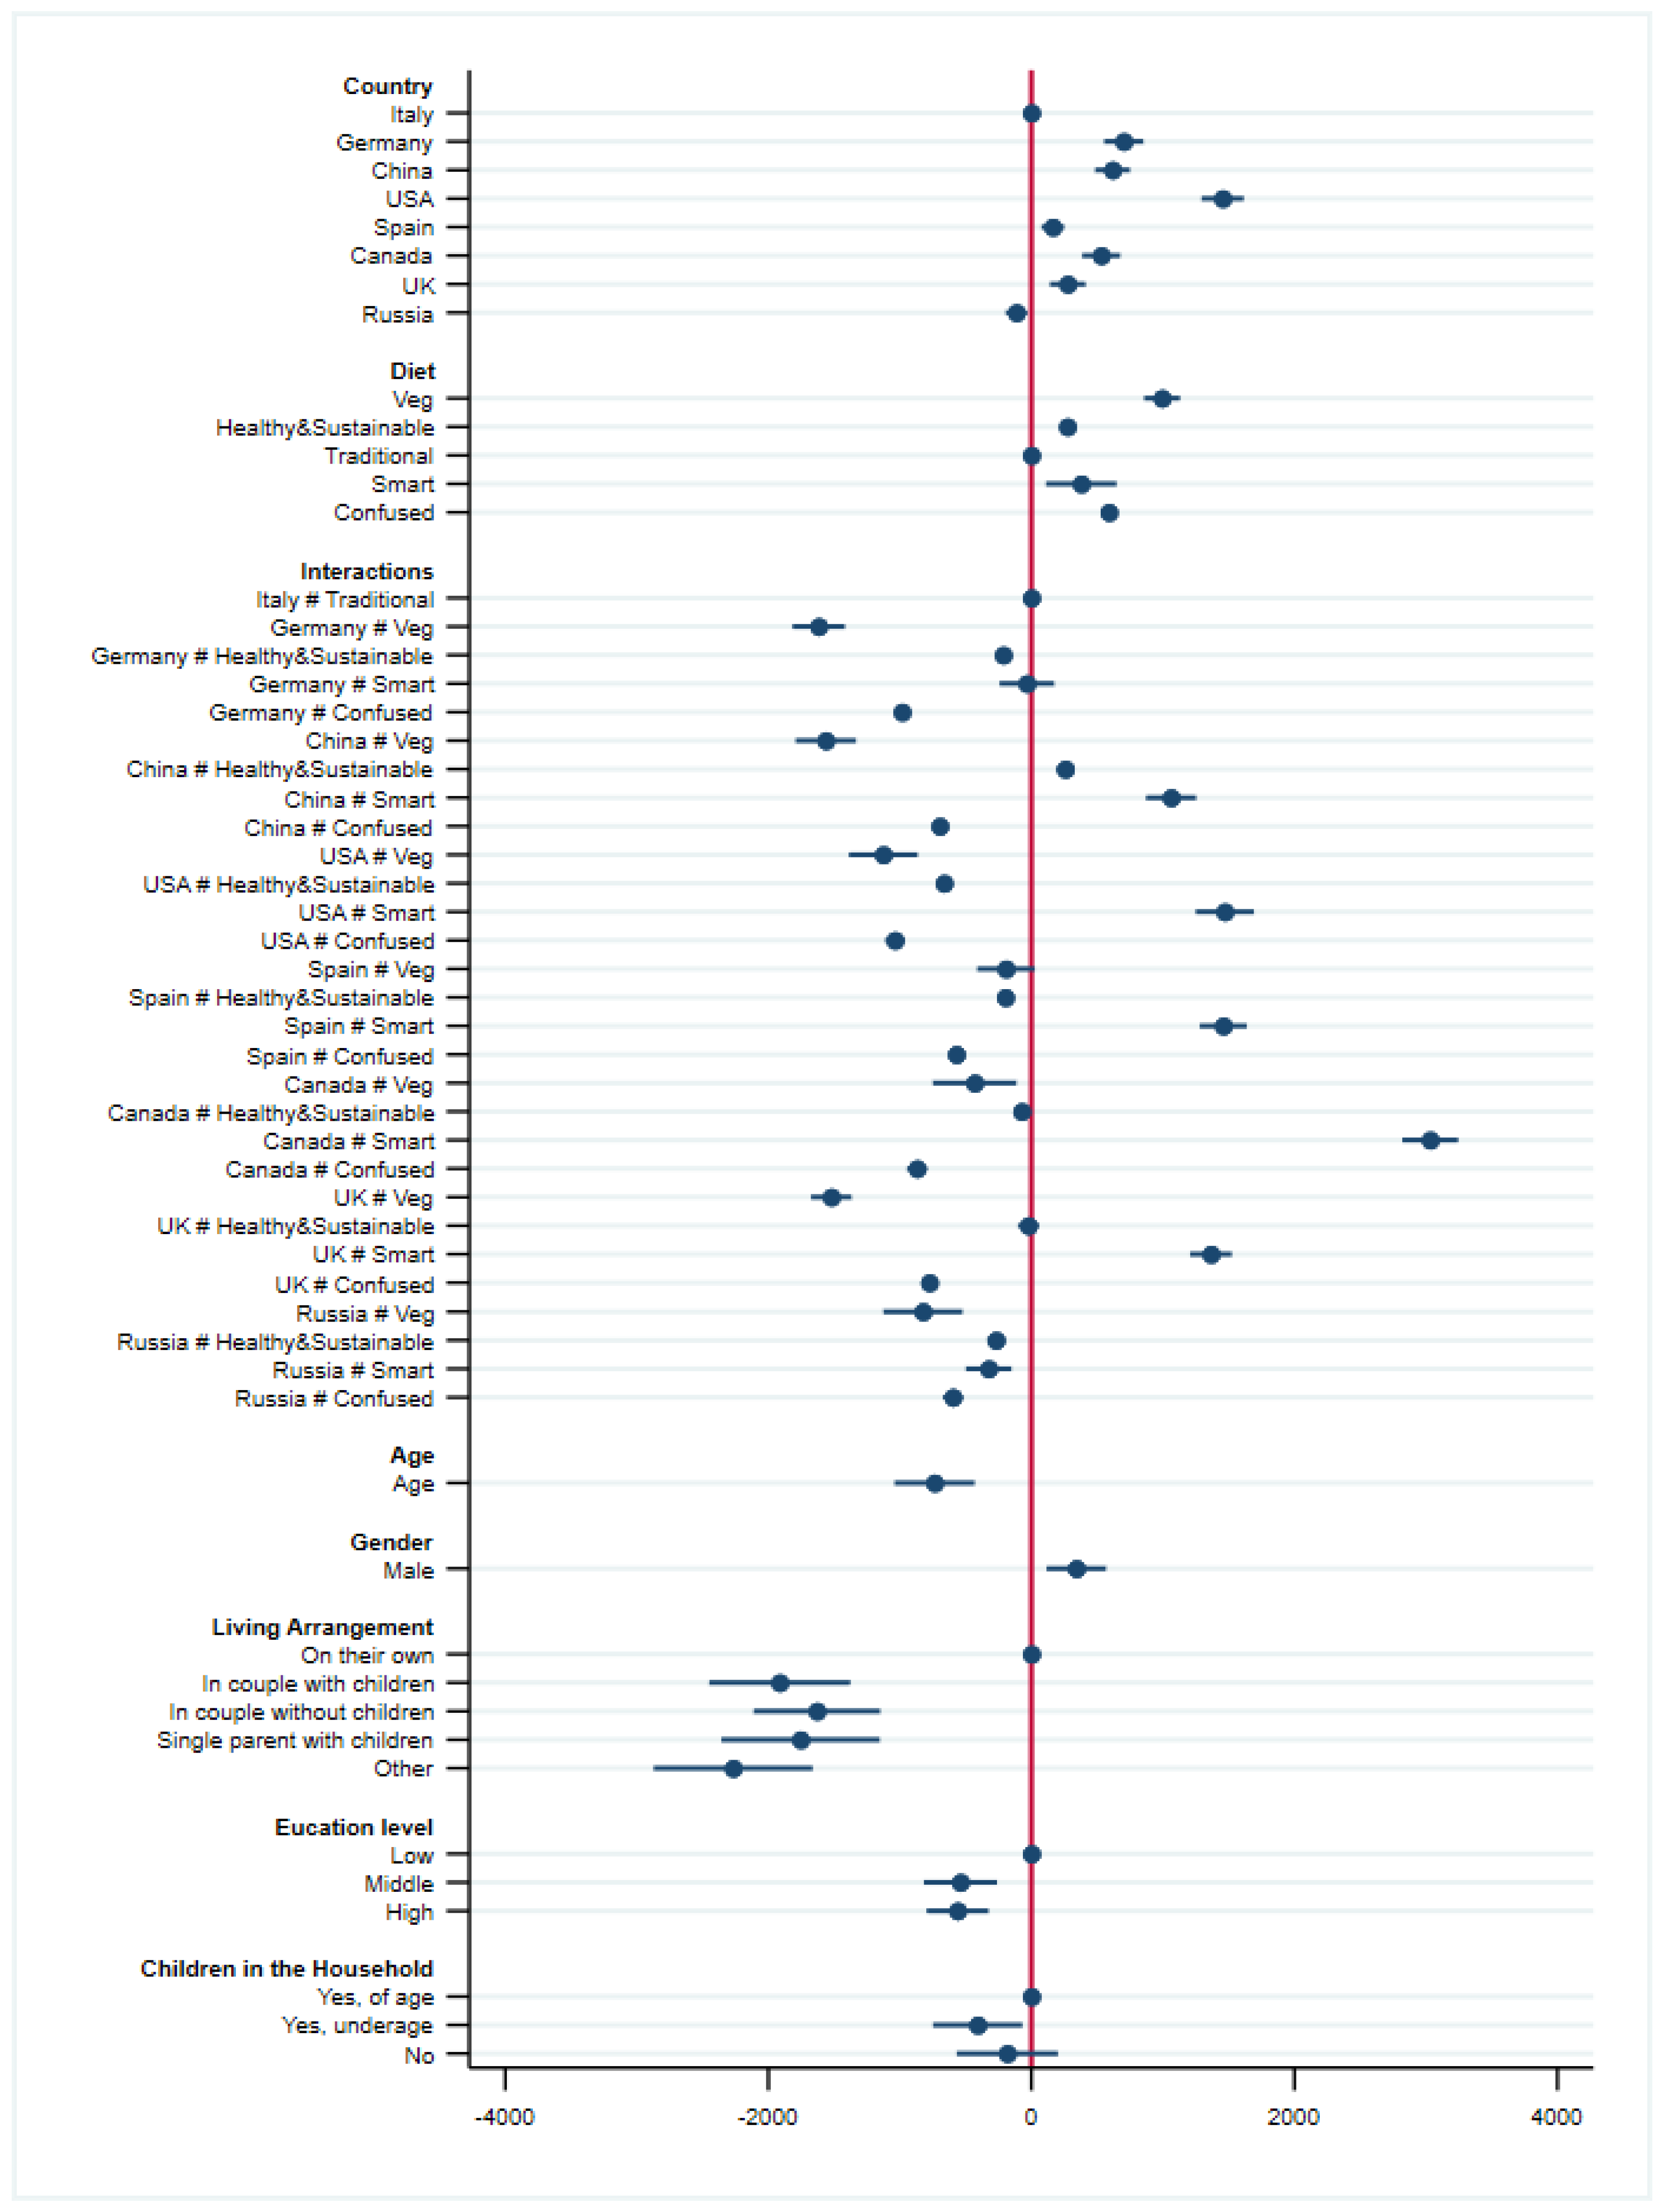
The last step of data analysis was the estimation of multiple regression models, to investigate the relationship of dietary patterns with the quantity of household food waste produced by different consumer typologies, controlling for several socio-demographic factors. In particular, the regression model included factors such as country (reference value: Italy), typology of diet (reference value: traditional), age in completed years, gender (reference value: male), living arrangements (reference value: independently), education level (reference value: low), and the presence of children (reference value: yes, of age). The coefficients of the regression model are illustrated in
Figure 4, with the red line indicating coefficients set to zero for the reference values. Additionally, confidence intervals at 95% are presented. The first set of regressors (country) represents the mean difference in perceived food waste for each country-specific traditional diet compared with Italy. The second group of regressors (diet) represents the mean difference in perceived food waste for each diet in Italy compared with a traditional diet. The third set of regressors (interactions) represents the mean difference between each diet in each country compared with the traditional Italian diet. Baseline coefficients are represented with zeros.
Considering differences across countries regarding traditional diets (country group of coefficients in
Figure 4), it is worth noting that with respect to Italy, only Russian respondents declared wasting fewer calories than Italian consumers. Considering the traditional diets in other countries, consumers from the USA declared the highest quantities of wasted kilocalories compared with Italy, followed by Germany, China, and Canada. In Spain and the UK, the average difference from Italy between individuals who followed a traditional type of diet was minimal but still significant.
When comparing the types of diet in Italy (diet group of coefficients in
Figure 4), all the coefficients associated with the five types of diet were higher on average than the coefficients representing traditional consumers, with the greatest difference for vegetarians.
The interaction coefficients between country and dietary habits represented the average differences between any type of diet in a given country and its traditional diet, compared with the same difference from the traditional Italian diet.
Consumers who declared following a smart diet tended to waste considerably more calories than consumers following other types of dietary patterns across all countries. In particular, the largest positive difference in the quantity of wasted calories was declared by Canadian respondents, followed by consumers in the USA, Spain, and the UK adopting the same dietary habits.
On the other hand, across countries, the greatest negative difference in wasted kilocalories was declared by consumers following a vegetarian diet. In particular, vegetarians from Germany declared the greatest negative difference in the amount of food wasted across the sample, followed by vegetarians from China and from the UK. Among other dietary patterns, consumers in the USA who declared a confused dietary pattern registered an amount of wasted Kcal per capita per week lower than the reference value of Italians following a traditional diet.
The controls presented coefficients coherent with the literature, because consumers with lower levels of education tended to waste more food. Consumers with secondary or higher education levels tended to waste fewer kilocalories per capita per week than the reference level of respondents with primary education or lower. Finally, the composition of the household had a statistically significant impact on the level of household food waste; households with children tended to waste more kilocalories per capita per week compared with the reference value of households with children older than 18 years old. Households with no children, on the other hand, declared higher values of wasted kilocalories compared with the other typologies of households.
4. Discussion
The results from the survey conducted in the eight countries highlighted significant differences among the relationships between the declared dietary patterns adopted by respondents and the self-reported amounts of food waste generated within their households.
Across countries, Russian respondents who declared following a traditional diet were associated with producing the lowest level of food waste. Italian and Spanish households of respondents adopting traditional diets followed closely. The most wasteful traditional diets in terms of wasted calories were American and the German, closely followed by traditional Chinese, Canadian, and British dietary patterns.
In Italy, individuals adopting a traditional type of diet belonged to households which, on average, wasted less food, closely followed by those who adopted a healthy and sustainable diet. In contrast, Italian respondents who declared following vegetarian, smart, and confused diets presented the highest values of self-reported household food waste.
In Germany, respondents who declared adopting vegetarian or confused dietary patterns belonged to households that, on average, wasted less food compared with those who followed a traditional or a healthy and sustainable diet. On average, more food waste was generated in the households of respondents who declared adopting a smart diet. In China, similarly to Germany, individuals who followed a vegetarian diet belonged to households which, on average, wasted less food in comparison to those who followed a traditional diet. On average, more food waste was generated in the households of respondents following a smart diet. In the USA, Spain, and Canada, in comparison with those who followed a traditional type of diet, healthy and sustainable and confused diet followers wasted slightly less. In contrast, households of smart diet followers wasted significantly more food compared with respondents who declared different dietary habits.
In the UK, respondents following vegetarian diets were the group who declared wasting fewer calories, closely followed by Chinese and German vegetarians. Only vegetarians in Canada and the USA reported higher amounts of food waste than in Italy. Notably, the share of people following this type of diet was the lowest in all countries.
In Canada and the USA, respondents following smart diets declared the highest values of wasted calories. In the UK, Spain, Germany, and China, the self-reported level of food waste was considerably higher compared with Canada and the USA. In Italy and Russia, the differences in terms of wasted calories between smart and traditional diets were barely significant. Notably, the share of people following a smart dietary pattern was the second lowest in almost all countries.
Respondents following vegetarian diets in the UK were associated with the lowest level food waste, closely followed by Chinese and German vegetarians. Additionally, for these countries, more food waste was generated on average in the households of smart diet respondents. Consumers following a smart diet tended to waste considerably more calories than consumers following other types of dietary patterns across all countries. In particular, the largest positive difference in the quantity of wasted calories was declared by Canadian respondents, followed by consumers in the USA, Spain, and the UK adopting the same dietary habits. However, across countries, the greatest negative difference in wasted kilocalories was declared by consumers following a vegetarian diet. In particular, vegetarians from Germany declared the greatest negative difference in the amount of food wasted among all the samples, followed by vegetarians from China and from the UK. Among other dietary patterns, USA respondents declaring a confused dietary pattern were associated with a lower number of wasted kilocalories per capita per week than the reference value of Italians following a traditional diet.
In general, being a vegetarian in Germany, China, the UK, and the USA was associated with producing significantly less waste than being a vegetarian in Italy. This is possibly because in Italy, the consumption of fresh fruit and vegetables is traditionally higher than in other countries, where preserved vegetables are consumed more often. The more frequent consumption of fresh fruit and vegetables could thus generate an increase in the volume of wasted calories due to the greater perishability of this type of product, leading to more frequent disposal.
In Italy, traditional and healthy and sustainable diets were associated with the lowest self-declared amount of food waste, whereas vegetarian and smart and confused diets were associated with more food waste per capita in terms of kilocalories. Across countries, traditional Russian and Spanish traditional diets were also associated with households reporting low levels of food waste. The most wasteful traditional diets in terms of calories were American and German, closely followed by the traditional Chinese, Canadian, and British diets.
Given these differences and patterns, it is worth noting that consumers following diets associated with lower levels of declared food waste consume more raw products and less prepared/processed food than consumers following diets associated with higher levels of food waste. Additionally, the use of leftovers and overbuying were among food-related behaviors that differed the most between dietary patterns. Consumers’ habits that were considered more important in avoiding food waste were following diets correlated with lower levels of food waste, the use of shopping lists, the proper use of leftovers (e.g., freezing, using before going bad), knowledge of food stocks, and the use of food beyond expiration dates if they are still perceived as good.
Finally, the results of this study highlight that food preparation and management skills, particularly the availability of time dedicated to preparing food, have a stronger link with lower levels of food waste declared by households, when compared with the impact of motivations and attitudes. This is consistent with the most recent literature on household food waste drivers, which evidences a prominent role of time availability as a driver for reductions in food waste at the household level [
55,
56,
57,
58].
Limitations
This study was built on a consumer survey in which respondents self-reported their behavior, motivation, and amounts of food wasted. Therefore, this methodology potentially suffers from cognitive biases, such as social comparison and social desirability bias, correlated to the country. Indeed, 9% of the whole sample declared not having produced food waste in the week before the interview; this distribution was not independent across countries or age categories (chi-squared test). Although these weaknesses of surveys have been well-recognized and discussed in the literature, the CAWI method remains a solid method to explore food waste and its related behaviors [
59].
A second limitation was related to the definition of dietary patterns which, in some cases, could present some overlapping (e.g., Mediterranean and traditional diets were similar for southern European countries), due to the variety of contexts considered in this study. However, these cases were limited and did not affect the overall consistency of the results.
A final limitation derives from the fact that questions related to dietary habits were designed for an individual response, whereas self-reported measures of food waste referred to the whole household. However, because the questionnaire was compiled by individuals who were responsible, or at least partially responsible, for the management of the food in their households, it is possible to affirm that their dietary pattern could be a proxy for the main dietary pattern of the household.
5. Conclusions
Dietary patterns have rarely been studied as possible drivers of household food waste, although they could represent a valuable element of food waste reduction strategies. Building upon an original cross-country survey conducted in 2021 by Waste Watcher International, this study explored the relationship between food waste at household level and dietary habits, and their related food choices, through a cross-country comparative perspective.
Several conclusions can be drawn from this study. First, culinary traditions have a role in shaping consumption decisions, and consequently, they also impact perceived food waste production. However, traditional diets are not uniquely associated with lower or higher levels of food waste, meaning that new and emerging dietary habits are not necessarily associated with higher levels of food waste. In more detail, the results show that smart diets are frequently associated with the highest values of food waste. This was valid for all countries, although especially Canada, Spain, the UK, and the USA. Vegetarian diets were associated with lower values of food waste, being based on foods with a low density of calories, especially when compared with traditional diets in China, Germany, the UK, and the USA. This was not true for Italy, where the traditional diet, followed in most Mediterranean countries, is associated with lower self-declared amounts of food waste. Other traditional diets associated with less food waste were Russian and Spanish.
Second, lower levels of food waste were associated with types of diet which usually require more raw products, more time dedicated to food preparation, and greater kitchen skills. Indeed, a considerable difference was present between diets regarding the possible use of leftovers. In contrast, higher levels of food waste were associated with the types of diet that relied on more processed and ready-to-eat food. These types of foods are generally high in fats and sugars, and are sold in portions that might be too big for consumers and generally are difficult to reuse as leftovers. Indeed, it appears that being engaged with food consumption concerning local and seasonal products or utilizing convenience, highly processed, and ready-to-eat foods may be associated with different self-reported levels of food waste. This reinforces the concept that food waste prevention strategies have more to do with skills, time, and the management of food, especially leftovers, than motivations and attitudes.
Third, the proportion of individuals following different types of diet was fairly uneven. Countries with more respondents for traditional diets were coherent with the places that had stronger cultural food traditions, whereas confused diets were more prominent in countries with less peculiar culinary traditions. Notably, the share of the population that declared following a smart diet was approximately 2.7% of the whole sample. Consumers following this type of dietary pattern seemed to be mostly responsible for the larger share of perceived food waste generation; therefore, it could be worth developing food waste prevention interventions that target specific dietary patterns and their associated food choices.
These types of interventions could also generate positive spillover, supporting the transition towards diets that make less use of pre-packaged, ready-to-eat meals. Improving diet quality could, indeed, simultaneously reduce the environmental impact of food waste and unhealthy and unsustainable food choices.

 ,
, 


