Abstract
In order to carry out the concept of harmonious coexistence between man and nature, a multi-level national green development evaluation index system referenced to the relevant data of the provinces and a measurable model were constructed, and the green development level of each province in China was measured as an example. Meanwhile, the distribution and form characteristics and the regional differences between the green development levels of each province were estimated and analyzed through the nuclear density function and dagum Gini coefficient. The results indicate that some provinces and cities in China are concentrated at the backward level in the green development level and its sub-evaluation dimension, and a few first-line provinces and cities are developed; The largest contribution rate of regional differences is the main causation of regional differences, the comprehensive evaluation score of green development level in the whole country and the eastern region is σ-convergent, while there is no σ-convergence in the central and western region; The green development level of the whole country and the three parts of the east, central and western China is β-convergent and converges at the same steady-state level respectively.
1. Introduction
In 1989, British environmental economist David Pierce and others mentioned the term "green economy" for the first time in the Blueprint of a Green Economy, arguing that economic development must be bearable for the natural environment and human beings themselves and advocating for the first time to establish an "affordable economy" based on social and ecological conditions [1]. In 2009, the United Nations Environment Programme (UNEP) published the Global Green New Deal Policy Brief, advocating the transformation of the world economy to a green economy. UNEP (2011) published Green Economy: Developing Countries Success Stories, and Pearce (2013) put forward the concept of the green economy in Blueprint 1: for a green economy [2]. Since then, green development has become a hot topic in the international community. Many issues like carbon emissions, resource depletion, environmental pollution, and so on have profoundly affected sustainable economic development in the future. Green development will help build a modern economic system and fundamentally solve the problem of pollution. In order to reduce carbon emissions, improve the climate and air environment, as well as to protect the healthy development of people and ecology, China has incorporated carbon peaking and carbon neutrality into the overall layout of ecological civilization construction, formulated carbon peaking action plans, and carried out extensive and in-depth carbon peaking actions. At the same time, using limited environmental resources to achieve sustainable development, maintaining a balance between economic development and environmental protection, and achieving zero environmental pollution are all practical implications of green development. In October 2021, China put forward the green development concept of "promoting green development and harmonious coexistence between man and nature." President of the People’s Republic of China, Xi Jinping, has repeatedly pointed out that "man and nature are a community of life, and mankind must respect, adapt to and protect nature. He once pointed out that "The modernization we want to build is one in which man and nature coexist in harmony." Green development contributes to the building of a sustainable society in which people and nature live in harmony, from economic, resource, and health perspectives. Therefore, it is of great significance for adhering to the concept of harmonious coexistence between man and nature and establishing a multi-level national green development evaluation index system to quantitatively measure the development status quo, study the level of green development in China and analyze the development trend of each region and the reasons behind it that China and other countries can establish an ecological civilization system and promote harmonious coexistence between man and nature.
In recent years, with the continuous deepening of the world’s attention to green development and the concept of green development, the relevant research results on the measurement of green development level in the world are more and more abundant. The first is the discussion on the connotation of green development theory. Many scholars have given theoretical explanations on the connotation of green development by combining current affairs and policies and following the pace of national governance with the core concept of harmonious coexistence between man and nature. Scholars deduce theories from ecological, environmental, economic, social, policy, and other aspects. Then, they quantitatively assessed and analyzed the environmental and ecological consumption and pollution caused by economic development and daily life and found the influencing factors of green development. In this way, they can provide policy suggestions for promoting green, sustainable, and high-quality development. Han et al. (2014) extended the research to three aspects: the greening degree of economic growth, the carrying capacity of resources and the environment, and the support degree of government policies [3]. Liu et al. (2017) made an analysis from four aspects: production, life, environment, and policy [4]. Wilson et al. (1998) combined ecological development with real estate analysis to explore the feasibility of green development in the construction industry [5]. Adams et al. (2008) discussed dryland political ecology, sustainable forests, politics of preservation, river control, and Industrial and urban hazard and put forward problems and solutions from the practical level [6]. Choi (2009) studied the mechanism and solutions for the market to create barriers to green development practices from the perspective of the market [7]. Ahmad et al. (2022) and other scholars studied green productivity growth, economic globalization, and eco-innovation from three aspects and examined their combined role in achieving ecological sustainability [8].
The second is about index selection and index system construction. Scholars have constructed different green development index systems from different perspectives to comprehensively measure the level of green development. Alfsen et al. (1987) first added natural resource accounting indicators to the System of National Accounts (SNA). This provides a model for the establishment of a green economy accounting system in the future [9]. Reilly (2012) analyzed the growth potential of the green economy and proposed policies by establishing a resource and environmental, economic account [10]. Ehresman et al. (2015) pointed out that the "green development" model had gradually developed into a hot spot for countries to seek and promote economic development [11]. The Organization for Economic Cooperation and Development (2011) established an indicator system from five aspects: environment, resources, life, economy, and policy [12]. Yale University et al. (2012) launched the Global Environmental Performance Index, which is used to study environmental performance in a wide range, including 24 indicators [13]. Peng Dai (2015) referred to the China Green Development Index launched by Beijing Normal University and other departments and established a five-dimensional index evaluation system [14]. Zhou et al. (2022) analyzed the impact mechanism of green finance on green growth and constructed a comprehensive index to evaluate the green growth of the regional economy [15]. Hou et al. (2021) used the generalized method of moments (GMM) to estimate the impact of government expenditure on education and research and development on the green economic performance index of countries along the Belt and Road [16].
The third is the discussion of empirical methods. The common measurement methods mainly include principal component analysis, entropy method, DEA model, TOPSIS model, and so on. For example, Yang et al. (2016) used the principal component analysis method to study the green development level of cities in southern Shaanxi [17]. Xiong et al. (2019) used the entropy method to analyze the spatial differences in the green development level of urban agglomerations in the middle reaches of the Yangtze River [18]. Xie (2016) used the DEA model to explore green development and spatial differences in rural areas in China [19]. In addition, many scholars have also used spatial econometric methods to empirically analyze the distribution characteristics and regional differences of green development levels. For example, Huang et al. (2017) used the projection pursuit model to comprehensively analyze the spatial-temporal characteristics and heterogeneity of green development in urban clusters across China [20]. Shu et al. (2021) used the Theil index and Moran index to analyze regional differences and spatial relationships in their study on green development in Jiangxi Province [21]. Zhao et al. (2021) combined the convergence model to analyze the impact of geospatial factors on the convergence of the green development index of each province in China [22]. Luo et al. (2022) used the regional green development level evaluation (RGDLE) system model to evaluate the green development level of the five provinces and cities along the Yangtze River Economic Zone [23]. The fourth is the discussion on the scale of empirical research. Ouyang et al. (2009) measured the level of green development in 286 prefecture-level cities in China and found significant differences between large-scale cities, such as municipalities or provincial cities, and some of the remaining small-scale cities similar to those located in the northwest [24]. Chen and Zhang (2021) studied the Yangtze River Economic Belt as the object. As a result, she found that the improvement of coordination degree plays a key role in alleviating the imbalance of green development [25]. Dhar et al. (2022) studied 212 listed companies in Bangladesh and found that the quality of social responsibility information disclosure could positively adjust the relationship between the sustainable development capacity of heavily polluting enterprises. This will help boost its green development [26]. Ahmed et al. (2022) studied Japan’s public R&D investment in nuclear and renewable energy development and economic growth during the period from 1974 to 2017 and proved that economic growth in Japan would trigger higher carbon dioxide emissions, which is not conducive to green development [27].
To sum up, although many scholars have conducted rich research on the connotation and level of green development, there are still some problems with the continuous expansion and deepening of research. First, in view of the theoretical connotation of green development, most of the existing literature has improved the research scope and research methods, and the research on the concept connotation of the selection of research indicators is not thorough enough. Some literature even ignores the importance of theory. Second, in terms of the indicator system, some literature ignores the international consensus on the harmonious coexistence between man and nature in the construction of the indicator system. The index system has no index to reflect its meaning, and the construction of the existing index system is not unified. Third, in terms of research methods, most of the existing studies adopt traditional linear weighted comprehensive evaluation or measurement methods. There is a lack of comprehensive analysis on the distribution form, difference, and convergence of green development levels.
Based on the shortcomings of the existing research, this paper first takes the harmonious coexistence between man and nature as the core concept to construct the multi-level national green development evaluation index system. Secondly, this paper uses the entropy weight method to calculate the index weight and constructs the measurement model of China’s green development level to measure the green development level of each province. Then, the non-parametric statistical method, dagum Gini coefficient, and convergence model are used to analyze the distribution pattern, regional difference, and convergence of green development level among regions in detail. Then, the non-parametric statistical method, dagum Gini coefficient, and convergence model are used to analyze the distribution pattern, regional difference, and convergence of green development level among regions in detail. Finally, based on the comprehensive analysis of the measurement of green development in China’s provinces, the paper identifies the main factors affecting green development. This paper also puts forward relevant policy suggestions to promote the high-quality and sustainable development of China’s green development level under the concept of harmonious coexistence between man and nature.
2. Index System and Research Method
2.1. Construction of Index System
Based on the previous literature, this paper takes the concept of harmonious coexistence between man and nature as concept, and constructs the multi-level national green development evaluation index system from the six dimensions of green ecology, green production, green life, green culture, green economy, and green policy. This system reflects the development of the interaction between man and nature. According to the principle of easy availability, scientific and comprehensive data, 17 secondary indicators, including resource utilization, economic development level, green housing, business support, economic efficiency, and policy support, are set up. These indicators include green space area, per capita GDP growth rate, harmless disposal rate of municipal solid waste, R&D investment intensity, per capita local fiscal revenue, per capita afforestation area, and a total of 29 evaluation indicators, of which 23 are positive indicators, and 6 are negative indicators. The specific index system is shown in Table 1.

Table 1.
Evaluation index system of comprehensive green development level.
2.2. Measurement Model
2.2.1. Standardized Score
Since the units of data are different, the data should be dimensionless before data analysis. The specific formula is as follows:
where .
In this formula, is the original three-level index data value of the th index in the th province, then . is the data value after standardized processing. are the maximum and minimum values of the th index in the original third-level index data values, respectively. If the index is positive, Formula (1) is selected for standardization. If the index is negative, Formula (2) is selected for standardization.
2.2.2. Entropy Weight Method
On the basis of eliminating the dimensional influence, this paper chooses the entropy weight method as the weighting method. The entropy weight method weights each index by the abundance of information represented by its entropy value. The smaller the entropy value is, the greater the dispersion of the index is, and the greater its influence on the comprehensive evaluation results is, that is, the greater the weight it occupies. The specific process is as follows:
Calculate the proportion of each index in each province
Calculate the entropy value of each index
where .
Calculate the weight of each index
2.2.3. Comprehensive Evaluation Model
According to the standardized scores and weights of each evaluation index, the measurement model of green development level in each region is constructed as follows:
2.3. Nuclear Density Estimation
Nuclear density estimation is a non-parametric test method, which starts from the data and fits the sample with a smooth curve, analyzes the distribution characteristics of the sample, and estimates the density function of the random variable. This method has fewer restrictions on functions and variables and retains the original data information well. This method has no requirement on the Markov property in the process, and its dependence on the model is weak and stable, so it has a wide range of applications. The basic principles are as follows:
Let the random variables is independently and identically distributed, and its probability density function is and is unknown, then
where is the number of sample observations; is bandwidth; K is the nuclear function, which is an implicit smooth transition function. The following conditions shall be met:
Nuclear functions mainly include Gaussian nuclear density, uniform nuclear density, triangular nuclear density, etc. Gaussian nuclear density is selected in this paper, and the expression is as follows:
2.4. Dagum Gini Coefficient
The Dagum Gini coefficient [28] is one of the measurement methods for regional differences in green development levels, which is used to analyze regional differences. Other methods include the Theil index, coefficient of polar variation, coefficient of logarithmic variation, Eikenson index, etc. The decomposition of the dagum Gini coefficient by subgroups can analyze regional differences and study the sources of differences at the same time, so it has a wide range of applications. Its definition is as follows:
In the formula, n is the number of provinces in the sample, then ; is the number of regions divided. This paper is divided into three parts: east, middle and west, then ; j and h are the different regions in the divided region; nj and nh are the number of provinces included in region I and r, respectively; is the comprehensive score of the green development level of the th province in region j; yhr is the comprehensive score of the green development level of the rth province in region ; is the mean value of the comprehensive score of the green development level of each province.
According to the dagum Gini coefficient decomposition method by subgroup, the overall Gini coefficient is decomposed into three parts: is the contribution of the gap within the region, is the contribution of the gap between the regions, and is the contribution of the hypervariable density. The specific formula is as follows:
where ;; .
is the Gini coefficient in region ; represents the Gini coefficient between region and region ; is the mean value of the comprehensive score of green development level in region ; ; is the relative influence of green development level between region and region ; is the difference in the comprehensive score of green development level among regions; are the cumulative density distribution functions of area and area , respectively.
2.5. Convergence Model
The convergence model is used to analyze the evolution trend of the green development level of all provinces and cities in China as a whole and in different regions, including σ convergence, absolute β convergence, conditional β convergence, and so on.
2.5.1. σ Convergence
σ convergence refers to the trend that the differences in green development levels of various provinces and cities gradually tend to shrink over time. Its test method is mainly based on the indicators reflecting its dispersion degrees, such as range, standard deviation, and coefficient of variation. This paper selects the coefficient of variation CV as the relevant index [29]. The specific formula is as follows:
In this formula, is the comprehensive score value of the green development level of the th province and city in a certain year; is the mean value of the comprehensive score of green development level of all provinces and cities in the whole country or a certain region in that year; is the total number of provinces and cities in the whole country or in a certain region. If the desired value shows a trend of gradual decline over time, there is β convergence in the green development level of all provinces and cities in the whole country or a certain region; Conversely, there is no σ convergence.
2.5.2. Absolute β-Convergence
σ convergence only examines the convergence trend of the gap in green development levels among provinces and cities but cannot describe its convergence characteristics and speed. This calls for the use of β convergence. β convergence can be divided into two types: absolute β convergence and conditional β convergence. The absolute β-convergence means that the green development level of all provinces and cities converges to the same steady-state level, while the conditional β-convergence means that the green development level of all provinces and cities converges to their own steady-state level.
When referring to the research in [30], the specific expression of absolute β-convergence is set as follows:
In this formula, and are the comprehensive scores of the green development level of the th province and city in period T + t and period t, respectively; is the time span, are the intercept term and convergence coefficient, respectively; is the random disturbance term. In this paper, is set to make the sample data continuous and maximize utilization. If is significantly less than zero, it indicates that there is absolute convergence in the green development level of all provinces and cities. Otherwise, it does not converge. Further, the following formula can be obtained:
In this equation, is the rate of convergence, and the expression is .
2.5.3. Conditional β Convergence
Conditional β convergence is to relax the conditions and introduce relevant control variables on the basis of absolute β convergence to reflect the characteristics of each region, thus forming the conditional β convergence model [31], which is as follows:
In this formula, is the selected control variable; are the convergence coefficients and the coefficients of the control variables, respectively; The meanings of are the same as above. If is significantly less than zero, conditional β-convergence exists. The converse does not exist.
3. Empirical Analysis
3.1. Data Selection
This paper presents the relevant data from all provinces in China (except Tibet) from 2010 to 2019 as the research object. The data sources are China Statistical Yearbooks, statistical yearbooks of various provinces, China Statistical Yearbooks of Urban Construction, China Statistical Yearbooks of Environment, China Statistical Yearbooks of Energy, China Statistical Yearbooks of Tertiary Industry, China Agricultural Yearbooks, China Statistical Yearbooks of Science and Technology and the website of China National Bureau of Statistics.
3.2. Comprehensive Evaluation Results and Analysis
According to the green development measurement model (6), the comprehensive scores of the green development levels of each province in China from 2010 to 2019 can be obtained, as shown in Table 2. It can be seen from Table 2 that the top three provinces and cities in China’s green development level are Beijing, Shanghai, and Guangdong, and the bottom three are Ningxia, Xinjiang, and Gansu. It can be seen that the level of green development of provinces and cities is closely related to their economic development degree. First-tier developed cities such as Beijing, Shanghai, and Guangzhou also lead the country in green development, while the relatively backward western regions such as Ningxia also have unsatisfactory green development levels. Scores for the top four provinces and cities lie far above in the past decade. The difference between the fourth place Jiangsu and the next place, Zhejiang, is 0.085, which is the largest. From Fujian, ranked eighth, the gap in the comprehensive scores of the provinces below is obviously smaller, and the arrangement is relatively dense. In particular, the difference between Guizhou ranked 27th, and the latter is only 0.0006, which is the smallest. It can be seen that the level of green development in China’s provinces shows that a small number of top provinces and cities have a very high level, while the level of the bottom half of the provinces continues to decline. In the past ten years, most provinces and cities have shown a trend of ups and downs. Among them, Hunan and Hebei have an obvious upward trend, Jiangsu, Chongqing, and Ningxia have a continuous downward trend, and Inner Mongolia and Jiangxi have a relatively stable trend.
Table 2.
A comprehensive score of the green development level of each province.
In order to study whether each province has a significant effect on the overall green development level score, an analysis of variance (ANOVA) can be conducted, and the prerequisite for ANOVA is to pass the homogeneity test of variance to determine whether the overall variance of the overall green development level score of each province in different years is equal, Table 3 shows the homogeneity test of variance. It can be seen from Table 3 that it can be seen that the p-value is 0, indicating that there is a significant difference in the overall variance and there is no need to continue with the ANOVA.
Table 3.
Homogeneity test of variance.
3.3. Measurement of Each Subsystem
3.3.1. Measurement of Green Ecological Level
According to the measurement model (6), the measurement results of the green ecological level of the subsystem can be obtained, as shown in Table 4. It can be seen from Table 4 that the top three provinces and cities are Guangdong, Qinghai, and Guangxi, and the last three are Gansu, Tianjin, and Ningxia. Moreover, there is a large distance between the top two green ecological levels and the following provinces, and the levels of the middle provinces are concentrated, with a small gap. There is also a big gap between Ningxia, which ranks last, and Tianjin, which is far lower than the national level and outside the other provinces and cities. However, Guangdong, leading the country, has had a downward trend in recent years, although the situation is relatively stable. The level of intermediate provinces and cities mostly fluctuates. The last few provinces and cities maintain a relatively stable trend and continue to develop at a low level.
Table 4.
Green ecological level of each province and city.
3.3.2. Measurement of Green Production Level
According to the measurement model (6), the measurement results of the green production level of the subsystem can be obtained, as shown in Table 5.
Table 5.
Green production levels of each province and city.
It can be seen from Table 5 that the top three provinces and cities are Beijing, Shanghai, and Chongqing, and the last three are Inner Mongolia, Hebei, and Qinghai. There is a large gap between Beijing and Shanghai, as provincial capitals and economic development centers, and other provinces and cities. The gap between the production levels of provinces and cities in the middle class is small, and the minimum gap is only 0.0001. However, as the last place, Qinghai has the largest gap between its production level and the previous one, which is 0.021, with a stable trend, and it has often remained in the last place in recent years.
3.3.3. Measurement of Green Living Standards
The results of the green living standard measure are shown in Table 6. It can be seen from Table 6 that the top three provinces and cities are Beijing, Shandong, and Shaanxi, and the bottom three are Guangdong, Guangxi, and Shanghai. The level of all provinces and cities is relatively close. The gap between Beijing, the first place, and Shanghai, the last place, is only 0.0306, while the gap between Jiangxi, Inner Mongolia, and Anhui is almost zero. The gap is also similar in Guangxi, Shanghai. It can be seen that people’s awareness and behavior of green life are relatively unified, and they can well uphold the concept of environmental protection, green and harmonious coexistence in daily life.
Table 6.
Green living standards of each province and city.
3.3.4. Measurement of Green Culture Level
The measurement results of the green culture level are shown in Table 7. It can be seen from Table 7 that the top three provinces and cities are Beijing, Shanghai, and Jiangsu, and the bottom three are Qinghai, Yunnan, and Guizhou. The gap between Beijing and Shanghai and the other provinces and cities is relatively large, especially the gap between Shanghai and the next one, Jiangsu, which is 0.0336, reaching the largest. Then, the level of provinces and cities in the first half gradually declines until the distance between provinces and cities in the second half becomes smaller and smaller, especially since the gap between Inner Mongolia and Ningxia is approximately zero. When it falls to the last three, the gap between the cultural levels of provinces and cities widens again, and the trend of Yunnan and Guizhou in the past decade is very gentle, far lower than the national average level.
Table 7.
Level of the green culture of each province and city.
3.3.5. Measurement of Green Economy Level
The measurement results of the green economy level are shown in Table 8. It can be seen from Table 8 that the top three provinces and cities are Guangdong, Jiangsu, and Shanghai, and Beijing is in fourth place, which is similar to the top provinces and cities in terms of comprehensive score. The last three are Guizhou, Qinghai, and Gansu. The economic level of the top provinces and cities has gradually declined, and the gap between them is obvious. After that, the level gap between provinces and cities gradually Narrows, and some provinces and cities are concentrated in the backward position, including many provinces and cities in western China.
Table 8.
Level of green economy of each province and city.
3.3.6. Measurement of Green Policy Level
The measurement results of the green policy level are shown in Table 9. It can be seen from Table 9 that the top three provinces and cities are Beijing, Shanghai, and Tianjin, and the bottom three are Guangdong, Zhejiang, and Anhui. The gap between Beijing and Shanghai and other provinces and cities is relatively large, which shows the strength of their policies. Beijing is in a stable state as a whole, while Shanghai and Tianjin have violent fluctuations. Inner Mongolia shows a slow downward trend, and the provinces and cities in the bottom half of the ranking are concentrated and stable at the backward level.
Table 9.
Level of green policies of each province and city.
4. Difference Analysis
4.1. Nuclear Density Estimation
This paper uses nuclear density estimation to analyze the spatiotemporal dynamic changes in green development levels in China’s provinces and cities. Figure 1 shows the nuclear density estimation of the green development level measurement values of all provinces and cities in China from 2010 to 2019. It can be seen from Figure 1 that the central position of the nuclear density function of the green development level of all provinces and cities in the past ten years is relatively stable, basically maintaining around 0.2. From the perspective of distribution, the peak of nuclear density function fluctuates during the ten years. This value reached the maximum value is 2016, and the minimum value is 2019, indicating that the gap between the green development levels of all provinces and cities has been reduced. From the perspective of distribution extensibility, the nuclear density curve of green development level in the past ten years presents a right-tailed situation, and the right-tailed part gradually tends to be smooth and trends to the middle value, which shows that the distribution of green development level in all provinces and cities is developing in the direction of equilibrium and unification. In terms of the number of peaks, the number of peaks of the nuclear density function increases first and then decreases, indicating that the multi-polar differentiation of the green development level of all provinces and cities has improved, and the main and side peaks coexist, with the main peak high and the side peak low, indicating that there may be gradient development.
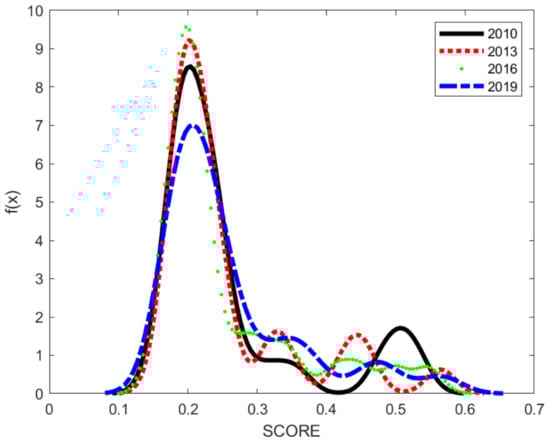
Figure 1.
Nuclear density estimation of green development level from 2010 to 2019.
4.2. Gini Coefficient
Due to the great differences in many factors between the eastern, middle, and western regions of China, the provinces are divided according to the three parts of the eastern, middle, and western regions to discuss the differences and sources of green development levels among the three regions. The comprehensive evaluation of the green development levels of the three regions after classification is shown in Table 10.
Table 10.
Comprehensive scores of green development levels of provinces and cities in the three regions of eastern, central, and western China.
As shown in Table 11, the specific decomposition can be obtained by using the dagum Gini coefficient decomposition. For the overall Gini coefficient, in the past ten years, it showed a W-shaped trend of first falling and then rising, and then falling and then rising. Generally speaking, it is lower than before, which shows that the gap in green development levels among different regions is gradually narrowing. The two increases occurred in 2014 and 2019, near the end of China’s 12th Five-Year Plan and 13th Five-Year Plan. It can be seen that the intensity of policy implementation is different among provinces and cities, resulting in greater regional differences in their green development levels. The central idea of green development is much the same. Therefore, after the initial difference increases, the provinces and cities tend to be balanced again.
Table 11.
Decomposition of regional differences in green development levels from 2010 to 2019.
As for the intra-regional Gini coefficient, it can be seen from Figure 2 that the variation trends of intra-regional differences in the eastern, central, and western regions are relatively stable. In general, the difference within the eastern region is the largest and shows a gradual downward trend. The difference in the central region is the smallest and shows a gradual upward trend. The western region is in a stable state. Specifically, although the difference in the eastern region is decreasing year by year, it is relatively large compared with the other two regions, and it is higher than the other two regions in the past ten years. Although the difference in the central region increases year by year, it is still smaller than that in the other two regions, and it is at the bottom in the ten years. The difference in the western region has little change and basically remains at a horizontal line.
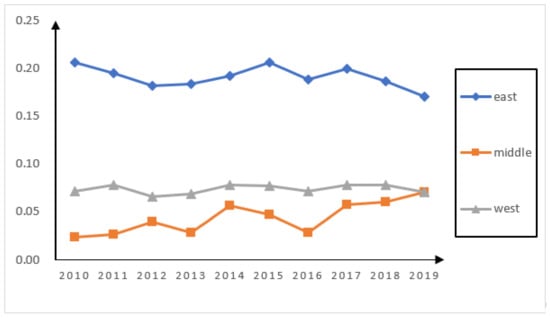
Figure 2.
Differences within provinces and cities.
The differences between regions are shown in Figure 3, showing that the differences between the eastern-middle regions and eastern-western regions are large, while the differences between the middle-western regions are small. More specifically, the eastern-middle regions showed a trend of first falling and then rising, and then falling and rising again. On the whole, it is still declining. In 2010–2013 and 2015, its Gini coefficient was the largest. The eastern-western regions showed a trend of first rising, then falling, and then rising, with the highest value in 2016. In 2014 and from 2016 to 2019, its Gini coefficient was the largest. The middle-western regions show a relatively stable trend, and their Gini coefficients are the smallest among regions in the past ten years, always at the bottom.
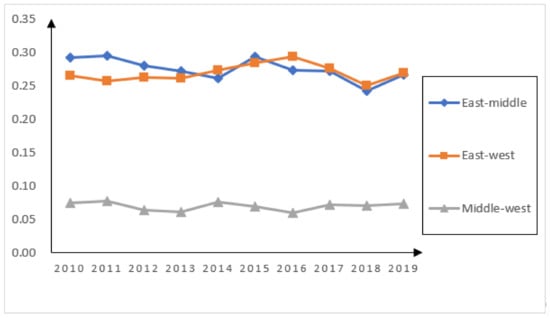
Figure 3.
Differences between provinces, cities, and regions.
The contribution rate and its composition of regional differences are shown in Figure 4. In general, the contribution rate of inter-regional difference is the largest, mostly about 70%, followed by the contribution rate of intra-regional difference, and the contribution rate of hypervariable density is only about 7%. It can be seen that the difference between regions is the main source of the difference, while the overlap between regions is relatively weak. Specifically, the three contribution rates all show a relatively stable trend of change. It can be seen that no matter for a single region, between two regions, or the overlapping parts between regions, its green development level is relatively stable.

Figure 4.
Contribution rates and their composition of regional differences in all provinces and cities.
5. Convergence Analysis
5.1. Sigma Convergence
The σ convergence of green development levels in the whole country and the eastern, middle, and western regions in the past ten years is shown in Figure 5. Generally speaking, in the past ten years, the coefficient of variation of the comprehensive score of green development level in the whole country and the eastern region of China has been gradually declining. The coefficient in the central region fluctuates. The coefficient in the western region shows a gradual upward trend. Specifically, in 2014–2015 and 2017, the coefficient of variation of the comprehensive score of green development level in the national region and the eastern region showed a small recovery, and in other years, it gradually declined, showing σ-convergence on the whole. The coefficient of variation of the comprehensive score of green development level in the central region gradually decreased from 2011 to 2014 and showed cyclical ups and downs from 2014 to 2019. In addition, the coefficient of variation of the comprehensive score of green development level in the western region only decreased slightly from 2014–2015 and 2016–2018 and increased in other years. Therefore, there is no σ convergence in the central and western regions.
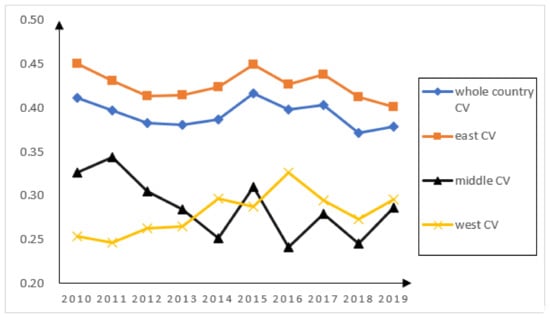
Figure 5.
σ-convergence of the comprehensive score of the green development level of each region.
5.2. Absolute β-Convergence
The absolute β convergence test of the comprehensive score of green development level in each region is shown in Table 12. In general, the absolute β convergence test of the comprehensive score of green development level in the whole country and the eastern, central, and western regions is significant. Specifically, the convergence coefficient β of the comprehensive score in the whole country and the eastern, central, and western regions is significantly less than zero at the level of 1%.
Table 12.
Absolute β-convergence test of the comprehensive score of green development level in each region.
This shows that the growing gap of the comprehensive score of green development level among provinces and cities in each region shows a gradual downward trend, and there is absolute β convergence. For the convergence rate, the western region is the fastest, and the central region is the slowest.
5.3. Conditional β Convergence
In this paper, five control variables are selected to test the conditional β-convergence. The details are as follows: the ratio of local fiscal expenditure to GDP represents government intervention (gov); the ratio of the added value of the secondary industry to GDP is used to represent the industrial structure (indu); the ratio of the number of employees in urban units to the total population of the region is used to represent human capital (huca); urban water penetration rate represents infrastructure (infr); environmental regulation (envi) is represented by the volume of household garbage collected.
The results of the conditional β-convergence test are shown in Table 13. It can be seen from Table 13 that the convergence coefficient β of the test in the whole country and the eastern, central, and western regions are significantly negative at the level of 1%. It can be seen that the comprehensive scores of green development levels of all provinces and cities in the region are converging to their respective steady states. As for the influencing factors of convergence, the influence of industrial structure on its green development level is significantly greater than zero at the level of 5% nationwide, which shows that industrial structure has a positive role in promoting the growth of the national green development level. Some existing results may be considered that the industrial structure cannot directly influence green development but through some intervening variables such as governmental policies or public knowledge. In this paper, we just assume that the industrial structure’s direct effect and the measured index system have involved the policies and cultures, and so on. Moreover, the remaining factors are not significant, and the coefficients are all negative, indicating that the remaining factors do not promote the growth of the national green development level. In the eastern, middle, and western regions, the tested coefficient of government intervention in the eastern region is significantly greater than zero at the level of 5%. The test coefficient of infrastructure in the eastern region is significantly less than zero at the level of 1%. The test coefficient of industrial structure in the central region is significantly greater than zero at the level of 5%. The test coefficient of government intervention in the western region is significantly less than zero at the level of 5%. This shows that government intervention has a positive role in promoting the growth of green development levels in the eastern region. Infrastructure has a negative inhibitory effect on the growth of green development levels in the eastern region. Industrial structure plays a positive role in promoting the growth of green development levels in the central region. Government intervention has a negative inhibitory effect on the growth of green development levels in the western region. It can be seen that the implementation of some measures should be moderate, otherwise, it may lead to reverse results.
Table 13.
Conditional β-convergence test of the comprehensive score of green development level in each region.
Therefore, this paper constructs a diversified system of indicators to measure the level of green development in China from multiple perspectives, comprehensively measuring the level of green development in various provinces and cities as well as the spatial differences between regions, effectively expanding the range of green development indicators to support the subsequent strategy optimization. As the level of green development is based on a system of indicators, future research can be based on the weighting method of the indicator system and the criteria for the selection of indicators.
6. Conclusions and Suggestions
This paper comprehensively measured the green development level of China’s provinces and cities from six dimensions: ecology, production, life, culture, economy, and policy. This paper also analyzed the distribution pattern, regional difference, and convergence of green development in each province and city by using nuclear density estimation, the Gini coefficient, and the convergence model. Based on the empirical results, the following conclusions are drawn.
1. A few first-tier provinces and cities are very developed, but most provinces and cities are relatively backward. The provinces and cities in the bottom half are concentrated at a small level and lag behind the national average level. From the nuclear density curves, the central position of the nuclear density function of the green development level of all provinces and cities is relatively stable. The peak value shows a trend of fluctuation, and the curve shows a right tailing situation, and the right tailing part of the curve gradually tends to be smooth. This indicates that the multipolarity in the level of green development among provinces and municipalities has improved, in line with the conclusions obtained by Hu et al. (2022) [32].
2. The gap between the green development levels in the eastern, middle, and western regions has gradually decreased according to the dagum Gini coefficient; The variation trend of intra-regional differences is relatively stable. This is consistent with the findings of Zhang et al. (2020) [33]. The intra-regional difference is the largest in the eastern region and the smallest in the middle region. The inter-regional differences in the eastern-middle regions and the inter-regional differences in the eastern-western regions are both large, while the inter-regional differences in the middle-western regions are small. The contribution rate of inter-regional difference is the largest, which is the main source of difference, followed by the contribution rate of intra-regional difference, and the contribution rate of hypervariable density is the smallest. The overlap between regions is relatively weak.
3. As for the convergence analysis, the coefficient of variation of the comprehensive score of the green development level of the national region and the eastern region converges, and the difference in the green development level of all provinces and cities in the region gradually trends to shrink with the passage of time. However, there is no convergence in the central and western regions. No matter for absolute β convergence or conditional β convergence, the convergence coefficient of the green development level test in the whole country and the eastern, central, and western regions is significantly less than zero. The same convergence conclusion was obtained by Li et al. (2022) and Deng et al. (2020) [34,35].
Therefore, this paper puts forward the following policy suggestions to promote green development:
First, the government should focus on most provinces and cities with backward green development levels so that most backward provinces and cities can have the impetus for progress. Government should improve the green development level of backward provinces and cities from various aspects. Ecologically, it maintains the attitude that " Green mountains and clear water are equal to mountains of gold and silver," strengthens environmental protection efforts, and provides advanced environmental protection methods and concepts for backward provinces and cities. In terms of production, the government can combine local advantages to speed up the transformation of local production in backward provinces and cities, promote the industrialization and upgrading of green production, and promote the application of environmental protection and clean new energy. In terms of life, the government can strengthen the construction of basic environmental protection facilities, adhere to garbage classification and green travel, deepen the awareness of environmental protection in every bit of people’s daily life, and deeply implement the concept of harmonious coexistence between man and nature. In terms of culture, the government can strengthen the publicity and popularization of green environmental protection, carry out popular science lectures on new energy and new development, strengthen the scientific research and development of emerging industries and new energy, and provide tax incentives and other measures to encourage enterprises to carry out scientific research and innovation. In terms of economy, the government should maintain the current level of development, protect the ecological environment while promoting the economic development of backward provinces and cities, and resolutely cannot exchange economic development at the cost of the environment. In terms of policy, local governments should take measures according to local conditions, rationally combine local characteristics and national policy concepts to formulate development plans suitable for local areas and build a comprehensive and comprehensive green development level system.
Second, promote the level of green development in China’s provinces and prevent the rise of multi-polarization development. Local governments should strengthen local green construction and promote green economic development. In this way, the peak of the nuclear density estimation function of the green development level of each province and city can be shifted to the right so as to realize the improvement of its green development level. Local governments also need to follow the relevant policies issued by the central government and keep up with the national pace. At the same time, local governments should also clarify the development concept of ecological civilization, promote the construction of ecological civilization, develop low-carbon, efficient and sustainable green industries, and coordinate the relationship between the environment and economy. So that all provinces and cities to improve the level of green development of the road.
Third, open sharing between provinces and cities should be carried out to reduce regional differences caused by regional differences. While developing themselves, all provinces and cities open up and share with other provinces and cities. All provinces and cities should reasonably learn the innovation and uniqueness of other provinces and cities and integrate and apply them according to their own conditions. At the same time, provinces and cities with advantages in green development can share their development advantages with provinces and cities in need so as to promote the common progress and development of other provinces and cities. By repeating the above process infinitely, all provinces and cities can finally achieve the goal of common development at a balanced level and advance hand in hand. All provinces and cities can also establish a national unified and coordinated comprehensive green development platform to promote the progress of the national green development level and move forward to the principle of harmonious coexistence between man and nature.
The limitations of the study are as follows. First, due to the limitations of data and space, we can only measure the green development level of each province and city in China and analyze the distribution characteristics and differences in each region. Future research could explore whether green development level in developed countries has different distribution characteristics and differences than in China. Second, some impact mechanisms on economics, carbon emissions, and other aspects should be considered to better achieve sustainable development on the basis of harmonious coexistence between man and nature.
Author Contributions
Conceptualization, X.Z. and Z.Z.; methodology, S.J. and J.H.; investigation, X.Z. and S.J.; formal analysis, X.Z. and J.H.; writing—original draft preparation, S.J. and Z.Z.; writing—review and editing, X.Z. and S.J.; supervision, S.J., Z.Z. and X.Z. All authors have read and agreed to the published version of the manuscript.
Funding
This research was supported by the National Natural Science Foundation of China [grant number 12126333], the Social Science Foundation of Liaoning province [grant No. L22BTJ001, L22BGL003].
Institutional Review Board Statement
Not applicable.
Informed Consent Statement
Not applicable.
Data Availability Statement
Not applicable.
Acknowledgments
We gratefully acknowledge the anonymous reviewers for their insightful comments on and suggestions for this paper.
Conflicts of Interest
The authors declare no conflict of interest.
References
- Pierce, D. A Blueprint for Green Economy; Beijing Normal University Publishing House: Beijing, China, 1996. [Google Scholar]
- Pearce, D.; Markandya, A.; Barbier, E. Blueprint 1: For a Green Economy; Routledge Publishing House: Abingdon, UK, 2013. [Google Scholar]
- Han, M.; Li, J.; Tai, P. Evaluation of green development level and analysis of regional differences in Shan-dong Province. J. Qufu Norm. Univ. 2014, 2, 95–100. [Google Scholar]
- Liu, M. Measurement and spatial evolution of provincial green development levels in China. J. South China Norm. Univ. Soc. Sci. Ed. 2017, 3, 37–44. [Google Scholar]
- Wilson, A.; Uncapher, J.L.; McManigal, L.; Lovins, L.H.; Cureton, M.; Browning, W.D. Green Development: Integrating Ecology and Real Estate; John Wiley & Sons, Inc.: New York, NY, USA, 1998. [Google Scholar]
- Adams, W.M.; Mark, W. Green Development: Environment and Sustainability in a Developing World; Routledge Publishing House: Abingdon, UK, 2020. [Google Scholar]
- Choi, C. Removing market barriers to green development: Principles and action projects to promote widespread adoption of green development practices. J. Sustain. Real Estate 2009, 1, 107–138. [Google Scholar] [CrossRef]
- Ahmad, M.; Wu, Y. Combined role of green productivity growth, economic globalization, and eco-innovation in achieving ecological sustainability for OECD economies. J. Environ. Manag. 2022, 302, 113980. [Google Scholar] [CrossRef] [PubMed]
- Alfsen, K.H.; Bye, T.; Lorentsen, L. Natural Resource Accounting and Analysis: The Norwegian Experience 1978–1986; Statistic Sentralbyra: Oslo, Norway, 1987. [Google Scholar]
- Reilly, J.M. Green growth and the efficient use of natural resource. Energy Econ. 2012, 34, 85–93. [Google Scholar] [CrossRef]
- Ehresman, T.G.; Okereke, C. Environmental justice and conceptions of the green economy. Int. Environ. Agreem. Politics Law Econ. 2015, 15, 13–27. [Google Scholar] [CrossRef]
- OECD. Towards Green Growth: Monitoring Progress: OECD Indicator; OECD: Paris, France, 2011. [Google Scholar]
- Yale Center for Environmental Law and Policy. EPI 2012: Environmental Performance Index and Pilot Trend Environmental Performance Index; NASA Socioeconomic Data and Applications Center (SEDAC): New York, NY, USA, 2012. [Google Scholar]
- Dai, P. Study on the evaluation system of green development level in Qinghai Province. Qinghai Soc. Sci. 2015, 3, 170–177. [Google Scholar]
- Zhou, G.; Zhu, J.; Luo, S. The impact of fintech innovation on green growth in China: Mediating effect of green finance. Ecol. Econ. 2022, 193, 107308. [Google Scholar] [CrossRef]
- Yumei, H.; Iqbal, W.; Irfan, M.; Fatima, A. The dynamics of public spending on sustainable green economy: Role of techno-logical innovation and industrial structure effects. Environ. Sci. Pollut. Res. 2022, 29, 22970–22988. [Google Scholar] [CrossRef]
- Yang, G.; Zhang, Y.; Song, M. The measurement and comprehensive evaluation of urban green development level in southern Shaanxi. J. Shaanxi Univ. Technol. Nat. Sci. 2016, 2, 87–92. [Google Scholar]
- Xiong, X.; Zhang, T.; Duan, Y.; Fang, X.; Zhou, J. Measurement and difference of green development level of urban agglom-erations in the middle reaches of the Yangtze River. Econ. Geogr. 2019, 12, 96–102. [Google Scholar]
- Xie, L.; Wang, J. Spatial differences in rural green development performance in China. Chin. J. Popul. Resour. Environ. 2016, 26, 20–26. [Google Scholar]
- Huang, Y.; Li, L. Comprehensive measurement and spatio-temporal evolution of green development level of urban agglomerations in China. Geogr. Res. 2017, 36, 1309–1322. [Google Scholar]
- Su, C.; Zhu, P.; Xu, B. Green development level measurement and spatial differentiation analysis in Jiangxi Province. Econ. Geogr. 2021, 6, 180–186. [Google Scholar]
- Zhao, J.; Yang, W.; Zhao, B.; Zhao, B.; Zhang, Y. The impact of geospatial factors on the convergence of China’s green development index. Stat. Obs. 2021, 12, 78–81. [Google Scholar]
- Luo, S.; Liu, J. An innovative index system and HFFS-MULTIMOORA method based group decision-making framework for regional green development level evaluation. Expert Syst. Appl. 2022, 189, 116090. [Google Scholar] [CrossRef]
- Ouyang, Z.; Zhao, J. Green development evaluation of Chinese cities. Chin. J. Popul. Resour. Environ. 2009, 19, 11–15. [Google Scholar]
- Chen, F.; Zhang, S. Unbalanced green development in the Yangtze River Economic Belt: Conceptual framework and assessment. Manag. Decis. 2021, 12, 161–165. [Google Scholar]
- Dhar, B.K.; Sarkar, S.M.; Ayittey, F.K. Impact of social responsibility disclosure between implementation of green accounting and sustainable development: A study on heavily polluting companies in Bangladesh. Corp. Soc. Responsib. Environ. Manag. 2022, 29, 71–78. [Google Scholar] [CrossRef]
- Ahmed, Z.; Cary, M.; Ali, S.; Murshed, M.; Ullah, H.; Mahmood, H. Moving toward a green revolution in Japan: Symmetric and asymmetric relationships among clean energy technology development investments, economic growth, and CO2 emissions. Energy Environ. 2022, 33, 1417–1440. [Google Scholar] [CrossRef]
- Dagum, C. A new decomposition of the Gini income inequality ratio. Empir. Econ. 1997, 22, 515–531. [Google Scholar] [CrossRef]
- Rezitis, A.N. Agricultural Productivity and Convergence: Europe and the United States. Appl. Econ. 2010, 42, 1029–1044. [Google Scholar] [CrossRef]
- Peng, G. Regional income gap, total factor productivity and convergence analysis in China. Econ. Res. J. 2005, 9, 19–29. [Google Scholar]
- Barro, R.J.; Martin, X.S.I. Convergence. J. Political Econ. 1992, 100, 223–251. [Google Scholar] [CrossRef]
- Hu, S.; Huang, T.; Wang, K. Coordinated development of digital economy and green economy: Spatial-temporal differentiation, dynamic evolution and convergence characteristics. Mod. Financ. Econ. J. Tianjin Univ. Financ. Econ. 2022, 42, 3–19. [Google Scholar]
- Zhang, H.; Geng, Z.; Yin, R.; Zhang, W. Regional differences and convergence tendency of green development competitiveness in China. J. Clean. Prod. 2020, 254, 119922. [Google Scholar] [CrossRef]
- Li, C.; Song, L. Regional Differences and Spatial Convergence of Green Development in China. Sustainability 2022, 14, 8511. [Google Scholar] [CrossRef]
- Deng, R.; He, R.; Chen, Z.; Zhu, F. Research on ecological civilization, regional differences and convergence of development in China’s eight comprehensive economic zones. Quant. Tech. Econ. Res. 2020, 37, 3–25. [Google Scholar]
Disclaimer/Publisher’s Note: The statements, opinions and data contained in all publications are solely those of the individual author(s) and contributor(s) and not of MDPI and/or the editor(s). MDPI and/or the editor(s) disclaim responsibility for any injury to people or property resulting from any ideas, methods, instructions or products referred to in the content. |
© 2022 by the authors. Licensee MDPI, Basel, Switzerland. This article is an open access article distributed under the terms and conditions of the Creative Commons Attribution (CC BY) license (https://creativecommons.org/licenses/by/4.0/).