Parks, Green Space, and Happiness: A Spatially Specific Sentiment Analysis Using Microblogs in Shanghai, China
Abstract
1. Introduction and Literature Review
1.1. Supporting Theories
- (1)
- Attention restoration theory posits that our top-down attention, which becomes depleted through mentally demanding tasks associated with everyday life, can be restored through exposure to natural settings [3,27,32]. Natural visual and acoustic elements, such as trees, water, tweeting birds, and breeze, are softly fascinating. These stimuli engage our bottom-up attention, thus allowing our top-down attention a chance to recover from the mental fatigue associated with modern life [27,33,34].
- (2)
- Stress reduction theory posits that exposure to nature promotes recovery from stress because positive mental responses to unthreatening natural settings and elements are deeply rooted in our genes through millions of years of evolution [28]. This psychological response is immediate, unconscious, and spontaneous, and it is accompanied by increased positive feelings [28,35,36].
- (3)
- The prospect-refuge theory [29] suggests that humans often experience unconscious positive mood responses to safe and fertile environments and experience negative mood responses to dangerous or barren settings. Prospect-refuge Theory has a great deal of overlap with the biophilia hypothesis, which posits humans possess an innate tendency to seek and prefer connections with nature [37,38].
- (4)
- The theory of information processing in landscape settings posits that making efficient and accurate comprehension of an environment is a foundational capacity that supported our ancestors’ survival and prosperity [30,39]. There is ample evidence that humans make rapid mental responses to landscapes and that these responses include changes in mood states [40]. Change in mood states was likely critical to facilitate our species’ ability to make immediate assessments of landscapes that might have posed resources or threats—or a combination of resources and threats [30,41,42].
- (5)
- Although a combination of all five senses is involved in human perception of any environment, it has been argued that the vast majority of information about landscapes is acquired by seeing and hearing [31]. This suggests that visual and acoustic stimuli are critical sources of information for connecting people to their surroundings [43]. In addition, these stimuli are linked, i.e., visual information can affect acoustic perception and acoustic information can affect visual perception [43,44,45]. The McGurk effect [46] for example, describes the incongruity experienced when well-known auditory and visual elements are mismatched. The effect is reported to be particularly salient when the quality of auditory information is poor [47]. Wang and Zhao (2019) [48] explore the effects of auditory-visual combinations on aesthetic preference, quantifying the advantage of soundscape and visual landscape congruence. From this perspective, a combination of visual and acoustic landscape variables might have varying effects on mood states [49].
1.2. Urban Parks and Happiness
1.3. Social Media Data and Sentiment Analysis
2. Materials and Methods
2.1. Subsection Data Sources and Processing
2.1.1. Sina Weibo Data
2.1.2. Other Basic Data
2.2. Analytical Framework and Study Design
Variable Settings and Measures
- (1)
- Accessibility
- (2)
- Naturalness
2.3. Reliability and Validity Testing
3. Results
Results of Structural Equation Model
4. Discussion and Conclusions
4.1. Conclusions
4.2. Limitations and Future Steps
Author Contributions
Funding
Institutional Review Board Statement
Informed Consent Statement
Data Availability Statement
Acknowledgments
Conflicts of Interest
References
- Bratman, G.N.; Anderson, C.B.; Berman, M.G.; Cochran, B.; de Vries, S.; Flanders, J.; Folke, C.; Frumkin, H.; Gross, J.J.; Hartig, T.; et al. Nature and Mental Health: An Ecosystem Service Perspective. Sci. Adv. 2019, 5, eaax0903. [Google Scholar] [CrossRef] [PubMed]
- Enssle, F.; Kabisch, N. Urban Green Spaces for the Social Interaction, Health and Well-Being of Older People— An Integrated View of Urban Ecosystem Services and Socio-Environmental Justice. Environ. Sci. Policy 2020, 109, 36–44. [Google Scholar] [CrossRef]
- Sullivan, W.C.; Chang, C.Y. Landscapes and Human Health. Int. J. Environ. Res. Public Health 2017, 14, 1212. [Google Scholar] [CrossRef] [PubMed]
- Frumkin, H.; Bratman, G.N.; Breslow, S.J.; Cochran, B.; Kahn, P.H.; Lawler, J.J.; Levin, P.S.; Tandon, P.S.; Varanasi, U.; Wolf, K.L.; et al. Nature Contact and Human Health: A Research Agenda. Environ. Health Perspect. 2017, 125, 075001. [Google Scholar] [CrossRef] [PubMed]
- Villeneuve, P.J.; Jerrett, M.; Su, J.G.; Burnett, R.T.; Chen, H.; Wheeler, A.J.; Goldberg, M.S. A Cohort Study Relating Urban Green Space with Mortality in Ontario, Canada. Environ. Res. 2012, 115, 51–58. [Google Scholar] [CrossRef]
- Li, D.; Chiang, Y.C.; Sang, H.; Sullivan, W.C. Beyond the School Grounds: Links between Density of Tree Cover in School Surroundings and High School Academic Performance. Urban For. Urban Green. 2019, 38, 42–53. [Google Scholar] [CrossRef]
- Gascon, M.; Triguero-Mas, M.; Martínez, D.; Dadvand, P.; Rojas-Rueda, D.; Plasència, A.; Nieuwenhuijsen, M.J. Residential Green Spaces and Mortality: A Systematic Review. Environ. Int. 2016, 86, 60–67. [Google Scholar] [CrossRef]
- Cheng, Y.; Zhang, J.; Wei, W.; Zhao, B. Effects of Urban Parks on Residents’ Expressed Happiness before and during the COVID-19 Pandemic. Landsc. Urban Plan. 2021, 212, 104118. [Google Scholar] [CrossRef]
- De Vries, S.; Nieuwenhuizen, W.; Farjon, H.; van Hinsberg, A.; Dirkx, J. In Which Natural Environments Are People Happiest? Large-Scale Experience Sampling in the Netherlands. Landsc. Urban Plan. 2021, 205, 103972. [Google Scholar] [CrossRef]
- MacKerron, G.; Mourato, S. Happiness Is Greater in Natural Environments. Glob. Environ. Chang. 2013, 23, 992–1000. [Google Scholar] [CrossRef]
- Mackerron, G. Happiness and Environmental Quality. Ph.D. Thesis, London School of Economics and Political Science, London, UK, 2011. [Google Scholar]
- Van Herzele, A.; de Vries, S. Linking Green Space to Health: A Comparative Study of Two Urban Neighbourhoods in Ghent, Belgium. Popul. Environ. 2012, 34, 171–193. [Google Scholar] [CrossRef]
- Aminzadeh, K.; Denny, S.; Utter, J.; Milfont, T.L.; Ameratunga, S.; Teevale, T.; Clark, T. Neighbourhood Social Capital and Adolescent Self-Reported Wellbeing in New Zealand: A Multilevel Analysis. Soc. Sci. Med. 2013, 84, 13–21. [Google Scholar] [CrossRef]
- White, M.P.; Alcock, I.; Wheeler, B.W.; Depledge, M.H. Would You Be Happier Living in a Greener Urban Area? A Fixed-Effects Analysis of Panel Data. Psychol. Sci. 2013, 24, 920–928. [Google Scholar] [CrossRef]
- Nielsen, K.; Abildgaard, J.S.; Daniels, K. Putting Context into Organizational Intervention Design: Using Tailored Questionnaires to Measure Initiatives for Worker Well-Being. Hum. Relat. 2014, 67, 1537–1560. [Google Scholar] [CrossRef]
- Bertram, C.; Rehdanz, K. The Role of Urban Green Space for Human Well-Being. Ecol. Econ. 2015, 120, 139–152. [Google Scholar] [CrossRef]
- Blasi, E.; Nucera, M.; Cicatiello, C.; Franco, S. Socio-Demographic Components of Eudaimonic Well-Being: A Survey in an Italian Province. Soc. Indic. Res. 2013, 113, 451–470. [Google Scholar] [CrossRef]
- Benita, F.; Bansal, G.; Tunçer, B. Public Spaces and Happiness: Evidence from a Large-Scale Field Experiment. Health Place 2019, 56, 9–18. [Google Scholar] [CrossRef]
- Shan, S.; Peng, J.; Wei, Y. Environmental Sustainability Assessment 2.0: The Value of Social Media Data for Determining the Emotional Responses of People to River Pollution—A Case Study of Weibo (Chinese Twitter). Socioecon. Plann. Sci. 2021, 75, 100868. [Google Scholar] [CrossRef]
- Ghahramani, M.; Galle, N.J.; Ratti, C.; Pilla, F. Tales of a City: Sentiment Analysis of Urban Green Space in Dublin. Cities 2021, 119, 103395. [Google Scholar] [CrossRef]
- Seresinhe, C.I.; Preis, T.; MacKerron, G.; Moat, H.S. Happiness Is Greater in More Scenic Locations. Sci. Rep. 2019, 9, 4498. [Google Scholar] [CrossRef]
- Wang, Z.; Zhu, Z.; Xu, M.; Qureshi, S. Fine-Grained Assessment of Greenspace Satisfaction at Regional Scale Using Content Analysis of Social Media and Machine Learning. Sci. Total Environ. 2021, 776, 145908. [Google Scholar] [CrossRef] [PubMed]
- Hughes, D.J.; Rowe, M.; Batey, M.; Lee, A. A Tale of Two Sites: Twitter vs. Facebook and the Personality Predictors of Social Media Usage. Comput. Human Behav. 2012, 28, 561–569. [Google Scholar] [CrossRef]
- Gao, Y.; Chen, Y.; Mu, L.; Gong, S.; Zhang, P.; Liu, Y. Measuring Urban Sentiments from Social Media Data: A Dual-Polarity Metric Approach. J. Geogr. Syst. 2022, 24, 199–221. [Google Scholar] [CrossRef]
- Roberts, H.; Sadler, J.; Chapman, L. The Value of Twitter Data for Determining the Emotional Responses of People to Urban Green Spaces: A Case Study and Critical Evaluation. Urban Stud. 2019, 56, 818–835. [Google Scholar] [CrossRef]
- Plunz, R.A.; Zhou, Y.; Carrasco Vintimilla, M.I.; Mckeown, K.; Yu, T.; Uguccioni, L.; Sutto, M.P. Twitter Sentiment in New York City Parks as Measure of Well-Being. Landsc. Urban Plan. 2019, 189, 235–246. [Google Scholar] [CrossRef]
- Kaplan, S. The Restorative Benefits of Nature: Toward an Integrative Framework. J. Environ. Psychol. 1995, 15, 169–182. [Google Scholar] [CrossRef]
- Ulrich, R.S.; Simons, R.F.; Losito, B.D.; Fiorito, E.; Miles, M.A.; Zelson, M. Stress Recovery during Exposure to Natural and Urban Environments. J. Environ. Psychol. 1991, 11, 201–230. [Google Scholar] [CrossRef]
- Appleton, J. The Experience of Landscape; Wiley Chichester: Chichester, UK, 1975. [Google Scholar]
- Kaplan, S. Aesthetics, Affect, and Cognition: Environmental Preference from an Evolutionary Perspective. Environ. Behav. 1987, 19, 3–32. [Google Scholar] [CrossRef]
- Treichler, D.G. Are You Missing the Boat in Training Aids. Film. AV Commun. 1967, 1, 14–16. [Google Scholar]
- Sullivan, W.C.; Li, D. Nature and Attention. In Nature and Psychology; Springer: Berlin/Heidelberg, Germany, 2021; pp. 7–30. [Google Scholar]
- Ohly, H.; White, M.P.; Wheeler, B.W.; Bethel, A.; Ukoumunne, O.C.; Nikolaou, V.; Garside, R. Attention Restoration Theory: A Systematic Review of the Attention Restoration Potential of Exposure to Natural Environments. J. Toxicol. Environ. Health Part B 2016, 19, 305–343. [Google Scholar] [CrossRef]
- Stevenson, M.P.; Schilhab, T.; Bentsen, P. Attention Restoration Theory II: A Systematic Review to Clarify Attention Processes Affected by Exposure to Natural Environments. J. Toxicol. Environ. Health Part B 2018, 21, 227–268. [Google Scholar] [CrossRef]
- Andrade, C.C.; Devlin, A.S. Stress Reduction in the Hospital Room: Applying Ulrich’s Theory of Supportive Design. J. Environ. Psychol. 2015, 41, 125–134. [Google Scholar] [CrossRef]
- Jiang, B.; He, J.; Chen, J.; Larsen, L.; Wang, H. Perceived Green at Speed: A Simulated Driving Experiment Raises New Questions for Attention Restoration Theory and Stress Reduction Theory. Environ. Behav. 2021, 53, 296–335. [Google Scholar] [CrossRef]
- Wilson, E.O. Biophilia; Harvard University Press: Cambridge, MA, USA, 2021. [Google Scholar]
- Dosen, A.S.; Ostwald, M.J. Evidence for Prospect-Refuge Theory: A Meta-Analysis of the Findings of Environmental Preference Research. City Territ. Archit. 2016, 3, 4. [Google Scholar] [CrossRef]
- Kaplan, R.; Kaplan, S.; Ryan, R. With People in Mind: Design and Management of Everyday Nature; Island Press: Washinton, DC, USA, 1998. [Google Scholar]
- Kaplan, R.; Kaplan, S. The Experience of Nature: A Psychological Perspective; Cambridge University Press: Cambridge, UK, 1989. [Google Scholar]
- Opdam, P. Navigating the Space between Landscape Science and Collective Action for Sustainability: Identifying Key Factors in Information Processing. Landsc. Ecol. 2020, 35, 2629–2639. [Google Scholar] [CrossRef]
- Gimblett, H.R.; Itami, R.M.; Fitzgibbon, J.E. Mystery in an Information Processing Model of Landscape Preference. Landsc. J. 1985, 4, 87–95. [Google Scholar] [CrossRef]
- Preis, A.; Kociński, J.; Hafke-Dys, H.; Wrzosek, M. Audio-Visual Interactions in Environment Assessment. Sci. Total Environ. 2015, 523, 191–200. [Google Scholar] [CrossRef]
- Xu, X.; Wu, H. Audio-Visual Interactions Enhance Soundscape Perception in China’s Protected Areas. Urban For. Urban Green. 2021, 61, 127090. [Google Scholar] [CrossRef]
- Jeon, J.Y.; Jo, H.I. Effects of Audio-Visual Interactions on Soundscape and Landscape Perception and Their Influence on Satisfaction with the Urban Environment. Build. Environ. 2020, 169, 106544. [Google Scholar] [CrossRef]
- McGurk, H.; MacDonald, J. Hearing Lips and Seeing Voices. Nature 1976, 264, 746–748. [Google Scholar] [CrossRef]
- Massaro, D.W.; Cohen, M.M. Tests of Auditory–Visual Integration Efficiency within the Framework of the Fuzzy Logical Model of Perception. J. Acoust. Soc. Am. 2000, 108, 784–789. [Google Scholar] [CrossRef] [PubMed]
- Wang, R.; Zhao, J. A Good Sound in the Right Place: Exploring the Effects of Auditory-Visual Combinations on Aesthetic Preference. Urban For. Urban Green. 2019, 43, 126356. [Google Scholar] [CrossRef]
- Jiang, B.; Xu, W.; Ji, W.; Kim, G.; Pryor, M.; Sullivan, W.C. Impacts of Nature and Built Acoustic-Visual Environments on Human’s Multidimensional Mood States: A Cross-Continent Experiment. J. Environ. Psychol. 2021, 77, 101659. [Google Scholar] [CrossRef]
- Dzhambov, A.M.; Markevych, I.; Hartig, T.; Tilov, B.; Arabadzhiev, Z.; Stoyanov, D.; Gatseva, P.; Dimitrova, D.D. Multiple Pathways Link Urban Green- and Bluespace to Mental Health in Young Adults. Environ. Res. 2018, 166, 223–233. [Google Scholar] [CrossRef] [PubMed]
- Hartig, T.; Mitchell, R.; de Vries, S.; Frumkin, H. Nature and Health. Annu. Rev. Public Health 2014, 35, 207–228. [Google Scholar] [CrossRef]
- Markevych, I.; Schoierer, J.; Hartig, T.; Chudnovsky, A.; Hystad, P.; Dzhambov, A.M.; de Vries, S.; Triguero-Mas, M.; Brauer, M.; Nieuwenhuijsen, M.J.; et al. Exploring Pathways Linking Greenspace to Health: Theoretical and Methodological Guidance. Environ. Res. 2017, 158, 301–317. [Google Scholar] [CrossRef]
- Ikiugu, M.N.; Ciaravino, E.A. Psychosocial Conceptual Practice Models in Occupational Therapy: Building Adaptive Capability; Elsevier Health Sciences: Amsterdam, The Netherlands, 2007. [Google Scholar]
- Liu, H.; Li, F.; Li, J.; Zhang, Y. The Relationships between Urban Parks, Residents’ Physical Activity, and Mental Health Benefits: A Case Study from Beijing, China. J. Environ. Manag. 2017, 190, 223–230. [Google Scholar] [CrossRef]
- Kim, D.; Jin, J. Does Happiness Data Say Urban Parks Are Worth It? Landsc. Urban Plan. 2018, 178, 1–11. [Google Scholar] [CrossRef]
- Almanza, E.; Jerrett, M.; Dunton, G.; Seto, E.; Pentz, M.A. A Study of Community Design, Greenness, and Physical Activity in Children Using Satellite, GPS and Accelerometer Data. Health Place 2012, 18, 46–54. [Google Scholar] [CrossRef]
- Astell-Burt, T.; Mitchell, R.; Hartig, T. The Association between Green Space and Mental Health Varies across the Lifecourse. A Longitudinal Study. J. Epidemiol. Community Health 2014, 68, 578–583. [Google Scholar] [CrossRef]
- Mitchell, R. Is Physical Activity in Natural Environments Better for Mental Health than Physical Activity in Other Environments? Soc. Sci. Med. 2013, 91, 130–134. [Google Scholar] [CrossRef]
- Pretty, J.; Peacock, J.; Hine, R.; Sellens, M.; South, N.; Griffin, M. Green Exercise in the UK Countryside: Effects on Health and Psychological Well-Being, and Implications for Policy and Planning. J. Environ. Plan. Manag. 2007, 50, 211–231. [Google Scholar] [CrossRef]
- Thompson Coon, J.; Boddy, K.; Stein, K.; Whear, R.; Barton, J.; Depledge, M.H. Does Participating in Physical Activity in Outdoor Natural Environments Have a Greater Effect on Physical and Mental Wellbeing than Physical Activity Indoors? A Systematic Review. Environ. Sci. Technol. 2011, 45, 1761–1772. [Google Scholar] [CrossRef]
- Kaczynski, A.T.; Potwarka, L.R.; Smale, B.J.A.; Havitz, M.E. Association of Parkland Proximity with Neighborhood and Park-Based Physical Activity: Variations by Gender and Age. Leis. Sci. 2009, 31, 174–191. [Google Scholar] [CrossRef]
- Ord, K.; Mitchell, R.; Pearce, J. Is Level of Neighbourhood Green Space Associated with Physical Activity in Green Space? Int. J. Behav. Nutr. Phys. Act. 2013, 10, 1–8. [Google Scholar] [CrossRef]
- Schipperijn, J.; Bentsen, P.; Troelsen, J.; Toftager, M.; Stigsdotter, U.K. Associations between Physical Activity and Characteristics of Urban Green Space. Urban For. Urban Green. 2013, 12, 109–116. [Google Scholar] [CrossRef]
- De Vries, S.; van Dillen, S.M.; Groenewegen, P.P.; Spreeuwenberg, P. Streetscape Greenery and Health: Stress, Social Cohesion and Physical Activity as Mediators. Soc. Sci. Med. 2013, 94, 26–33. [Google Scholar] [CrossRef]
- Bancroft, C.; Joshi, S.; Rundle, A.; Hutson, M.; Chong, C.; Weiss, C.C.; Genkinger, J.; Neckerman, K.; Lovasi, G. Association of Proximity and Density of Parks and Objectively Measured Physical Activity in the United States: A Systematic Review. Soc. Sci. Med. 2015, 138, 22–30. [Google Scholar] [CrossRef]
- Lachowycz, K.; Jones, A.P. Greenspace and Obesity: A Systematic Review of the Evidence. Obes. Rev. 2011, 12, e183–e189. [Google Scholar] [CrossRef]
- McEachan, R.R.C.; Prady, S.L.; Smith, G.; Fairley, L.; Cabieses, B.; Gidlow, C.; Wright, J.; Dadvand, P.; van Gent, D.; Nieuwenhuijsen, M.J. The Association between Green Space and Depressive Symptoms in Pregnant Women: Moderating Roles of Socioeconomic Status and Physical Activity. J. Epidemiol. Community Health 2016, 70, 253–259. [Google Scholar] [CrossRef]
- Richardson, E.A.; Pearce, J.; Mitchell, R.; Kingham, S. Role of Physical Activity in the Relationship between Urban Green Space and Health. Public Health 2013, 127, 318–324. [Google Scholar] [CrossRef] [PubMed]
- Dadvand, P.; Bartoll, X.; Basagaña, X.; Dalmau-Bueno, A.; Martinez, D.; Ambros, A.; Cirach, M.; Triguero-Mas, M.; Gascon, M.; Borrell, C.; et al. Green Spaces and General Health: Roles of Mental Health Status, Social Support, and Physical Activity. Environ. Int. 2016, 91, 161–167. [Google Scholar] [CrossRef] [PubMed]
- Astell-Burt, T.; Feng, X.; Kolt, G.S. Mental Health Benefits of Neighbourhood Green Space Are Stronger among Physically Active Adults in Middle-to-Older Age: Evidence from 260,061 Australians. Prev. Med. 2013, 57, 601–606. [Google Scholar] [CrossRef] [PubMed]
- Maas, J.; Verheij, R.A.; Spreeuwenberg, P.; Groenewegen, P.P. Physical Activity as a Possible Mechanism behind the Relationship between Green Space and Health: A Multilevel Analysis. BMC Public Health 2008, 8, 206. [Google Scholar] [CrossRef]
- Cohen, D.A.; Han, B.; Marsh, T.; Sturm, R. Quantifying the Contribution of Public Parks to Physical Activity and Health: Introducing SOPARC; RAND Corporation: Santa Monica, CA, USA, 2014. [Google Scholar]
- Giles-Corti, B.; Timperio, A.; Bull, F.; Pikora, T. Understanding Physical Activity Environmental Correlates: Increased Specificity for Ecological Models. Exerc. Sport Sci. Rev. 2005, 33, 175–181. [Google Scholar] [CrossRef]
- Liu, X.; Hu, W. Attention and Sentiment of Chinese Public toward Green Buildings Based on Sina Weibo. Sustain. Cities Soc. 2019, 44, 550–558. [Google Scholar] [CrossRef]
- Balram, S.; Dragićević, S. Attitudes toward Urban Green Spaces: Integrating Questionnaire Survey and Collaborative GIS Techniques to Improve Attitude Measurements. Landsc. Urban Plan. 2005, 71, 147–162. [Google Scholar] [CrossRef]
- Li, S.; Wang, Y.; Xue, J.; Zhao, N.; Zhu, T. The Impact of Covid-19 Epidemic Declaration on Psychological Consequences: A Study on Active Weibo Users. Int. J. Environ. Res. Public Health 2020, 17, 2032. [Google Scholar] [CrossRef]
- Zhu, J.; Xu, C. Sina Microblog Sentiment in Beijing City Parks as Measure of Demand for Urban Green Space during the COVID-19. Urban For. Urban Green. 2021, 58, 126913. [Google Scholar] [CrossRef]
- Han, X.; Wang, J.; Zhang, M.; Wang, X. Using Social Media to Mine and Analyze Public Opinion Related to COVID-19 in China. Int. J. Environ. Res. Public Health 2020, 17, 2788. [Google Scholar] [CrossRef]
- Fang, J.; Hu, J.; Shi, X.; Zhao, L. Assessing Disaster Impacts and Response Using Social Media Data in China: A Case Study of 2016 Wuhan Rainstorm. Int. J. Disaster Risk Reduct. 2019, 34, 275–282. [Google Scholar] [CrossRef]
- Nasukawa, T.; Yi, J. Sentiment Analysis: Capturing Favorability Using Natural Language Processing. In Proceedings of the 2nd International Conference on Knowledge Capture, Sanibel Island, FL, USA, 23–25 October 2003; pp. 70–77. [Google Scholar]
- Yi, J.; Nasukawa, T.; Bunescu, R.; Niblack, W. Sentiment Analyzer: Extracting Sentiments about a given Topic Using Natural Language Processing Techniques. In Proceedings of the Third IEEE international Conference on Data Mining, Melbourne, FL, USA, 22 November 2003; pp. 427–434. [Google Scholar]
- Thakkar, H.; Patel, D. Approaches for Sentiment Analysis on Twitter: A State-of-Art Study. arXiv 2015. [Google Scholar] [CrossRef]
- Sankar, H.; Subramaniyaswamy, V. Investigating Sentiment Analysis Using Machine Learning Approach. In Proceedings of the 2017 International Conference on Intelligent Sustainable Systems (ICISS), Palladam, India, 7–8 December 2017; pp. 87–92. [Google Scholar]
- Ligthart, A.; Catal, C.; Tekinerdogan, B. Systematic Reviews in Sentiment Analysis: A Tertiary Study. Artif. Intell. Rev. 2021, 54, 4997–5053. [Google Scholar] [CrossRef]
- Jurek, A.; Mulvenna, M.D.; Bi, Y. Improved Lexicon-Based Sentiment Analysis for Social Media Analytics. Secur. Inform. 2015, 4, 9. [Google Scholar] [CrossRef]
- Birjali, M.; Kasri, M.; Beni-Hssane, A. A Comprehensive Survey on Sentiment Analysis: Approaches, Challenges and Trends. Knowl. Based Syst. 2021, 226, 107134. [Google Scholar] [CrossRef]
- Agarwal, B.; Mittal, N. Prominent Feature Extraction for Sentiment Analysis; Springer: Berlin/Heidelberg, Germany, 2016. [Google Scholar]
- Yoo, G.; Nam, J. A Hybrid Approach to Sentiment Analysis Enhanced by Sentiment Lexicons and Polarity Shifting Devices. In Proceedings of the 13th Workshop on Asian Language Resources, Miyazaki, Japan, 7 May 2018; pp. 21–28. [Google Scholar]
- Vateekul, P.; Koomsubha, T. A Study of Sentiment Analysis Using Deep Learning Techniques on Thai Twitter Data. In Proceedings of the 2016 13th International Joint Conference on Computer Science and Software Engineering (JCSSE), Khon Kaen, Thailand, 13–15 July 2016; pp. 1–6. [Google Scholar]
- Zhang, L.; Wang, S.; Liu, B. Deep Learning for Sentiment Analysis: A Survey. Wiley Interdiscip. Rev. Data Min. Knowl. Discov. 2018, 8, e1253. [Google Scholar] [CrossRef]
- Li, W.; Qi, F.; Tang, M.; Yu, Z. Bidirectional LSTM with Self-Attention Mechanism and Multi-Channel Features for Sentiment Classification. Neurocomputing 2020, 387, 63–77. [Google Scholar] [CrossRef]
- Araque, O.; Corcuera-Platas, I.; Sánchez-Rada, J.F.; Iglesias, C.A. Enhancing Deep Learning Sentiment Analysis with Ensemble Techniques in Social Applications. Expert Syst. Appl. 2017, 77, 236–246. [Google Scholar] [CrossRef]
- Sharfuddin, A.A.; Tihami, M.N.; Islam, M.S. A Deep Recurrent Neural Network with Bilstm Model for Sentiment Classification. In Proceedings of the 2018 International Conference on Bangla Speech and Language Processing (ICBSLP), Sylhet, Bangladesh, 21–22 September 2018; pp. 1–4. [Google Scholar]
- Hochreiter, S.; Schmidhuber, J. Long Short-Term Memory. Neural Comput. 1997, 9, 1735–1780. [Google Scholar] [CrossRef]
- Yu, Y.; Si, X.; Hu, C.; Zhang, J. A Review of Recurrent Neural Networks: LSTM Cells and Network Architectures. Neural Comput. 2019, 31, 1235–1270. [Google Scholar] [CrossRef]
- Qin, J.; Huang, J. Use Pre-Trained Models and Multi-Classifier Voting Methods to Identify the Ironic Authors on Twitter. In Proceedings of the 13th Conference and Labs of the Evaluation Forum (CLEF), Bologna, Italy, 5–8 September 2022; pp. 1613–1673. [Google Scholar]
- Bollen, K.A. A New Incremental Fit Index for General Structural Equation Models. Sociol. Methods Res. 1989, 17, 303–316. [Google Scholar] [CrossRef]
- Nutsford, D.; Pearson, A.L.; Kingham, S. An Ecological Study Investigating the Association between Access to Urban Green Space and Mental Health. Public Health 2013, 127, 1005–1011. [Google Scholar] [CrossRef] [PubMed]
- Wood, L.; Hooper, P.; Foster, S.; Bull, F. Public Green Spaces and Positive Mental Health—Investigating the Relationship between Access, Quantity and Types of Parks and Mental Wellbeing. Health Place 2017, 48, 63–71. [Google Scholar] [CrossRef] [PubMed]
- Orsega-Smith, E.; Mowen, A.J.; Payne, L.L.; Godbey, G. The Interaction of Stress and Park Use on Psycho-Physiological Health in Older Adults. J. Leis. Res. 2004, 36, 232–256. [Google Scholar] [CrossRef]
- Chen, J.; Yang, S.; Li, H.; Zhang, B.; Lv, J. Research on Geographical Environment Unit Division Based on the Method of Natural Breaks (Jenks). Int. Arch. Photogramm. Remote Sens. Spat. Inf. Sci. 2013, 40, 47–50. [Google Scholar] [CrossRef]
- Hu, S.; Song, W.; Li, C.; Lu, J. A Multi-Mode Gaussian-Based Two-Step Floating Catchment Area Method for Measuring Accessibility of Urban Parks. Cities 2020, 105, 102815. [Google Scholar] [CrossRef]
- Zheng, Z.; Xia, H.; Ambinakudige, S.; Qin, Y.; Li, Y.; Xie, Z.; Zhang, L.; Gu, H. Spatial Accessibility to Hospitals Based on Web Mapping API: An Empirical Study in Kaifeng, China. Sustainability 2019, 11, 1160. [Google Scholar] [CrossRef]
- Xia, N.; Cheng, L.; Chen, S.; Wei, X.Y.; Zong, W.W.; Li, M.C. Accessibility Based on Gravity-Radiation Model and Google Maps API: A Case Study in Australia. J. Transp. Geogr. 2018, 72, 178–190. [Google Scholar] [CrossRef]
- Tao, Z.; Yao, Z.; Kong, H.; Duan, F.; Li, G. Spatial Accessibility to Healthcare Services in Shenzhen, China: Improving the Multi-Modal Two-Step Floating Catchment Area Method by Estimating Travel Time via Online Map APIs. BMC Health Serv. Res. 2018, 18, 345. [Google Scholar] [CrossRef]
- García-Albertos, P.; Picornell, M.; Salas-Olmedo, M.H.; Gutiérrez, J. Exploring the Potential of Mobile Phone Records and Online Route Planners for Dynamic Accessibility Analysis. Transp. Res. Part. A Policy Pract. 2019, 125, 294–307. [Google Scholar] [CrossRef]
- Tao, Z.; Cheng, Y. Modelling the Spatial Accessibility of the Elderly to Healthcare Services in Beijing, China. Environ. Plan. B Urban Anal. City Sci. 2019, 46, 1132–1147. [Google Scholar] [CrossRef]
- Qin, J.; Liu, Y.; Yi, D.; Sun, S.; Zhang, J. Spatial Accessibility Analysis of Parks with Multiple Entrances Based on Real-Time Travel: The Case Study in Beijing. Sustainability 2020, 12, 7618. [Google Scholar] [CrossRef]
- Gong, S.; Gao, Y.; Zhang, F.; Mu, L.; Kang, C.; Liu, Y. Evaluating Healthcare Resource Inequality in Beijing, China Based on an Improved Spatial Accessibility Measurement. Trans. GIS 2021, 25, 1504–1521. [Google Scholar] [CrossRef]
- Miles, R.; Coutts, C.; Mohamadi, A. Neighborhood Urban Form, Social Environment, and Depression. J. Urban Health 2012, 89, 1–18. [Google Scholar] [CrossRef]
- Den Berg, A.E.; Maas, J.; Verheij, R.A.; Groenewegen, P.P. Green Space as a Buffer between Stressful Life Events and Health. Soc. Sci. Med. 2010, 70, 1203–1210. [Google Scholar] [CrossRef]
- Thompson, C.W.; Roe, J.; Aspinall, P.; Mitchell, R.; Clow, A.; Miller, D. More Green Space Is Linked to Less Stress in Deprived Communities: Evidence from Salivary Cortisol Patterns. Landsc. Urban Plan. 2012, 105, 221–229. [Google Scholar] [CrossRef]
- Hasan, H.; Shafri, H.Z.M.; Habshi, M. A Comparison between Support Vector Machine (SVM) and Convolutional Neural Network (CNN) Models for Hyperspectral Image Classification. In Proceedings of the IOP Conference Series: Earth and Environmental Science, Kuala Lumpur, Malaysia, 25 November 2019; Institute of Physics Publishing: Bristol, UK, 2019; Volume 357. [Google Scholar]
- Kabisch, N.; Haase, D. Green Justice or Just Green? Provision of Urban Green Spaces in Berlin, Germany. Landsc. Urban Plan. 2014, 122, 129–139. [Google Scholar] [CrossRef]
- Rigolon, A.; Browning, M.; Lee, K.; Shin, S. Access to Urban Green Space in Cities of the Global South: A Systematic Literature Review. Urban Sci. 2018, 2, 67. [Google Scholar] [CrossRef]
- Larson, L.R.; Jennings, V.; Cloutier, S.A. Public Parks and Wellbeing in Urban Areas of the United States. PLoS ONE 2016, 11, e0153211. [Google Scholar] [CrossRef]
- Yigitcanlar, T.; Kamruzzaman, M.; Teimouri, R.; Degirmenci, K.; Alanjagh, F. Association between Park Visits and Mental Health in a Developing Country Context: The Case of Tabriz, Iran. Landsc. Urban Plan. 2020, 199, 103805. [Google Scholar] [CrossRef]
- Lee, A.C.K.; Maheswaran, R. The Health Benefits of Urban Green Spaces: A Review of the Evidence. J. Public Health 2011, 33, 212–222. [Google Scholar] [CrossRef] [PubMed]

| Classes | Number of People | % |
|---|---|---|
| ≥5 times/month | 37 | 1.00 |
| 2–4 times/month | 369 | 9.92 |
| 0–1 times/month | 3312 | 89.08 |
| Total | 3718 | 100 |
| Latent Variables | Observed Variables | Description |
|---|---|---|
| Accessibility | Walking | When the travel mode is walking, biking or driving, the accessibility of a park is based on the Gaussian two-step floating catchment area method (G2SFCA). |
| Biking | ||
| Driving | ||
| Naturalness | Greenness coverage | The area of greenness (tree and lawn) is divided by the area of the park. |
| Water coverage | The area of water body divided by the area of the park. |
| Latent Variables | Observed Variables | Mean | SD | CCA | CR | AVE |
|---|---|---|---|---|---|---|
| Accessibility | Walking | 0.517 | 0.887 | 0.725 | 0.873 | 0.698 |
| Biking | 1.581 | 2.057 | ||||
| Driving | 1.698 | 1.596 |
| Accessibility | Greenness Coverage | Age | Water Coverage | Park Visits | |||||||||||
|---|---|---|---|---|---|---|---|---|---|---|---|---|---|---|---|
| TE | DE | IE | TE | DE | IE | TE | DE | IE | TE | DE | IE | TE | DE | IE | |
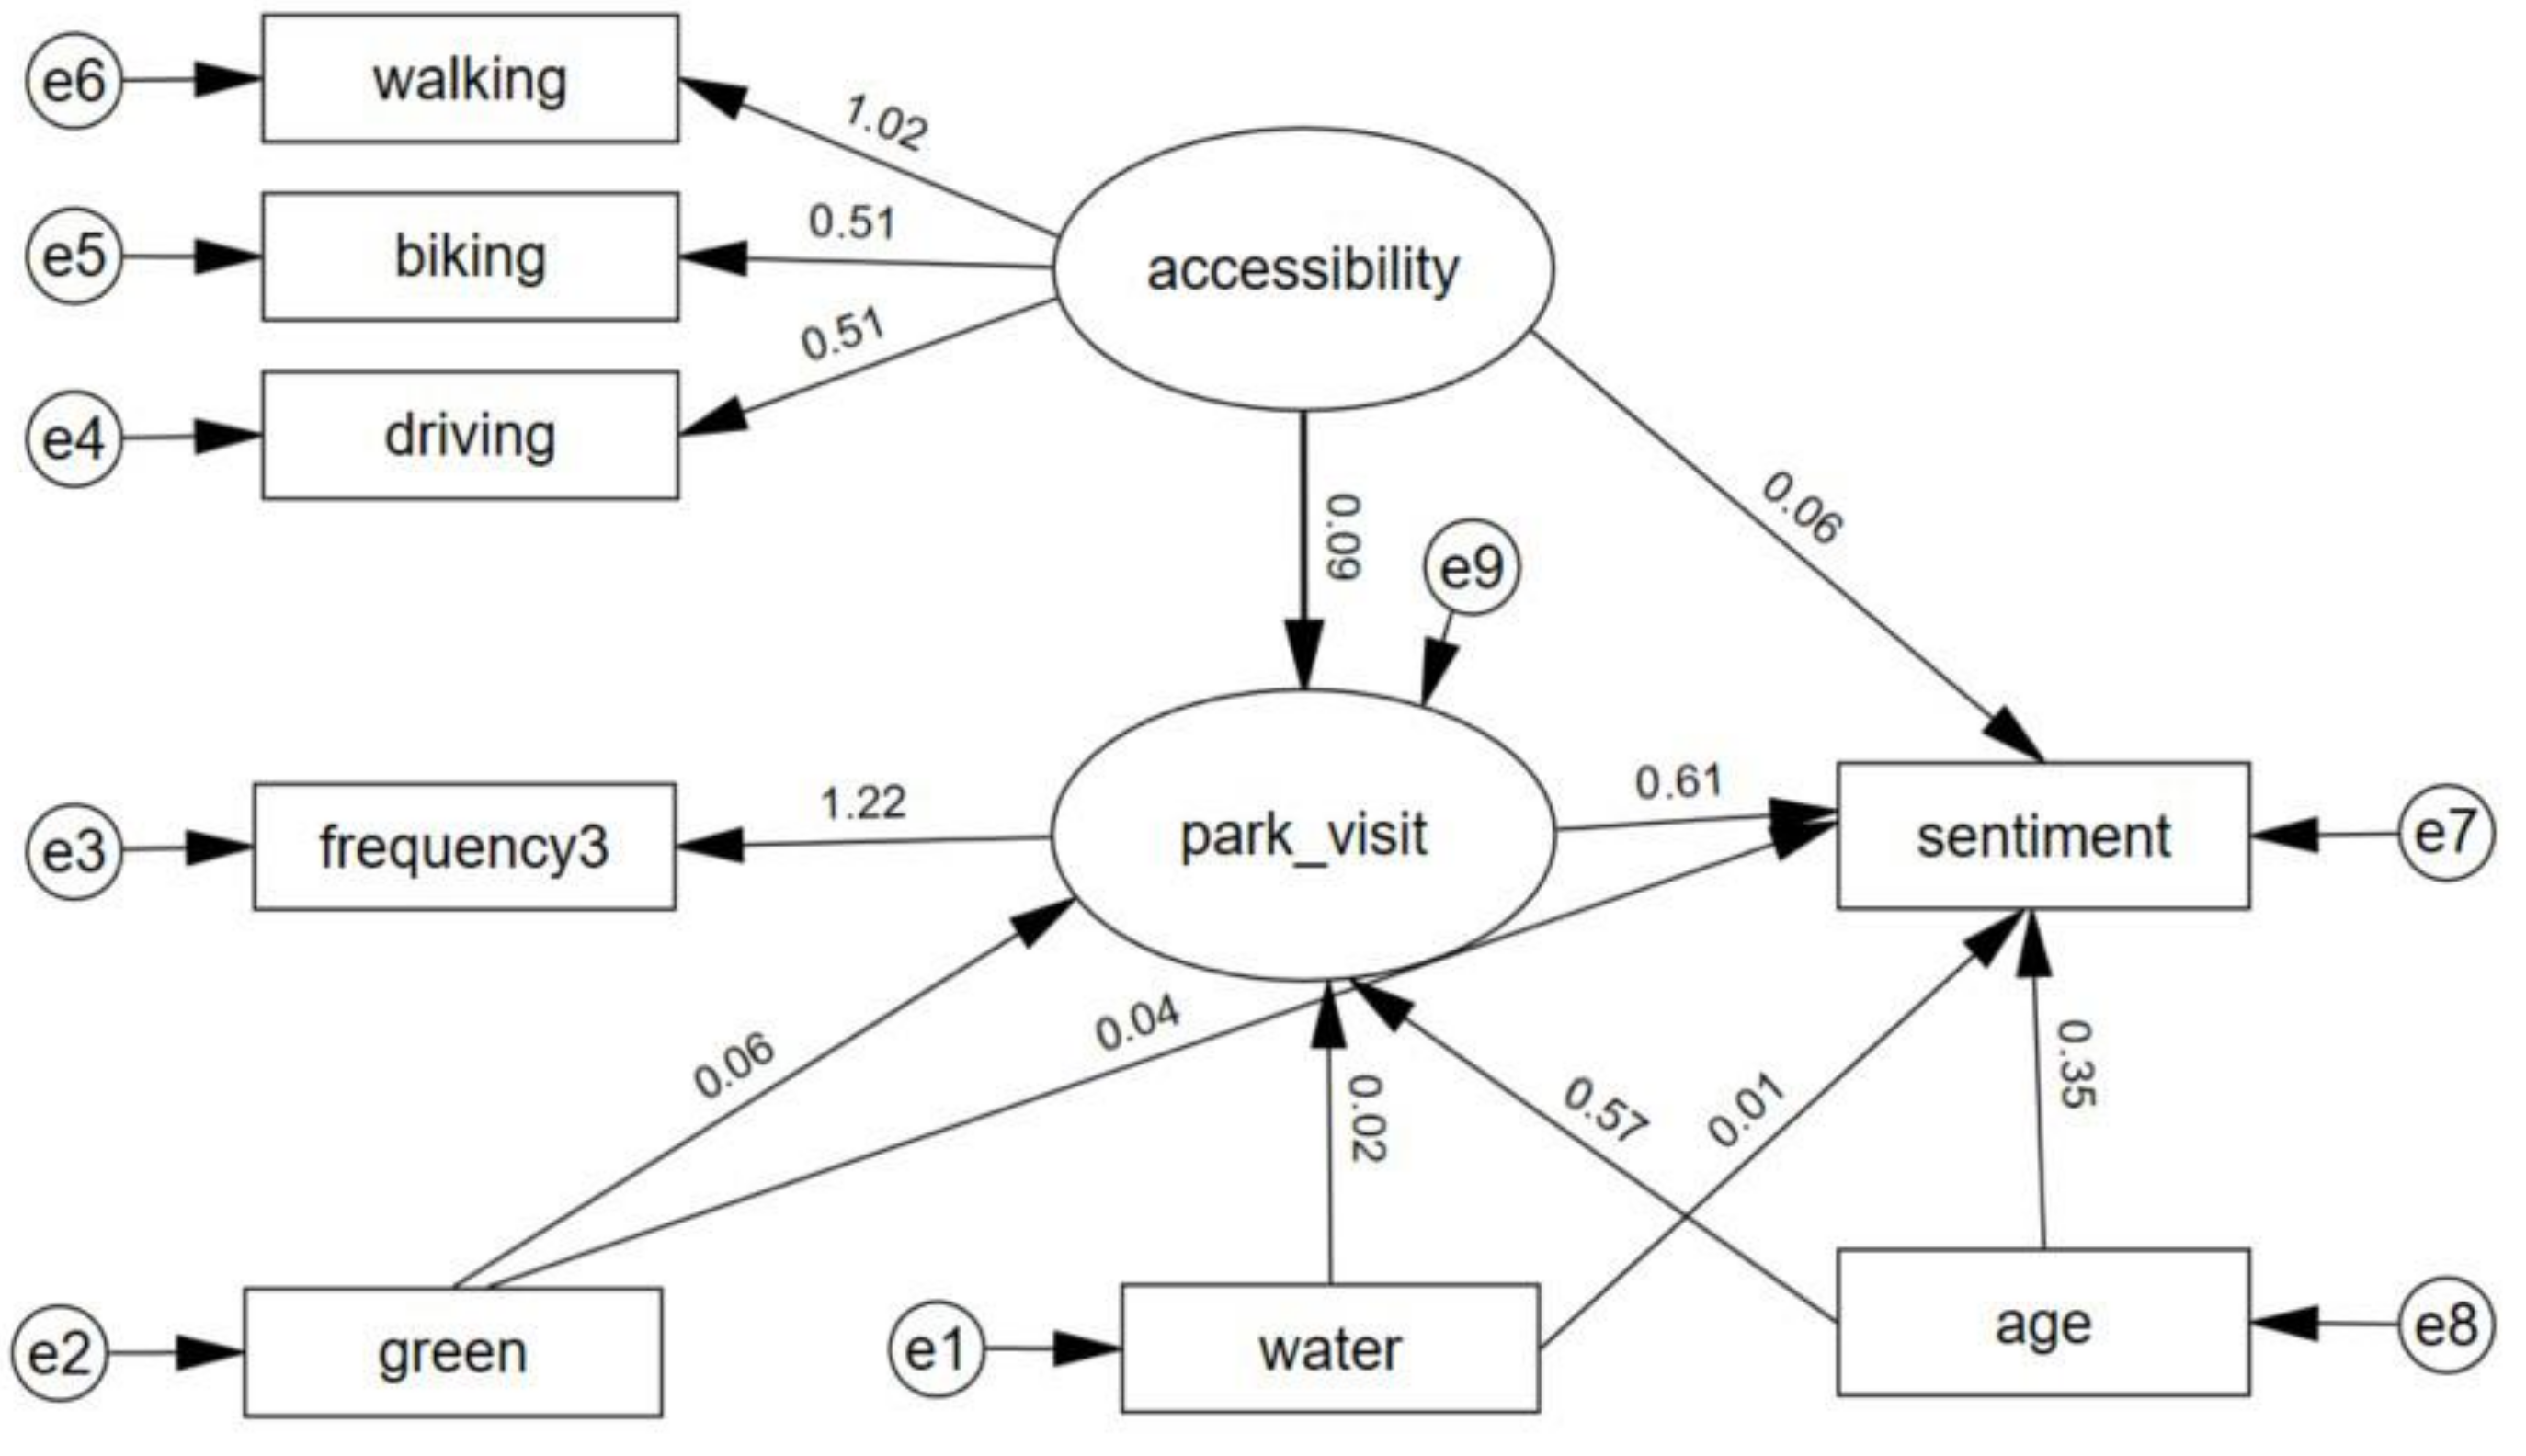
| Sentiment | 0.111 | 0.055 | 0.055 | 0.073 | 0.037 | 0.037 | 0.699 | 0.349 | 0.349 | 0.020 | 0.011 | 0.009 | 0.611 | 0.611 | 0.000 |
| Park visits | 0.091 | 0.091 | 0.000 | 0.060 | 0.060 | 0.000 | 0.572 | 0.572 | 0.000 | 0.015 | 0.015 | 0.000 | 0.000 | 0.000 | 0.000 |
| Hypothesis | Correlation | Coefficient | Results |
|---|---|---|---|
| H1 | The greater the accessibility of the park, the happier people who have access to it. | 0.111 | Supported |
| H2 | The greater the natural degree of the park, the happier people who have access to it. | 0.093 | Supported |
| H3 | The more often people visit the park, the happier people who have access to it. | 0.611 | Supported |
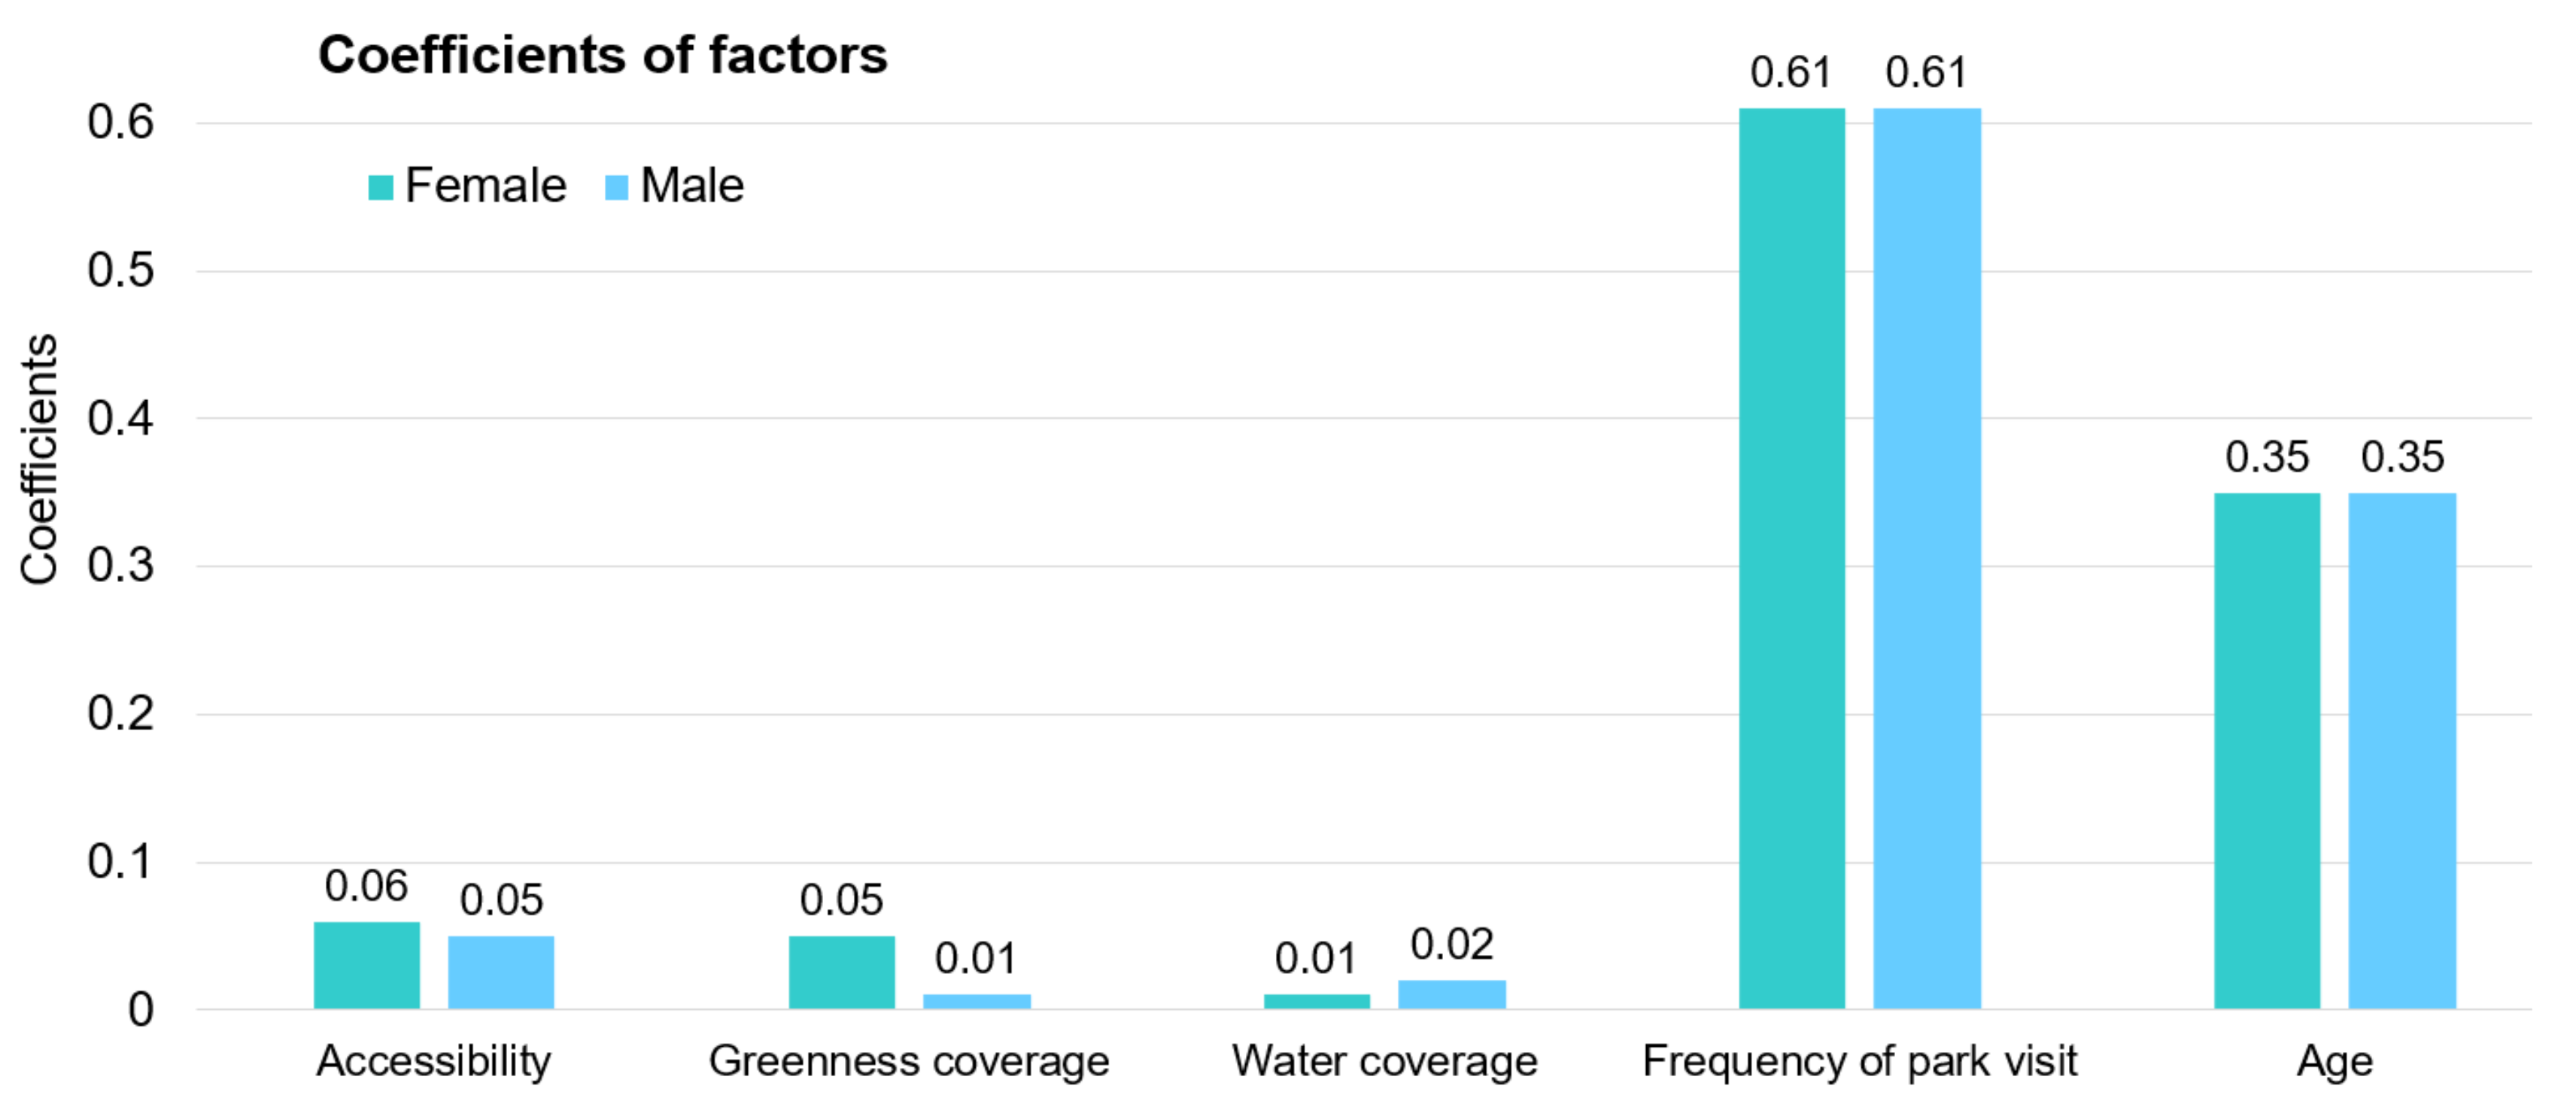
| H4 | Disparities between different groups (residents and non-residents, female and male) | Existed | Supported |
Disclaimer/Publisher’s Note: The statements, opinions and data contained in all publications are solely those of the individual author(s) and contributor(s) and not of MDPI and/or the editor(s). MDPI and/or the editor(s) disclaim responsibility for any injury to people or property resulting from any ideas, methods, instructions or products referred to in the content. |
© 2022 by the authors. Licensee MDPI, Basel, Switzerland. This article is an open access article distributed under the terms and conditions of the Creative Commons Attribution (CC BY) license (https://creativecommons.org/licenses/by/4.0/).
Share and Cite
Lai, S.; Deal, B. Parks, Green Space, and Happiness: A Spatially Specific Sentiment Analysis Using Microblogs in Shanghai, China. Sustainability 2023, 15, 146. https://doi.org/10.3390/su15010146
Lai S, Deal B. Parks, Green Space, and Happiness: A Spatially Specific Sentiment Analysis Using Microblogs in Shanghai, China. Sustainability. 2023; 15(1):146. https://doi.org/10.3390/su15010146
Chicago/Turabian StyleLai, Siqi, and Brian Deal. 2023. "Parks, Green Space, and Happiness: A Spatially Specific Sentiment Analysis Using Microblogs in Shanghai, China" Sustainability 15, no. 1: 146. https://doi.org/10.3390/su15010146
APA StyleLai, S., & Deal, B. (2023). Parks, Green Space, and Happiness: A Spatially Specific Sentiment Analysis Using Microblogs in Shanghai, China. Sustainability, 15(1), 146. https://doi.org/10.3390/su15010146


