Article

A Longitudinal Spatial-Temporal Analysis of Ancient Village Tourism Development in Zhejiang, China

1
School of Landscape Architecture, Zhejiang A & F University, Hangzhou 311300, China
2
School of Hospitality and Tourism Management, University of Surrey, Guildford GU2 7XH, UK
*
Authors to whom correspondence should be addressed.
These authors contributed equally to this work.
Sustainability 2023, 15(1), 143; https://doi.org/10.3390/su15010143
Submission received: 20 November 2022 / Revised: 14 December 2022 / Accepted: 20 December 2022 / Published: 22 December 2022

Abstract

:
The sustainable development of tourism is essential for revitalizing historically and culturally significant ancient villages in China. Despite the longstanding recognition of the relationship between the spatial distribution of village destinations and their sustainable development, there is a dearth of longitudinal studies in village tourism. Using the geographic information system (GIS) spatial analysis method and the exploratory spatial data analysis model, this study explored the spatial-temporal features of ancient village tourism over three important time nodes of rural tourism development (in Zhejiang, China), as well as the contributing factors at both the provincial and prefectural city levels. The findings of this study suggested a spatial inequality in the distribution of ancient villages, in terms of tourism development over time. In particular, tourism development was clustered in the southern region, with a noticeable spillover effect. Meanwhile, transportation, source markets, and physical topography are essential factors contributing to this spatial distribution. The study contributes to ancient village tourism development literature and offers meaningful, practical implications for regional governments and business investors.

1. Introduction

Rural tourism is a critical segment of tourism, due to its tremendous economic and social impacts on the destinations [1]. It is also regarded as a vigorous and sustainable development path. It employs rural inhabitants and involves recycling and revalorizing existing rural infrastructure and heritage resources as tourist accommodations and attractions [2]. By its nature, rural tourism encourages joint ventures, cooperation, partnership, solidarity which, when turned into action, are at the heart of the sustainable development of rural areas [3]. The popularity and growth of rural tourism are being driven by an increased desire for urban residents to enjoy the natural scenery, peaceful countryside life, authentic rural culture, and escape from routine lifestyles [4,5]. Despite its relatively late start, China’s rural tourism has experienced a rapid growth in the past two decades. In 2019, this sector generated CNY 850 billion revenue (about USD 131.7 billion), with 3.2 billion tourist arrivals [6]. In the meantime, the rural tourism development in China is not balanced; it is heavily centered around the coastal regions. Zhejiang Province is the model destination of rural tourism development in China, experiencing unprecedented growth since 2006. For instance, the average annual growth of rural tourism revenue was 21.23% from 2016–2018 (Figure 1), and tourist arrivals have increased from 0.28 billion in 2016 to 0.4 billion in 2018, with total revenue achieving CNY 42.77 billion (about USD 6.63 billion) [7]. According to the Report of China Rural Tourism Development Index in 2016, Zhejiang Province was placed first in China, based on the index of the maturity of the rural tourism sector, which is comparable to the leading foreign rural tourism destinations in Sweden, France, and Spain [8].
A significant component of rural tourism in China, especially in the southeastern regions, such as Zhejiang, is ancient village tourism. Ancient villages are “living heritage” sites [9], referring to rural settling areas as preserving a long history of residential structures, tangible culture, and intangible culture (e.g., arts and crafts, rural customs, and regional character) [10,11,12]. However, the large-scale rapid urbanization process in China has put many ancient villages at risk, and many are disappearing [13]. Since 2002, the Chinese government has introduced policies to help preserve and revitalize ancient villages, such as the Protection of Cultural Relics (amended in 2002) and Regulations on Protection of Famous Historical and Cultural Cities, Towns and Villages (2008), thus recognizing ancient villages as cultural heritage sites [9,13]. Many ancient villages started to develop touristic profiles, hosting many famous tourist attractions, such as Zhuge Village and Guodong Village, leading to the increasing recognition of tourism as an effective way of developing the ancient tourism economy and preserving unique cultures [13,14].
Dually driven by the government and market demands, research on ancient village tourism has attracted growing attention [13,14,15,16,17]. However, most research on ancient village tourism has been centered on tourism planning [18,19], tourism sustainable development and impact [20,21,22], tourist experiences and behaviors [23,24], and residents’ attitudes [25,26]. While all these aspects are important to study, limited research attention has been devoted to the spatial cluster issue of ancient villages [27]. However, the sustainable development of the rural tourism industry in a destination is closely related to the merits of the spatial structure of tourist attractions. Spatially clustered attractions can enjoy economies of scale, increased efficiency, and spillover of knowledge and innovation [28], offering competitive advantages. In addition, the spatial distribution of tourist attractions could directly affect tourists’ movement patterns and time spent in the cluster of destinations, thus influencing the sustainable development of rural destinations and allocating resources [29]. Ancient village attractions, as an important part of rural attractions, have increasingly become a basic guarantee for the sustainable development of rural areas by serving as an effective catalyst of the conservation and regeneration of rural society and rural culture. Among the few studies devoted to this issue, most are cross-sectional and used national-level data [30], featuring early pioneers of ancient villages that participated in tourism development. However, such studies should be paired with temporally detailed analyses that capture local and regional scales [31]. Due to the differences in geographical, economic, and cultural backgrounds of different regions, spatial patterns of rural tourism show distinct regional characteristics. Ancient villages may display distinctive spatial features, compared to other types of rural tourism destinations, because they are often located and preserved in mountain areas. In addition, ancient village tourism in Zhejiang Province currently lacks the preplanning and necessary market investigation to achieve the optimal spatial structure.
The previously mentioned research is not only theoretically significant but also practical and meaningful. Therefore, this study aims to analyze the spatial-temporal distribution features and spatial autocorrelation patterns of ancient village tourism by using the example of China’s Zhejiang Province. In addition, comparing the spatial-temporal distributions of ancient village tourism in 2016, 2018, and 2020, using the geographic information system (GIS) and the exploratory spatial data analysis model (ESDA) methods, it is also aimed to identify the factors contributing to the convergences in the spatial distribution of ancient village tourism. This study offers important theoretical and practical implications. First, the research expands the issue of the spatial clustering of tourist attractions to the contexts of ancient villages, as well as the analysis, therefore, the paper includes spatial and temporal dimensions, both at the meso (provincial) and micro (prefectural-level city) levels, thereby obtaining a holistic picture. Second, given that rural tourism has become an important player in the national and regional economies, leading to poverty reduction for economically disadvantaged populations [13], the findings of this study can help tourism operators and stakeholders when making decisions, by enhancing their understanding of ancient village tourism spatial distribution patterns. Third, as the pioneer and a model destination of rural tourism development in China, the distribution of ancient village destinations in Zhejiang Province could further guide other provinces to develop rural tourism in ancient villages.

2. Literature Review

2.1. Ancient Village Tourism Development in China

Ancient villages are basic economic and social units of rural China with a distinctive scenery and unique culture. However, in recent years, rural areas in China, including Zhejiang Province, have gone through a severe crisis, and traditional agriculture and rural culture are disappearing or undergoing assimilation, due to the accelerated urbanization and modernization [13]. In 2003, the concept of the “historic-cultural village” was proposed when the first national list was jointly released by China’s Ministry of Housing and Urban-Rural Development (MOHURD) and the National Cultural Heritage Administration (NCHA). The effort to protect ancient villages has been reinforced and has attracted national attention. Moreover, in late 2012, the concept of “traditional villages” was established and the first national list was released. By April 2020, there were seven lists of “national historic-cultural villages” and five lists of “national traditional villages,” totaling more than 7000. These ancient villages contain abundant and distinctive cultural, architectural, historical, and artistic values. However, due to the accelerated urbanization, more rural residents in China have abandoned their dwellings and lands and moved to urban areas for a better income, education, and medical services. As a result, an increasing number of ancient villages have turned into “ghost towns.” The question of how to revitalize ancient villages has become a hot topic in China.
Unlike cultural relics, ancient villages are living heritage sites [9]. If they fail to adapt from the sole dependence on traditional agriculture to a wide range of socio-economic activities, such as tourism and modern agriculture, these ancient villages will eventually fall into decay. Saxena et al. [32] and Ciolac et al. [33] stated that one of the most important functions of rural areas, especially in the mountainous regions where ancient villages are usually located, is to facilitate recreation, tourism, and leisure activities. Combining rurality with tourism has been regarded as a significant driving force worldwide, as it has the potential to combat economic recessions, increase rural populations, promote cultural development, and enhance the local pride and quality of life in rural communities [2,34,35]. A study by Ponce et al. [36] indicated an inverse and statistically significant relationship between tourist activities and regional poverty in Ecuador. In China, the government is also aware of the values of ancient villages and the problems they face, consequently encouraging locals to develop rural tourism [13]. An increasing number of ancient villages have since evolved into destinations for tourists. The last 30 years have witnessed unprecedented growth in the supply of village destinations in China. According to a report by the China Tourism Academy [37], more than 12,000 A-grade tourist attractions have been established as of 2020, over half of which are located across the vast rural areas of China with 1199 national key rural tourism villages and 1000 national model villages of rural tourism. In addition, a range of village destinations has been created on the provincial level. For example, over 1000 villages were formally designated A-grade scenic villages in Zhejiang Province during the last five years. However, village tourism in China has not been widely studied. Questions, such as how those village destinations are spatially distributed on the different geographic scales and the contributing factors involved, remain unanswered, thus necessitating further research.

2.2. Spatial Analysis in Tourism

Prior research suggested that there is a close relationship between the spatial distribution of tourism resources and the sustainability of tourism development [38], which is the fundamental pursuit of regional tourism development [39]. The optimal allocation of tourism resources in the geographic space can maximize the total surplus of tourism-related enterprises, achieving the tourism economy of scale in a specific region and creating a strong cluster effect [40]. In addition, Jackson and Murphy [28] asserted that geographic concentrations of tourism-related firms, such as tourist attractions, have increasingly become contributing forces for sustainable tourism development, high economic success, and spillover knowledge and innovation. These firms are also a manifestation of the development of the tourism industry in the region [41]. A study by Jin et al. [41] further indicated that industrial clusters significantly influenced the destination attractiveness. Similarly, Enright [42] argued that clustering has a positive, significant impact on corporate performance, regional economic development, and destination competitiveness. Thus, a complete understanding of the spatial distribution structure of rural destinations has an important guiding significance for policy initiatives and tourism-related planning and strategies, in a given region.
Against this background, more studies began to focus on the spatial patterns of rural tourism destinations across different regions. Lee et al. [27] measured the spatial centralities of tourism villages in Korea from a small-scale perspective by using geographic information system (GIS) and a network analysis. Thus, the core, sub-core, and connection villages were identified and an integrated tourism strategy was proposed. Nepal [31], in examining the growth and development of rural settlements affected by tourism in Nepal’s Annapurna region, found a hierarchical structure of rural settlements with a core and peripheral traits. Zhang and Meng [30] used the spatial analysis method in GIS (i.e., the nearest neighbor tool and geographical concentration index), to analyze the policy effect on the spatial distribution pattern of “national leisure agriculture and rural tourism demonstration counties” in China. They found that these counties are concentrated in provincial capital cities. Dhami and Deng [43], in their study on the linkage between rural tourism clusters and travel/tourism-generated revenues in West Virginia, USA, classified rural tourism clusters at the county level and spatially analyzed the relationship between the recreation opportunity spectrum classes and tourism spending. In Huang et al.’s [44] study on the spatial structure of rural tourism in Hubei Province, the urbanization level was identified as the most significant contributing factor.
These studies provide significant insights to better understand the spatial structure of rural tourism destinations. However, the current research on the spatial structure of ancient village tourism is relatively lacking, which cannot explain the evolutionary trends of the rural economy and the revitalization of rural culture, as tourism has been widely recognized as an essential approach for China’s ongoing rural vitalization strategy [29]. In addition, there is a lack of research on the spatiotemporal features of village destinations, and most relevant studies are cross-sectional, rather than longitudinal, to reflect changes over time, leaving a crucial research gap that needs to be filled. Further, current studies mainly focus on the effect of policy and the urbanization level on the spatial structure of rural destinations, while very few studies take geographic elements into consideration. As for the analysis methods, GIS is regarded as a valuable tool for investigating the spatial phenomena of tourism and is widely adopted by most existing studies. Lastly, the application of spatial statistical techniques, such as the exploratory spatial data analysis (ESDA) and GIS, in the Chinese context, is very limited. Therefore, the province-level and city-level data in the three time nodes and the spatial tools adopted in the present study are more likely to unveil the spatial distribution feature and its contributing factors in a more reliable and precise way.

3. Research Method

3.1. The Study Context

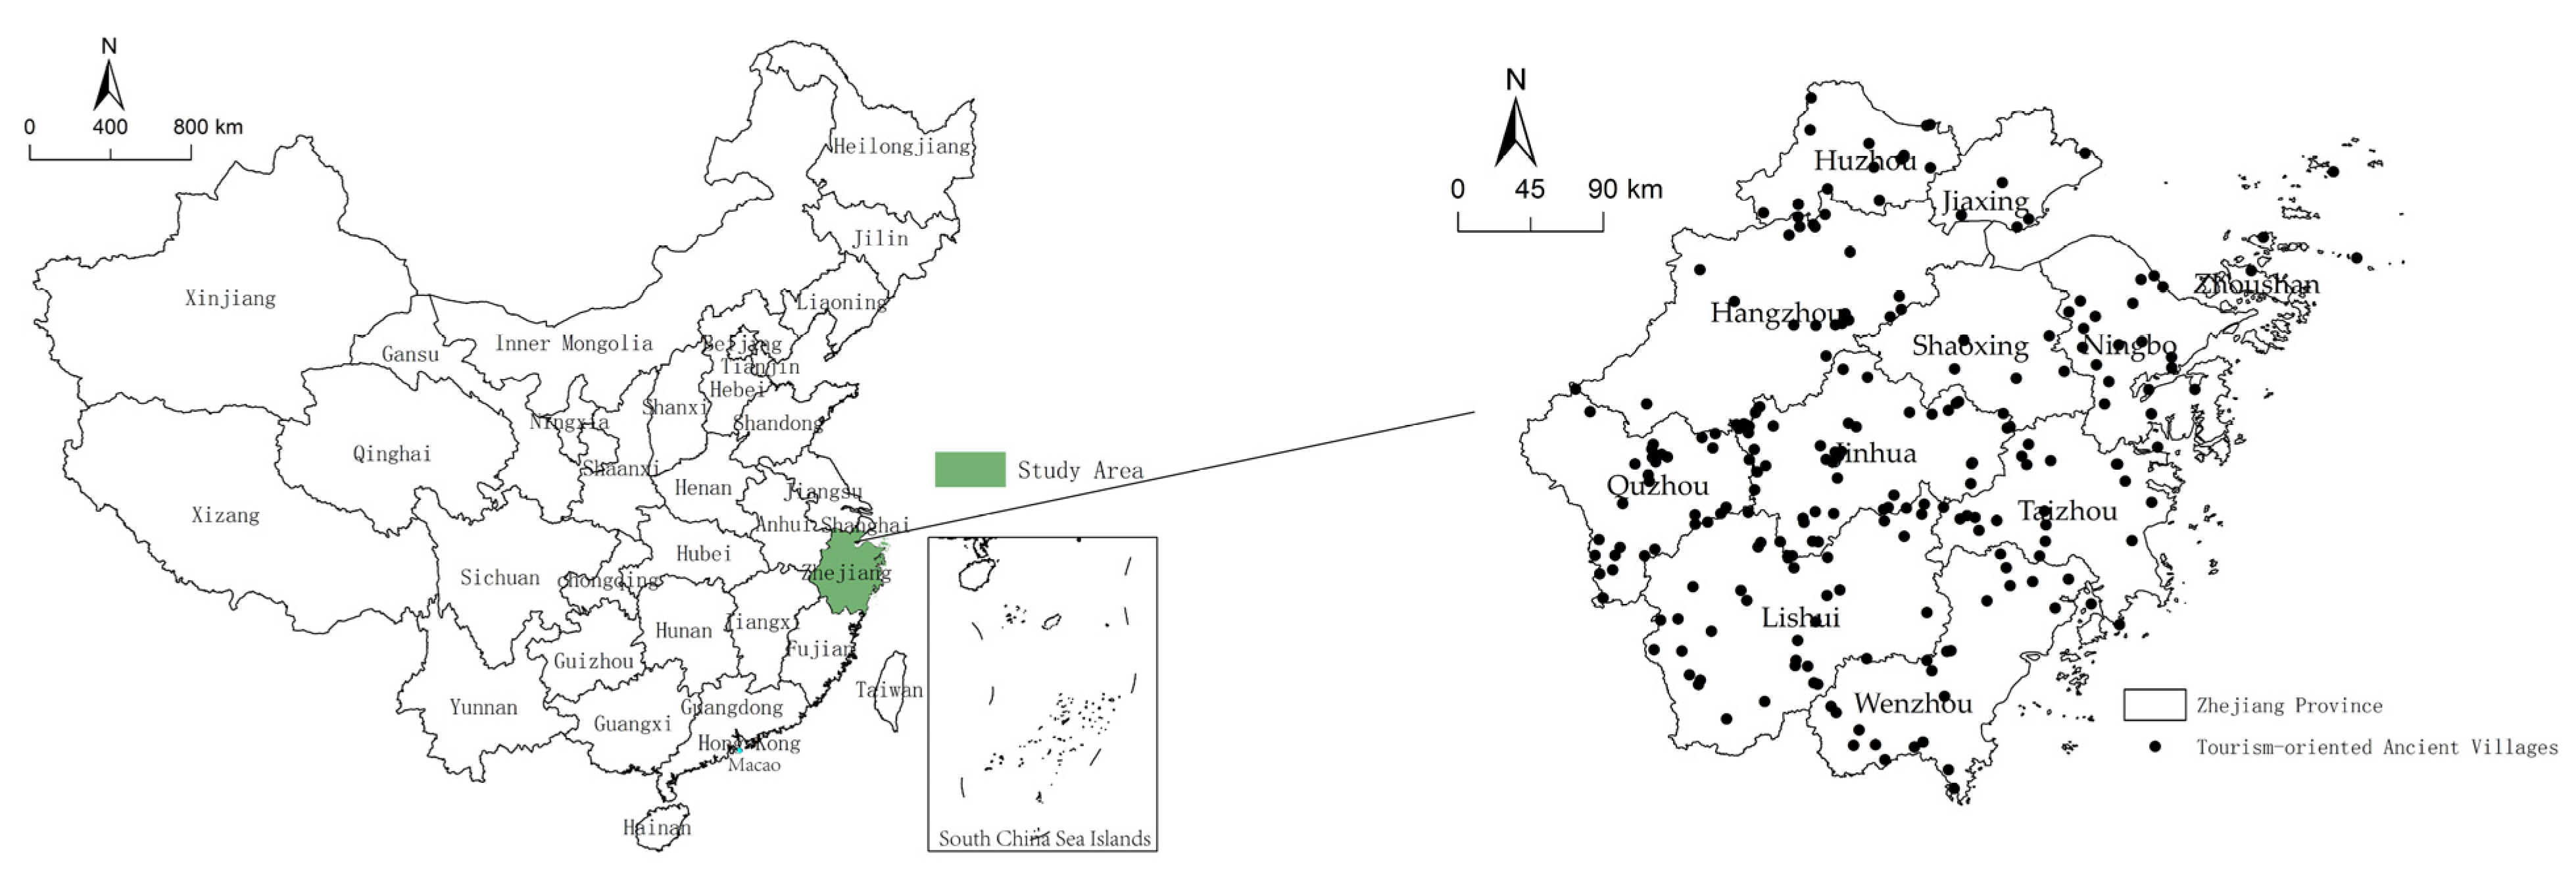
This study chose Zhejiang Province, one of the earliest and most popular rural tourism destinations with various choices of ancient village tourism in China, as its analytical site. Zhejiang, located in the southeast coastal area of China, has 105,500 square kilometers and eleven prefectural-level cities, representing the most developed province in China (Figure 2). Most (74.63%) of the area in Zhejiang Province consists of mountains and hills, which helps to protect ancient villages from disappearing, due to urbanization and modernization. By April 2020, Zhejiang Province boasted 44 national historic-cultural villages and 636 national traditional villages, ranked top third and fourth in China, respectively. In addition, the first list of provincial historic-cultural villages was officially released in 1999 by the People’s Government of Zhejiang Province. In 2017, the first list of provincial traditional villages was announced by the Department of Housing and Urban-Rural Development of Zhejiang Province. By April 2020, there were six lists of provincial historic-cultural villages and one list of provincial traditional villages, including 943. Following the removal of duplicates, the total of national and provincial ancient villages comes to 1093. In this study, the concept of ancient villages refers to the historic-cultural villages and traditional villages, officially designated at the national and provincial levels. Among those ancient villages, 228 have developed into rural tourism destinations and are used for the analysis in the present study.

3.2. Data Sources

Ancient village tourism in Zhejiang Province in 2016, 2018, and 2020 was selected for the analysis in the present study. The reasons for choosing the previously mentioned data are as follows. First, these three time nodes are consistent with the beginning, middle, and closing years of the 13th Five-Year Plan of Tourism Development in Zhejiang Province, which highly promotes rural tourism. This can be used to compare the changes in the tourism development in ancient villages before, during, and after the implementation of the five-year plan. Second, 2020 is the second year that the People’s Government of Zhejiang Province implemented the comprehensive tourism development plan of Zhejiang Province (2018–2022), which proposed to develop 10,000 A-level scenic villages by 2022. This is a crucial node for the rural tourism development, especially for village tourism in Zhejiang Province. Therefore, these three years can be regarded as appropriate for exploring the spatial distribution of ancient village tourism in Zhejiang Province.
The original data on the national historic-cultural villages and national traditional villages in Zhejiang Province were obtained from the official website of the Ministry of Housing and Urban-Rural Development of the People’s Republic of China, while the data on the provincial historic-cultural villages and provincial traditional villages in Zhejiang Province were retrieved from the website of the People’s Government of Zhejiang Province. Then, the officially announced provincial lists of A-level scenic villages, leisure tourism demonstration villages, and distinctive nongjiale villages (which is a distinctive form of rural tourism in China) in Zhejiang Province, and the officially released lists of national A-level scenic areas, national distinctive tourism towns and villages, and national leisure agriculture demonstration sites and rural tourism demonstration sites in China were used to screen out the sample villages from the above-mentioned ancient villages. As a result, 106 ancient village tourist destinations in 2016, 183 in 2018, and 228 in 2020, were identified for further analysis. Their geographic coordinates were calculated using Baidu Maps (a web mapping service similar to Google Maps provided by Baidu in Beijing, China) and an API coordinate picker. The point data coordinates were imported into the software of ArcGIS 10.4 and Geoda, and the spatial distribution characteristics and spatial correlation features of the points were further analyzed in the above three time periods.

3.3. Data Analysis

3.3.1. Average Nearest Neighbor Index

The average nearest neighbor index, proposed by Clark and Evans [45], is an effective spatial measurement often employed to explore the spatial distribution types of geographic points [46]. It assumes that the points are randomly distributed and that the distance and the nearest neighboring distance between the points accord with the normal distribution. The expected value of the average of the nearest neighboring distance is expressed as follows:
D ¯ r = 1 N / A
where, N represents the total number of points in the research region and A is the area of the research region.
The average nearest neighbor index R is the ratio of the average value of the actual nearest neighboring distance to the expected value of the points in the research region, calculated as follows:
R = D ¯ o D ¯ r = 2 D ¯ o N / A
The value of R usually equals to or above 0. When R = 1, the spatial distribution of points is random; when R > 1, the points in the space are mutually exclusive and distribution tends to be dispersed; when R < 1, the points are close to each other in the space and distribution tends to be aggregated [47].

3.3.2. Kernel Density Estimation

The kernel density estimation is a statistical method often used to identify the location of the clustered distribution areas of the geographic points. It centers on a specific point’s location and distributes the properties of the point within a specified threshold range. The largest density is at the center and then decreases with distance, gradually to zero [48]. It is defined as follows:
f ( x ) = 1 n h i = 1 n K ( x x i n )
where f(x) is the probability density function, K() is the kernel function, h is the search radius, n is the number of points, and (x − xi) is the estimated distance between point x and xi.

3.3.3. Standard Deviational Ellipse

Proposed by Lefever in 1926, the standard deviational ellipse (SDE) is typically employed to quantitatively delineate the geographical distribution trend of the features concerned by summarizing both their orientation and dispersion (or concentration) [49]. The SDE has served as an important GIS tool for describing the spatial attribute information of the observed samples and generally consists of the rotation angle θ, the standard deviation along the major axis, and the standard deviation along the minor axis. The rotation angle θ is the angle between the X- and Y-axis of the Cartesian coordinate system and the principal axis of the clockwise rotation after rotating at an angle, according to the geographical orientation of the point set, which is calculated as follows:
x i   =   x i x w m c ;   y i   =   y i y w m c   t a n θ = ( i = 1 n w i 2 x i 2 i = 1 n w i 2 y i 2 ) + ( i = 1 n w i 2 x i 2 i = 1 n w i 2 y i 2 ) 2 + 4 ( i = 1 n w i 2 x i 2 y i 2 ) 2 2 i = 1 n w i 2 x i y i   δ x = i = 1 n ( w i x i cos θ w i y i sin θ ) 2 i = 1 n w i 2     δ y = i = 1 n ( w i x i sin θ w i y i cos θ ) 2 i = 1 n w i 2
where x i and y i are the relative coordinates of the points from the center of gravity of the region, according to t a n   θ , the angles of rotation of the elements can be gained, and δ x and δ y are the standard deviations along the X- and Y-axis, respectively.

3.3.4. Exploratory Spatial Data Analysis Model (ESDA)

The exploratory spatial data analysis model (ESDA) is a statistical method often adopted to analyze the autocorrelation in the space of tourism development [38,50]. It provides two measures: global and local spatial autocorrelations, which are fundamental to delineate the features of the spatial attribute distribution. The global one is typically employed to identify the distribution features of the geographic points in the whole region, while the local one is generally used to explore the distribution in the different particular regions over space. The global spatial autocorrelation could be measured by Global Moran’s I index [51], which is defined as follows:
I = n S 0 · i = 1 n j = 1 n W i j Z i Z j i = 1 n Z i 2
where n represents the total number of points, Zi is the deviation of the attribute of point i from its average value ( X i X), Zj is the deviation of the attribute of point j from its average value ( X j − X), s is the aggregation of all space weights, and W i j is the spatial weight matrix (W) defining the proximity between units i and j. W is usually row standardized for the lattice data. Global Moran’s I usually takes a value between −1 and 1. When 0 < I < 1, it suggests the spatial clustering of similar values, whereas when −1< I < 0, it indicates that the high values tend to be near the low values. A value of 1 and −1 means a perfect positive and negative spatial autocorrelation; 0 reveals no spatial autocorrelation.
The global spatial autocorrelation analysis fails to examine the regional spatial correlations in the different geographic regions [52]. The local autocorrelation analysis could be performed to identify the specific cluster patterns in regions by the local indicators of spatial autocorrelation (LISA) [53]. The LISA cluster map intuitively shows four spatial patterns, as follows. The high-high agglomeration means that the regions reporting a high value on a variable (say the number of ancient villages) are surrounded by regions that represent a high value on it; The low-low agglomeration indicates that the regions reporting a low value on a variable are located close to the regions with a low value on it. The high-low agglomeration indicates that the regions with a high value on a variable (say, the number of ancient villages) are surrounded by regions with a low value on it, while the low-high agglomeration shows that the regions with a low value on a variable are surrounded by regions with a high value.

3.3.5. Buffer Analysis

The buffer analysis is widely recognized as one of the most important spatial analysis tools used to solve the proximity problems. It refers to creating a buffer polygon layer within a particular width range, based on points, lines, and surface entities, then superimposing that layer with the target layer to obtain the desired results [24,54]. Here, the buffer analysis was used to analyze the impacts of transportation, source market, and topography, on the spatial distributions of Zhejiang’s ancient village tourism.

4. Results and Discussion

4.1. Distribution of the Ancient Village Tourist Destinations in 2016, 2018, and 2020

4.1.1. Spatial Distribution Patterns

The average nearest neighbor analysis was performed to explore the distribution pattern of the sample villages in Zhejiang Province. The results showed that the average nearest neighbor index (ANNI) value of the sample villages in 2016 was 0.7433, then slightly increased to 0.8085 in 2018. Finally, it dropped to 0.7513 in 2020. All values of the ANNI were less than 1, suggesting an aggregated distribution pattern of the sample villages and exhibiting significant regional differences during the study period.
As for the distribution pattern of the sample villages in eleven prefectural-level cities (Table 1), three out of eleven, including Hangzhou, Quzhou, and Wenzhou, indicated a clustered pattern with the ANNI value ranging from 0.80748 to 0.98607, in 2016. Hangzhou was the most clustered region with the lowest ANNI value (0.80748). In 2018, the overall distribution pattern was quite similar to that in 2016. Hangzhou, Jinhua, and Quzhou showed an agglomeration structure with an ANNI value of less than 1. Quzhou appeared to be the most aggregated city with the lowest ANNI value (0.83864). In 2020, the number of prefectural-level cities with a clustered pattern distribution doubled, compared to 2016 and 2018, increasing to six. Among those, Jinhua appeared to be the most aggregated city with the lowest ANNI value (0.66109). In addition, all of the prefectural-level cities with clustered patterns were located in the south of Zhejiang Province, except Hangzhou, while the northern region gathered more prefectural-level cities with dispersed patterns. Overall, the level of aggregation in the eleven prefectural-level cities had increased from 2016 to 2020.

4.1.2. Spatial Clustering Structure

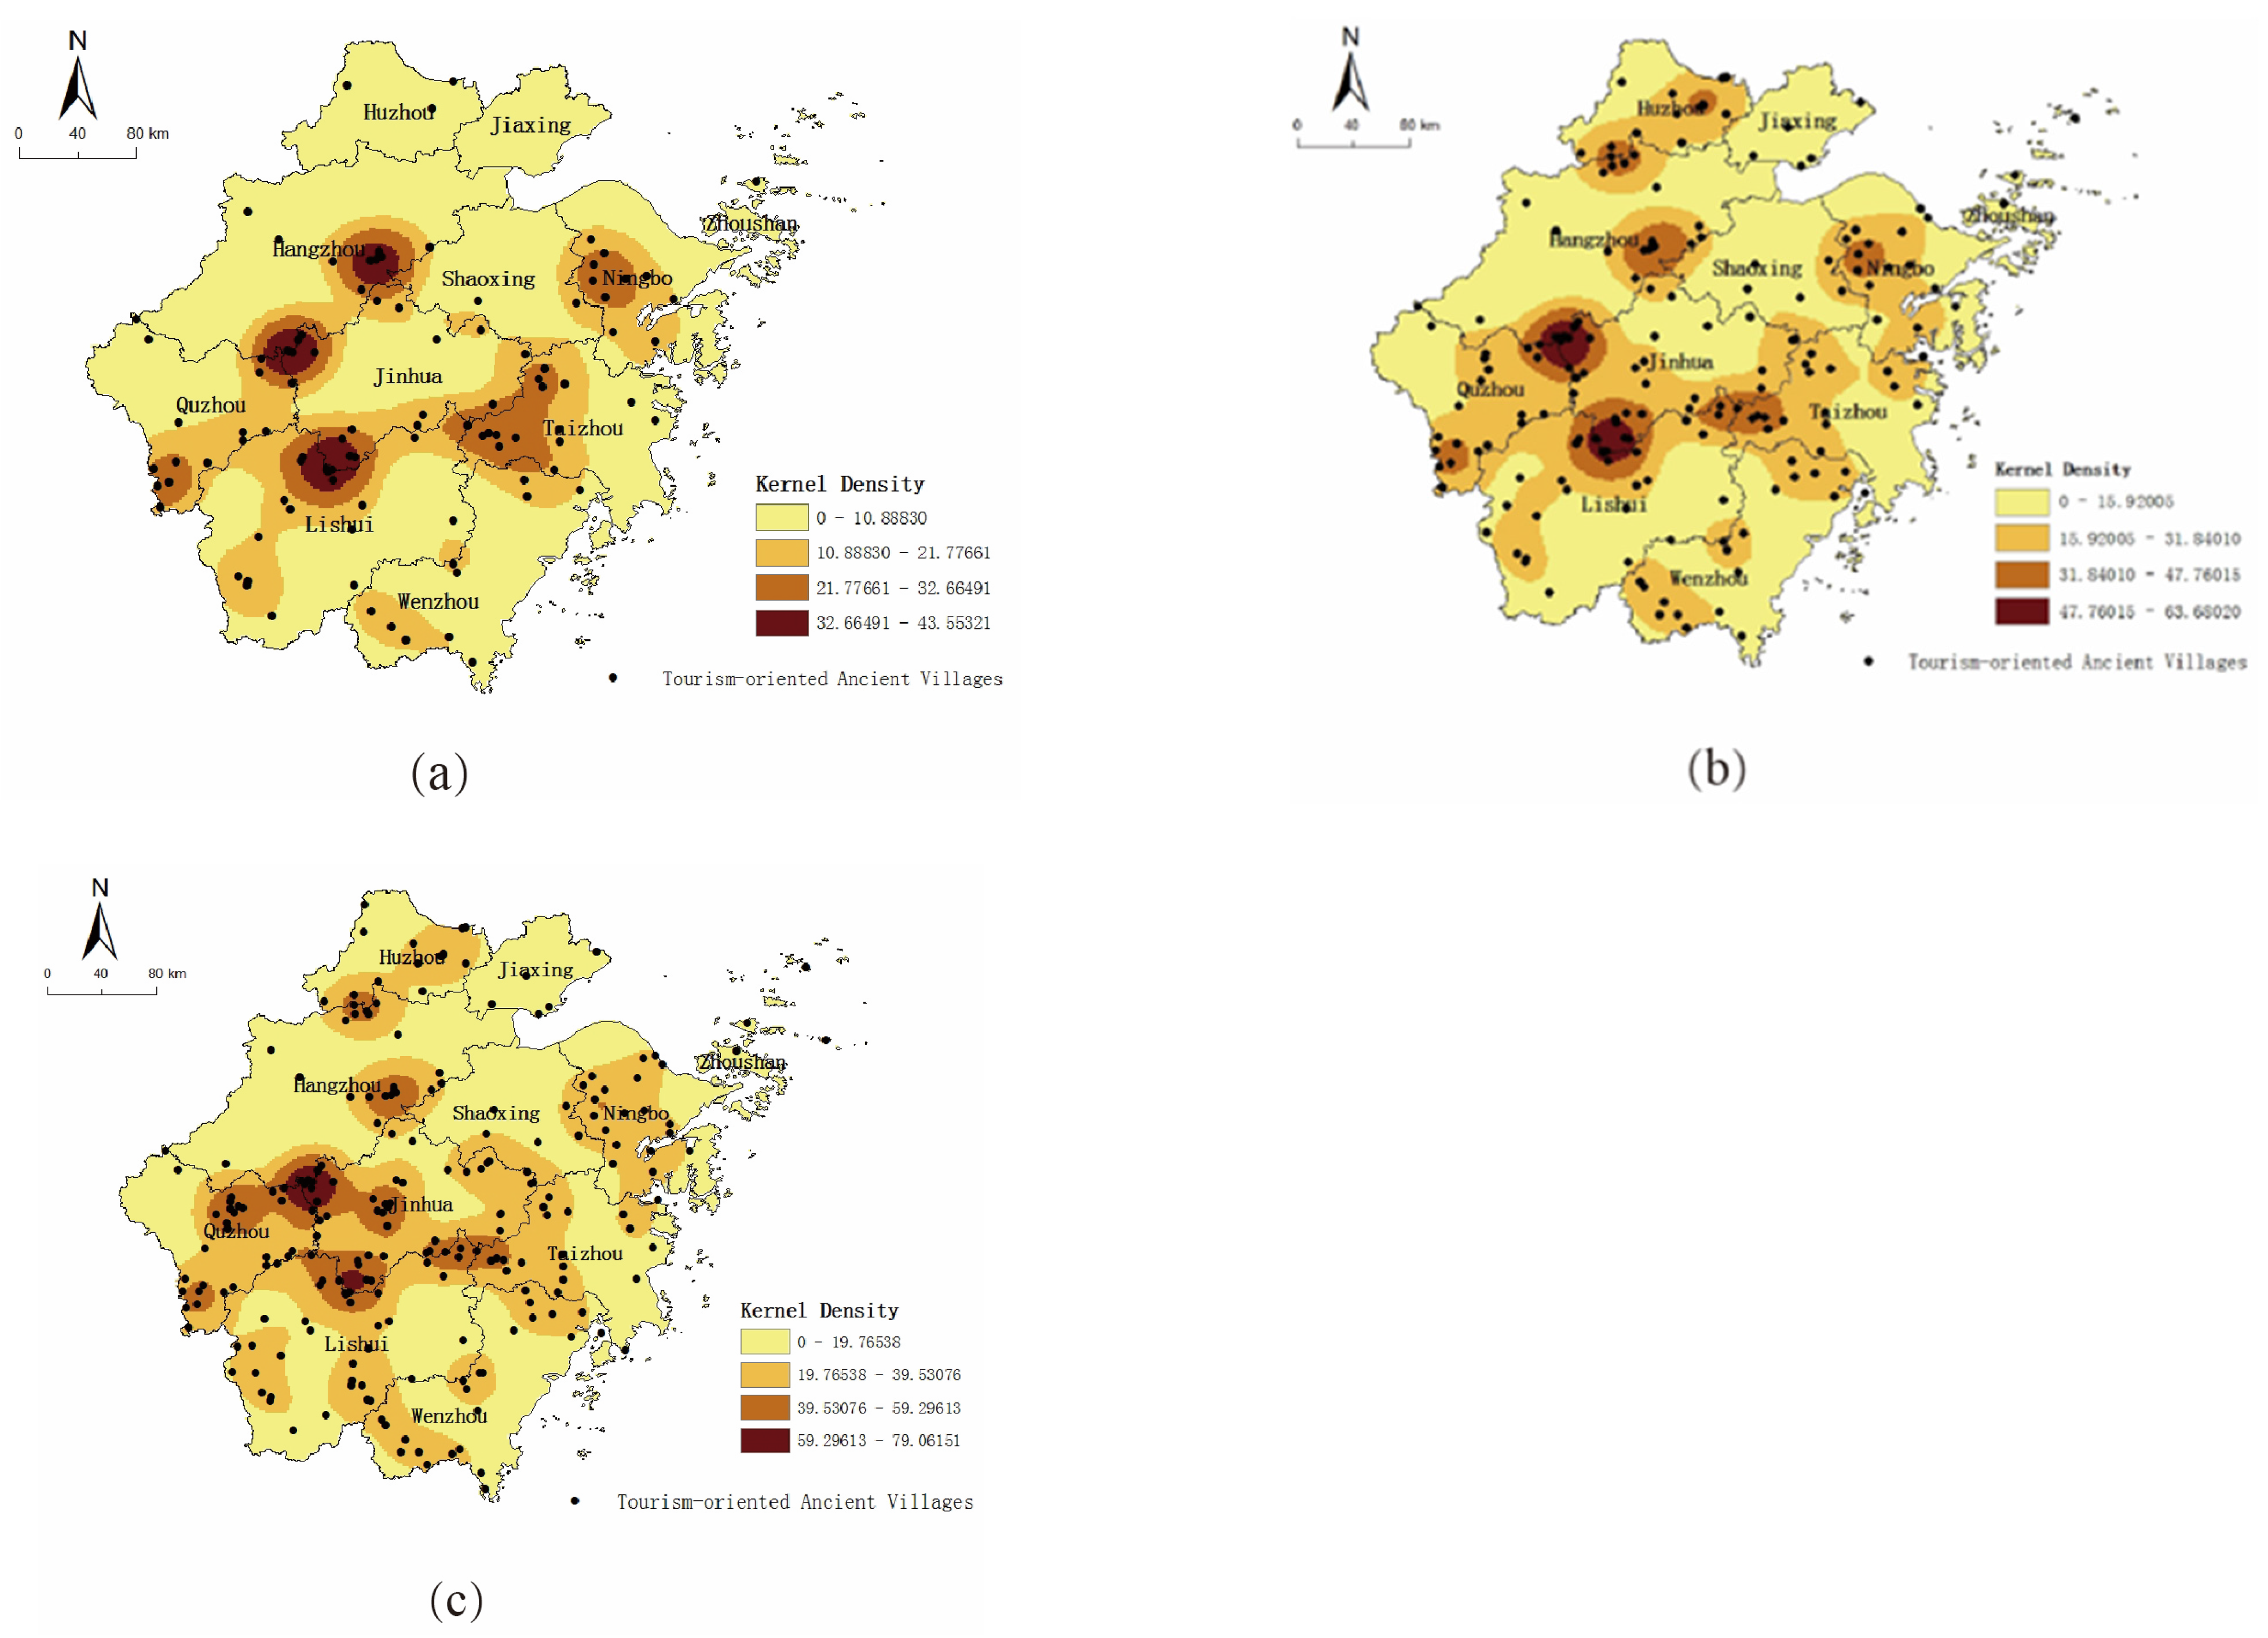
Figure 3 shows the kernel density estimation of the sample villages in 2016 (a), 2018 (b), and 2020 (c). In 2016, the spatial distribution of sample villages in Zhejiang Province presented an inclined H-shaped cluster structure with three main centers. The first clustered center was located in the east part of Hangzhou, and it directly extended to the junction zone of Jiande County in Hangzhou, Lanxi County in Jinhua, and Longyou County in Quzhou, where the second center formed. The third was situated in the junction zone of Wuyi County in Jinhua and Songyang County in Lishui. The moderately dense area consists of two axes connected to the third center: one extended toward the southwest areas in Zhejiang Province, including the east region of Quzhou and the central part of Lishui; the other spread directly to the west area of Taizhou. In addition, another moderately dense area was formed in the west region of Ningbo.
In 2018, the sample villages in Zhejiang Province presented a “one belt and multiple clusters” agglomeration structure. The three main clusters formed in 2016 were reduced to two in 2018, and the one located in the east part of Hangzhou had turned into a sub-cluster. Moreover, compared to 2016, the moderately dense area in 2018 was expanded significantly toward the middle part of Quzhou, the southwest region of Jinhua, and Taizhou in the northwest. At the same time, another moderately dense area was formed in the north of Zhejiang Province. Specifically located in the junction zone of the Lin’an District, Yuhang District in Hangzhou, and Anji Country in Huzhou, then further extended to the northeast region of Huzhou. In 2020, the agglomeration structure of the tourism villages in Zhejiang Province was quite similar to that in 2018, still representing a one belt and multiple clusters structure. The most densely distributed area was still in the junction zone of Hangzhou, Jinhua, and Quzhou. It then extended to the Keche District in Quzhou and the Jindong District in Lishui. Compared to 2018, the moderately populated areas in 2020 further expanded in two directions: one extending to the southern region of Lishui, the other toward the southern border of Shaoxing and Jinhua. In general, the expansion of the popular tourism villages in Zhejiang Province presented a southward trend. This suggests that an increasing number of ancient villages in Western Zhejiang, which are often economically underdeveloped, use tourism as a way to promote their rural economy.

4.1.3. Overall Evolution Features

With the help of ArcGIS software, the standard deviation ellipses method was performed to explore the spatial-temporal evolution pattern of the tourism villages in Zhejiang Province. The center of gravity and standard deviation ellipse of the sample villages in 2016, 2018, and 2020 are shown in Figure 4, and the parameters are indicated in Table 2.
The tourism villages in Zhejiang Province are spatially distributed in a northeast to southwest direction, and the rotation angle decreased from 48.3111° in 2016 to 33.1232° in 2018, then slightly more to 35.3528° in 2020. This was mainly due to the rapid development of rural tourism in ancient villages in Ningbo, Hangzhou, and Huzhou, from 2016 to 2018, which made the ellipse rotate counterclockwise. By observing the changes of the major and minor axes standard deviation in the study period in Table 2, it can be seen that both the minor axes standard deviation and major axes standard deviation increased from 2016 to 2018. Specifically, the minor axis’ standard deviation was increased by 6.808 km, while the major axis’ standard deviation was enhanced by 11.1996 km. Moreover, they remained stable with little change from 2018 to 2020. This suggested the distribution of tourism villages had an expansion trend geographically in both the east-west direction and north-south direction, from 2016 to 2018, while little expansion has been observed from 2018 to 2020. However, the north-south trend was a little more noticeable than the east-west trend, and the ellipse tended to be oblate in 2018 and 2020. Therefore, the directionality of the distribution of the tourism villages in Zhejiang Province had strengthened, and the distribution range had increased from 2016 to 2018.

4.2. Spatial Correlations of the Ancient Village Tourist Destinations in 2016, 2018, and 2020

4.2.1. Global Autocorrelation Analysis

To further explore the spatial connection of the sample villages, the Global Moran’s I value was calculated. The results showed that Moran’s I values in 2016, 2018, and 2020 were 0.149, 0.240, and 0.297, respectively, which were all greater than 0 and significant at the 5% level, suggesting a positive spatial spillover trend. Overall, the volatility of Moran’s I from 2016 to 2020 is evident, the agglomeration of ancient village tourism in Zhejiang Province is significant, and the trend showed an agglomeration distribution.

4.2.2. Local Autocorrelation Analysis

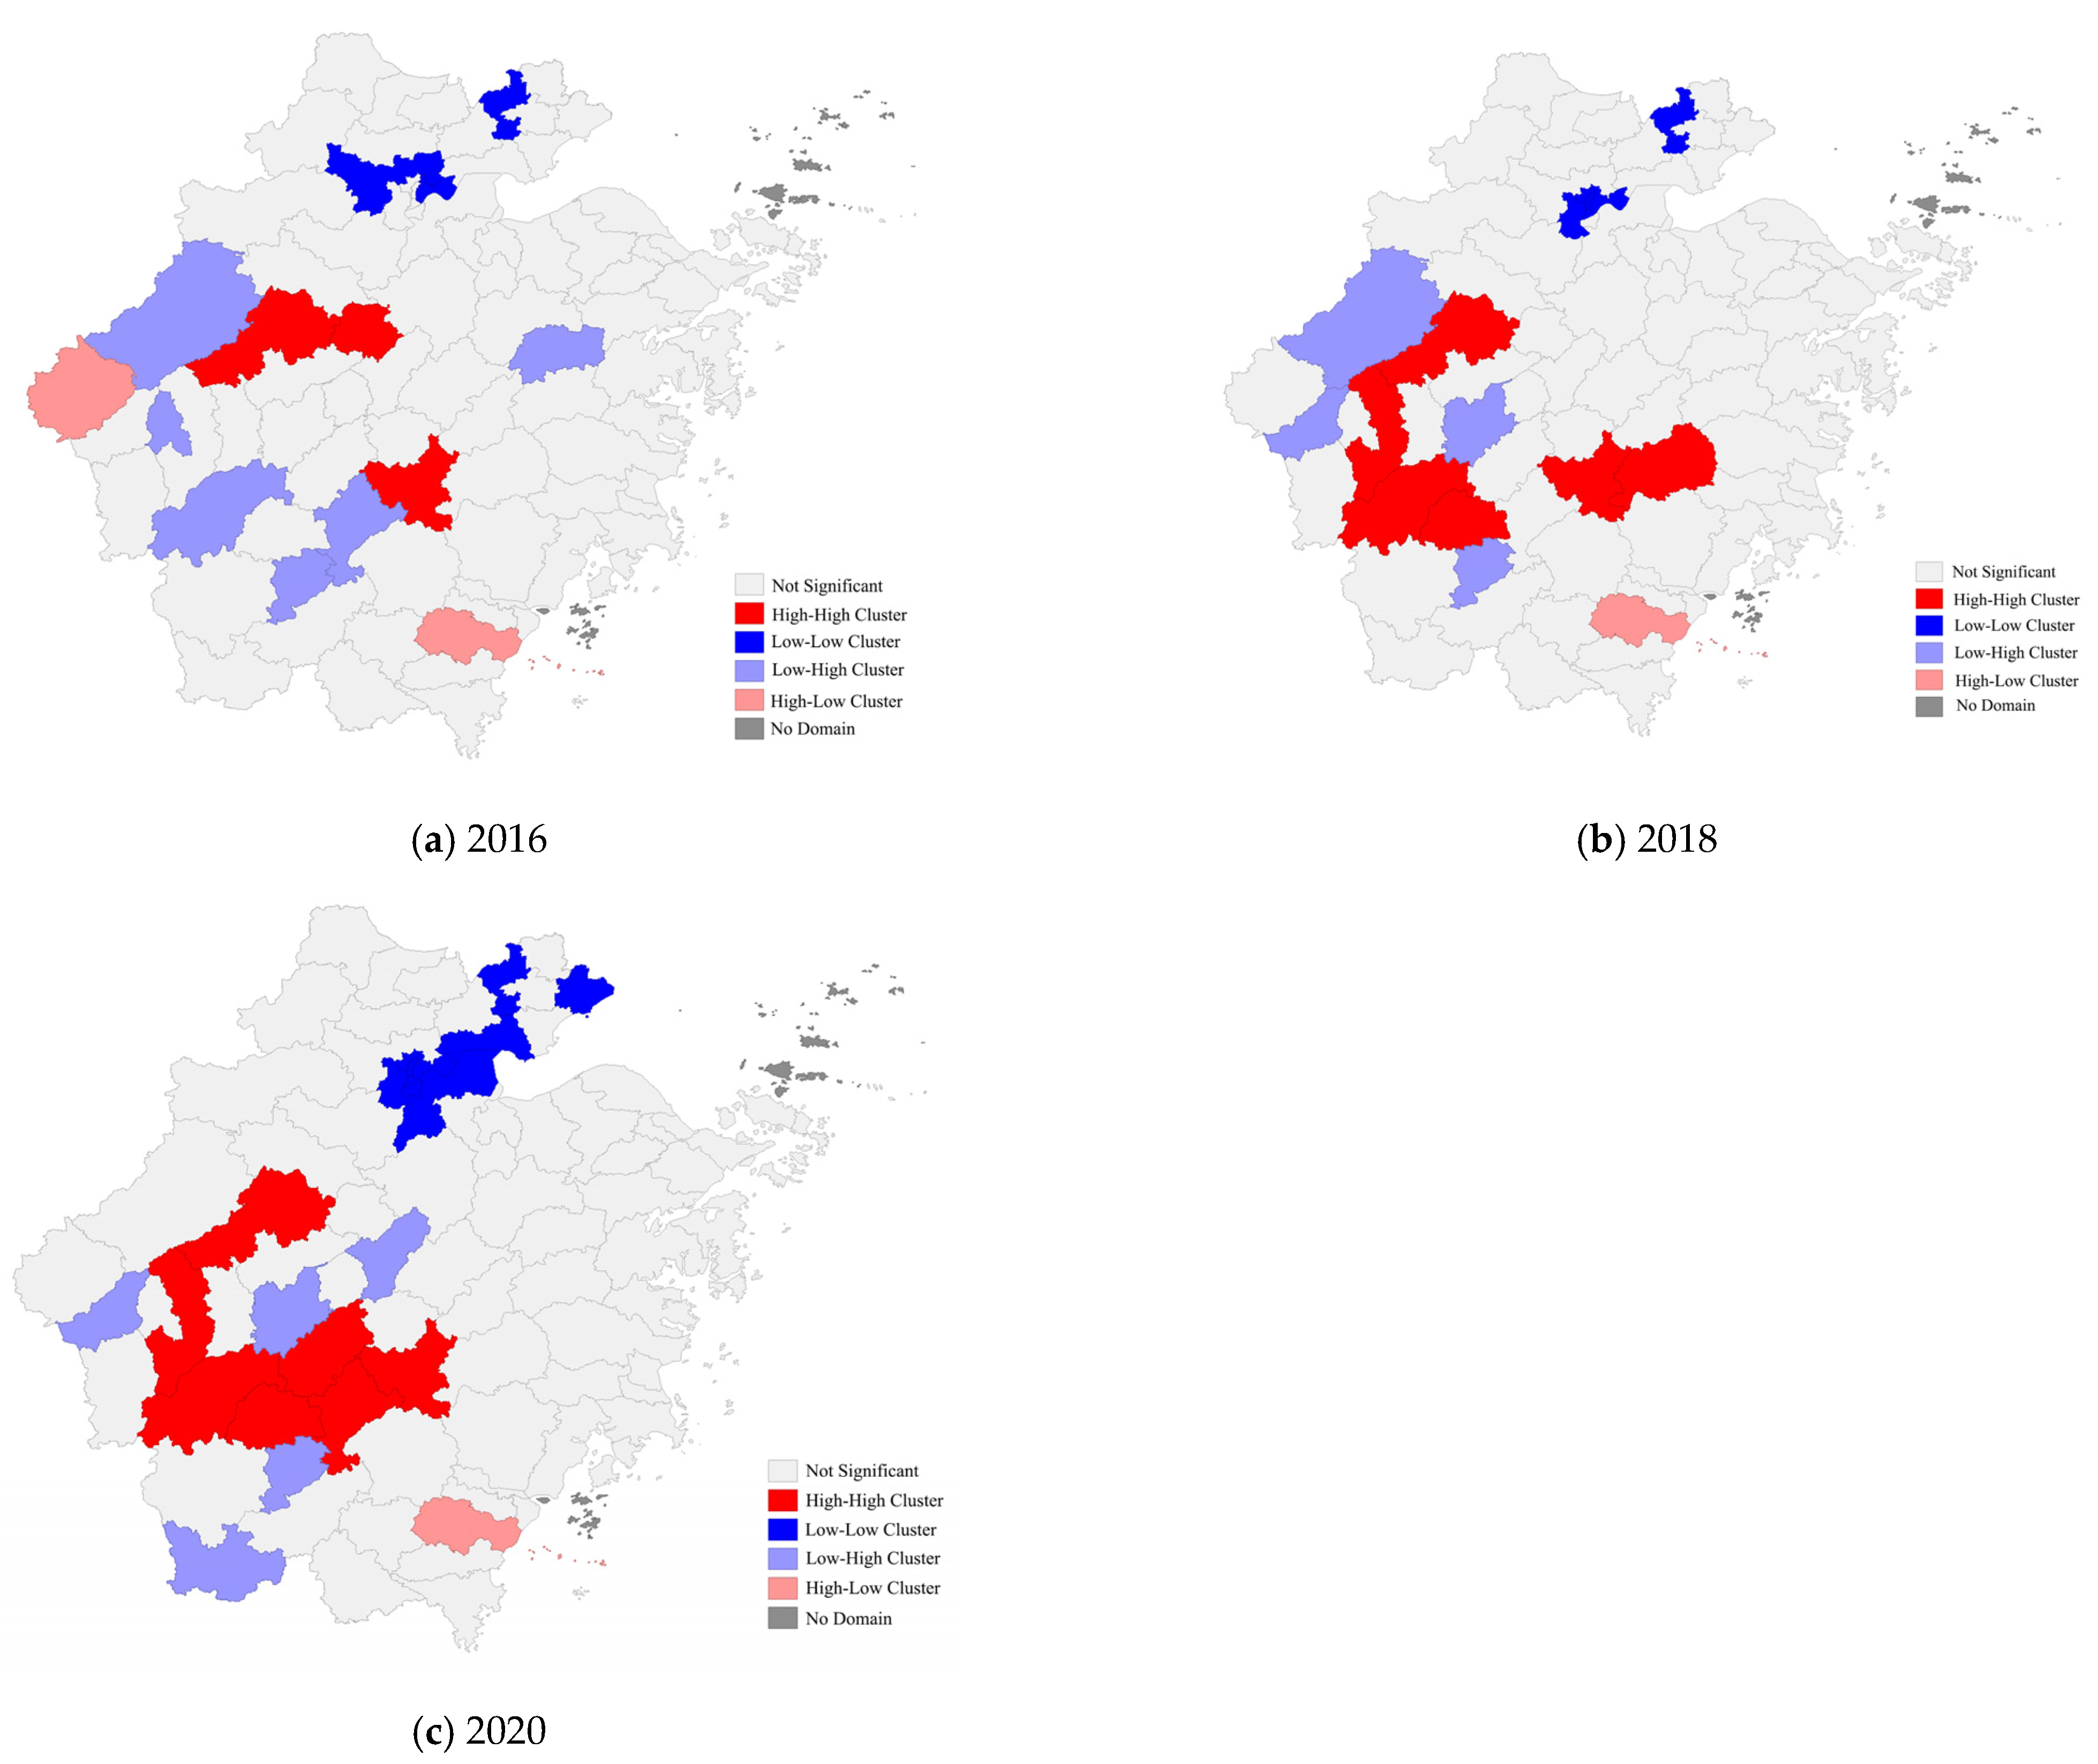
The LISA cluster maps in 2016 (a), 2018 (b), and 2020 (c) were drawn using GeoDa Software to reveal the spatial distribution of ancient village tourist destinations in local areas; the results are shown in Figure 5.
(1) High-high agglomeration. The areas with a high-high agglomeration pattern have many ancient village tourist destinations and a correspondingly high number of ancient village tourist destinations in the surrounding regions. They have small differences and close spatial links. They are the leading areas for the development of rural tourism in the ancient villages in Zhejiang Province. By observing Figure 5, the high-value agglomeration areas were relatively scattered in 2016 and mainly appeared in the central and eastern regions of Zhejiang Province, including Jiande City in Hangzhou, Pujiang County in Jinhua, and Jinyun County in Lishui. While in 2018 and 2020, the increasing areas presented a high-high cluster pattern, mainly in the southwest mountain region with a less developed economy such as the Qujiang District in Quzhou, Suichang County, Songyan County, Jinyun County in Lishui, and Xianju County in Taizhou. As Zhejiang Province attached more and more importance to rural the tourism development, many supporting policies and regulations were introduced between 2016 and 2018, leading to the rapid development of rural tourism in the period, especially in the southwest regions with a less developed economy. Overall, the spatial pattern of the high-high aggregation has an increasing trend.
(2) Low-low agglomeration. The regions with a low-low agglomeration pattern usually have a small number of tourism villages and a correspondingly small number of tourism villages in adjacent regions. In addition, the local spatial difference is small. Such areas are mainly distributed in the northern region with low altitudes, including Jiaxing and Hangzhou. From 2016 to 2020, the areas with a low-low agglomeration pattern were significantly increased from three to ten, accounting for 41.6% in 2020. The newly joined regions are mainly located in the northeast of Hangzhou and Jiaxing. Although the development of rural tourism was widely promoted by different levels of government in Zhejiang Province, the north region had limited ancient villages, due to its plain topography and high level of urbanization, which led to only a few ancient villages committing to the tourism development. In general, the low-low agglomeration pattern has been strengthened from 2016 and 2020.
(3) High-low agglomeration. Only two counties, namely Kaihua County in Quzhou, and Rui’an County in Wenzhou, in 2016, have a high-low agglomeration pattern, while Rui’an is the only county to exhibit a high-low agglomeration in 2018 and 2020. The number of tourism villages in those regions is higher than that of the surrounding areas, suggesting that the rapid development of rural tourism in those ancient villages has not led to a corresponding growth in the adjacent regions, and the spatial heterogeneity is apparent.
(4) Low-high agglomeration. The regions with a low-high agglomeration pattern are mainly scattered in the southwest regions of Zhejiang Province. From 2016 to 2020, the number of sample villages under the low-high clustering pattern was reduced overall, among which Changshan County in Quzhou, the Wucheng District and Yiwu City in Jinhua, and Qingyuan County in Lishui were newly appearing, while Chun’an County in Hangzhou, the Kecheng District in Quzhou, the Liandu District and Suichang County in Lishui, and Xingchuang County in Shaoxing were excluded in 2020. Those areas have a small number of tourism villages and are surrounded by regions with a high number of tourism villages. This indicates that the development of rural tourism in the ancient villages is less affected by their adjacent regions.
Overall, the proportion of regions with a high-high agglomeration pattern and a low-low agglomeration pattern increased from 42.9% in 2016 to 75% in 2020, showing an increasing trend in the club convergence during the research periods. Meanwhile, the regions with a high-high agglomeration pattern were mainly distributed in the western region, while the regions with a low-low agglomeration pattern had always been in the north. This is consistent with the real regional differences in the distribution of ancient villages in Zhejiang Province. From the quantitative transformation relationship perspective, the number of areas with a high-high agglomeration pattern and a low-low agglomeration pattern both increased significantly from 2016 to 2020. Moreover, the number of regions with a low-high agglomeration pattern and the regions with a high-low agglomeration pattern remained relatively stable, but the transformation from the low-high agglomeration to the high-high agglomeration also took place.

4.3. Contributing Factors to the Spatial Distribution of Ancient Village Tourist Destinations

4.3.1. Relationship between the Ancient Village Tourist Destinations and Transportation

A buffer analysis was utilized to inspect the effect of transportation on the spatial layout of Zhejiang’s ancient village tourist destinations. The buffer radius of the main roads, secondary roads, and branch roads was set at 9 km, 6 km, and 3 km, respectively. Once the buffer range of a roads was obtained, the sample villages in the area were intersected with the buffer ranges of different grades (intersect), and the distribution map of the buffer zones within the different roads was generated (Figure 6). Most of the sample villages were geographically distributed throughout the vicinity of the road or at the intersection of the road. Specifically, there were 182 sample villages within the branch road buffer, representing the maximum (Table 3) and accounting for 79.82% of the total. The number of sample villages within the main road buffer and the secondary road buffer is quite similar, accounting for 57.46% and 52.63% of the total, respectively. This suggests that the road network spatially shapes the layout of the tourism villages in Zhejiang Province.

4.3.2. Relationship between Ancient Village Tourist Destinations and the Source Market

Similarly, a buffer analysis was also utilized to inspect the effects of the source market on the spatial distribution of the sample villages. Eleven prefectural-level cities in Zhejiang Province were chosen to represent the main source of rural tourists in the region. Their locations were then plotted on a base map of Zhejiang Province. The buffer radius was drawn around each city in three circular bands (20 km, 40 km, and 60 km) (Figure 7). The results indicated that most of the sample villages were not closely located around the prefectural-level city. On the contrary, there was a certain distance, in general, attributed mainly to the remote location of most ancient villages in Zhejiang Province. In addition, the number of sample villages in each buffer zone varied significantly, showing a pattern of increase first and then a drop with the increase of distance. As shown in Table 4, only 10.52% of the sample villages were within the 20 km buffer zone of a prefectural-level city. This increased gradually and reached a maximum within 40–60 km; after 60 km, there was a declining pattern. This suggests that the prefectural-level cities integrally impact the spatial distribution of the tourism villages. The distances were usually within 30 min to an hour by public transport.

4.3.3. Relationship between Ancient Village Tourist Destinations and the Topography

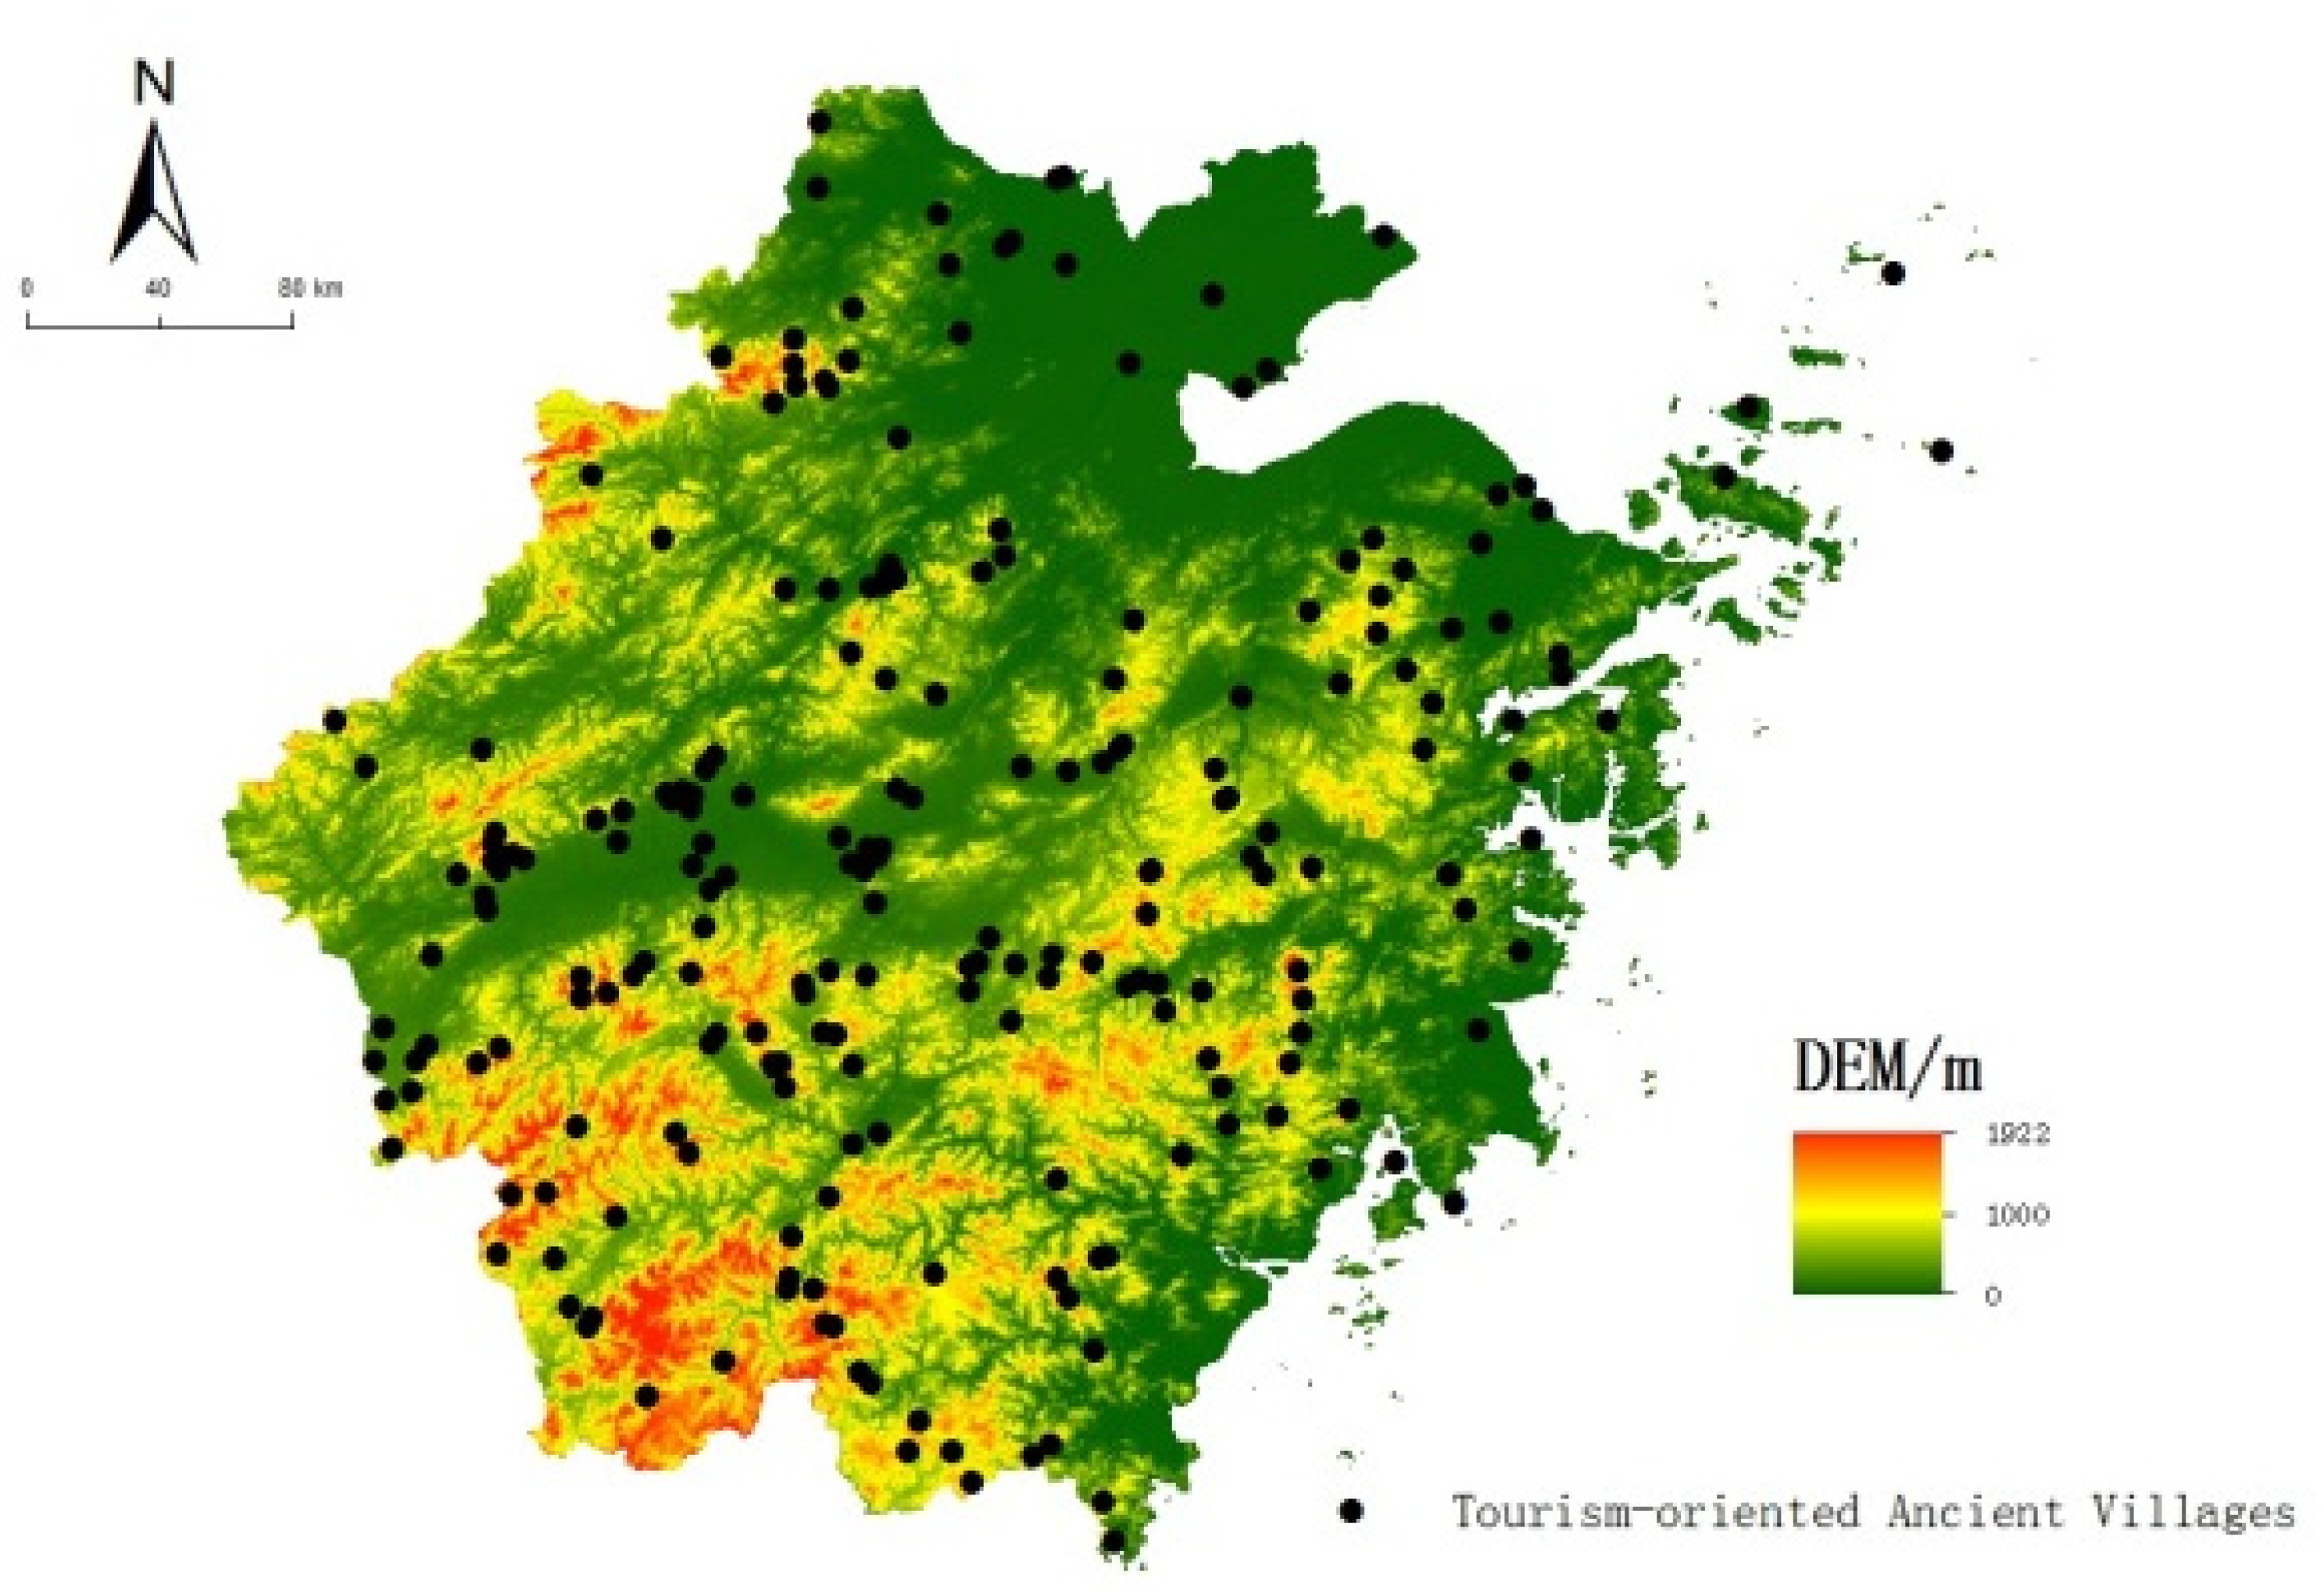
The locations of 228 ancient village tourist destinations in 2020 were plotted on a base map of Zhejiang Province, which was then intersected with the topographic map via a digital elevation model (DEM) of Zhejiang Province. The extract value to points tool in ArcGIS 10.4 was utilized to obtain the DEM data of each sample village, to generate the distribution map of the sample villages with the DEM data (Figure 8). The results suggested that most sample villages were geographically located within alluvial/coastal plains, basins and hills, especially in the Hangjiahu Plain, Ningshao Plain, Jinhua-Quzhou Basin, Tiantai Basin, and the Xianju Basin. In addition, the total area of Zhejiang Province was divided into five ranges, based on the DEM data (200 m, 400 m, 600 m, 800 m, and 1000 m), and the number of sample villages in each DEM range was also calculated (Table 5). A total of 47.81% of the sample villages were within the DEM range of below 200 m, reducing gradually to reach a minimum of 3.95% at the DEM range of 800–1000 m. In addition, a bivariate correlation analysis was performed to statistically measure the relationship between the distribution of the sample villages with the physical topography. The results showed that the number of sample villages is negatively correlated with the topography (p = 0.016, R = −0.944). That is to say, the number of sample villages dropped significantly with the increase in topography. This further confirmed that the spatial layout of the tourism villages has a strong dependence on the physical topography.

4.3.4. Relationship between the Ancient Village Tourist Destinations and the Economy

The log of the GDP, per capita, of eleven prefectural-level cities was introduced as an explanatory variable to measure the economy’s effect on the layout of the tourism villages. The data were obtained from the official website of the Zhejiang Provincial Bureau of Statistics. Following the recommendation from previous researchers [55], this study used the explanatory variable of the log of the GDP, per capita, from the previous year, to explain its impact on the number of sample villages, as there would be a lag effect of the tourism development in the ancient villages. The results of the bivariate correlation analysis showed that the city economy (e.g., GDP per capita) was not significantly associated with the spatial distribution of the tourism villages in Zhejiang Province (p = 0.121 > 0.05). This is not in line with previous studies [44], which stated that the local economic conditions are one of the major drivers of tourist attractions and that scenic spots could provide better facilities, services, and social environments. The reason behind this may be that Zhejiang Province is one of the most developed regions in China, and the GDP, per capita, in Zhejiang Province in 2019, was ranked among the top four (RMB 110,200) [56] in China. The favorable economic conditions of those prefectural-level cities could provide an improved infrastructure and facilities and a better ecological/social environment to develop tourism in the rural areas, such as ancient villages. This also confirmed Wang and Hou’s [57] findings that the number of different types of rural destinations could be evenly distributed, but spatially clustered in areas with different GDP levels.

5. Implications

5.1. Theoretical Implications

Village tourism is a kind of ecotourism, and sustainable development is its fundamental pursuit [39]. Despite a longstanding recognition of the relationship between the spatial distribution of tourist attractions and their sustainable development, most prior research focused on the role of community/residents in achieving a sustainable rural tourism development [58,59,60], and the inclusion of a spatial dimension in rural tourism contexts is rare. This study represents an initial attempt to extend the spatial cluster issue of tourism attractions into ancient village contexts and analytically include spatial and temporal dimensions at both the meso (provincial) and micro (prefectural-level city) levels, to capture a holistic picture. In addition, the spatial data used in the present study could overcome the limitations of past field survey data, which further improves the accuracy of its results.
Second, this study contributes to the rural tourism literature, particularly incorporating temporal features into the spatial cluster analysis of ancient village tourism on a regional scale. Most existing academic research on the spatial feature of rural villages is cross-sectional and uses national-level data without reflecting changes over time and capturing the heterogeneity within the regions [61]. As Nepal [31] stated, rural tourism’s spatial structure has essentially ignored the processes and phenomena at both the local and regional levels, while it is temporally dynamic as the tourism development proceeds [58]. The results of our study confirmed that there was a southern trend of the tourism village expansion over the study period. In addition, the current study went further and investigated the cluster structure of the ancient village tourist destinations at the provincial and prefectural-level city scales, as regional factors. Thus, these factors, such as the economic condition, natural geographic element, transportation, and source market, were found to jointly impact the spatial feature of the tourist attractions in a specific region over time [29]. Specifically, our study revealed a spatial inequality in the distribution of ancient village tourist destinations over time. In particular, village tourism development was clustered in the southern region, with a noticeable spillover effect.
Third, this study differs from the existing literature by including the topography to address factors contributing to the spatial distribution patterns in the tourism setting. It represents the first attempt to consider the natural geographic element toward unveiling its association with the spatial pattern in rural tourism, which is largely overlooked by the existing research. Our study echoes the call that the geographical environment may directly impact the spatial distribution pattern of the tourism resources [29]. In addition, the contributing factors identified in this study could provide a more holistic understanding of how the spatial layout of ancient village tourism in Zhejiang Province is being shaped.

5.2. Practical Implications

The findings of this study have multiple practical implications for the rural tourism sector, particularly in the contexts of ancient villages. First, in response to the temporal change of ancient village tourism, and the disparity within the prefectural cities, it is recommended to establish a dynamic monitoring system at the provincial and prefectural levels with a range of indicators, such as the total expansion, the specific geographic location of the expansion, and the dynamicity to track the changes in ancient village tourism, over time, in relation to transportation, the source market, topography, and so on. The monitoring data will help identify key areas and regions for improvements. It will also be useful, in future tourism policy formulation, strategic tourism planning development, and business decision making, to increase the operating efficiency by achieving an optimized configuration of the rural attractions (ancient villages in particular) in Zhejiang Province.
Second, the findings of this study indicate that, although the overall distribution of tourism villages has shown an aggregated pattern on the provincial level during the study period, five out of eleven prefectural-level cities have presented a dispersed pattern in 2020. All of them are located in the northeast coastal areas with a limited quantity of ancient villages. In light of this distribution, special attention should be given to enhance the agglomeration of village destinations in those cities, which should be considered a critical guiding factor for future rural tourism planning and development, such as resource allocation and the specific site selection of the ancient villages to develop tourism. Meanwhile, effective collaborations with tourist attractions are also encouraged to enhance regional agglomeration levels and win a competitive edge. However, for prefectural-level cities with an aggregated pattern, such as Jinhua, the selection of ancient villages to develop tourism should be very cautious. As suggested by Cheng and Hu [62], an ANNI value in a region of less than 0.5, reflects an over-clustered pattern, which may produce over-competition and negatively impact its sustainability.
Third, the distribution of Zhejiang’s tourism villages shows a strong correlation in space, and the spillover effect is significant, suggesting that tourism policymakers should break through the boundaries of administrative divisions and construct an interregional cooperation mechanism. For example, an efficient platform for communication and experience sharing could be built to promote the effective exchange and reference of governance measures and supportive incentives. Meanwhile, the demonstration effect and the neighborhood imitation effect could be used as efficient measures to improve interregional interactions. Additionally, partnerships between regional and local governments, individual entrepreneurs, and investors need to be promoted.

6. Limitations, Future Research, and Conclusions

Using the geographic information system (GIS) spatial analysis method and the exploratory spatial data analysis model, this study explored the spatial-temporal features of ancient village tourism over three important time nodes of the rural tourism development (in Zhejiang, China), as well as the contributing factors at both the provincial and prefectural city levels. The results showed that:
(1) There was a spatial inequality in the distribution of ancient villages, in terms of the tourism development over time. In particular, tourism development was clustered in the southern region of Zhejiang Province in 2016 and moved to the southwestern region in 2018 and 2020, with a notable spillover effect. Further analysis of local Moran’s I showed that the regions with a high-high agglomeration pattern were mainly distributed in the western part of the province, while the regions with a low-low agglomeration pattern had always been in the northern part of the province.
(2) As for the distribution pattern of the sample villages in the eleven prefectural-level cities, Hangzhou, Quzhou, and Wenzhou showed an agglomeration structure in 2016 and 2018. While in 2020, the number of prefectural-level cities with a clustered pattern distribution was doubled, increasing to six. Among those, Jinhua appeared to be the most aggregated city with the lowest ANNI value.
(3) The spatial layout of the ancient village tourist destinations in Zhejiang Province was largely influenced by the transportation, source markets, and physical topography. Most of the sample villages were geographically distributed throughout the vicinities of the main roads or at intersections of the main roads, reflecting the influence of the road network on the spatially shaping of the distribution of tourism villages. Further exploration of the impact of source markets (the prefectural-level cities) on the distribution of the tourism villages, found that more than half of the sample villages were located within 40–60 km from the prefectural-level cities. This suggested that the spatial layout of the tourism villages is highly dependent on the source markets, such as the prefectural-level cities. In addition, almost half of the sample villages were within the DEM range of below 200 m, reducing gradually to reach a minimum of 3.95% at the DEM range of 800–1000 m. The results of a bivariate correlation analysis also showed that the number of sample villages is negatively correlated with the topography. This further confirmed that the spatial layout of the tourism villages has a strong dependence on the physical topography.
As a single study, this research is not free of limitations. As an early attempt, this study only analyzed the spatial distribution characteristics and evolution of ancient village tourism in 2016, 2018, and 2020, in Zhejiang Province, which is far from enough and cannot depict the whole picture of the current status in China. Future research could encompass a broader scope by including more provinces and village destinations, looking beyond the data restriction of the traditional villages and historic-cultural villages. In addition, as tourism development in ancient villages is still in its early stage, researchers should also conduct longitudinal studies to explore its evolutionary features more deeply and fully. In addition, this analysis only considered the supply-side resources. A richer analysis could have been obtained by also examining tourists and tourism investor demands through in-depth interviews or surveys.

Author Contributions

Conceptualization, Y.B. and E.M.; methodology, Y.B. and H.J.; software, H.J. and Z.S.; validation, Z.S. and L.X.; formal analysis, H.J. and Y.B.; investigation, Z.S.; resources, L.X.; data curation: Y.B. and H.J.; writing–original draft preparation, Y.B. and E.M.; writing—review and editing, E.M.; visualization, H.J.; supervision, L.X.; project administration, Y.B.; funding acquisition, Y.B. All authors have read and agreed to the published version of the manuscript.

Funding

This research was funded by Zhejiang Provincial Public Welfare Technology Research Program of Natural Science Foundation of Zhejiang Province, grant number LGF20D010001.

Institutional Review Board Statement

The study does not require ethical approval.

Informed Consent Statement

Not applicable.

Data Availability Statement

The data that support the findings of this study were derived from public domain resources.

Conflicts of Interest

The authors declare no conflict of interest.

References

  1. Liu, C.; Dou, X.; Li, J.; Cai, A. Analyzing government role in rural tourism development: An empirical investigation from China. J. Rural. Stud. 2020, 79, 177–188. [Google Scholar] [CrossRef]
  2. Lenao, M.; Saarinen, J. Integrated rural tourism as a tool for community tourism development: Exploring culture and heritage projects in the north-East District of Botswana. S. Afr. Geogr. J. 2015, 97, 203–216. [Google Scholar] [CrossRef]
  3. World Tourism Organization (WTO). World Tourism Leaders Meeting: The Social Impacts of Tourism Final Report; WTO: Madrid, Spain, 1997. [Google Scholar]
  4. Sims, R. Food, place and authenticity: Local food and the sustainable tourism experience. J. Sustain. Tour. 2009, 3, 321–336. [Google Scholar] [CrossRef]
  5. Shen, S.; Wang, H.; Quan, Q.; Xu, J. Rurality and rural tourism development in China. Tour. Manag. Perspect. 2019, 30, 98–106. [Google Scholar] [CrossRef]
  6. Forward Industrial Academy. 2020. Available online: https://new.qq.com/omn/20201204/20201204A046GN00.html (accessed on 15 February 2022).
  7. Zhongshang Industrial Academy. 2019. Available online: https://www.askci.com/news/chanye/20190313/1615351143157.shtml (accessed on 22 February 2022).
  8. Hua, Z. Report of China Rural Tourism Development Index. 2016. Available online: http://www.xinhuanet.com/politics/2016-10/29/c_129342435.htm (accessed on 12 March 2022).
  9. Tao, J.; Wang, Q. Co-evolution: A Model for Renovation of Traditional Villages in the Urban Fringe of Guangzhou, China. J. Asian Archit. Build. Eng. 2014, 3, 555–562. [Google Scholar] [CrossRef] [Green Version]
  10. Ren, J.; Wu, J. Research on ancient village tourism in China. Anhui Agric. Sci. 2010, 5, 86–91. [Google Scholar]
  11. Ryan, C.; Huang, S. Tourism in China: Destinations, Planning and Experiences; Channel View Publications: Bristol, UK, 2013. [Google Scholar]
  12. Ryan, C.; Huang, S. (Eds.) The role of tourism in China’s transitions: An introduction. In Tourism in China: Destinations, Planning and Experiences; Channel View Publications: Bristol, UK, 2013. [Google Scholar]
  13. Gao, J.; Wu, B.H. Revitalizing traditional villages through rural tourism: A case study of Yuanjia Village, Shaanxi Province, China. Tour. Manag. 2017, 63, 223–233. [Google Scholar] [CrossRef]
  14. Shao, X.; Liu, Y.; Wang, X.; Zhai, Z.; Li, Z. Tourism responsiveness of traditional villages in the Yellow River Basin. J. Arid. Land Resour. Environ. 2021, 6, 200–208. [Google Scholar]
  15. Li, Z.X.; Bao, Y.F.; Sun, Z. Spatial distribution characteristics and influencing factors of 3A scenic villages in Zhejiang Province. J. Zhejiang A F Univ. 2019, 6, 1096–1106. [Google Scholar]
  16. Ketut, L.; Dewi, Y. Modeling the relationships between tourism sustainable factor in the traditional village of Pancasari. Procedia–Soc. Behav. Sci. 2014, 135, 57–63. [Google Scholar]
  17. Shen, Y.; Liu, Q. The evolution of human-land relationship in the evolution transmutation of rural tourism in traditional villages in suburban cities: A case study of Xunlonghe village. Tour. Trib. 2021, 3, 95–108. [Google Scholar]
  18. Zhang, X.; Ding, P.; Bao, J. Patron-client ties in tourism: The case study of Xidi, China. Tour. Geogr. 2009, 3, 390–407. [Google Scholar] [CrossRef]
  19. Guo, Z.; Sun, L. The planning, development and management of tourism: The case of Dangjia, an ancient village in China. Tour. Manag. 2016, 56, 52–62. [Google Scholar] [CrossRef]
  20. Xu, H.; Dai, S. A system dynamics approach to explore sustainable policies for Xidi, the world heritage village. Curr. Issue Tour. 2012, 5, 441–459. [Google Scholar] [CrossRef]
  21. Ghaderi, Z. Community capacity building for tourism in a heritage village: The case of Hawraman Takht in Iran. J. Sustain. Tour. 2018, 4, 537–550. [Google Scholar] [CrossRef]
  22. Kim, S. Tourism impacts continuity of world heritage list inscription and sustainable management of Hahoe Village, Korea: A case study of changes in tourist perception. Sustainability 2019, 10, 2573. [Google Scholar] [CrossRef] [Green Version]
  23. Kastenhola, E.; Carneiro, M.J.; Marques, C.P.; Lima, J. Understanding and managing the rural tourism experience—The case of a historical village in Portugal. Tour. Manag. Perspect. 2012, 4, 207–214. [Google Scholar] [CrossRef]
  24. Li, Y.; Liu, H.; Wang, L. Spatial distribution pattern of the catering industry in a tourist city: Taking Lhasa city as a case. J. Resour. Ecol. 2020, 2, 191–205. [Google Scholar]
  25. Wang, L.; Lu, L.; Tong, S.; Yang, Z.; Wang, Y.; Liang, D. Residents’ attitudes to tourism development in ancient village resorts case study of world cultural heritage of Xidi and Hong villages. Chin. Geogr. Sci. 2004, 1, 70–79. [Google Scholar]
  26. Zhu, H.; Liu, J.; Wei, Z.; Li, W.; Wang, L.; Liang, D. Residents’ attitude towards sustainable tourism development in a historical-cultural village: Influence of perceived impacts, sense of place and tourism development potential. Sustainability 2017, 1, 61. [Google Scholar] [CrossRef] [Green Version]
  27. Lee, S.H.; Choi, J.Y.; Yoo, S.H.; Oh, Y.G. Evaluating spatial centrality for integrated tourism management in rural areas GIS and network analysis. Tour. Manag. 2013, 14, 14–24. [Google Scholar] [CrossRef]
  28. Jackson, J.; Murphy, P. Clusters in regional tourism: An Australian case. Ann. Tour. Res. 2006, 4, 1018–1035. [Google Scholar] [CrossRef]
  29. Wang, T.; Wang, L.; Ning, Z. Spatial pattern of tourist attractions and its influencing factors in China. J. Spat. Sci. 2018, 2, 327–344. [Google Scholar] [CrossRef]
  30. Zhang, G.H.; Meng, Y. An Analysis of Characteristics of Spatial Structure of National Rural Tourism Model Counties. J. Ocean. Univ. China 2016, 4, 80–84. [Google Scholar]
  31. Nepal, S.K. Tourism and rural settlements Nepal’s Annapurna region. Ann. Tour. Res. 2007, 4, 855–875. [Google Scholar] [CrossRef]
  32. Saxena, G.; Clark, G.; Oliver, T.; Ilbery, B.; Clark, G.; Chabrel, M. Conceptualizing integrated rural tourism. Tour. Geogr. 2007, 4, 347–370. [Google Scholar] [CrossRef] [Green Version]
  33. Ciolac, R.; Rujescu, C.; Constantinescu, S.; Adamov, T.; Dragoi, M.C.; Lile, R. Management of a Tourist Village Establishment in Mountainous Area through Analysis of Costs and Incomes. Sustainability 2017, 6, 875. [Google Scholar] [CrossRef] [Green Version]
  34. Nash, R.; Martin, A. Tourism in peripheral areas—The challenges for Northeast Scotland. Tour. Res. 2003, 5, 161–181. [Google Scholar] [CrossRef]
  35. Flisher, A.; Felsenstein, D. Support for rural tourism: Does it make a difference? Ann. Tour. Res. 2000, 4, 180–194. [Google Scholar]
  36. Ponce, P.; Aguirre-Padilla, N.; Oliveira, C.; lvarez-García, J.; Río-Rama, M. The spatial externalities of tourism activities in poverty reduction. Sustainability 2020, 12, 6138. [Google Scholar] [CrossRef]
  37. China Tourism Academy. Development Report of Scenic Spots in China. 2020. Available online: https://www.sohu.com/a/441254476_505583 (accessed on 24 January 2022).
  38. Sarrión-Gavilán, M.D.; Benítez-Márquez, M.D.; Mora-Rangel, E.O. Spatial distribution of tourism supply in Andalusia. Tour. Manag. Perspect. 2015, 15, 29–45. [Google Scholar] [CrossRef]
  39. Bhuiyan, M.A.H.; Siwar, C.; Ismail, S.M. Sustainability measurement for ecotourism destination in malaysia: A study on Lake Kenyir, Terengganu. Soc. Indic. Res. 2016, 3, 1029–1045. [Google Scholar] [CrossRef]
  40. Wei, M. Spatial distribution and the agglomeration performance of high-star hotels. Tour. Anal. 2017, 22, 31–43. [Google Scholar] [CrossRef]
  41. Jin, X.; Weber, K.; Bauer, T. Impact of clusters on exhibition destination attractiveness: Evidence from Mainland China. Tour. Manag. 2012, 33, 1429–1439. [Google Scholar] [CrossRef]
  42. Enright, M.J.I. Regional clusters: What we know and what we should know. In Innovation Clusters and Interregional Competition; Bröcker, J., Dohse, D., Soltwedel, R., Eds.; Springer: Berlin/Heidelberg, Germany, 2003. [Google Scholar]
  43. Dhami, I.; Deng, J. Linking the Recreation Opportunity Spectrum with Travel Spending: A Spatial Analysis in West Virginia. Leis. Sci. 2018, 6, 508–532. [Google Scholar] [CrossRef]
  44. Huang, C.; Deng, H.; Li, X. Research on spatial structure and influencing factors of rural tourism: A case study of Hubei Province. Sci. Technol. Manag. Land Resour. 2017, 1, 116–125. [Google Scholar]
  45. Clark, P.J.; Evans, F.C. Distance to Nearest Neighbor as a Measure of Spatial Relationships in Populations. Ecology 1954, 35, 445–453. [Google Scholar] [CrossRef]
  46. Xu, D.; Huang, Z.; Lv, L.; Chen, X.; Cao, F. Research on Spatial Characteristic of Urban Leisure Tourism Based on POI Mining: A Case Study of Nanjing City. Geogr. Geo-Inf. Sci. 2018, 34, 59–64. [Google Scholar]
  47. Xie, Z.; Wu, B. Tourism Spatial Structure of Resources-based Attractions in China. Sci. Geogr. Sin. 2008, 28, 748–753. [Google Scholar]
  48. Janert, P.K. Gnuplot in Action: Understanding Data with Graphs; Tsinghua University Press: Beijing, China, 2012. [Google Scholar]
  49. Wang, B.; Shi, W.Z.; Miao, Z.L. Confidence Analysis of Standard Deviational Ellipse and Its Extension into Higher Dimensional Euclidean Space. PLoS ONE 2015, 3, 1–17. [Google Scholar] [CrossRef]
  50. Gutierrez, J.; Garcia-Palomares, J.C.; Romanillos, G.; Salas-Olmedo, M.H. The eruption of Airbnb in tourist cities: Comparing spatial patterns of hotels and peer-to-peer accommodation in Barcelona. Tour. Manag. 2017, 62, 278–291. [Google Scholar] [CrossRef] [Green Version]
  51. Cliff, A.D.; Ord, J.K. Spatial Processes: Models and Applications; Pion: London, UK, 1981. [Google Scholar]
  52. Shi, Y.J.; Zhu, Q.; Xu, L.H.; Lu, Z.W.; Wu, Y.Q.; Wang, X.B.; Fei, Y.; Deng, J.Y. Independent or Influential? Spatial-Temporal Features of Coordination Level between Urbanization Quality and Urbanization Scale in China and Its Driving Mechanism. Int. J. Environ. Res. Public Health 2020, 17, 1587. [Google Scholar] [CrossRef] [PubMed]
  53. Ord, J.K.; Getis, A. Local Spatial Autocorrelation Statistics: Distributional Issues and an Application. Geogr. Anal. 2010, 27, 286–306. [Google Scholar] [CrossRef]
  54. Wang, T.; Wu, P.; Ge, Q.; Ning, Z. A Ticket prices and revenue levels of tourist attractions in China: Spatial differentiation between prefectural units. Geogr. Anal. 2021, 83, 1–19. [Google Scholar] [CrossRef]
  55. Luo, H.; Yang, Y. Spatial pattern of hotel distribution in China. Tour. Hosp. Res. 2013, 1, 3–15. [Google Scholar] [CrossRef]
  56. National Bureau of Statics. Annual Statistics Data for Different Provinces. 2020. Available online: https://data.stats.gov.cn/easyquery.htm?cn=E0103 (accessed on 26 February 2022).
  57. Wang, X.; Hou, J. Spatial Distribution Features and Influence Factors of Rural Leisure Tourism Destinations in Shandong Province. Sci. Geogr. Sin. 2016, 11, 1706–1714. [Google Scholar]
  58. Xu, H.; Jiang, F.; Wall, G.; Wang, F. The evolving path of community participation in tourism in China. J. Sustain. Tour. 2019, 8, 1239–1258. [Google Scholar] [CrossRef]
  59. Megeirhi, H.A.; Woosnam, K.M.; Ribeiro, M.A.; Ramkissoon, H.; Denley, T.J. Employing a value-belief-norm framework to gauge Carthage residents’ intentions to support sustainable cultural heritage tourism. J. Sustain. Tour. 2020, 9, 1351–1370. [Google Scholar] [CrossRef] [Green Version]
  60. Strzelecka, M.; Boley, B.B.; Strzelecka, C. Empowerment and resident support for tourism in rural Central and Eastern Europe (CEE): The case of Pomerania, Poland. J. Sustain. Tour. 2018, 4, 554–572. [Google Scholar] [CrossRef]
  61. Sun, F.; Wang, D. The spatial distribution and development pattern of tourism towns and villages with characteristic landscape. Tour. Trib. 2018, 5, 80–93. [Google Scholar]
  62. Cheng, H.; Hu, W. Spatial structure of class A tourist attraction in Chizhou. Sci. Geogr. Sin. 2014, 10, 1275–1280. [Google Scholar]
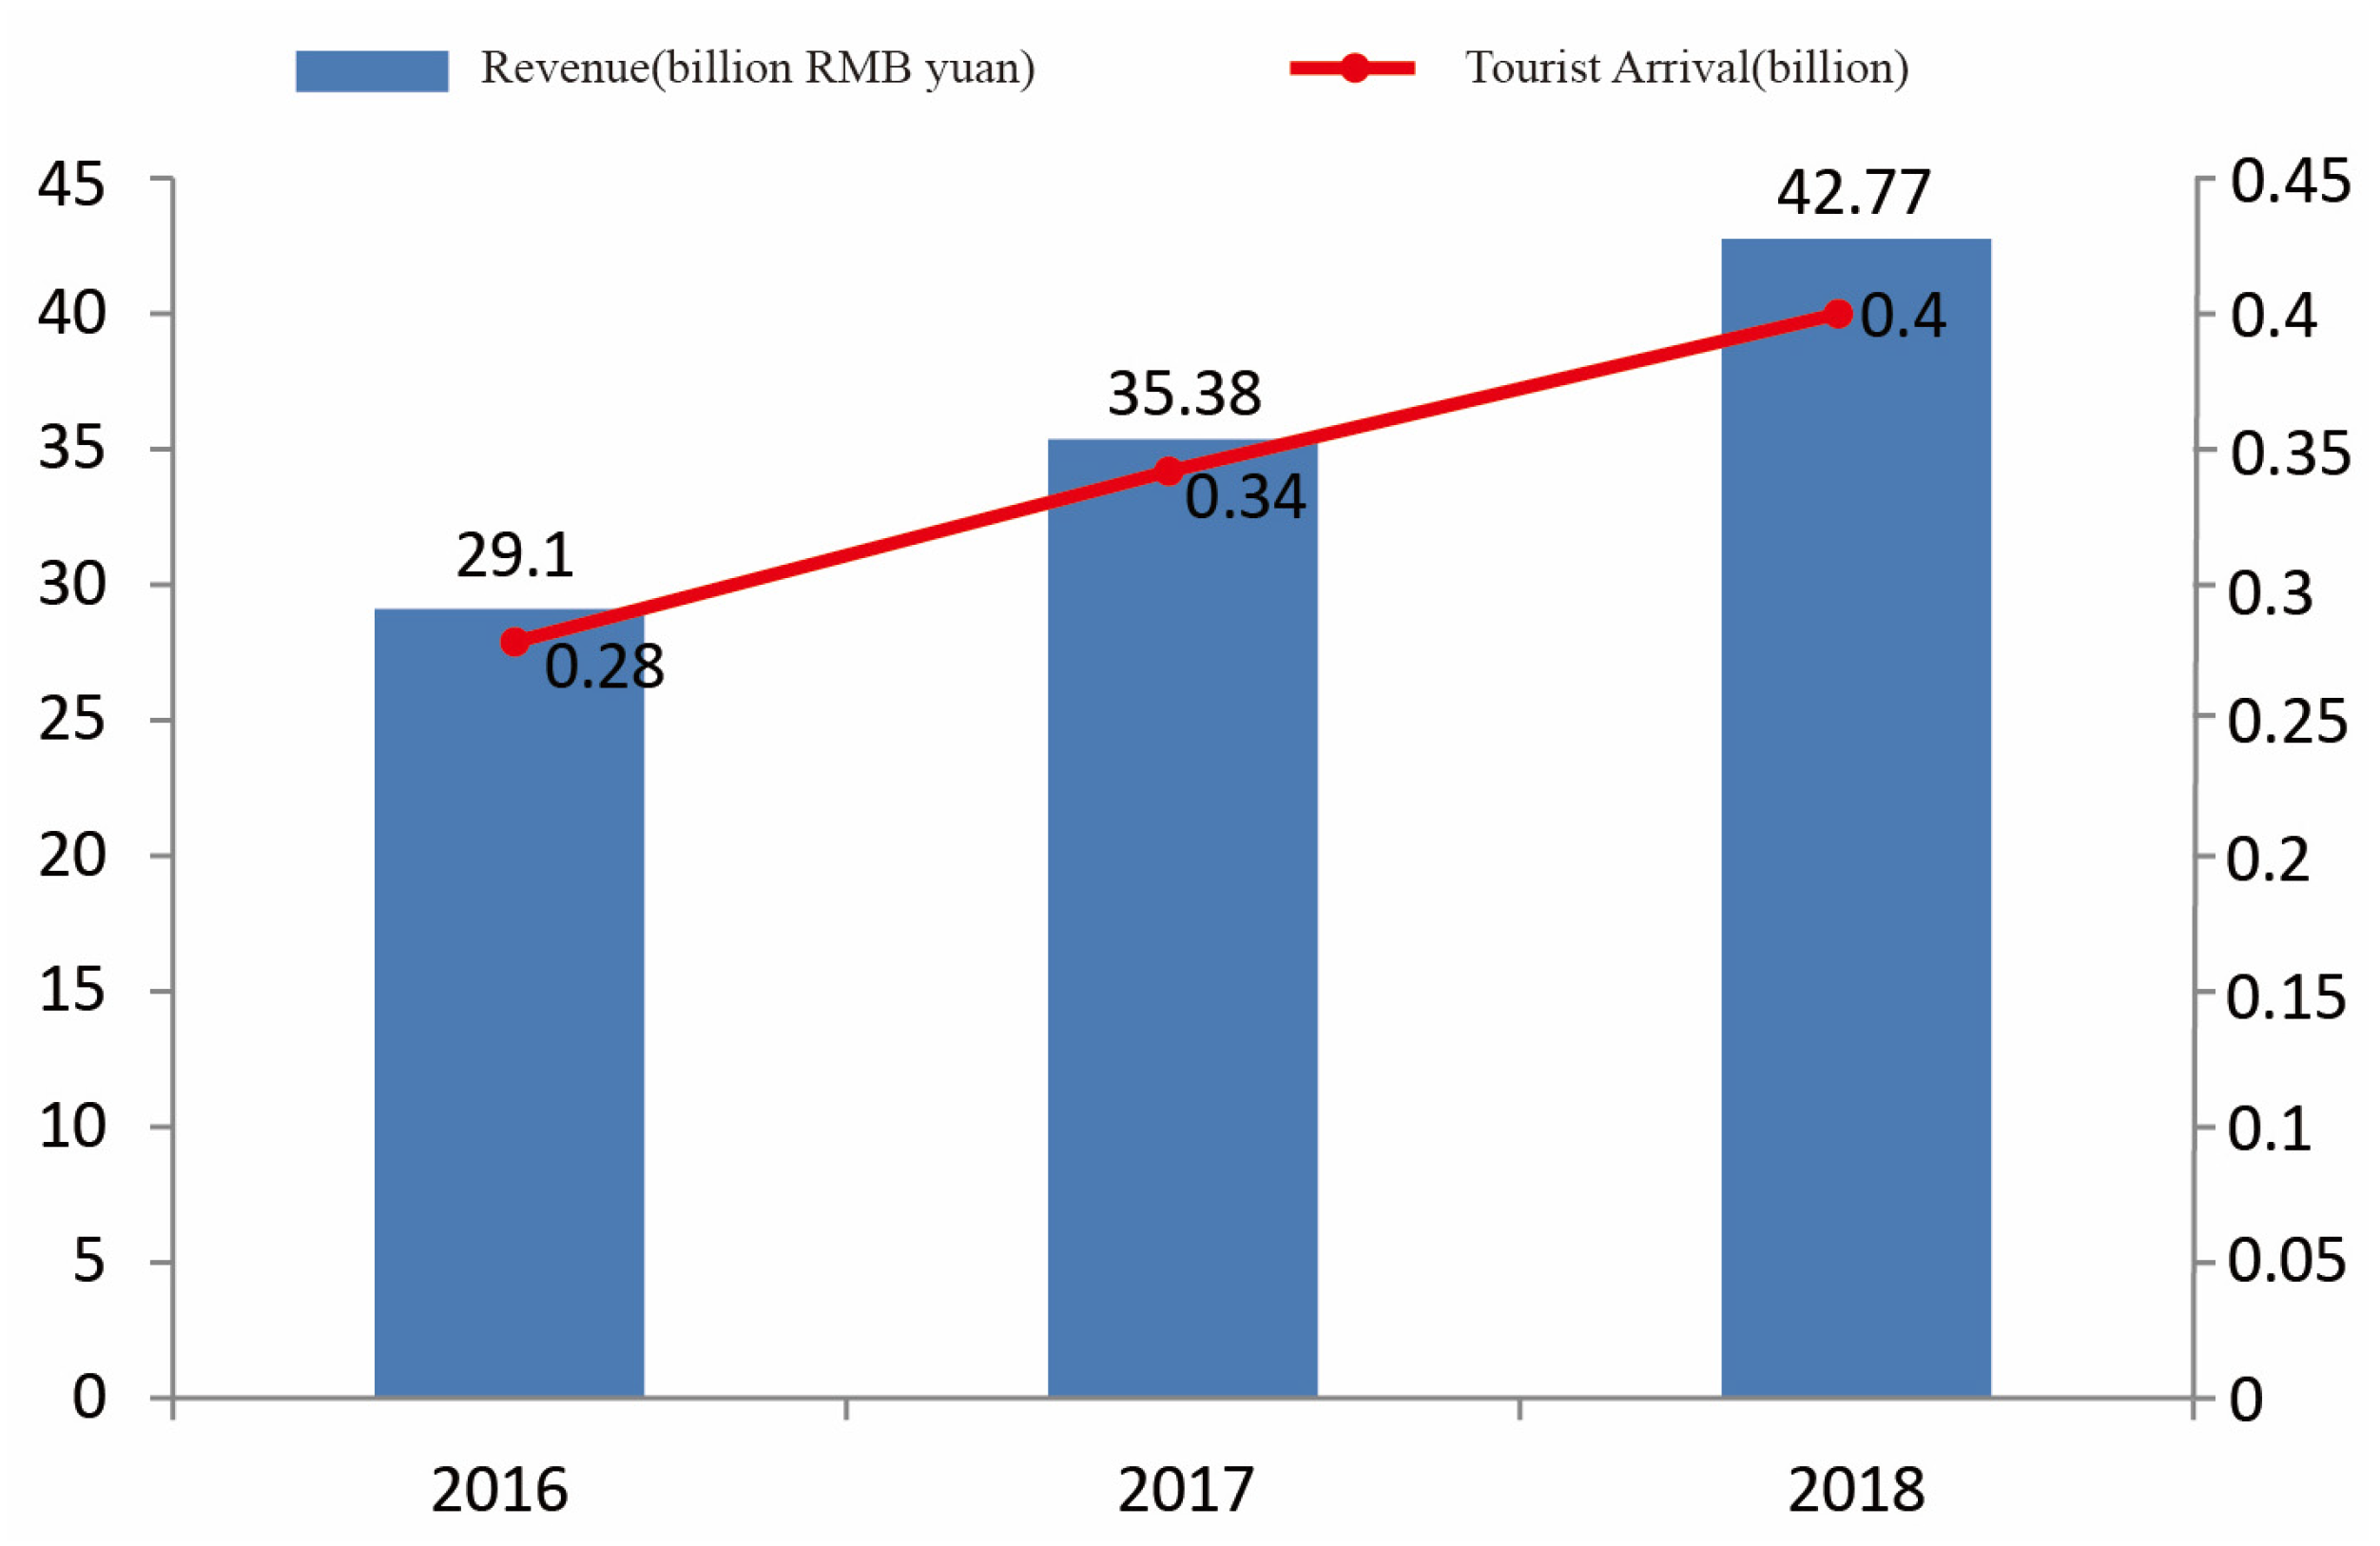
Figure 1. Volume of the rural tourism revenue and total tourist arrivals in Zhejiang Province: 2016–2018.
Sustainability 15 00143 g001
Figure 2. The study area.
Sustainability 15 00143 g002
Figure 3. Kernel density distribution of the ancient village tourist destinations in Zhejiang Province in 2016 (a), 2018 (b), and 2020 (c).
Sustainability 15 00143 g003
Figure 4. Standard deviation ellipses of the ancient village tourist destinations in Zhejiang in 2016, 2018, and 2020.
Sustainability 15 00143 g004
Figure 5. LISA cluster maps in 2016 (a), 2018 (b), and 2020 (c).
Sustainability 15 00143 g005
Figure 6. Buffer zones of the roads in Zhejiang Province: (a) main roads; (b) secondary roads; (c) branch roads.
Sustainability 15 00143 g006
Figure 7. Buffer zones of the prefectural-level cities in Zhejiang Province.
Sustainability 15 00143 g007
Figure 8. The distribution of ancient village tourist destinations with the different DEM data.
Sustainability 15 00143 g008
Table 1. Average nearest neighbor index (ANNI) of ancient village tourist destinations in the prefectural-level cities in 2016, 2018, and 2020.
Cities201620182020
No. of Sample VillagesANNITypeNo. of Sample VillagesANNITypeNo. of Sample VillagesANNIType
Hangzhou140.80748Clustered230.94648Clustered250.87918Clustered
Ningbo111.39911Dispersed161.41757Dispersed201.36716Dispersed
Huzhou33.34162Dispersed131.33959Dispersed141.17316Dispersed
Jiaxing0//52.43099Dispersed52.43099Dispersed
Zhoushan1//35.05359Dispersed42.67768Dispersed
Shaoxing2//52.54221Dispersed62.07905Dispersed
Jinhua161.03236Dispersed260.85812Clustered390.66109Clustered
Quzhou160.85360Clustered260.83864Clustered330.76443Clustered
Taizhou141.01486Dispersed181.00101Dispersed210.93898Clustered
Wenzhou100.98067Clustered191.14035Dispersed230.95243Clustered
Lishui191.08456Dispersed281.06636Dispersed380.94161Clustered
Table 2. Parameter data of the standard deviation ellipses in 2016, 2018, and 2020.
YearEllipse
Area/km²
Center of
Gravity
Coordinates
Major Axes Standard Deviation/kmMinor Axes Standard Deviation/kmRotation Angles
201642,99628.9627° N,
119.9732° E
133.6347102.419948.3111°
201849,69729.1385° N,
120.0258° E
144.8343109.227933.1232°
202049,78229.0862° N,
120.0142° E
144.1777109.913635.3528°
Table 3. Distribution of the ancient village tourist destinations within the different buffer ranges of roads.
Buffer RangeNumber of Sample VillagesProportion (%)
9 km range buffer of the main road13157.46%
6 km range buffer of the secondary road12052.63%
3 km range buffer of the branch road18279.82%
Table 4. Distribution of the ancient village tourist destinations within the different buffer ranges of cities.
Buffer RangeNumber of Sample VillagesProportion (%)
20 km2410.52%
40 km8235.96%
60 km15869.3%
Table 5. Distribution of ancient village tourist destinations within the different DEM ranges.
DEM RangeNumber of Sample VillagesProportion (%)
0~200 m10947.81%
200~400 m5925.88%
400~600 m3113.60%
600~800 m208.77%
800~1000 m93.95%
Disclaimer/Publisher’s Note: The statements, opinions and data contained in all publications are solely those of the individual author(s) and contributor(s) and not of MDPI and/or the editor(s). MDPI and/or the editor(s) disclaim responsibility for any injury to people or property resulting from any ideas, methods, instructions or products referred to in the content.