Article

Long-Term Fertilizer Reduction in Greenhouse Tomato-Cucumber Rotation System to Assess N Utilization, Leaching, and Cost Efficiency

1
Key Laboratory of Nonpoint Source Pollution Control, Ministry of Agriculture, Institute of Agricultural Resources and Regional Planning, Chinese Academy of Agricultural Sciences (CAAS), Beijing 100081, China
2
College of Agriculture, Bahadur Sub-Campus Layyah, Bahauddin Zakariya University, Multan 60800, Pakistan
3
Institute of Agricultural Resources and Environment, NingXia Academy of Agricultural and Forestry Sciences, 590 Huanghe Donglu Road, Yinchuan 750002, China
4
Institute of Agricultural Economy and Information Technology, NingXia Academy of Agricultural and Forestry Sciences, 590 Huanghe Donglu Road, Yinchuan 750002, China
5
Department of Soil Science, FAS&T, Bahauddin Zakariya University, Multan 60800, Pakistan
*
Author to whom correspondence should be addressed.
The authors contributed equally and should be considered co-first authors.
Sustainability 2022, 14(8), 4647; https://doi.org/10.3390/su14084647
Submission received: 20 March 2022 / Revised: 4 April 2022 / Accepted: 8 April 2022 / Published: 13 April 2022
(This article belongs to the Special Issue Sustainable Agricultural Engineering Technologies and Applications)

Abstract

:
Technology-oriented approaches to reduce chemical fertilization in agroecosystems without influencing the vegetable yield is a proficient method for sustainable agriculture and environmental safety. However, short-term studies are not capable to indicate the effects of various inputs in a long run; therefore, a six-year experiment was conducted in Ningxia, China. The experimental units were: no fertilizer control (CK: 0 kg N ha−1), chicken manure (M: organic N 362 kg ha−1), reduced chemical fertilizer (RCF: chemical N 992 kg ha−1 + organic N 362 kg ha−1), and conventional fertilizer (CF: chemical N 1515 kg ha−1 + organic N 362 kg ha−1). The study aimed to assess the effects of reduced fertilization on yield, nitrogen (N) use efficiency (NUE), N leaching, and the economic benefits. The results achieved herein indicate that RCF has significantly improved the NUE, reduced N leaching (23.7%), and improved the N economic benefit (NEB, 41.8%) as compared to the CF. Based on yield, net benefit, and NUE conditions, the optimum N application range was 634–821 kg N ha−1 for tomato and 556–778 kg N ha−1 for cucumber. The study concluded that reduced chemical application of N is an important factor to control environmental pollution and improve fertilizer use efficiency. Further experiments are suggested to examine the optimum N rate provision from chemical fertilizer and its ratio with organic fertilization.

1. Introduction

Greenhouse vegetable production has the advantages of less planting area requirement and relatively higher yield [1]. Increased vegetable consumption and farmers’ increased per-capita earning expectations have promoted greenhouse vegetable production globally [2,3]. In 2009, the area under greenhouse vegetable cultivation in China was 3.35 million hectares, and the country had the highest yield of greenhouse vegetables globally [4]. By 2013, Chinese production accounted for 50% of world vegetable production, and the area under cultivation in China for greenhouse vegetables had increased to more than 3.7 million hectares [5]. In 2016, the area under greenhouse vegetable cultivation in China was 3.91 million hectares, which accounted for 21.5% of the total planting area and produced 30.5% of the total yield in China [6,7].
To ensure maximum production from greenhouse vegetables, surplus fertilization is a common practice, which results in low fertilizer use efficiency [8,9]. Nitrogen (N) is the most important nutrient required by vegetables to maximize production; thus, it is essential to determine the appropriate fertilization rate. The rate of N uptake from different N sources by vegetables was observed to be less than 400 kg N ha−1 [10]. The average soil N application rate for greenhouse vegetables was 1732 kg ha−1 year−1 in Beijing, which is nearly four times the rate at which vegetables can absorb N [7]. The average N fertilization rate for greenhouse vegetables reached 4088 kg ha−1 year−1, with an NUE less than 10%, in a vegetable production area in Shouguang, Northern China [11,12]. For vegetable production in Northern China, Ju et al. [13] reported annual average inputs of N from chemical fertilizer, manure, and irrigation water, of 1358, 1881, and 402 kg ha−1, respectively, totaling 3641 kg ha−1; this is nearly nine times more N than vegetables can absorb [13]. Excessive N input causes N to accumulate in the soil [14]. Whether from natural or anthropogenic, this leads to N leaching and volatilization losses that are the major sources of non-point source pollution [15,16]. Furthermore, it also is the major cause of severe nitrate leaching and increases the risk of groundwater pollution [17,18].
To address these problems, fertilizer reduction technology (FRT) has been investigated in the United States and other developed countries since the 1980s [19]. Reducing N fertilization to 200 kg ha−1 resulted in satisfactory production and good vegetable quality [20]. A reduction of 40% N fertilization in greenhouse vegetable production reduces N leaching loss by 39.6% without affecting the yield [21]. Reducing N application from 360 kg ha−1 to 240 kg ha−1 can enhance yield (8.8%) and N agronomic efficiency (51.3%) in a greenhouse cucumber experiment [21,22]. Fertilizer N reductions of 20% and 50% can reduce total N (TN) leaching by 18.3% and 43.0%, respectively in the cucumber–cabbage season [22]. Therefore, FRT is an effective technique to not only improve economic benefit but also ensure sustainable vegetable development with improved N use efficiency (NUE) and less N leaching.
The Ningxia Plain is a vital vegetable production area located upstream of the Yellow River and is developing rapidly in recent years. Higher demands for vegetables have forced local farmers to apply a higher dose of chemical fertilizers in this area [23]. The adaptation of FRT is difficult in Ningxia Plain as well as other rural regions in China due to fear of less production, ineffective soil testing services, ignorance of environmental conditions, and lack of expertise [24]. Some recent cases have proved that training/seminars are effective tools in guiding farmers to reduce N fertilizer input for agricultural production [25,26,27]. Nevertheless, after training, they may restart the previous practice of excessive N fertilizer application, believing that the continuous reduction of N fertilizer application in the long term may reduce the TN supply in the soil and have a negative impact on crop yield [28]. This gives rise to the need for this study to identify the long-term influences of FRT vegetable yield, environmental pollution, and profitability of vegetable production systems.
Keeping an eye on the need of this study, we conducted a six-year in situ study aiming to measure the effects of conventional, reduced fertilization, and organic fertilization. The major objectives of this study are to (1) measure the influence of reduced fertilization on vegetable yield and NUE, (2) identify the key characteristics of reduced fertilization with respect to N leaching, and (3) estimate the N fertilizer economic benefit.

2. Materials and Methods

2.1. Site Description

The greenhouse experiment was conducted at Yellow River Irrigation Region of Ningxia Plain at the NXL01 land block (38.4475 N, 106.3575 E), in Ningxia province, China, at an altitude of 1000 m. This experiment was launched over six years (December 2008 to November 2013). The mean annual rainfall and air temperatures were 233 mm and 9 °C, respectively. The tomato–cucumber rotation vegetable system was used: tomatoes were grown and harvested first, then fallow period, followed by cucumbers, with one rotation per year. The soil is classified as Sandy Loam Soil (USDA system) in the study area. The physicochemical properties of the soil were as: clay 14%, silt 30%, sand 56%, bulk density 1.37 g cm−3, moisture content 10.3%, pH 8.27, 30.10 g kg−1 organic matter content, 2.42 g kg−1 total N, 2.14 g kg−1 total P, 302.40 mg kg−1 Olsen-P, and 390.00 mg kg−1 extractable K.

2.2. Experimental Design

Four treatments were applied during the tomato and cucumber growing seasons following the local experts’ recommendations: control (CK: 0 kg N ha−1); 100% chemical N reduction fertilization, using a single application of organic fertilizer in the form of manure (M: 362 kg N ha−1); reduced conventional fertilization (RCF: chemical N 992 kg ha−1 + organic kg N 362 ha−1), in which the chemical fertilizer N contents were reduced by, 38.7% and 28.8% on average, for tomatoes and cucumbers, respectively, relative to the CF treatment; conventional fertilization (CF: chemical N 1515 kg ha−1 + organic N 362 kg ha−1). Phosphate (triple superphosphate, 46% P2O5) and manure fertilizers (chicken manure, with average N, P2O5, and K2O contents of 1.00%, 1.32%, and 1.88%, respectively) were applied as base fertilizers before each tomato and cucumber season. Urea (46% N) and potassium sulfate (50% K2O) fertilizers were split into base and topdressing applications and were hand broadcasted. The vegetables were transplanted to seedbeds (600 cm long × 130 cm wide) with plant spacing of 40 cm and row spacing of 75 cm for tomatoes, and plant spacing of 30 cm and row spacing of 70 cm for cucumbers. There were three replicates for each treatment and were arranged according to randomized complete block design (RCBD). The greenhouse was covered with plastic sheet. The light of Ningxia greenhouse is sunlight without any artificial light. The indoor temperature was controlled at 14–18 °C at night and 25–30 °C during the day by sunlight, covering quilt and uncovering shed film. Weeding and pesticide application were according to the local conventional practices. Yellow River water and groundwater were used for irrigation.

2.3. Evaluation of N Use Efficiency

Tomato and cucumber samples were collected, and yields were measured for each harvest. The Kjeldahl method was used to analyze N content, as described by Yang et al. [15]. The following indicators were calculated, using data collected over the entire study, to evaluate NUE: apparent recovery efficiency of applied N (REN, %), agronomic effectiveness of applied N (AEN, kg kg−1), physiological efficiency of applied N (PEN, kg kg−1), and partial factor productivity of applied N (PFPN, kg kg−1) [29]:
R E N = T U N T C K F N
A E N = Y N Y C K F N
P E N = Y N Y C K T U N T C K
P F P N = Y N F N
where TUN is TN uptake, TCK is TN uptake without N application, FN is applied fertilizer N, YN is annual tomato/cucumber (tomato followed by cucumber) yield, and YCK is the tomato/cucumber yield without N application (all expressed in kg ha−1). The relationships between these parameters and annual N application rate were examined using exponential, linear, logarithmic, and power functions.

2.4. Leachate Collection and Measurement of Nitrate Losses Due to Leaching

Using a leachate collection device as described by Zhao [23], leachate was collected 3 d after each irrigation. The leachate collection device and containers were cleaned before use. The samples were stored at −20 °C in a refrigerator, and the TN content of the leachate was analyzed using the alkaline potassium persulfate digestion UV spectrophotometric method [23]. Approximate N input and leaching were calculated as follows:
N L C C   kg   ha 1   year 1 = N L C T N L C O
N L I R T N   % = N I T N N L T N × 100 %
N L I R O N   % = N I O N N L O N × 100 %
N L I R C N   % = N I C N N L C N × 100 %
where NLCC is N leaching caused by input of chemical fertilizer N, NLCT is N leaching caused by TN input, NLCO is N leaching caused by organic N input, NLIRTN is the TN leaching-to-input ratio, NLIRON is the organic N leaching-to-input ratio, NLIRCN is the chemical N leaching-to-input ratio, NITN is TN input, NION is organic N input, NICN is chemical N input, NLTN is TN leached, NLON is organic N leached, and NLCN is the amount of chemical fertilizer N leached.

2.5. Economic Analysis

The N fertilizer economic benefit (NEB, in USD t−1 N) and the input–output ratio, were used to calculate the economic benefits of N reduction.
N E B = B N B C K T F I
I n p u t t o o u t p u t   r a t i o = T I T E
where BN benefits from N input (USD ha−1 year−1), BCK is benefited without N input, TFI is total fertilizer N input (t ha−1 year−1), TI is total income (USD ha−1 year−1), and TE is total expenditure (USD ha−1 year−1).

2.6. Statistical Analysis

Descriptive data analysis was conducted, and graphs were created, using Microsoft Excel 2013 (Microsoft Corp., Redmond, WA, USA). The results are expressed as means (with standard error, SE) of the three replicates. We estimated fruit yield, NUE, N leaching, and NEB. One-way ANOVA with Duncan multiple comparison test was used to assess differences among the treatments. All statistical analyses were performed using SPSS 19.0 (IBM Corporation, Armonk, NY, USA). p-values < 0.05 were considered statistically significant.

3. Results

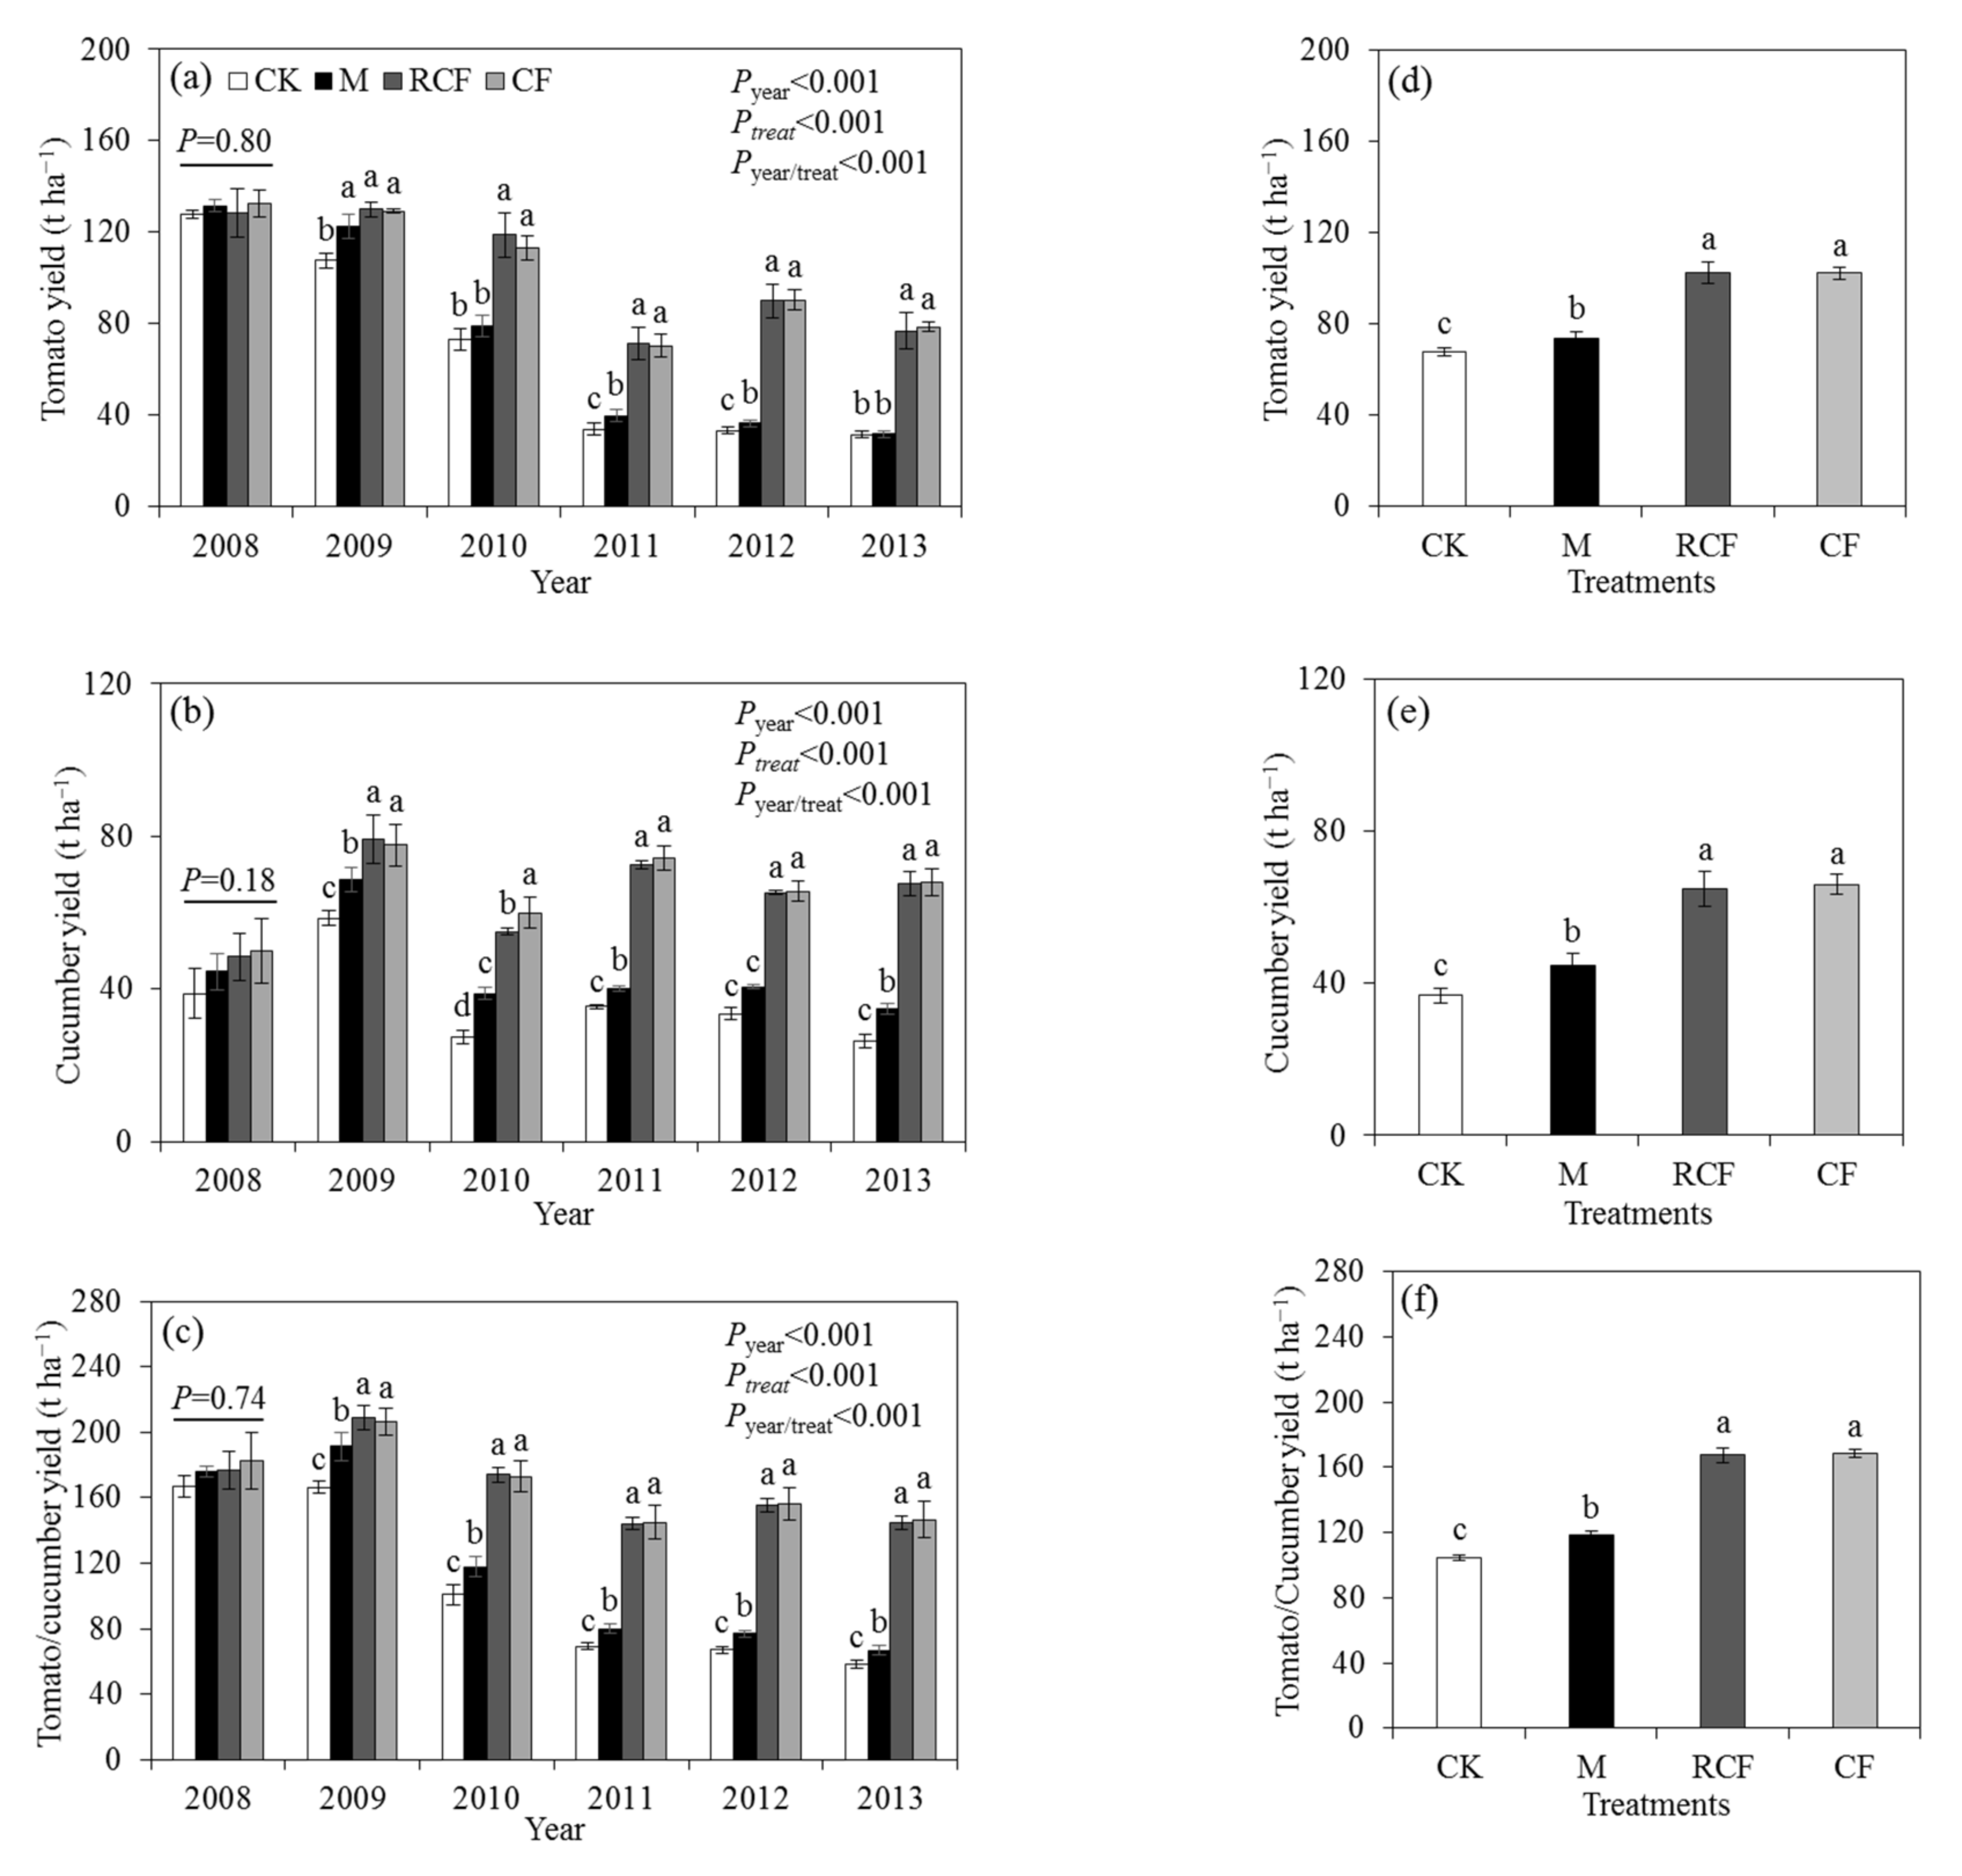
3.1. Tomato and Cucumber Yield

The individual yield of tomato and cucumber, as well as the combined yield of both crops (Figure 1a–c), differed significantly (p < 0.01) between years, treatments, and with the interaction of year and treatment. The average annual yield for the treatments relative to the CF is shown in Figure 1d–f.
For the tomato rotations, there was no significant difference between the four treatments in the first year (2008). The yield of the control treatment was significantly lower in 2009 by 16.7% relative to the CF treatment, and the yield gap increased annually from 2009 to 2012. The yield of the M treatment did not decline until 2010, when it declined by 5.1%, relative to the CF treatment. There was no significant difference in yield between the CF and RCF treatments.
Similarly, for cucumber rotations, there was no significant difference between treatments in the first year (2008). The yields of the CK and M treatments were significantly lower in 2009 (by 24.6% and 11.5%, respectively) relative to the CF treatment. There were no significant differences in yields between the CF and RCF treatments throughout the experimental period.
For the first year of tomato/cucumber rotation, there was no significant difference in yield between the four groups. Significant differences occurred from the second year (2009) to the end of the experiment. Relative to the CF treatment, the yield was reduced in the CK and M treatments and the yield gap increased annually. On average, the fruit yield of the M treatment was significantly higher (by 8.2%) than CK but was significantly lower than CF (by 28.2%) and RCF (by 28.4%) treatments. Moreover, there was no significant difference between the CF and RCF treatments.

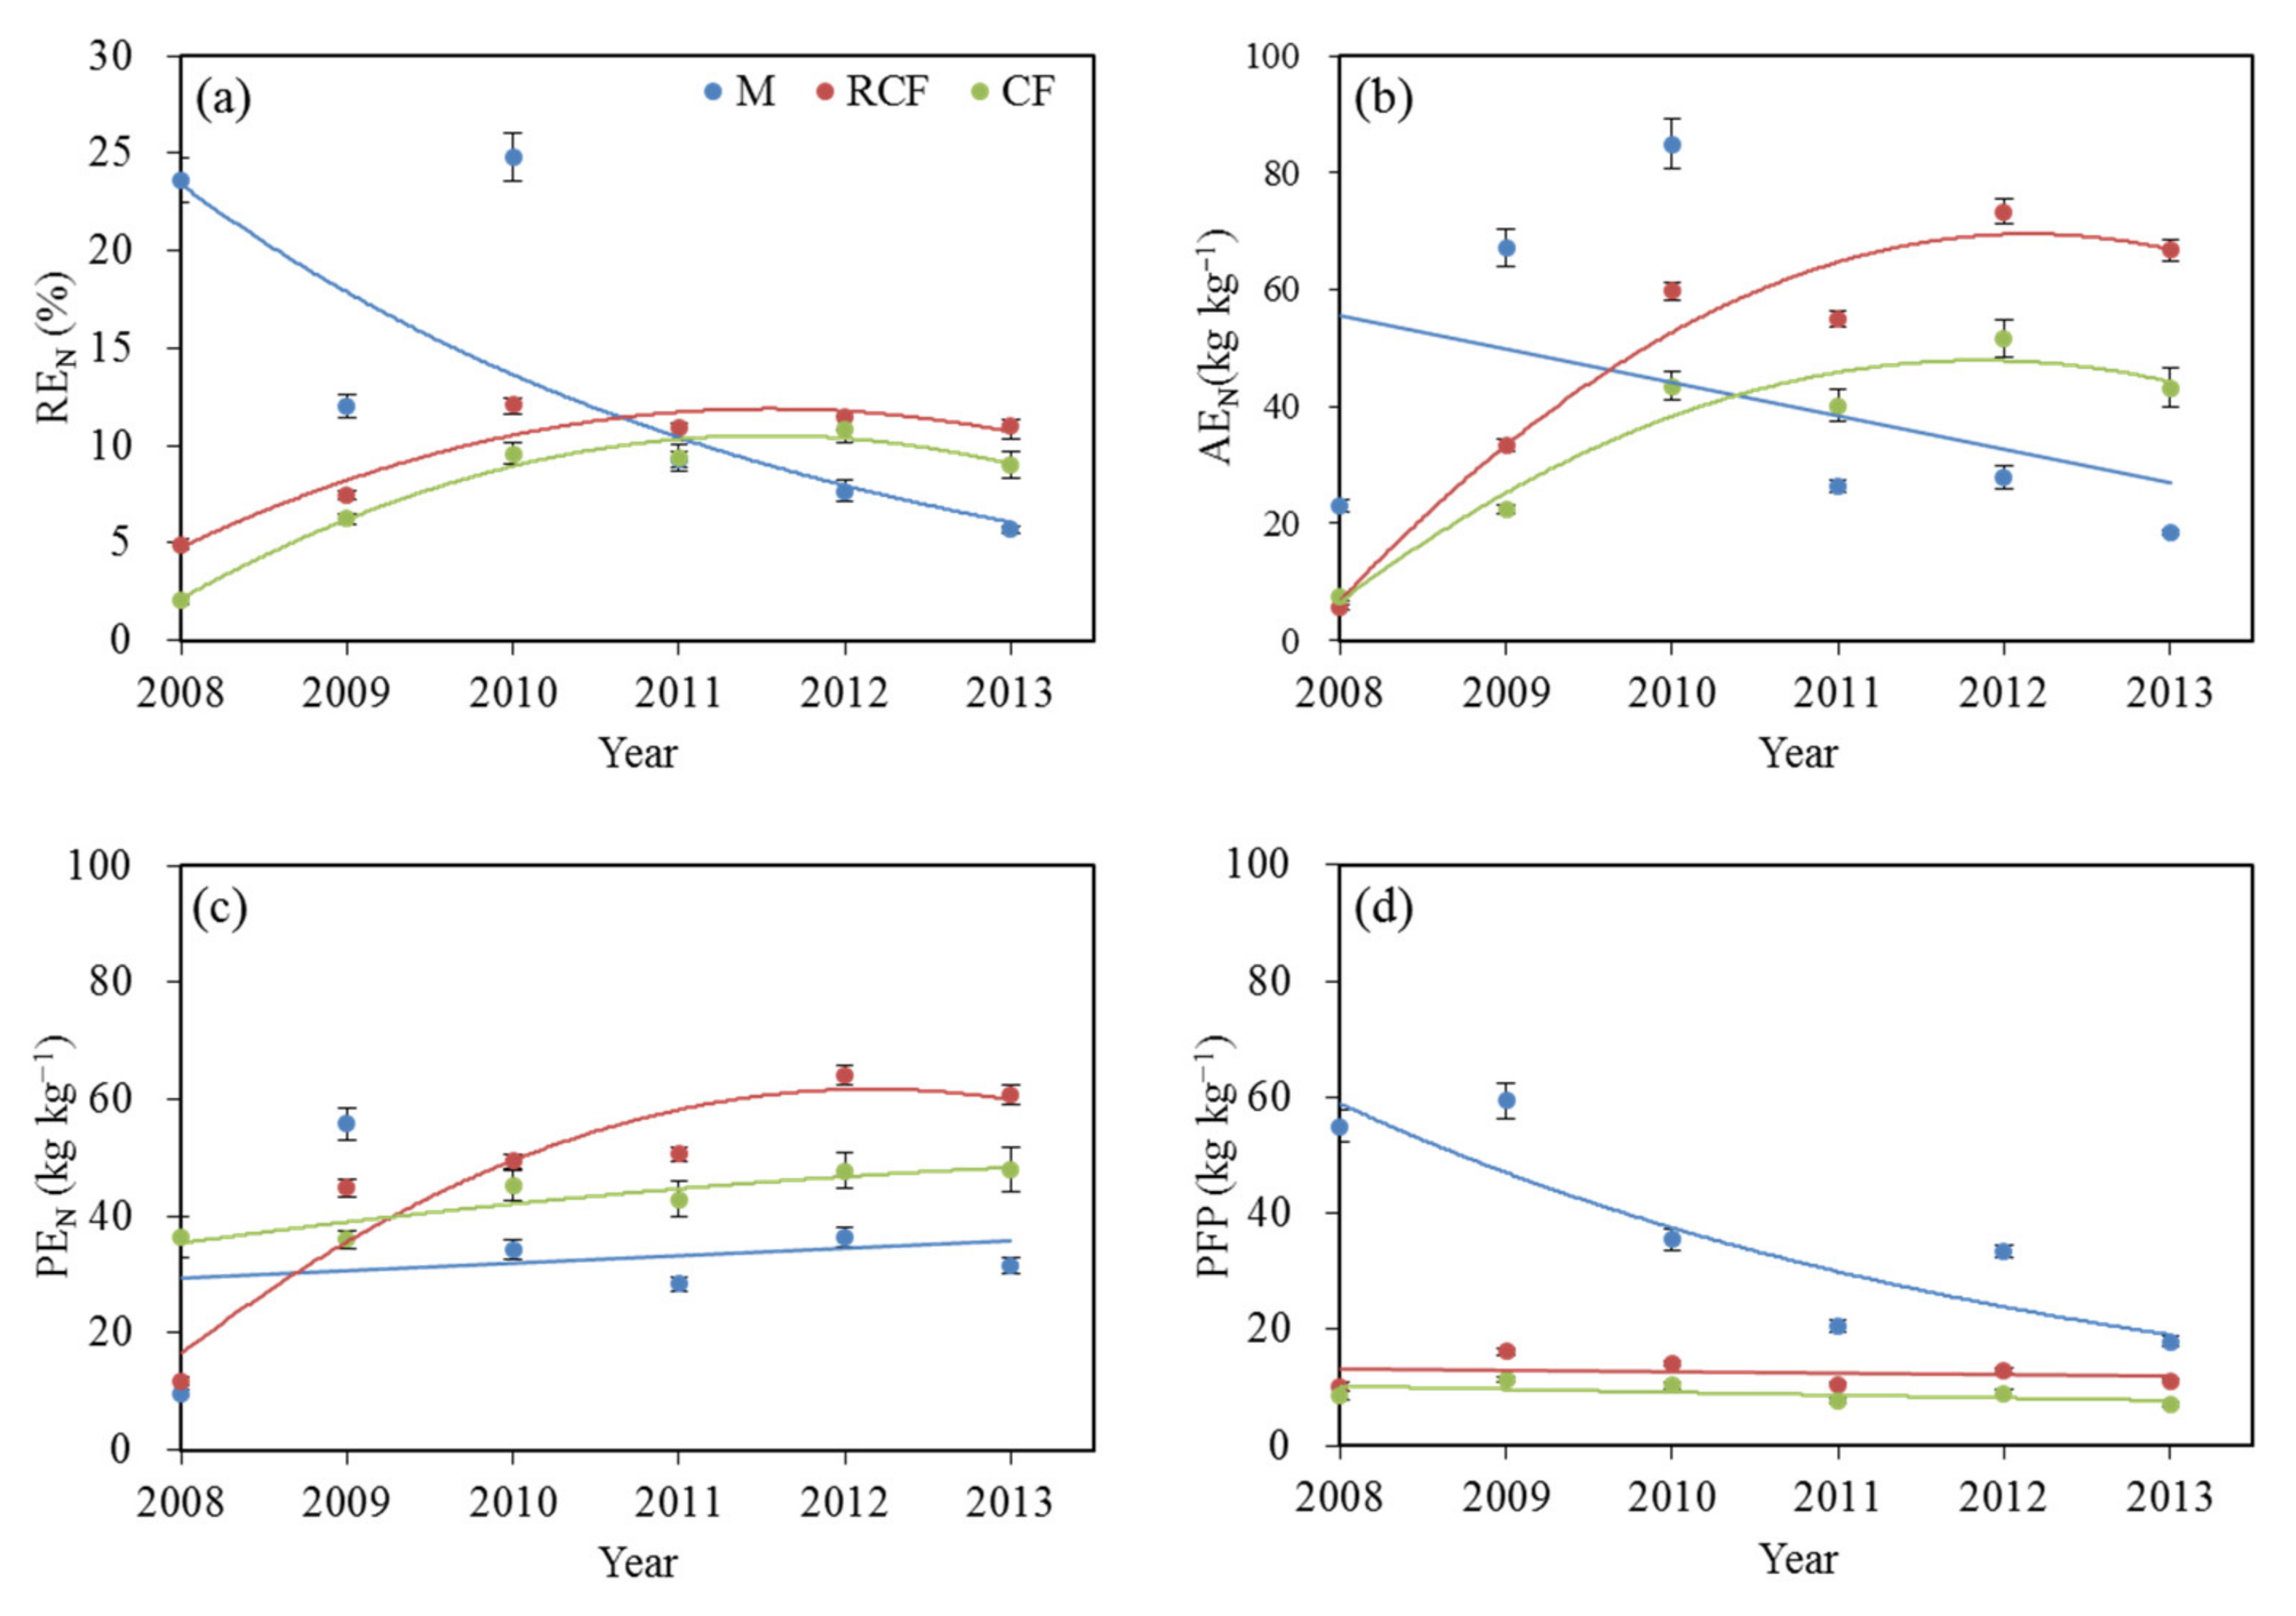
3.2. Nitrogen Use Efficiency
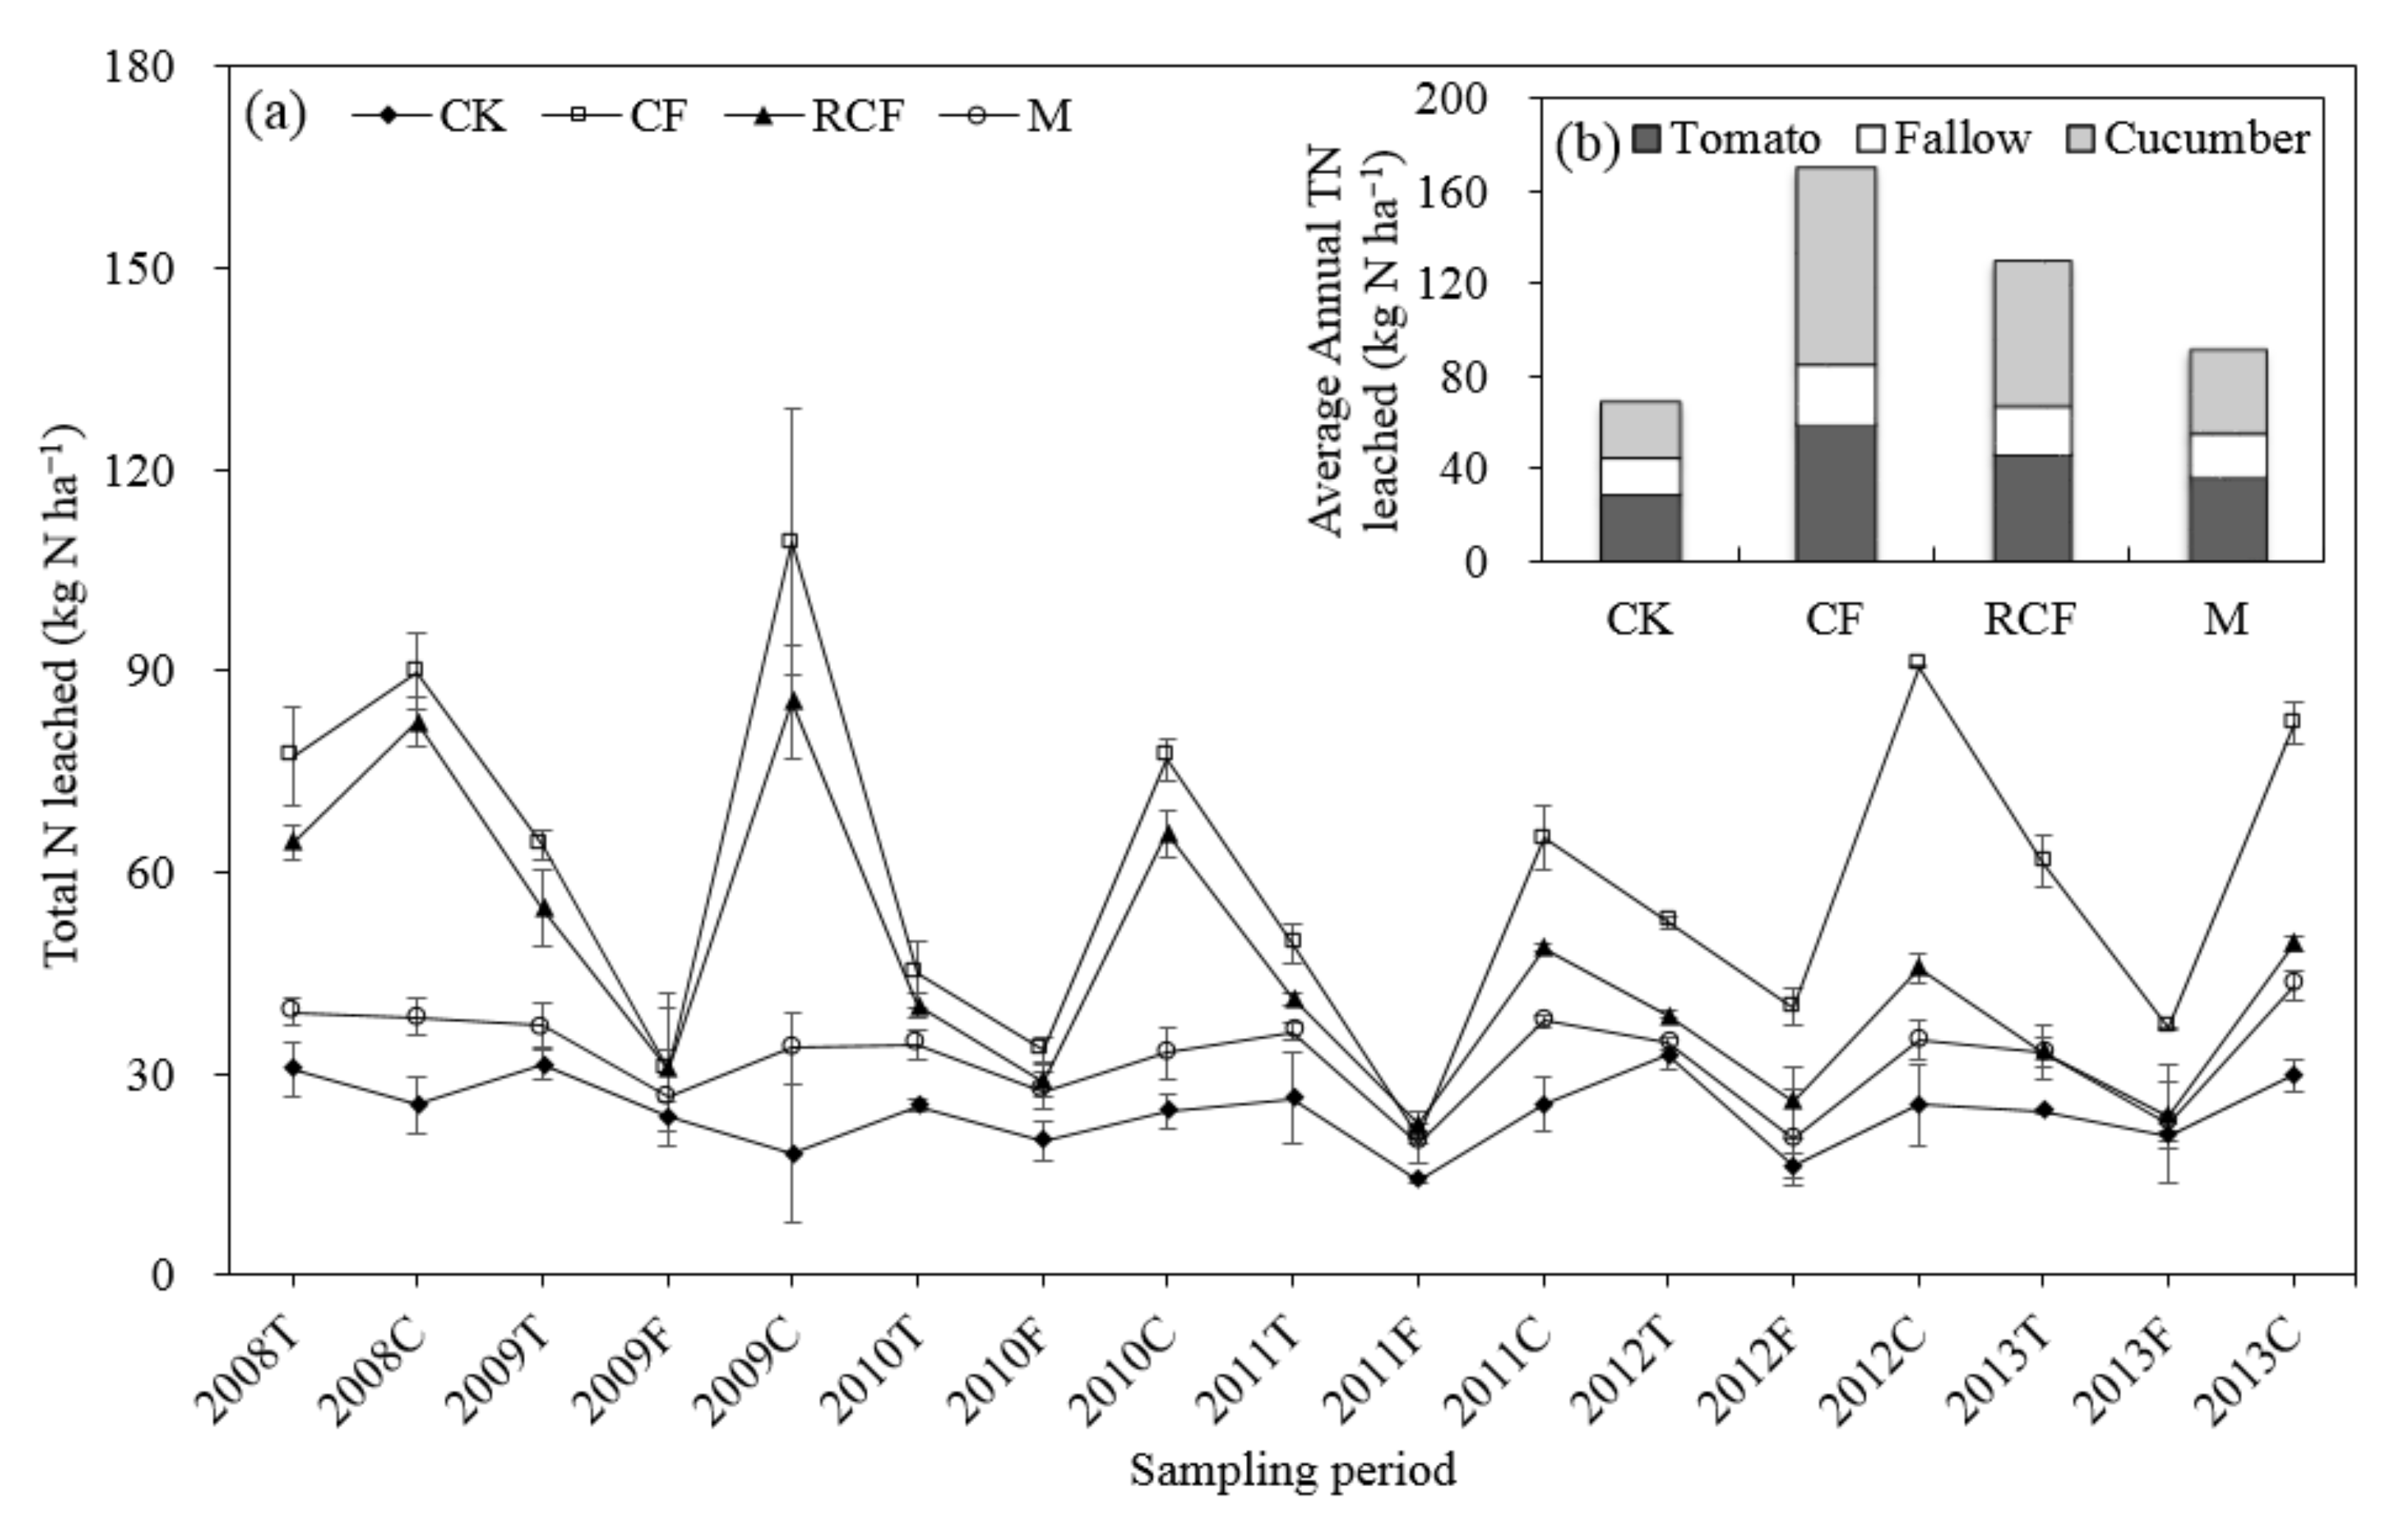
REN, AEN, PEN, and PFPN (Figure 2a–d) differed significantly (p < 0.01) between years and treatments. The REN, AEN, and PFPN of M showed a decreasing trend over the years. The REN, AEN, and PEN showed an upward trend to a relatively stable level year by year. By the end of this experiment, REN was 11.0, 9.0, and 5.7%, AEN was 66.7, 43.2, and 18.5 kg kg−1, and PEN was 60.7, 43.2, and 31.6 kg kg−1 in high to low order of RCF, CF and M, respectively. PFP was highest for M (17.9 kg kg−1), followed by RCF (11.1 kg kg−1) and CF (7.2 kg kg−1).

3.3. N Leaching

The N leaching data are shown in Figure 3. For all rotations, the amount of leached N is the sum of the leaching results measured during all four irrigation cycles throughout the tomato production period. Because of a shortage of water from the Yellow River in 2008, no irrigation was applied during the fallow period in that year. From 2009 to 2012, TN leaching showed an annual cycle for the CF and RCF treatments: it was high during the tomato stage, lowest in the fallow stage, and highest in the cucumber stage, each year. The average annual TN leaching rates from high to low were CF (170.7 kg N ha−1), RCF (130.2 kg N ha−1, 23.7% lower), M (92.0 kg N ha−1, 46.1% lower), and CK (69.0 kg N ha−1, 59.6% lower), respectively. For the CK, CF, RCF, and M treatments, the average annual leaching rates for the tomato stages were 28.5, 58.3, 45.4, and 35.7 kg N ha−1, accounting for 41.2%, 34.1%, 34.8%, and 38.8%, respectively, of the applied N; for the fallow period, they were 15.8, 26.9, 21.9, and 19.4 kg N ha−1, accounting for 22.9%, 15.7%, 16.8%, and 21.1%, respectively; for the cucumber stages, they were 24.8, 85.6, 63.0, and 39.6 kg N ha−1, accounting for 35.8%, 50.1%, 48.3%, and 40.1%, respectively.

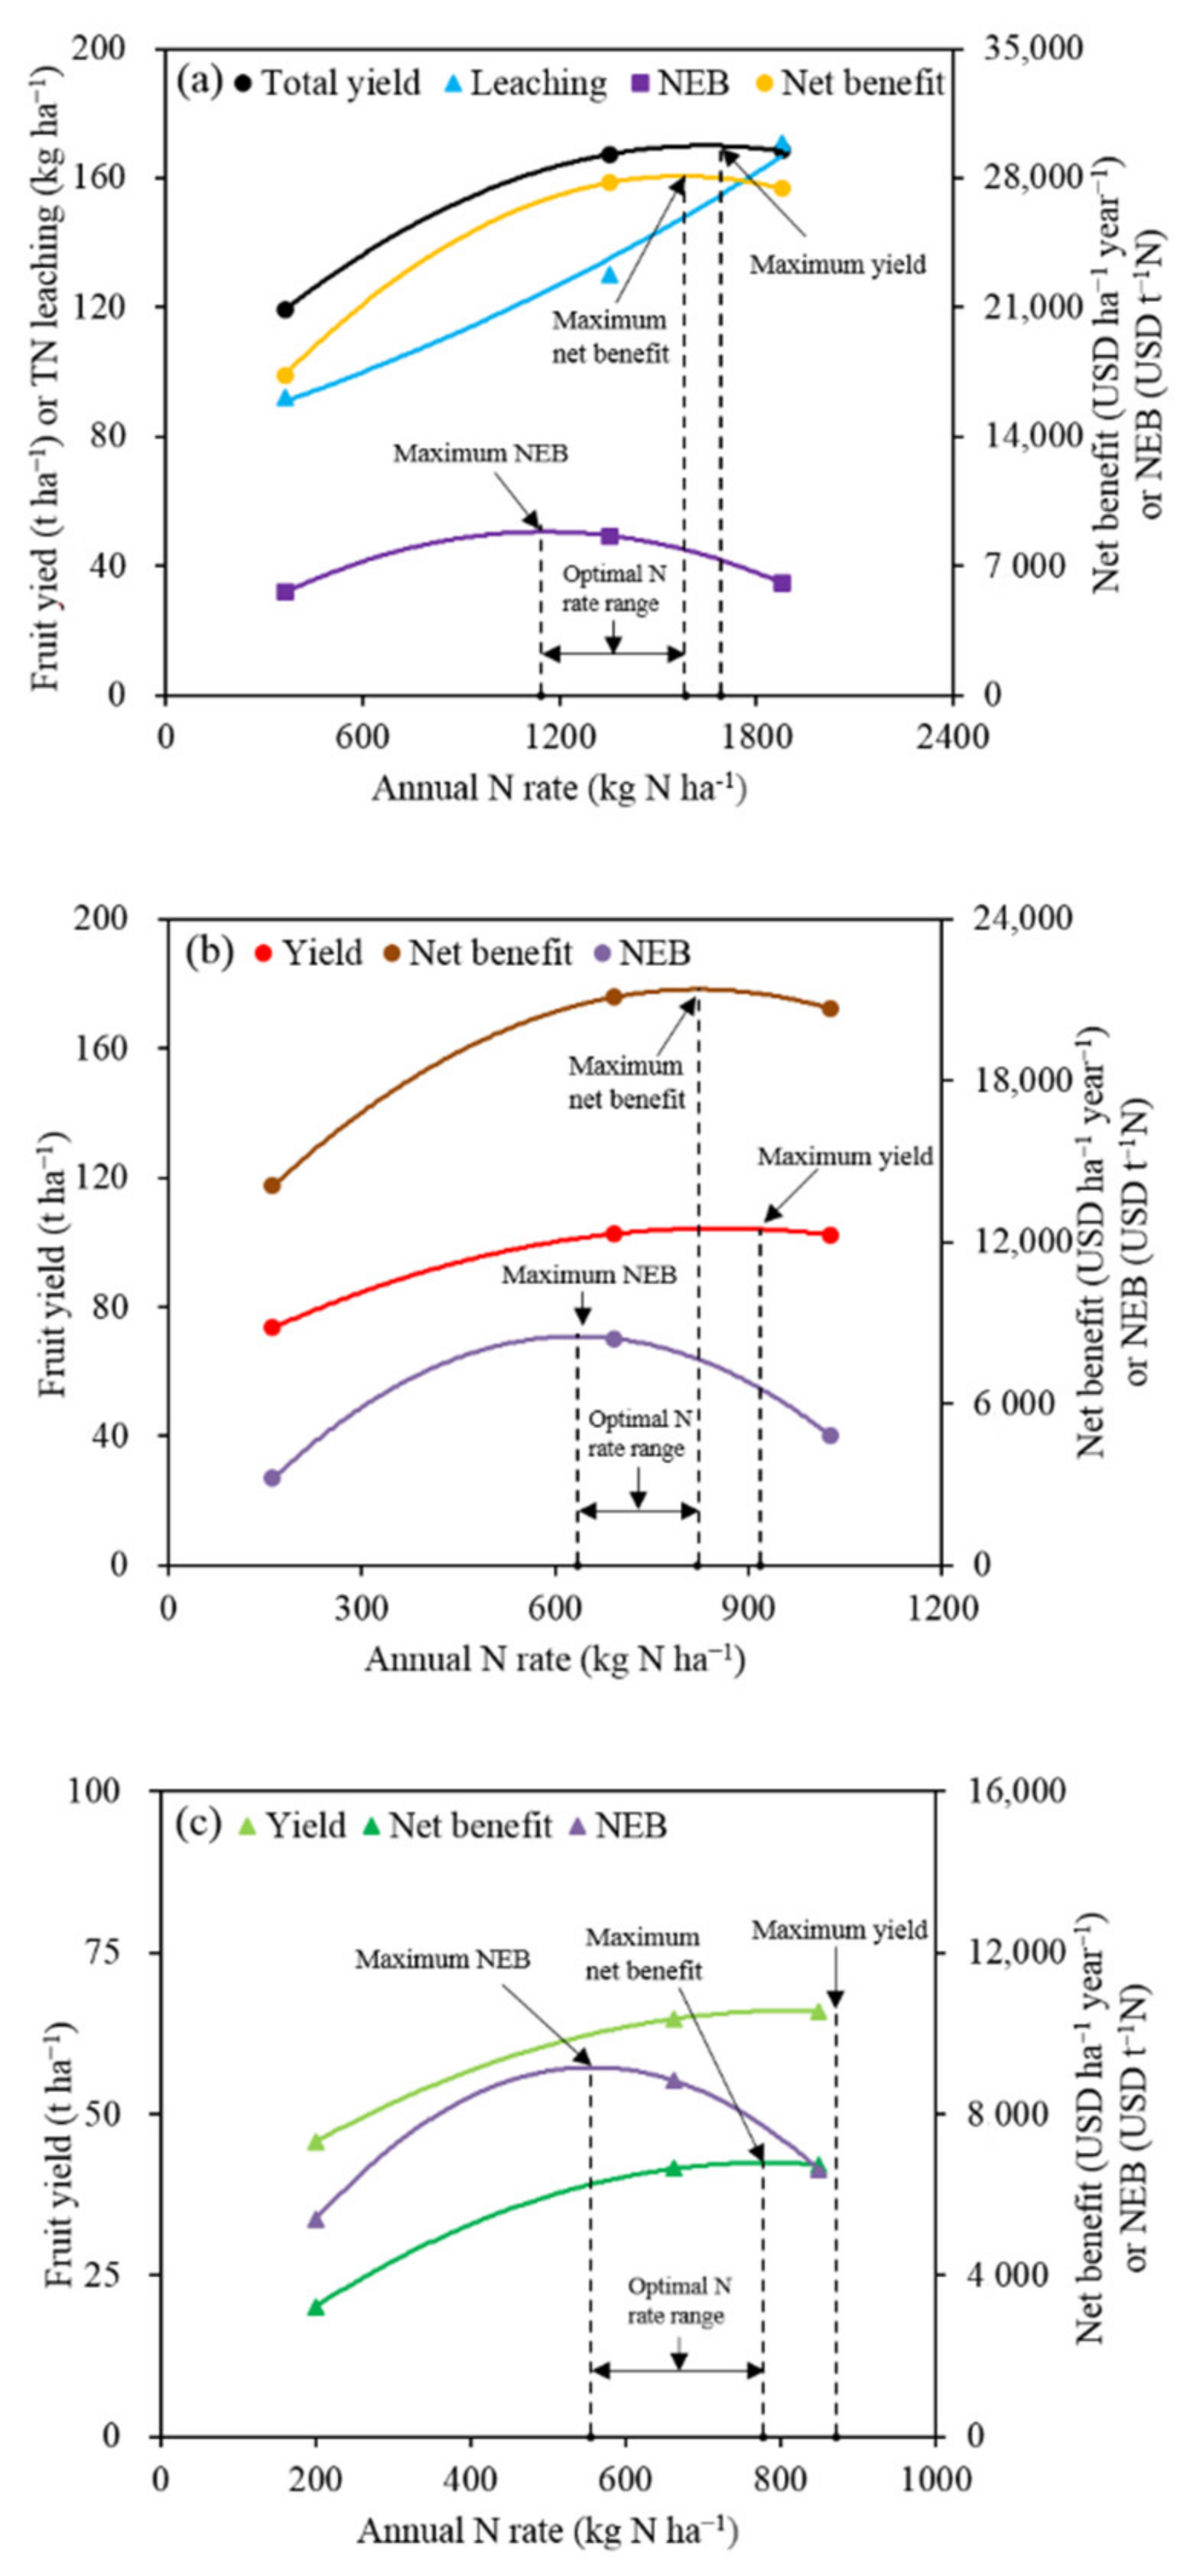
3.4. Economic Analysis

Total expenditure, total income, and TN input are shown in Table 1. The costs for field management were USD 98, 210, 210, and 112, for the CK, CF, RCF, and M treatments, respectively, based on USD 14 d−1 for labor times of 7, 15, 15, and 8 d, respectively. Each year, 45,000 tomato and 48,000 cucumber seedlings were planted per hectare, at a cost of USD 122.4 and 121.2 per thousand, respectively.
The net benefit, NEB, and the input–output ratios (Table 1) were used as the main factors in the economic analysis of N fertilization. The highest net benefit was RCF, which was 1, 64.8, and 83.8% higher than CF, M, and CK, respectively. The RCF group produced the highest NEB, which is 41.8% higher than CF and 93.5% higher than M. The input−output ratio was highest for RCF, followed by CF, CK, and M.

4. Discussion

4.1. Fruit Yield and N Use Efficiency

Nitrogen fertilizer is typically used to improve crop yield [30,31]. However, excessive N input does not increase yields [31,32,33]. In our six-year greenhouse experiment, we found that reducing a certain amount of N content did not significantly reduce fruit yield, relative to the conventional fertilization used by local farmers. This indicates that the local conventional fertilization practice provides excessive fertilization. Reducing chemical fertilizer application from 1027 kg ha−1 N to 692 kg ha−1 N by 38.7% (335 kg ha−1 N) for tomato and from 850 kg ha−1 N to 662 kg ha−1 N by 28.8% (188 kg ha−1 N) for cucumber did not negatively affect fruit yield.
In the first year, the yield of the control treatment was not significantly different from that of the other treatments. This reflects previous excessive fertilization, leading to N accumulation in the soil, which supported growth during the first tomato season. However, the yield of the control treatment was lower in 2009, indicating that there was insufficient accumulated N in the soil to support tomato growth after N absorption by tomatoes and cucumbers in 2008. Based on this, crop yields could be severely reduced when no fertilizer is applied.
Organic fertilizer supplementation can improve soil biological quality and function, thereby further improving crop yield [34,35]. This view has been generally accepted by local farmers in the region. When we applied organic fertilizer only, with an average annual N input of 362 kg ha−1, tomato yield was the same as that of the reduced chemical fertilizer treatment for the first two years. The significant yield reduction occurred in the third year. We speculate that a single application of organic N can delay the reduction in vegetable yield, even when no chemical fertilizer N is used; however, the organic fertilizer level in this research was insufficient to support production in the third year.
The average fruit yield was 13.8% higher in the organic (M) treatment (at 119.2 t ha−1) than in the control (CK) treatment (at 104.7 t ha−1). However, only organic N application was substantially lower than those of the conventional and reduced fertilizer treatments (168.4 and 167.4 kg ha−1, respectively). These results indicate that reducing 100% of chemical fertilizer reduces yield. As expected, 27.8% reduced fertilization (from 1877 to 1354 kg ha−1) produced similar yields to conventional fertilization. This is consistent with previous findings that yields can be maintained under appropriate chemical fertilizer reduction [36,37,38], this could be associated with the slow or insufficient N supply from the organic source.
Excessive fertilization not only contributes little in terms of increasing yield but also increases N accumulation in soil [39]. Due to the high background nitrogen accumulation in the soil, long-term observation is needed to obtain relatively accurate results in the comparison of different nitrogen application levels. As shown in Figure 2, the REN and AEN levels in CF and RCF exceeded M in the fourth year. And the PEN level in CF and RCF exceeded M in the third year. Then, the situation was kept for the following years. Therefore, we believe that the evaluation of NUE with the results of the sixth year is reliable.
The relationship between CF and RCF for NUE in this research indicates that a moderate reduction in chemical fertilizer N application could improve NUE in an organic–inorganic fertilization situation. The main reason for this might be the balanced N supply from both sources, quicker at early stages from an inorganic source, and slow release throughout the cropping time by an organic source. Our observations are consistent with previous findings that moderate chemical fertilizer reductions can improve N use efficiency in areas that have been over-fertilized [40]. The NUE is typically negatively correlated with the N fertilizer application rate [41]. The PFP in our research have the same situation. Contrary to expectations, in spite of the N application being lower in M than that of CF, the REN, AEN, and PEN were also lower than that of CF in the end. It can be inferred that compared with the application of organic fertilizer alone, the combined application of organic and inorganic fertilizer can effectively improve REN, AEN, and PEN.

4.2. N Leaching

It has been reported that N leaching rates differ between years (2008–2014) for crops field [15]. Compared with short-term batch tests, long-term positioning tests are more reliable for comparing differences in N leaching among treatments [7,15]. Soil N leaching is related to excessive irrigation, heavy rainfall, over-fertilization, and poor tillage management [42]. In our six-year greenhouse positioning experiment, by controlling for irrigation and tillage mode, differences in leaching were explained mostly by differences in fertilizer input. Reducing chemical fertilizer N application by 34.5% from conventional levels reduced TN leaching significantly by 39.8%, and when using only organic manure fertilizer, reduced it by 77.4% (Figure 3b). This indicates that N leaching is directly related to the amount of chemical fertilizer used; therefore, reducing chemical fertilizer N input is an effective way to reduce N leaching, which is consistent with the previous studies [33,43].
During the fallow period, no fertilization was applied, and irrigation was reduced, causing TN leaching to be relatively low (15.7–22.9%). In the CK treatment, TN leaching was 5.4% higher for tomatoes than for cucumbers. In contrast, tomatoes had lower TN leaching in the CF, RCF, and M treatments by 16.0%, 13.5%, and 1.2%, respectively, compared with cucumbers. This indicates that relative to tomato cultivation, cucumbers have a higher risk of leaching caused by fertilization. Hence, reducing N application for cucumber cultivation has the potential to reduce N leaching.
Organic fertilizer application at 100 and 200 kg N ha−1 year−1 N was shown to cause N leaching at 85.2 and 105.5 kg ha−1, which were 18.3 and 38.6 kg ha−1 higher than control (66.9 kg ha−1), respectively [44]. A greenhouse vegetable study found that applying poultry manure at less than 217.7 kg ha−2 N did not negatively affect groundwater; however, double N application will lead to an increase in leaching N [45]. In our study, the organic fertilizer N input was 362 kg ha−1 year−1, which carries the risk of enhancing N loss. Nitrogen leaching was 92 kg ha−1 year−1 in the M treatment and 69 kg ha−1 year−1 in the control counterpart (Table 2); note that this difference of 23 kg ha−1 year−1 was caused by organic N input. Then, the N leaching caused by the chemical N input part of CF and RCF were 78 and 39 kg ha−1 year−1, respectively. Furthermore, the organic fertilizer N leaching-to-input ratio (NLIRON) was 6.4%, which was significantly higher (by 42.2%) than that of the conventional fertilizer treatment (4.5%), and 178.3% greater than that of the reduced fertilizer treatment (77.8%). The N leaching-to-input ratio (NLIRCN) in CF and RCF was 3.5% and 2.3%, which were 45.3% and 64.0% lower than NLIRON, respectively. Therefore, we found that organic fertilization carries a higher risk of N leaching than chemical fertilization, which is consistent with some earlier findings [46,47], despite more research having widely shown that the application of organic N fertilizer would cause a decrease in N leaching than inorganic [48,49,50]. Most of the nitrogen in organic fertilizer exists in the form of macromolecular, which can only be absorbed by plants after a certain period of dissolution by a series of microbial-mediated steps [51,52]. Therefore, compared with inorganic nitrogen from chemical N, it is difficult to be directly used by crops. These macromolecular N and dissolved N from organic fertilizer would also be lost by leaching when irrigation happened [53]. Therefore, we speculate that slow nitrogen dissolution, limited uptake by plants, and solubility of organic N are the main reasons for the high N leaching loss of organic fertilizer. However, further research is still needed to confirm the details. Previous studies have found that a combination of chemical and organic fertilizer is a sustainable fertilization approach [54], which can promote crop productivity and N uptake, and reduces N losses [55,56]. Similarly, our findings support combined chemical and organic fertilization, while improving the activity of N-transforming microbes in the soil by organic manure, the deficiency of N leaching was balanced.

4.3. Economic Benefit Analysis

Fertilizer N input is the main factor affecting crop yield and economic benefits [57]. We found that reduced chemical fertilization produced a similar economic net benefit to conventional fertilization, whereas 100% chemical fertilization reduction produced 38.7% less net benefit than conventional fertilization (Table 1). Although organic fertilization alone reduces production costs (the chemical fertilizer part), it also significantly reduces profitability. Therefore, moderate chemical fertilizer reduction was an effective way to balance production costs and maintain profitability. Reduced chemical fertilization also increased NEB by 41.8%, whereas organic fertilization alone reduced it by 26.7%. It can be inferred that the NEB of a single application of organic fertilizer was much lower than that of a mixed application of organic and chemical fertilizer. Further, it can be seen that organic fertilizer alone is inferior to chemical fertilizer for increasing economic growth. Although the advantages of organic fertilizer application are generally recognized, its relatively low N content and the large amounts required make its cost far higher than that of chemical fertilizer [58,59,60].
Ranking the treatments in terms of their input–output ratios, in ascending order, yielded the following order: M, CK, CF, and RCF. This result showed that only organic fertilizer will not bring economic benefits (M < CK), and an appropriate reduction in chemical fertilizer in areas where there has been excessive fertilization can effectively improve the economic benefit of N fertilization (RCF < CF). Similarly, for a rice–wheat rotation system, Wang et al. [61] found that a 50% reduction in chemical fertilizer N raised NEB by 320.8% and increased the input–output ratio from 1:3.0 to 1:4.0, relative to conventional tillage [62].

4.4. Selecting the Optimum N Application Rate

In conventional agricultural production in China, the yield and economic benefits related to the N application rate are the most important driving factors [63,64,65]. To reduce the high production costs and environmental pollution risks caused by excessive N input, sustainable agriculture aims to balance the N application rate, with both ecological and agronomic benefits [66,67,68]. Therefore, we aimed to determine the optimum range of N application rates to balance N leaching, vegetable yield, net benefit, and NEB in greenhouse vegetable farming. Organic fertilizer was applied at the same rate in the organic fertilization, conventional fertilization, and reduced conventional fertilization treatments. Figure 4 illustrates the effects of each treatment on yield, N leaching, net benefit, and the N fertilizer economic benefit.
Yang et al. [15] found that TN leaching at less than 170 kg ha−1 would cause no environmental harm. In our study, the highest average annual N leaching rate was 170.7 kg ha−1 in conventional fertilization treatment, at the N application rate of 1877 kg ha−1, and N leaching was lower when the N application rate was reduced. Therefore, we consider a total average annual N input of less than 1877 kg ha−1 to be safe for the environment. In the tomato/cucumber rotation, the maximum yield was obtained at an annual N application rate of 1691 kg ha−1, using 12.3% less chemical fertilizer N than conventional fertilization (Figure 4a). Generally, the N application rate that maximizes the crop’s economic benefit is lower than that which maximizes yield [62,69]. Our findings were similar: the maximum net benefit occurred at an annual N application rate of 1583 kg ha−1 (108 kg ha−1 lower than the rate that maximized fruit yield), and using 19.4% less chemical fertilizer N than conventional fertilization. The maximum NEB was obtained at the annual N rate of 1143 kg N ha−1, using 48.4% less chemical fertilizer N than conventional fertilization. Maximum NEB reflects the most economical use of chemical N fertilizer. Further, using less N reduces N leaching and the risk of environmental pollution; hence, NEB may become a key indicator for determining chemical fertilizer N use in the future. We, therefore, recommend N application rates of 1143 and 1583 kg ha−1 for tomato and cucumber greenhouse farming, respectively, and reducing chemical fertilizer N application rates by 19.4% and 48.4%, respectively, relative to conventional fertilization. The maximum yield, net benefit, and NEB for tomatoes occurred at N application rates of 918, 821, and 634 kg ha−1, respectively (Figure 4b); for cucumbers, they occurred at 871, 778, and 556 kg ha−1, respectively (Figure 4c). In summary, our findings indicate that the optimal ranges of N application rates for greenhouse production of tomatoes and cucumbers are 634–821 kg ha−1 and 556–778 kg ha−1, respectively, under current experimental conditions.

4.5. Practical Implementation of the Study

The practical application of this study will be an effective tool to control N pollution. Several studies, including the current one, discuss effectively the FRT reducing the crop yield. Some of the published material indicates that even a huge decrease in chemical fertilization can control the yield losses in combination to the environmental safety [21,22,23]. The integrative use of controlled chemical fertilization in combination with organic fertilization can significantly improve the yield attributes and cost effectiveness and control environmental pollution. It is further recommended to conduct future research experiments on combined fertilization of organic and inorganic N, trying various fertilization resources, site-specific and crop-specific studies, following the short-term and long-term studies.

5. Conclusions

Because it produces the highest yield and total income, conventional fertilization is highly preferred by farmers. In our study, conventional fertilization had the lowest N use efficiency and highest N leaching among the treatments, and lower economic benefit and NEB than reduced conventional fertilization. Reduced conventional fertilization produced the optimal N fertilization approach. Although organic fertilization provides benefits such as improving soil texture and soil microorganism diversity, the high N leaching ratio and low economic benefits caused by organic fertilization mean that it is not ideal. Therefore, it is feasible to use organic fertilizer with chemical fertilizer to produce an optimum fertilization scheme. Further studies are needed to explore the optimal reduction in chemical fertilizer use and optimal proportions of chemical and organic fertilizer.

Author Contributions

Conceptualization, Y.G., M.A.B., X.L., H.W., X.Z. and H.L.; data curation, Y.Z., J.L., F.L., Q.-U.-A.R. and A.R.; formal analysis, Y.G., J.L. and F.L.; funding acquisition, X.Z.; Investigation, Y.G. and Y.Z.; methodology, M.A.B., X.L., H.W., A.R. and H.L.; project administration, H.W. and X.Z.; Resources, X.L. and H.L.; software, M.A.B., Y.Z., J.L. and Q.-U.-A.R.; supervision, H.L.; validation, F.L.; writing—original draft, Y.G.; writing—review & editing, M.A.B., Y.Z., J.L., X.L., F.L., H.W., Q.-U.-A.R., A.R., X.Z. and H.L. All authors have read and agreed to the published version of the manuscript.

Funding

This study was supported by the National Natural Science Foundation of China [grant number: U20A20114].

Institutional Review Board Statement

Not applicable.

Informed Consent Statement

Not applicable.

Acknowledgments

We sincerely thank Jungai Li for her substantial help in the data analysis. We also thank Andre Brito and Luiz Silva for the help of data analysis and language polishing work.

Conflicts of Interest

The authors declare no conflict of interest.

References

  1. Nordey, T.; Basset-mens, C.; de Bon, H.; Martin, T.; Déletré, E.; Simon, S.; Parrot, L.; Despretz, H.; Huat, J.; Biard, Y.; et al. Protected cultivation of vegetable crops in sub-Saharan Africa: Limits and prospects for smallholders: A review. Agron. Sustain. Dev. 2017, 37, 53. [Google Scholar] [CrossRef] [Green Version]
  2. Chang, J.; Wu, X.; Liu, A.; Wang, Y.; Xu, B.; Yang, W.; Meyerson, L.; Gu, B.; Peng, C.; Ge, Y. Assessment of net ecosystem services of plastic greenhouse vegetable cultivation in China. Ecol. Econ. 2011, 70, 740–748. [Google Scholar] [CrossRef]
  3. Xu, L.; Lu, A.; Wang, J.; Ma, Z.; Pan, L.; Feng, X.; Luan, Y. Accumulation status, sources and phytoavailability of metals in greenhouse vegetable production systems in Beijing, China. Ecotoxicol. Environ. Saf. 2015, 122, 214–220. [Google Scholar] [CrossRef] [PubMed]
  4. Ministry of Agriculture China. China Agriculture Statistical Report 2008; China Agriculture Press: Beijing, China, 2009.
  5. Hu, W.; Huang, B.; Tian, K.; Holm, P.E.; Zhang, Y. Heavy metals in intensive greenhouse vegetable production systems along Yellow Sea of China: Levels, transfer and health risk. Chemosphere 2017, 167, 82–90. [Google Scholar] [CrossRef]
  6. Li, J.; Wan, X.; Liu, X.; Chen, Y.; Slaughter, L.C.; Weindorf, D.C.; Dong, Y. Changes in soil physical and chemical characteristics in intensively cultivated greenhouse vegetable fields in North China. Soil Tillage Res. 2019, 195, 104366. [Google Scholar] [CrossRef]
  7. Li, J.; Liu, H.; Wang, H.; Luo, J.; Zhang, X.; Liu, Z.; Zhang, Y.; Zhai, L.; Lei, Q.; Ren, T.; et al. Managing irrigation and fertilization for the sustainable cultivation of greenhouse vegetables. Agric. Water Manag. 2018, 210, 354–363. [Google Scholar] [CrossRef]
  8. Yang, X.; Lu, Y.; Ding, Y.; Yin, X.; Raza, S.; Tong, Y. Optimising nitrogen fertilisation: A key to improving nitrogen-use efficiency and minimising nitrate leaching losses in an intensive wheat/maize rotation (2008–2014). Field Crop. Res. 2017, 206, 1–10. [Google Scholar] [CrossRef]
  9. Liang, H.; Hu, K.; Batchelor, W.; Qin, W.; Modelling, B.L.-E. Developing a water and nitrogen management model for greenhouse vegetable production in China: Sensitivity analysis and evaluation. Ecol. Model. 2018, 367, 24–33. [Google Scholar] [CrossRef]
  10. Zhu, J.; Li, X.; Christie, P.; Agriculture, J.L. Environmental implications of low nitrogen use efficiency in excessively fertilized hot pepper (Capsicum frutescens L.) cropping systems. Agric. Ecosyst. Environ. 2005, 111, 70–80. [Google Scholar] [CrossRef] [Green Version]
  11. Yu, H.; Li, T.; Zhang, X.Z. Nutrient budget and soil nutrient status in greenhouse system. Agric. Sci. China 2010, 9, 871–879. [Google Scholar] [CrossRef]
  12. Hui-min, J.; Jian-feng, Z.; Xiao-zong, S.; Zhao-hui, L.I.U.; Li-hua, J. Responses of Agronomic Benefit and Soil Quality to Better Management of Nitrogen Fertilizer Application in Greenhouse Vegetable Land ∗ 1. Pedosph. Int. J. 2012, 22, 650–660. [Google Scholar] [CrossRef]
  13. Ju, X.; Kou, C.; Zhang, F.; Christie, P. Nitrogen balance and groundwater nitrate contamination: Comparison among three intensive cropping systems on the North China Plain. Environ. Pollut. 2006, 143, 117–125. [Google Scholar] [CrossRef] [PubMed] [Green Version]
  14. Wang, Y.; Li, K.; Tanaka, T.S.T.; Yang, D.; Inamura, T. Soil nitrate accumulation and leaching to groundwater during the entire vegetable phase following conversion from paddy rice. Nutr. Cycl. Agroecosyst. 2016, 106, 325–334. [Google Scholar] [CrossRef]
  15. Lu, J.; Hu, T.; Zhang, B.; Wang, L.; Yang, S.; Fan, J.; Yan, S.; Zhang, F. Nitrogen fertilizer management effects on soil nitrate leaching, grain yield and economic benefit of summer maize in Northwest China. Agric. Water Manag. 2021, 247, 106739. [Google Scholar] [CrossRef]
  16. Min, J.; Shi, W. Nitrogen discharge pathways in vegetable production as non-point sources of pollution and measures to control it. Sci. Total Environ. 2018, 613–614, 123–130. [Google Scholar] [CrossRef]
  17. Kaushal, S.S.; Gro, P.M.; Band, L.E.; Elliott, E.M.; Shields, C.A.; Kendall, C. Tracking Nonpoint Source Nitrogen Pollution in Human-Impacted Watersheds. Environ. Sci. Technol. 2011, 45, 8225–8232. [Google Scholar] [CrossRef]
  18. Perego, A.; Basile, A.; Bonfante, A.; de Mascellis, R.; Terribile, F.; Brenna, S.; Acutis, M. Nitrate leaching under maize cropping systems in Po Valley (Italy). Agric. Ecosyst. Environ. 2012, 147, 57–65. [Google Scholar] [CrossRef]
  19. Lambert, D.K.; Lambert, D.K. Risk Considerations in the Reduction of Nitrogen Fertilizer Use in Agricultural Production. West. J. Agric. Econ. 1990, 15, 234–244. [Google Scholar]
  20. Vieira, I.S.; Vasconcelos, E.P.; Monteiro, A. Nitrate accumulation, yield and leaf quality of turnip greens in response to nitrogen fertilisation. Nutr. Cycl. Agroecosyst. 1998, 51, 249–258. [Google Scholar] [CrossRef]
  21. Min, J.; Zhang, H.; Shi, W. Optimizing nitrogen input to reduce nitrate leaching loss in greenhouse vegetable production. Agric. Water Manag. 2012, 111, 53–59. [Google Scholar] [CrossRef]
  22. Wang, D.; Guo, L.; Zheng, L.; Zhang, Y.; Yang, R.; Li, M.; Ma, F.; Zhang, X.; Li, Y. Effects of nitrogen fertilizer and water management practices on nitrogen leaching from a typical open field used for vegetable planting in northern China. Agric. Water Manag. 2019, 213, 913–921. [Google Scholar] [CrossRef]
  23. Zhao, Y.; Luo, J.H.; Chen, X.Q.; Zhang, X.J.; Zhang, W.L. Greenhouse tomato-cucumber yield and soil N leaching as affected by reducing N rate and adding manure: A case study in the Yellow River Irrigation Region China. Nutr. Cycl. Agroecosyst. 2012, 94, 221–235. [Google Scholar] [CrossRef]
  24. Lu, Y.; Chadwick, D.R.; Norse, D.; Powlson, D.S.; Shi, W. Sustainable intensification of China’s agriculture: The key role of nutrient management and climate change mitigation and adaptation. Agric. Ecosyst. Environ. 2005, 209, 1–4. [Google Scholar] [CrossRef]
  25. Peng, S.; Buresh, R.J.; Huang, J.; Yang, J.; Zou, Y.; Zhong, X.; Wang, G.; Zhang, F. Strategies for overcoming low agronomic nitrogen use efficiency in irrigated rice systems in China. Field Crop. Res. 2006, 96, 37–47. [Google Scholar] [CrossRef]
  26. Huang, J.; Xiang, C.; Jia, X.; Water, R.H.-J. Impacts of training on farmers’ nitrogen use in maize production in Shandong, China. J. Soil Water Conserv. 2012, 67, 321–327. [Google Scholar] [CrossRef] [Green Version]
  27. Jia, X.-p.; Huang, J.K.; Xiang, C.; Hou, L.-k.; Zhang, F.-s.; Chen, X.-p.; Cui, Z.-l.; Bergmann, H. Farmer’s Adoption of Improved Nitrogen Management Strategies in Maize Production in China: An Experimental Knowledge Training. J. Integr. Agric. 2013, 12, 364–373. [Google Scholar] [CrossRef]
  28. Huang, J.; Huang, Z.; Jia, X.; Hu, R.; Xiang, C. Long-term reduction of nitrogen fertilizer use through knowledge training in rice production in China. Agric. Syst. 2015, 135, 105–111. [Google Scholar] [CrossRef]
  29. Qiao, J.; Yang, L.; Yan, T.; Xue, F.; Zhao, D. Nitrogen fertilizer reduction in rice production for two consecutive years in the Taihu Lake area. Agric. Ecosyst. Environ. 2012, 146, 103–112. [Google Scholar] [CrossRef]
  30. Erisman, J.; Sutton, M.; Galloway, J.; Klimont, Z.; Winiwarter, W. How a century of ammonia synthesis changed the world. Nat. Geosci. 2008, 1, 636–639. [Google Scholar] [CrossRef]
  31. Du, Y.D.; Gu, X.B.; Wang, J.W.; Niu, W.Q. Yield and gas exchange of greenhouse tomato at different nitrogen levels under aerated irrigation. Sci. Total Environ. 2019, 668, 1156–1164. [Google Scholar] [CrossRef]
  32. Badr, M.A.; Abou-Hussein, S.D.; El-Tohamy, W.A. Tomato yield, nitrogen uptake and water use efficiency as affected by planting geometry and level of nitrogen in an arid region. Agric. Water Manag. 2016, 169, 90–97. [Google Scholar] [CrossRef]
  33. Wang, H.; Li, J.; Cheng, M.; Zhang, F.; Wang, X.; Fan, J.; Wu, L.; Fang, D.; Zou, H.; Xiang, Y. Optimal drip fertigation management improves yield, quality, water and nitrogen use efficiency of greenhouse cucumber. Sci. Hortic. 2019, 243, 357–366. [Google Scholar] [CrossRef]
  34. Sánchez-Monedero, M.A.; Mondini, C.; Cayuela, M.L.; Roig, A.; Contin, M.; De Nobili, M. Fluorescein diacetate hydrolysis, respiration and microbial biomass in freshly amended soils. Biol. Fertil. Soils 2008, 44, 885–890. [Google Scholar] [CrossRef]
  35. Tao, R.; Liang, Y.; Wakelin, S.A.; Chu, G. Supplementing chemical fertilizer with an organic component increases soil biological function and quality. Appl. Soil Ecol. 2015, 96, 42–51. [Google Scholar] [CrossRef]
  36. Gai, X.; Liu, H.; Zhai, L.; Tan, G.; Liu, J.; Ren, T.; Wang, H. Vegetable yields and soil biochemical properties as influenced by fertilization in Southern China. Appl. Soil Ecol. 2016, 107, 170–181. [Google Scholar] [CrossRef]
  37. Yang, X.Y.; Sun, B.H.; Zhang, S.L. Trends of Yield and Soil Fertility in a Long-Term Wheat-Maize System. J. Integr. Agric. 2014, 13, 402–414. [Google Scholar] [CrossRef]
  38. Zhang, W.; Xu, M.; Wang, X.; Huang, Q.; Nie, J.; Li, Z.; Li, S.; Hwang, S.W.; Lee, K.B. Effects of organic amendments on soil carbon sequestration in paddy fields of subtropical China. J. Soils Sediments 2012, 12, 457–470. [Google Scholar] [CrossRef]
  39. Zhou, J.; Gu, B.; Schlesinger, W.H.; Ju, X. Significant accumulation of nitrate in Chinese semi-humid croplands. Sci. Rep. 2016, 6, 25088. [Google Scholar] [CrossRef] [Green Version]
  40. Zhang, H.; Yu, C.; Kong, X.; Hou, D.; Gu, J.; Liu, L.; Wang, Z.; Yang, J. Progressive integrative crop managements increase grain yield, nitrogen use e ffi ciency and irrigation water productivity in rice. Field Crop. Res. 2018, 215, 1–11. [Google Scholar] [CrossRef]
  41. Zhang, X.; Davidson, E.; Mauzerall, D.; Searchinger, T.D.; Dumas, P.; Shen, Y. Managing nitrogen for sustainable development. Nature 2015, 528, 51–59. [Google Scholar] [CrossRef] [Green Version]
  42. Zhang, Y.; Wang, H.; Lei, Q.; Luo, J.; Lindsey, S.; Zhang, J.; Zhai, L.; Wu, S.; Zhang, J.; Liu, X.; et al. Optimizing the nitrogen application rate for maize and wheat based on yield and environment on the Northern China Plain. Sci. Total Environ. 2018, 618, 1173–1183. [Google Scholar] [CrossRef] [PubMed]
  43. Carneiro, J.; Coutinho, J.; Trindade, H. Nitrate leaching from a maize× oats double-cropping forage system fertilized with organic residues under Mediterranean conditions. Agric. Ecosyst. Environ. 2012, 160, 29–39. [Google Scholar] [CrossRef]
  44. Manfred, K.; Muller, J.; Isselstein, J. Nitrogen management in organic farming: Comparison of crop rotation residual effects on yields, N leaching and soil conditions. Nutr. Cycl. Agroecosyst. 2010, 87, 21–31. [Google Scholar] [CrossRef] [Green Version]
  45. Alvarez González, C.E.; Gil, E.; Fernández-Falcón, M.; Hernández, M.M. Water leachates of nitrate nitrogen and cations from poultry manure added to an Alfisol Udalf soil. Water Air Soil Pollut. 2009, 202, 273–288. [Google Scholar] [CrossRef]
  46. Chambers, B.J.; Smith, K.A.; Pain, B.F. Strategies to encourage better use of nitrogen in animal manures. Soil Use Manag. 2000, 16, 157–166. [Google Scholar] [CrossRef]
  47. Shepherd, M.; Newell-Price, P. Manure management practices applied to a seven-course rotation on a sandy soil: Effects on nitrate leaching. Soil Use Manag. 2013, 29, 210–219. [Google Scholar] [CrossRef]
  48. Daudén, A.; Quílez, D. Pig slurry versus mineral fertilization on corn yield and nitrate leaching in a Mediterranean irrigated environment. Eur. J. Agron. 2004, 21, 7–19. [Google Scholar] [CrossRef]
  49. Zavattaro, L.; Monaco, S.; Sacco, D.; Grignani, C. Options to reduce N loss from maize in intensive cropping systems in Northern Italy. Agric. Ecosyst. Environ. 2012, 147, 24–35. [Google Scholar] [CrossRef]
  50. Zhou, M.; Zhu, B.; Brüggemann, N.; Bergmann, J.; Wang, Y.; Butterbach-Bahl, K. N2O and CH4 emissions, and NO3- leaching on a crop-yield basis from a subtropical rain-fed wheat-maize rotation in response to different types of nitrogen fertilizer. Ecosystems 2014, 17, 286–301. [Google Scholar] [CrossRef]
  51. Fangueiro, D.; Coutinho, J.; Borges, L.; Vasconcelos, E. Recovery efficiency of nitrogen from liquid and solid fractions of pig slurry obtained using different separation technologies. J. Plant Nutr. Soil Sci. 2015, 178, 229–236. [Google Scholar] [CrossRef]
  52. Prendergast-Miller, M.; de Menezes, A.B.; Farrell, M.; Macdonald, L.M.; Richardson, A.E.; Bissett, A.; Toscas, P.; Baker, G.; Wark, T.; Thrall, P.H. Soil nitrogen pools and turnover in native woodland and managed pasture soils. Soil Biol. Biochem. 2015, 85, 63–71. [Google Scholar] [CrossRef]
  53. Macdonald, B.; Ringrose-Voase, A.; Nadelko, A.J.; Farrell, M.; Tuomi, S.; Nachimuthu, G. Dissolved organic nitrogen contributes significantly to leaching from furrow-irrigated cotton–wheat–maize rotations. Soil Res. 2016, 55, 70–77. [Google Scholar] [CrossRef]
  54. Zhuang, M.; Kee, S.; Zhang, J.; Li, H.; Shan, N.; Yuan, Y.; Wang, L. Effect of full substituting compound fertilizer with different organic manure on reactive nitrogen losses and crop productivity in intensive vegetable production system of China. J. Environ. Manag. 2019, 243, 381–384. [Google Scholar] [CrossRef] [PubMed]
  55. Zhou, P.; Sheng, H.; Li, Y.; Tong, C.; Ge, T.; Wu, J. Lower C sequestration and N use ef fi ciency by straw incorporation than manure amendment on paddy soils. Agric. Ecosyst. Environ. 2016, 219, 93–100. [Google Scholar] [CrossRef]
  56. Xia, L.; Lam, S.K.; Yan, X.; Chen, D. How Does Recycling of Livestock Manure in Agroecosystems Affect Crop Productivity, Reactive Nitrogen Losses, and Soil Carbon Balance? Environ. Sci. Technol. 2017, 51, 7450–7457. [Google Scholar] [CrossRef]
  57. Zhang, M.; Yao, Y.; Tian, Y.; Ceng, K.; Zhao, M.; Zhao, M.; Yin, B. Increasing yield and N use efficiency with organic fertilizer in Chinese intensive rice cropping systems. Field Crop. Res. 2018, 227, 102–109. [Google Scholar] [CrossRef]
  58. Zhang, M.; Li, B.; Xiong, Z.Q. Effects of organic fertilizer on net global warming potential under an intensively managed vegetable field in southeastern China: A three-year field study. Atmos. Environ. 2016, 145, 92–103. [Google Scholar] [CrossRef]
  59. Wang, H.; Xu, J.; Liu, X.; Zhang, D.; Li, L.; Li, W.; Sheng, L. Effects of long-term application of organic fertilizer on improving organic matter content and retarding acidity in red soil from China. Soil Tillage Res. 2019, 195, 104382. [Google Scholar] [CrossRef]
  60. Tang, Q.; Ti, C.; Xia, L.; Xia, Y.; Wei, Z.; Yan, X. Ecosystem services of partial organic substitution for chemical fertilizer in a peri-urban zone in China. J. Clean. Prod. 2019, 224, 779–788. [Google Scholar] [CrossRef]
  61. Wang, S.; Yang, L.; Su, M.; Ma, X.; Sun, Y.; Yang, M.; Zhao, P.; Shen, J.; Zhang, F.; Goulding, K.; et al. Increasing the agricultural, environmental and economic benefits of farming based on suitable crop rotations and optimum fertilizer applications. Field Crop. Res. 2019, 240, 78–85. [Google Scholar] [CrossRef]
  62. Zhao, J.; Liu, Z.; Gao, F.; Wang, Y.; Lai, H.; Pan, X.; Yang, D.; Li, X. A 2-year study on the effects of tillage and straw management on the soil quality and peanut yield in a wheat–peanut rotation system. J. Soils Sediments 2021, 21, 1698–1712. [Google Scholar] [CrossRef]
  63. Song, H.; Guo, J.; Ren, T.; Chen, Q.; Li, B.; Wang, J. Increase of soil ph in a solar greenhouse vegetable production system. Soil Sci. Soc. Am. J. 2012, 76, 2074–2082. [Google Scholar] [CrossRef]
  64. Xia, Y.; Yan, X. Ecologically optimal nitrogen application rates for rice cropping in the Taihu Lake region of China. Sustain. Sci. 2012, 7, 33–44. [Google Scholar] [CrossRef]
  65. Fan, Z.; Lin, S.; Zhang, X.; Jiang, Z.; Yang, K.; Jian, D.; Chen, Y.; Li, J.; Chen, Q.; Wang, J. Conventional flooding irrigation causes an overuse of nitrogen fertilizer and low nitrogen use efficiency in intensively used solar greenhouse vegetable production. Agric. Water Manag. 2014, 144, 11–19. [Google Scholar] [CrossRef]
  66. Norse, D.; Ju, X. Environmental costs of China’s food security. Agric. Ecosyst. Environ. 2015, 209, 5–14. [Google Scholar] [CrossRef]
  67. Tian, Y.; Wang, Q.; Zhang, W.; Gao, L. Reducing environmental risk of excessively fertilized soils and improving cucumber growth by Caragana microphylla-straw compost application in long-term. Sci. Total Environ. 2016, 544, 251–261. [Google Scholar] [CrossRef]
  68. Liu, Y.; Han, M.; Zhou, X.; Li, W.; Du, C.; Zhang, Y.; Zhang, Y.; Sun, Z.; Wang, Z. Optimizing nitrogen fertilizer application under reduced irrigation strategies for winter wheat of the north China plain. Irrig. Sci. 2022, 40, 255–265. [Google Scholar] [CrossRef]
  69. Xia, L.; Ti, C.; Li, B.; Xia, Y.; Yan, X. Greenhouse gas emissions and reactive nitrogen releases during the life-cycles of staple food production in China and their mitigation potential. Sci. Total Environ. 2016, 556, 116–125. [Google Scholar] [CrossRef]
Figure 1. Fruit yield of (a) tomato, (b) cucumber, and (c) tomato/cucumber rotation. Average annual yield (df) in the control (CK), manure (M), and reduced conventional fertilization (RCF), relative to conventional fertilization (CF) for 2008–2013. The error bars indicate the standard deviations. CK: 0 kg ha−1 N; M: 362 kg ha−1 organic N; RCF: 992 chemical N + 362 kg ha−1 organic N; CF: 1515 kg ha−1 chemical N + 362 kg ha−1 organic N. The lowercase letters indicate the significant difference among the means each year, while each p value given upside right indicate the two-way ANOVA with year and treatment interaction.
Sustainability 14 04647 g001
Figure 2. N use efficiency for 2008–2013. (a) Recovery efficiency (REN); (b) agronomic effectiveness. (AEN); (c) physiological efficiency (PEN); (d) partial factor productivity (PFPN). Error bars reflect the standard deviations. Blue: M, 362 kg ha−1 organic N. Red: RCF, 992 kg ha−1 chemical N + 362 kg ha−1 organic N; Green: CF, 1515 kg ha−1 chemical N + 362 kg ha−1 organic N. The lines indicate the annual general tendency.
Sustainability 14 04647 g002
Figure 3. N leaching for 2008–2013. (a) Relationship between the sampling period and total nitrogen (TN) leaching. (b) TN leaching by treatment and vegetable rotation. T: tomato; C: cucumber; F: fallow. CK: 0 kg ha−1 N; CF: 1515 kg ha−1 chemical fertilizer N + 362 kg ha−1 organic N; RCF: 992 kg ha−1 chemical fertilizer N + 362 kg ha−1 organic N; M: 362 kg ha−1 organic N.
Sustainability 14 04647 g003
Figure 4. The optimum range of N application. (a) Regression models of tomato/cucumber yield, N leaching, N fertilizer economic benefit (NEB), and net benefit against the annual N application rate (2008–2013). Regression models of net benefit, N fertilizer economic benefit (NEB), tomato yield (b), and cucumber yield (c) against the annual N application rate (2008–2013).
Sustainability 14 04647 g004
Table 1. Values used to calculate the average annual economic benefit (USD t−1) based on six rotations (one rotation per year from 2008 to 2013) of greenhouse-cultivated tomato and cucumber plants.
PriceGroups
ItemsDetails(USD t−1)CKCFRCFM
FertilizerUrea27709065930
Ca(H2PO4)240307545440
K2SO433708097920
Chicken manure880195319531953
SeedTomato 5506550655065506
Cucumber 5817581758175817
Pesticides and herbicides Tomato 126126126126
Cucumber 84848484
Field managementLabor 98210210112
Total expenditure 11,63116,16515,62513,584
Fruit incomeTomato28110,30918,51118,17411,713
Cucumber22515,25323,00623,06217,416
Total income 25,56241,51741,23629,129
Net benefit (USD ha−1 year−1) 13,93125,35225,61115,545
Total-N input (kg ha−1 year−1) 018771354362
Benefit from N input (USD ha−1 year−1) 011,42111,6801614
NEB (USD t−1 N) a 0608586264458
Input–output ratio 1:2.201:2.571:2.641:2.14
a NEB: N fertilizer economic benefit.
Table 2. Approximate fertilizer-N input and N leaching in the greenhouse vegetable cultivation system used in this study, from 2008 to 2013.
ItemsCKCFRCFM
N input (kg ha−1 year−1)
 Organic0 b362362362
 Chemical015159920
 Total018771354362
N leaching (kg ha−1 year−1)
 Total69 d170 a131 b92 c
NLTNc0101 a62 b23 c
NLON0232323
NLCN078 a39 b0.00
N leaching-input ratio (%)
NLIRTN-4.5 b3.6 c6.4 a
NLIRON---6.4 a
NLIRCN-3.52.3-
CK: control (0 kg ha−1 N); CF: conventional fertilization (1515 chemical fertilizer + 362 kg ha−1 organic N); RCF: reduced conventional fertilization (992 chemical fertilizer + 362 organic kg N ha−1); M: manure fertilization (362 kg ha−1 organic N). Results are expressed as means. Lowercase letters after means identify groups that differ significantly between treatments (p < 0.05), by row. NLTN: N leaching caused by TN input; NLON: N leaching caused by organic N input; NLCN: N leaching caused by chemical N input; NLIRTN: TN leaching-to-input ratio; NLIRON: organic N leaching-to-input ratio; NLIRCN: chemical N leaching-to-input ratio.
Publisher’s Note: MDPI stays neutral with regard to jurisdictional claims in published maps and institutional affiliations.

