Abstract
The conducted research offers an environmental assessment of municipal waste (MW) using remote sensing (RS), geological, and geophysical datasets. As a test site, the present study aims to characterize one of the largest uncontrolled dumpsites in Egypt. RS data analysis indicates that high temperature values are concentrated at the MW and landfill site allocations as a result of the decomposition process, leading to fire risks. Moreover, the geological and structural data draw attention to the structural-controlled old topography role on MW distributions. Consequently, the dumpsite MW has larger surface quantities near the downthrows of the mapped faults. For MW characterization, geophysical data are acquired to produce2D/3D resistivity models. Because MW has the ability to become soft clay, the municipal organic waste and landfill leachate resistivities are lower than that of municipal solid waste and sandy soils. The geophysical inversion results indicate that the maximum thickness of MW calibrating with the drilled borehole data is 60 m. Furthermore, the estimated MW dumpsite volume is about 42.32 MCM. Accordingly, the MW can be characterized in an accurate qualitative and quantitative manner. Our findings, therefore, help the efforts of uncontrolled dumpsite development and thus contribute to sustainability plans.
1. Introduction
The concept of sustainability has been defined as the sustainable development goals supporting social and economic development that improve and protect social quality and natural environment [1]. Many studies reported that municipal waste (henceforth, MW) mismanagement is a global environmental problem, especially in developing and transition countries in terms of social inclusion, environmental contamination, and economic suitability. Moreover, MW poses a serious pollution threat on the environment, especially groundwater, health and land use and cover. Particularly, MW may contain solid, organic and toxic materials, which can be decomposed and/or biodegraded with time to liquid effluents (known as leachate). Overall, MW can be classified into municipal solid waste (henceforth, MSW) and municipal organic waste (henceforth, MOW). Disposal of MW (in dumpsites and landfills) are waste managements’ least desirable options, which constitutes a severe environmental problem worldwide. Obviously, new urban and industrial developments are accompanied with an enormous increase in the amount of the MSW that may lead to environmental difficulties if theyare not previously well-planned. Certainly, MOW is disposed of in low lying sites called sanitary landfills, with burying ponds in uncontrolled dumpsites [2]. Accordingly, MW assessment (i.e., characterization and quantification) in uncontrolled dumpsites and landfills can be considered as a substantial task for urban development avoiding environmental and engineering difficulties.
The most important factors that have to be taken into account while assessingMW sites include surface–subsurface geological condition, waste composition, hydrological features, rate of rainfall, soil moisture index, urbanization growth, waste site life, its capacity, temperature and the possibility of developing it [3]. Additionally, delineating geological structures can provide information for future land use-planning e.g., [4]. For example, Riyadh, the Kingdom of Saudi Arabia’s (KSA) capital, has land subsidence with heavy construction and urban development on disorganized dumpsites and/or landfill that has jeopardized structural stability over these sites related to landfill leveling and waste material compaction [5]. Accordingly, in order to make a comprehensive evaluation of an uncontrolled dumpsite, periodically surface and subsurface studies have to be considered to determine in detail the extent of its environmental impact. This requires the use and integration of several data and analysis tools to achieve this goal.
In the last few decades, RS information analyses using various Geographic Information System (GIS) tools have been utilized by many researchers to evaluate the surface influence of already-existing waste sites and/or suggest new disposing sites e.g., [6,7]. Additionally, geophysical surveys are often applied to gain an adequate classification of MW in urban areas, since traditional drilling and sampling alone are not sufficient for a complete and/or detailed MW mapping e.g., [8,9]. As leachate/MOW is electrically conductive, geoelectrical methods are widely used to map the leachate migration inside and away from the landfills/dumpsites e.g., [10,11,12].
As a developing country, Egypt disposes about 21 million tons per year of MW into uncontrolled open dumpsites, landfills and composted destinations, while 10–15% of waste is recycled (Figure 1; [13]). In addition, most of the MW collection, burial, and treatment sites, are located near urban areas, which make them a threat to public health, such as incineration, greenhouse gas emanations and wastewater outflow. Nowadays, five dumpsites are considered the largest in Egypt, which are located at the Nile Delta and around Great Cairo (Figure 1a–f). Such dumpsites include about 25 million tons of wastes. Considering Cairo is largest city with over 20 million inhabitants, it has a large amount of MW compared to the number of dumpsites recorded (5 public and 12 random; [13]). Consequently, it leads to overloading the existing dumpsites beyond their capacity and lacking in efficiency, which needs to be evaluated constantly.
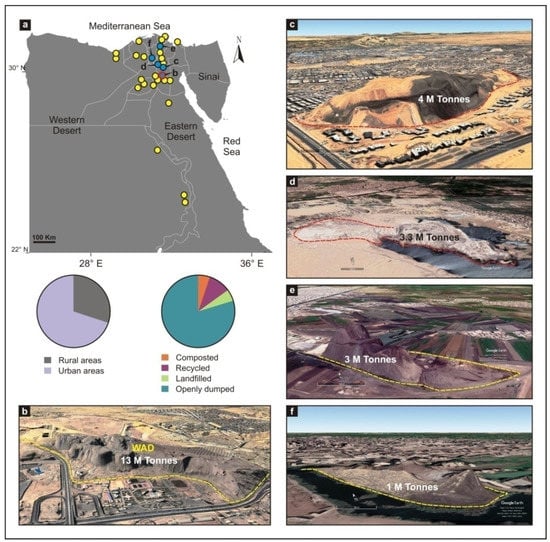
Figure 1.
(a) Some of the MW sites in Egypt after Waste Management Regulatory Authority classification; pie charts show the percentage of waste sources (right) and their characteristics (left). The largest dumpsites in Egypt are represented by 3D Google Earth images which are (b) Al Wafaa and Al Amal, WAD, (c) Al Salam, (d) Abu Zaabal dumpsite, (e) Sandoub, and (f) Menouf.
It is worth mentioning that MW quantification is a challenging task that pushes in the direction of a more circular economy. The overall intent of the present study is to develop a new workflow for detailed MW characterization and mapping the landfill leachate in arid urban areas. In the suggested framework, the spatial distribution of MW (1D/2D models) is the utmost goal of studying the uncontrolled and/or undocumented dumpsites (i.e., the WAD case study, Figure 1b). In addition, leachate flow mapping (2D/3D models) of waste wetted by the injection process from sanitary landfills is achieved. However, we need to keep in mind that the arid regions are, in general, characterized by subsurface geological structures which may control the MW distributions. In a nutshell, RS, geological, structural, borehole and geoelectrical data are integrated to understand the historical background of evolvement and, consequently, characterize the uncontrolled dumpsites in an accurate qualitative and quantitative manner.
2. Study Site Description and Problem Statement
The study site (i.e., WAD) is located in the center of Cairo between latitudes 30°00′22″ N–30°01′30″ N and longitudes 31°21′11″ E–31°22′12″ E covering an area of approximately 385 acres (Figure 2a). At the WAD, landfilling started in the late 1970s as open dumping in a sandy desert. As a semi-arid area, the floor of the WAD is composed of sand and gravelly sand. Historically, this site was initially used for quarrying (i.e., sand and gravel) in the seventies of the last century. Accordingly, the presence of shallow-to deep-hole sandy quarries is expected. In 1978, landfilling was practiced for waste management and/or waste disposal in Cairo, with around 100–150 tons daily (Egyptian Environmental Affairs Agency, EEAA, https://www.eeaa.gov.eg/en-us/topics/wastes.aspx, accessed on 10 July 2021). Since 1978, up to 2018, MW has been disposed and stored without compaction and composed of raw wastes, garbage, crushed and compostable household waste and organic materials. In 2018, the WAD received 200–2500 tons of wastes per day. It is worth mentioning that MW at WAD was distributed randomly without documentation.
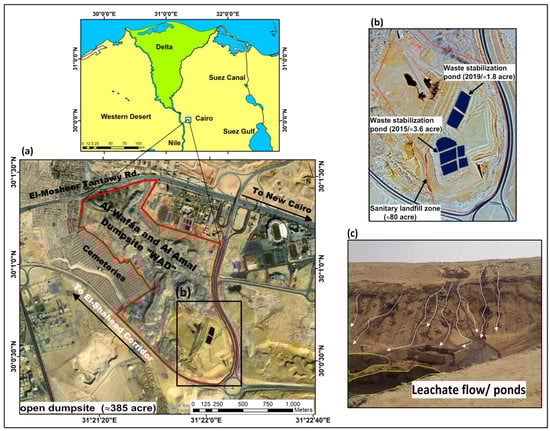
Figure 2.
(a) Location map of the study dumpsite (i.e., WAD) and (b) the sanitary landfill zone showing (c) field photo showing the negative environmental impact of the open dumps in the form of leachate and surface ponds.
In June 2002, a sanitary landfill was established at the southern part of the WAD covering an area of about 80 acres (Figure 2b). Here, the sanitary landfilling method was confused with open dumps (known as cells) that have bad odors, insects, smoke, and rodent problems (Figure 2b). With urban expansion, the operations/works in the sanitary landfill were suspended in 2019, leaving waste stabilization ponds, leachate flow and leaching ponds (Figure 2c). Additionally, the WAD is characterized by (1) complex geological structures that control the topography and affect the subsurface primary geological layers (e.g., cracks, joints, and faults); (2) rainy climatic periods which can change in chemical and physical properties of some lithological units; and (3) water leakage from network utilities and irrigation lines of gardens and green spaces into the subsurface which could lead to hydrological and engineering problems. Accordingly, the MW at WAD is highly assorted in three dimensions and, consequently, the characterization and/or quantification of such MW can be considered as a challenging task, especially as the dumpsite documentation is poor and undated. In this manner, it was important to manage an overall study on WAD as an example of uncontrolled and/or undocumented dumpsites.
3. Workflow of the Present Study
The present workflow strategy depends mainly on eight required datasets (Figure 3). Previous information about MW and the beginning of itspresence wascompiled in order to provide a primary and regional setting for the studied dumpsite. Moreover, detailed topographical model (DTM) and hydrological analysis (e.g., rainfall and drainage pattern) are carried out using the total station (TS) technique, paleo-topographic data and GIS tools. Moreover, these data give a conceptual triple view about the precipitation, sanitary leachate discharge and the water accumulation. Thereafter, surface and subsurface MW mapping is carried out using outcrop data as well as the noninvasive direct current resistivity (DCR) method (Figure 3). A land surface temperature (LST) map is obtained to manifest the dumpsite surface temperature, which in turn indicates the interior temperature and amount of waste that may cause an environmental hazard to the surrounding urban areas. Additionally, a soil moisture map (SMM) is attained for characterizing the leachate flow. Both maps (LST and SMM) are derived from temporal RS data in an episodic mode to show their variations with the land use/land cover (LU/LC) changes related to MW propagation.
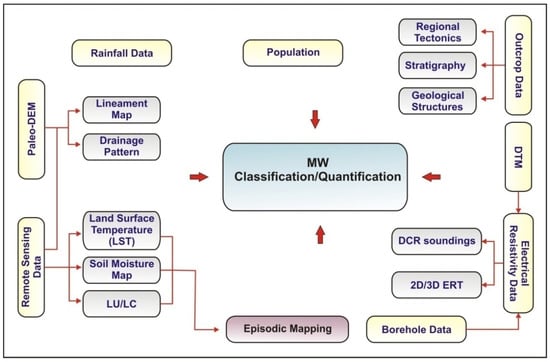
Figure 3.
The workflow of the proposed strategy for MW characterization and quantification followed in the present study.
In order to figure out the outcrop geology, it has initially been essential to set up the stratigraphy for the site. As geological structures play a key role in the present-day topographic features, detailed surface structural mapping is achieved in order to record the distribution of faults around and at the dumpsite. This task is accomplished by collecting surface data as well as geometrical parameters of fault planes, so as to evaluate their effect on the geomorphology of the study site, which in turn controls landfill distribution. Hence, the concealed old topography can be evaluated, which in turn provides a key for understanding the local geological conditions that controlled the MW distribution in the studied undocumented dumpsite.
For providing detailed information about the nature, boundaries, depth, thickness of MW, leachate flow, and the distribution of basal geological layers, a 2D/3D-ERT technique is planned in a complementary manner, calibrated with the available borehole data. Moreover, the borehole data and DCR soundings survey are used for deep investigations and refining/verifying the dumpsite quantification model. It is worth mentioning that it is not easy to map the subsurface MW and leachate flow precisely from DCR soundings and ERT results applying conventional inversion schemes (i.e., linear methods). The conventional inversion schemes tend to smooth the resistivity models and, consequently, the spatial characterization of subsurface MW and landfill leachate are a challenge. Accordingly, the joint use of linear, non-linear and advanced inversion schemes [14,15,16] are applied in this study.
4. Data and Methodology
4.1. Geological Setting
Geologically, the WAD occupies the westernmost extension of the Cairo–Suez District (CSD). In general, the CSD occupies a partition of the unstable shelf area [17], the majority of which extends across the northern part of Egypt (Figure 3). Many rock units are outcropped along the CSD, including Cretaceous, Eocene, Oligocene, Miocene, Pliocene, and Pleistocene-Recent rocks e.g., [18,19]. Structurally, faults play a major role in the architecture of the exposed fault blocks along the CSD which are represented mainly by NW–SE, WNW–ESE and E–W orientations e.g., [20,21,22]. Regarding the study site, most of the area is covered by Oligocene rocks that consist of dark brown colored sand and gravel units which are overlain by some Quaternary clastic deposits (sands and gravels) at small locations [23]. In addition, basalt and silicified wood remains are dominant at some localities of the WAD area. Moreover, several faults were obtained dissecting the exposed Oligocene rock units in different places at the study site. In such deformed areas (i.e., CSD), the downthrown blocks of fault planes represent the present-day topographic lows which could control the distribution of MW. Accordingly, the nature of lithologic unit distribution linked with the allocation of faults provides useful information about the hidden structurallycontrolled topographic lows at the WAD area.
4.2. Remote Sensing and Paleo-Topographic Data
Three temporal Landsat satellite images were obtained from the US Geological Survey (USGS) website. Images were acquired from the Landsat5 Thematic Mapper (TM: 2003 and 2010) and Landsat8 Operational land imager and Thermal Infrared Sensor (Landsat 8 OLI/TIRS) as shown in Table 1. Corresponding to hot climate months in Egypt, all images were downloaded on 1 November 2003, 2010 and 2019. These images were corrected and processed using ENVI 5.3 software. Moreover, the satellite images and old topographic data were processed to figure out the dumpsite surface shape before the WAD construction, by delineating the overall structural setting. The digital elevation model (DEM) was generated from digitizing the contours from the old topographic maps at a scale of 1:50 K (Egyptian General Survey Authority). Accordingly, lineaments were extracted, and the drainage system was analyzed using PCI Geomatica software and ArcGIS hydro tools, respectively. Initially, the old DEM map was relief shaded using the ArcGIS Hillshade Analyst tool into two main images with different azimuth angles, which enabled the enhancement ofthe extraction of fine linear variations in the surface e.g., [24]. These shade images were integrated and then the lineaments were automatically extracted using the default parameters of the LINE module in PCI software [25]. The DEM was processed to compute surface slope and gradient that control the flow directions, accumulations and lengths. Then, these parameters were also used to extract the drainage networkaccording to the following ordered functions: Fill sink, flow direction, accumulation, stream definition and segmentation.Moreover, the rainfall map was derived by collecting the annual rainfall data for theNew Cairo area between the years 1998 and 2019; such climatic data were downloaded and clipped from Tropical Rainfall Measuring Mission (TRMM) data on average monthly precipitation.

Table 1.
Temporal Landsat satellite data utilized in the present study.
Because the MW decay increases the surface temperature [26], the thermal behavior of landfill was monitored through land surface temperature (LST) calculations. Seasonal LST was calculated at the same date (3 September 2021) and along various seasons over 6 years. LST calculations were computed using the temporal Landsat images through a set of consecutive procedures e.g., [27] as follows:
- (i)
- Digital numbers of optical bands (1–5 of TM; 1–7 of OLI TIRS) were converted to reflectance and normalized difference vegetation indices (NDVIs), which were calculated using the near-IR (NIR) and visible red bands (RED) as well as the proportion of vegetation calculations (Pv) using minimum and maximum NDVI values.
- (ii)
- In turn, Pv values were employed to compute the land surface emissivity (e).
- (iii)
- Digital numbers of thermal bands (6 of TM; 10, 11 of Landsat 8 OLI/TIRS) were converted into radiance (R) and brightness temperature (BT) at separate steps by radiometric calibration tool.
- (iv)
- The last step was the LST estimation by substituting in the final subsequent equation:
The surface soil moisture contamination of WAD was checked through tasseled cap wetness index (TCWI) mapping. These data were evaluated using the atmospheric corrected optical bands, due to the differences in reflections values of visible (blue (B), green (G), red (R)), near (N), and shortwave (SW) infrared (IR) bands e.g., [28]. The TCWI was calculated applying the following formula:
TCWI = 0.1511 × B + 0.1973 × G + 0.3283 × R + 0.3407 × NIR − 0.7117 × SWIR1
− 0.4559 × SWIR2
− 0.4559 × SWIR2
Obviously, the TCWI values ranged from −1 (non moistured) to +1 (moistured) when applying Equation (2).
The description and/or changes in landfill area, manmade and natural features were obtained by the LU/LC delineation. Regarding the support vector machine classification method, the acquired Landsat (TM and Landsat8 OLI/TIRS) images were classified into six classes. These sites were picked according to previous knowledge of the study area and confirmed during field survey. Moreover, the population growth data were derived from theUnited Nations website (Historical World Population Prospects) for New Cairo city between the years 2003 and 2019. Based on the World Bank, the population in middle-income countries will double over 30 years (between 2000 and 2030) from 2 to 4 billion [29].
4.3. Geophysical and Borehole Data
Because the individual use of traditional drilling is time consuming and expansive, we attempted to characterize and quantify the surface and subsurface MW using integrated geophysical and borehole data considering the aforementioned surface data. Hence, surface detailed topographic measurements (DTM; elevation and position) of WAD are established for locating the proper geophysical measurements. The DTM was generated using Global Positioning System (GPS) and total station instruments and then verified using permanent control stations. The density and allocation of spot stations are based on each identifiable and visible geological and manmade feature at the study site in order to produce a precise digital elevation contour map. The total number of stations that were contoured using ArcGIS spatial analyst contour tool with 2 m interval is 2291. These data provide elevation changes in surface elevation, which reflects the waste thicknesses all over the study site.
Due to its up scalability and simplicity, the DCR method is widely used for environmental studies e.g., [30]. Accordingly, the majority of DCR measurements in the form of 2D-ERTs and soundings were carried out in the study dumpsite over two years. Obviously, the 2D-ERT profile distribution was conjugated to the ground accessibility (e.g., paved/asphaltic roads) and, consequently, the grid view could not have been achieved. Indeed, the geoelectrical data acquisition was a critical stage regarding unsafe waste/garbage of different substances and landfill gas odor in the uncontrolled dumpsite and sanitary landfill (Figure 4a,b), respectively. For deeper investigations, DCR soundings and boreholes were measured and drilled, respectively, in 2019. In general, boreholes were drilled for (i) deep subsurface waste investigations, up to 70 m depth, and (ii) calibrating the geophysical data. Moreover, the boreholes were drilled at selected locations which are inappropriate for DCR surveys; the DCR measurements and depth of investigation (DOI) especially are proportional to the distance between the current electrode spacing.
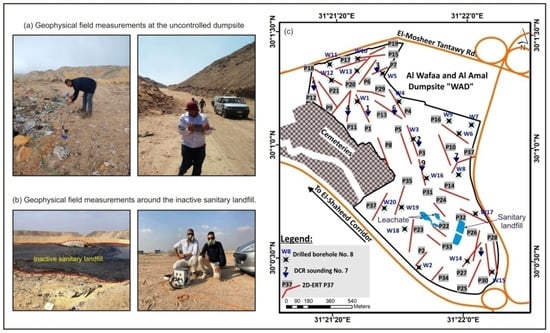
Figure 4.
(a,b) Field photos showing the challenges to accomplish the geophysical data at the open uncontrolled dumpsite and around the inactive sanitary landfill, respectively. (c) Positions of the DCR soundings and 2D-ERT profiles with the drilled boreholes in the WAD.
The DCR data were collected using the Syscal Pro multi-electrode system (10-channel) IRIS instruments, with 48 electrodes and 5 m electrode spacing. According to surface conditions of the investigated site, Wenner and Schlumberger arrays were used for ERT and DCR sounding surveys, respectively e.g., [31,32]. For 2D-ERTs, the maximum data level was 15 and maximum electrode spacing “a” was 75 m. Because the DOI is limited during the 2D-ERT survey with regard to the available multi-electrode system (i.e., 48 electrodes), the DCR soundings were measured to obtain deeper information about the MW thickness (maximum current electrodes spacing “AB” 300 m). In this study, DCR sounding data were acquired not just to complement the 2D-ERT results and/or reduce the non-uniqueness limitations associated with geophysical data inversion, but also to extend the subsurface mapping provided by the 2D-ERTs to give deeper waste electrical resistivity information. Differential GPS and Google Earth Pro Image helped in plotting the ERT profiles (thirty-seven profiles), DCR soundings (nine points) and borehole points (twenty wells). Figure 4 shows the location of geophysical measurements and drilled boreholes in the WAD.
In the ground surface view and arid conditions, stainless-steel electrodes with saltwater were used during the data acquisition. The contact resistance of the ground was less than 5 kΩ. The time of current injection was 250 ms and stacking of up to eight measurements was conducted to meet the requirements of data quality (stacked error was less than 4%). In a scarcity of reciprocal data, the electrical resistivity measurements errors (δdi) were estimated by a standard error model by means of 3% error, a potential error of 100µV and calculated for a 100 mA current level [33,34]. The 2D-ERT profiles were processed and inverted using the academic 2D inversion algorithm DC2DInvRes [14]. The 2D resistivity profiles at the sanitary landfill were gathered and inverted using the academic 3D inversion algorithm DC3dInvRes [14]. The 2D/3D-ERT was regularized using smoothness constraints and a quasi-Gauss Newton inversion algorithm [35]. In DC2DInvRes/DC3dInvRes software, numerical modeling was obtained depending on the least square method using partial differentiation. The forward problem was solved using finite-difference method (FD). The regularization inversion parameters λ (known as “LAMBDA”) and λwz (called “ZWEIGHT) control the trade-off between the data misfit and regularization functions [36]. The inversion parameters were chosen to ensure that the inversion algorithm can construct the horizontal and vertical variations of the subsurface [37].
To attenuate the shallow resistivity artifacts at shallow depths, borehole data are considered and an advanced inversion technique with a decoupling line was applied to make the interpretation process robust (for a detailed description, see [38] and [16]. The fit quality between calculated and field resistivity data is given by the relative root mean square (RRMS) error in % and by the Chi-square mathematical criteria, which is the normalized misfit by the measurement misfits [39]. In general, the resistivity models exhibited an RMS of less than 5%.
While acquiring the DCR sounding survey, sometimes data errors can occur from improper electrical electrode contact with the surface or the instrument [40]. Consequently, these errors were filtered during the interpreting of the DCR sounding layer model. The DCR sounding points were inverted using IPI2Win software [41] based on a conventional scheme applying a linear filtering for 1D forward modeling and a Newton algorithm to solve the inverse problem. To reduce the ambiguities in DCR soundings interpretation, the DCR soundings were inverted using a non-conventional inversion scheme known as a genetic algorithm (GA) (for a detailed description, see [42]. Figure 5 shows the calibration example between the interpreted resistivity layers of the DCR sounding No. 8. The number of layers was suggested from the drilled borehole data. Note, the population size and generation number were 50 for both. Obviously, a good fitting between the field and theoretical data can be obtained at the best misfit value (Figure 5).
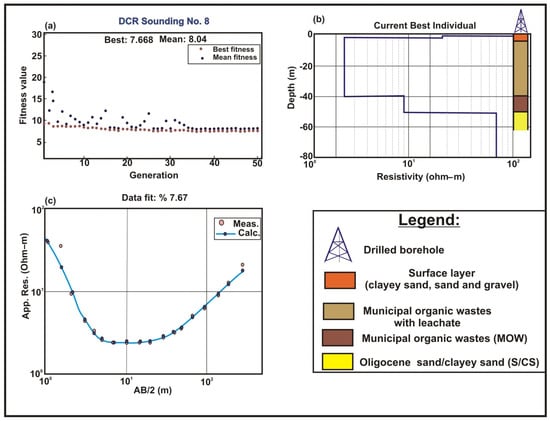
Figure 5.
Inversion results of DCR sounding No. 8 (a–c) using a genetic algorithm (GA) at the southern part of the study dumpsite (i.e., sanitary landfill zone), cf. Figure 4 for location. (a) Variation of mean and best misfit versus generation. (b) A calibration between the model response resulting from GA and the drilled borehole geological data. (c) The fitting between the field and calculated resistivity data.
5. Results and Discussion
The results of the present study show two levels of mapping (surface and subsurface), in order to characterize the MW and map the leachate flow around the abandoned sanitary landfill in the form of 1D, 2D and 3D models.
5.1. Surface Data Analysis (RS and Structural Mapping)
In this section, the Landsat satellite images and old topographic data were analyzed for surficial evaluation of the WAD. Initially, the population growth, surface temperature changes and soil moisture behaviors were mapped (Figure 6). Regarding the new urban areas expansion in desert land, LU/LC changes showed an increase in population settlements which is indicative of the population growth record around the WAD (Figure 6a,b). Consequently, the area of the WAD has diminished over time (Figure 6a). As a result, there is a high need for MW characterization and quantification in such areas for environmental sustainability. In or before 2003, the MW was, clearly, distributed randomly around the current dumpsite (i.e., the main WAD), which indicate poor and unsystematic MW collection which was proofed during our field trips.
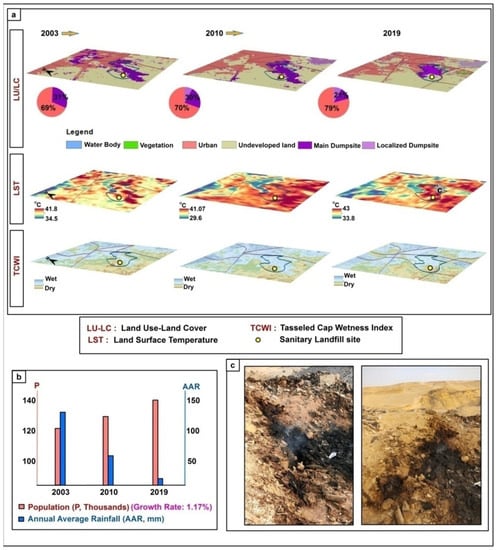
Figure 6.
(a) Extracted landuse/landcover (LU/LC), land surface temperature (LST) and tasseled cap wetness index (TCWI) resulted from temporal Landsat images with (b) the available population “P” growth rate and the annual average rainfall “AAR” data for New Cairo. (c) Field photos showing localized subsurface fires as resulting from MW decaying (decomposition process) at the WAD.
According to the calculated LST, it can be noticed that LST ranges from 39.6 °C to 43 °C within the last 16 years (Figure 6a). Based on the visual inspection between the LST maps with the LU/LC results, it can be observed that high temperature values are concentrated at the MW and landfill site allocations (Figure 6a). The wiggled LST values (Figure 6a) can be attributed to the MW type (MSW and/or MOW) and/or thickness [43]. Noticeably, Figure 6a shows an apparent decrease in landfill; however, the LST maps indicate an increase in values. This is attributed to the reorganization and localization of landfill at a specific locality due to urbanization. Furthermore, the lower LST values around the landfill disposal site allocation compared to the rest of the WAD may be attributed to the vertical leachate infiltration through the abandoned sanitary landfill cells (Figure 2b and Figure 6a). On the other hand, it is anticipated that the high LST values are the result of increasing the oxygen content and the decomposition process (bacterial activity) which may lead to fire risks as occurred in Iqaluit, Canada, in 2014 [36].
In contrast to the population growth rate, the average annual precipitation data indicate a significant decline in rainfall during the last 16 years (Figure 6b). Considering the rainfall data, the TCWI maps (Figure 6a) show two distinctive wetness zones with different spatial extensions. Noticeably, most MW locations and urban areas have high WI values (wet areas, light blue color). On the other hand, barren lands and abandoned sanitary landfill sites at the southwestern parts have the lowest WI content (dry zones, light brown color), especially with increasing the LST (Figure 6a) associated with the landfill fire impact (Figure 6c). The high WI of MW zones may be related to the rainfall times and/or liquids resulting from the MW decaying activities, especially with increasing the MW thickness. Moreover, the high WI values can be attributed to the spatial soil heterogeneities with human development activities in urban areas e.g., [44].
Obviously, there are small spatial wet spots that occur through sanitary landfill sites (Figure 6), which is related to the existing processing cells and their accompanying surface leachate into nearby ponds, as shown in Figure 2c. In general, the leakage from our large uncontrolled landfill and the additional leachate (containing heavy metals and toxic contents) from the abandoned sanitary landfill site may extend into the subsurface geological layers, affecting the adjacent environment and spreading into the groundwater aquifer, especially when supported by rainfall. Consequently, this entails studying the drainage network and geological structures that can control and aid the flow of water leakage along fractures.
Accordingly, the structural setting and drainage network extracted from old topographic data as well as field investigation is represented in order to link between the surface and subsurface quantification of MW in WAD (Figure 7). Structurally, field investigation combined with lineaments extracted from old topographic data revealed the presence of eleven mapped normal faults affecting the Oligocene rock units (Figure 7a). Such faults have main orientations of WNW–ESE to NW–SE which are well-exposed at the outcrop of the WAD, whereas they are concealed underneath the dumpsite (Figure 7c,d). Based on field observations, it was noticed that most of MW of the dumpsites have larger surface quantities near the downthrows of the mapped faults. This in turn can draw attention to a couple of important issues, which are: (i) the role of the structural-controlled old topography on the distribution of the waste; and (ii) the future-raised hazards related to the uncontrolled load of the MW on the possible reactivation of the nearby faults e.g., [45]. As a result, great attention should be paid for similar cases in order to avoid sudden land subsidence or failure along faults.
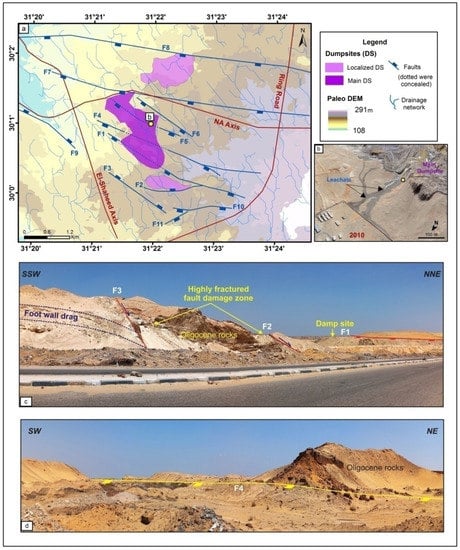
Figure 7.
(a) Mapped geological structures and extracted drainage network resulted from and overlaid on paleo-DEM; (b) Google Earth Pro image showing surface leachate related to the drainage pattern; (c,d) field panoramas of the exposed faults affecting the Oligocene sediments.
Considering the natural drainage pattern, it was observed that it is relatively correlated with the structural features. Most of it was obliterated due to the beginning of the landfill and the urban development in the region. However, it may have a negative impact on the environment because of the inner landfill water discharge through it, as shown in high resolution satellite data (e.g., Google Earth images) (Figure 7b). There is another artificial drainage network related to the sanitary landfill site or through the dumpsite itself that is responsible for protection against leachate movement. However, it also may cause an environmental problem in a non-engineered open dumpsite, such as our site; this is what was observed in the field (Figure 2c).
5.2. Subsurface Mapping (DCR and Borehole Data)
In order to evaluate and/or assess MW (i.e., MOW and MSW) in the uncontrolled WAD, the subsurface geophysical and borehole data were integrated with previous results from other data sets. Relating to the observed surface structures (Figure 7) and the variation in surface waste distribution, the surface topography/DTM is considered while constructing the 2D-ERTs. Accordingly, the inversion results of geophysical data are calibrated with redundant geological and borehole data, which, in turn, reinforce the geophysical results explanation.
As a representative example, Figure 8 presents a 2D selected resistivity section (2D-ERT P37) at the eastern side of WAD (Figure 4). Considering the surface structural mapping (Figure 7a), the 2D-ERT P73 is acquired perpendicular to the observed normal fault with a large spatial variation in surface topography which can be related to the old topography and clear variations in MW thickness (Figure 8a). During our field observations, MW dominated and covered the western side of the 2D-ERT P37. The depth of investigation (DOI) of the 2D-ERT P37 is about 40 m. For deeper MW investigation (i.e., ~70 m depth), the borehole W8 is drilled and DCR sounding No. 7 is acquired near to the 2D-ERT P37 (for location, cf. Figure 4). The geological and geophysical data are calibrated and then integrated to characterize and quantify the MW at this location.
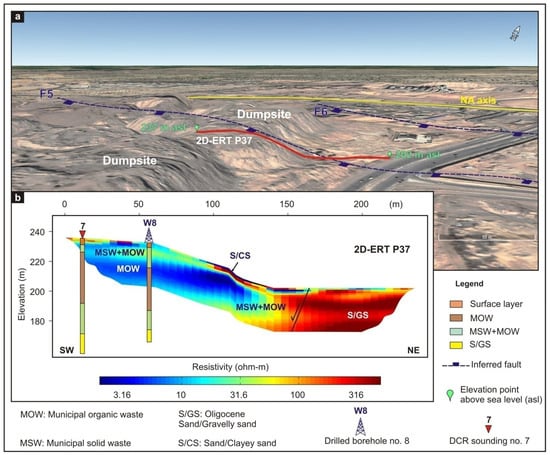
Figure 8.
(a) Google Earth Pro satellite image © 2018 CNES/Astrium of the fault scarp at the WAD. (b) Electrical resistivity tomogram obtained from 2D inversion of profile P37 (for location cf. Figure 4) oriented perpendicular to the observed normal fault (Figure 7a) and calibrated with drilled borehole No. W8 and DCR sounding No. 7 (for location cf. Figure 4).
The 2D-ERT P37 represents two resistivity zones (Figure 8b) of high and low resistivity values. The abrupt change in resistivity values along the 2D-ERT P37 can be attributed to the presence of a normal fault (Figure 7a and Figure 8a). The high resistivity zone (>300 ohm-m) can be observed at the eastern side of the 2D profile (between about 150 and 235 m profile lengths), which corresponds to Oligocene sand and gravelly sand (S/GS) deposits (i.e., bedrock). Obviously, the very low resistivity values can be observed at the downthrown side (i.e., footwall), which, indeed, can be explained by decaying the MOW to become sponge-like and soft clay (<10 ohm-m), especially with the presence of drainage water. Clearly, the MW thickness at the eastern part of the 2D-ERT P37 (i.e., the downthrown side) is greater than 40 m.
The inversion results of DCR sounding No. 7 represents four geoelectrical layers attributing to surface layer (45 ohm-m and 5 m-thick), MOW (4 ohm-m and 25 m-thick), MSW and MOW (25 ohm-m and 30 m-thick) and Oligocene S/GS (125 ohm-m). Accordingly, the inversion results of DCR sounding No. 7 indicate the maximum thickness of MW calibrating with the drilled borehole data (well No. 8). In general, the interpretation of DCR sounding No. 7 is in accordance with the inversion results of 2D-ERT P37 and the nearest drilled borehole data (i.e., W8), Figure 8b. Considering such data integration processes, the maximum thickness of MW at this location can be quantified (~60 m). Noticeably, the MW can be classified according to the resistivity range of both MSW and MOW (Figure 8b). Furthermore, the studying of local geological and structural conditions can improve the understating of the MW distributions where the old topography and local structures play a great role in MW disposal with time.
On the basis of the previous example (Figure 8), the other 2D resistivity profiles were interpreted taking into account the local geological and structural data. Figure 9 represents the inversion results of ERTs P1 to P36 (for location, cf. Figure 4). Similar to 2D-ERT P37, the DCR soundings are measured close to ERTs P1, P3, P7, P11, P12, P13, P25 and P31to evaluate the MW thickness, i.e., where the MW thickness is greater than 40 m (Figure 9). Regarding the accessible ground surfaces, the boreholes (W1 to W20) are drilled in order to: (i) calibrate the DCR inversion results, and (ii) evaluate MW at the WAD. Figure 10 represents (i) the interpretation of DCR soundings (1 to 9) that showing the resistivity range of subsurface geoelectrical layers and (ii) the drilled borehole data. For simplification purposes, the inversion results of DCR soundings are presented in the form of geological columns (Figure 10).
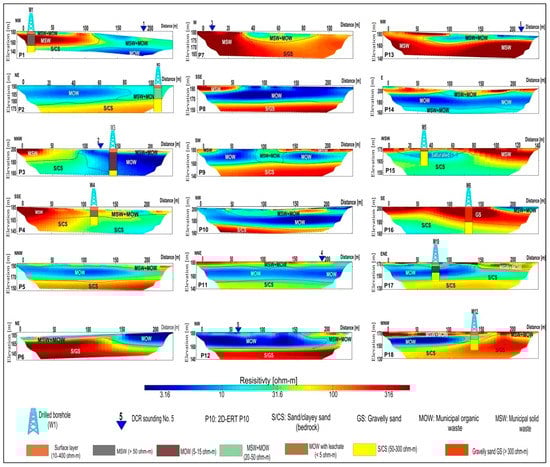
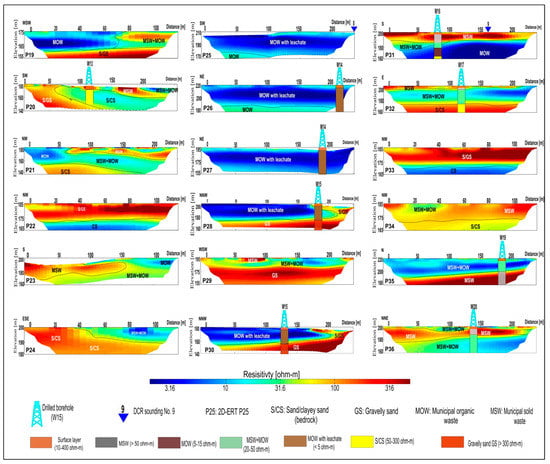
Figure 9.
2D electrical resistivity tomography (ERT) images showing the subsurface MW distributions in comparison with the drilled borehole data and DCR soundings. The location of the 2D-ERT profiles, drilled boreholes and DCR soundings are shown in Figure 4.
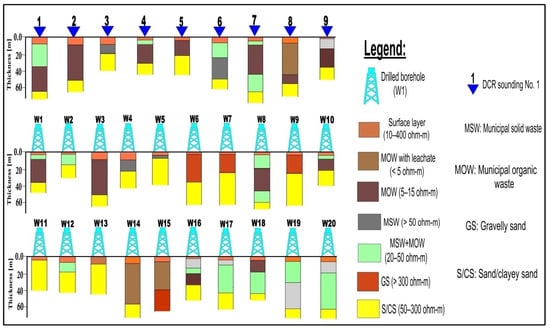
Regarding the inversion results of DCR measurements, the first geoelectrical layer represents a wide range of resistivity (10–400 ohm-m) corresponding to surface layer, which is highly heterogeneous. Moreover, the low to very low resistivity layer (<10 ohm-m) can be observed at the central and southern parts of the WAD (e.g., 2D-ERTs P9 and P17) corresponding to MOW and MOW with leachate, respectively, from the inactive sanitary landfill considering the drilled borehole data (W14 and W17, for location, cf. Figure 4).
By integrating borehole data and field observations, it can be observed that the very low resistivity layer (<5 ohm-m) is concentrated at the inactive sanitary landfill location corresponding to MOW with leachate. Moreover, the low resistivity layer (<10 ohm-m) can be observed at the central part of the study site, where the thickness of MW is increased and, consequently, the MOW could be decayed to become sponge-like and soft clay. On the other hand, the near surface high resistivity layer (>30 ohm-m) can correspond with the MSW. Because the study site is an uncontrolled dumpsite, the MW is not sorted. Accordingly, the medium resistivity layer (20–50 ohm-m) can be correlated with miscellaneous and/or non-sorted MW (i.e., MSW with MOW). Therefore, the inversion results of DCR measurements (soundings and 2D-ERTs) can classify and quantify, in general, the MW at the uncontrolled dumpsite when redundant borehole data are available.
Following the inversion results of DCR data, we can assume that the high LST at the central part of the study site and sanitary landfill zone (Figure 6a) can be attributed to MW compaction and decaying process of MOW, especially with decreasing the annual average rainfall (Figure 6b). Moreover, we can assume that the MW compaction reduces the permeability of decayed MW material to become sponge-like and soft clay [12]. On the other hand, the leachate flow appearance in 2010 (Figure 7b) is probably attributed to insufficient compaction with increasing the annual average rainfall through the drainage pattern. Regarding our field observation, the infiltration anisotropy has to be monitored, especially as this anisotropy creates horizontal preferential pathways within the uncontrolled dumpsite and sanitary landfill zone (Figure 3c and Figure 7b).
The 2D-ERTs (P1–P37) and DCR soundings indicate that the MW layers (<50 ohm-m) are followed by medium (50–300 ohm-m) to high (>300 ohm-m) resistivity values corresponding to Oligocene sand/clayey sand and gravely sand, respectively. Furthermore, it can be noticed that Oligocene layers (bedrock) are shallow at the observed faults upthrown side where the thickness of MW decrease and Oligocene sandy deposits are exposed (Figure 7a,c,d). It can be also observed that the MW thickness increases at the central part of the WAD, where the downthrown sides of observed faults are located (Figure 7a). Accordingly, it is worth mentioning that the integration of RS, geological, structural, DCR (1D and 2D surveys) and borehole data (Figure 2) are a substantial task to characterize and evaluate the MW at the uncontrolled and undocumented dumpsites. Furthermore, a new dumpsite archive and/or history can be created which, in turn, is essential for undocumented dumpsite/landfill remediation and management.
As we have no full control on the 2D inversion process in comparison with DCR soundings inversion, the lower boundary of subsurface high conductive layers cannot be resolved from 2D-ERT models [31]. Accordingly, the accurate thickness of MOW and MOW with leachate is challenging using the individual 2D-ERTs. Hence, the 2D-ERTs have many limitations in detecting the accurate thickness of high conductive layers within the MW. Alternatively, the DCR soundings interpretation applying GA allows us to characterize and evaluate the MOW and MOW with leachate calibrating with borehole data in an easier way, with more details and resolution than 2D-ERTs (Figure 10). However, the inversion results of DCR soundings can only be applied to the immediate locality of the soundings. Despite this limitation, the inversion results of DCR soundings applying GA in conjunction with 2D-ERTs using the advanced inversion method with drilled borehole data are necessary to map and evaluate the MW. Refs [46,47] indicated the shallow high conductive zones (e.g., clay layer; contaminated zones) can be well resolved using ERT and induced polarization (IP) data simultaneously. Accordingly, for future studies, MW mapping and soil degradation monitoring with 2D-ERT and IP measurements is recommended using non-conventional inversion schemes. Moreover, hydraulic properties of MW samples at the laboratory scale have to be assessed e.g., [48].
Obviously, the quality of DCR measurements in such a complex area is a real challenge. Consequently, the integration of RS, geological, structural and borehole data is essential for understanding and characterizing the MW distributions. Regarding the MW thickness evaluation, the above DCR inversion results showed that the ERT technique can only be satisfactory (i) if the MW is not too thick (i.e., <30 m; e.g., [49]); (ii) if the MW is not too conductive to avoid the MW lower boundary amplification e.g., [50] and, consequently, mis-quantification of MW thickness can be achieved; and (iii) finally the electrical resistivity contrast between the MW and host rocks is sufficient [49]. On the other hand, it is clear that the DCR soundings are proven to be representative for characterizing and quantifying the MW of the entire site once the inversion results are well calibrated with redundant borehole data, especially with applying the robust non-conventional inversion scheme (i.e., GA).
The measured 2D profiles (twelve 2D-ERTs) at the inactive sanitary landfill zone (Figure 11a) are gathered and then inverted in a 3D model and depth slices to map the subsurface blocky structure of leachate and/or sand-rich leachate. The conditions of data collection are challenging due to the decaying of MOW residues with emitting toxic gases. However, the geophysical measurements are carried out using a full-face piece reusable respirator (Figure 4b) to acquire the data. The 3D model from DC3dInvRes inversion is shown in Figure 11b,c. The MOW with leachate and/or leachate-rich sand is well detected with a very low resistivity of <5 ohm-m beneath the inactive sanitary landfill zone (Figure 11b). Moreover, the high resistivity values (>100 ohm-m) at the northwestern part can correspond to MSW (Figure 11b). On the other hand, the central and southern parts of the 3D model show medium to high resistivity values (30–200 ohm-m), which can be explained by clayey sand and sand layers, respectively. Furthermore, localized low resistivity (5–12 ohm-m) zones can be observed at the right and left sides of the 3D model (Figure 11b), which could correspond to MOW with regard to the poor data coverage at on the 3D model boundaries. The horizontal depth slices from the 3D model (Figure 11b) indicate that the very low and high resistivity zones corresponding to leachate-rich sand (MOW with leachate) and Oligocene sand, respectively, extends to more than 32.85 m in depth beneath the sanitary landfill (Figure 11c). It can be also noticed that the dimension of leachate-rich sand decreases with increasing depth.
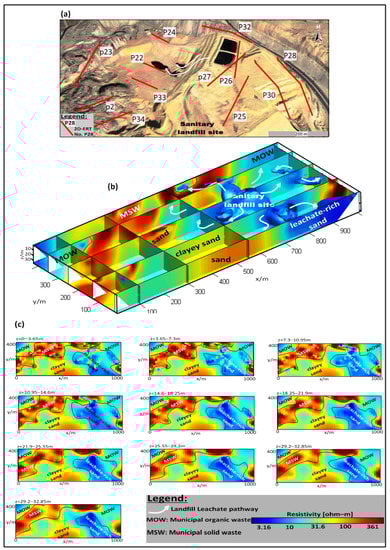
Figure 11.
(a) Location map of twelve 2D-ERTs using Wenner beta array at the WAD inactive sanitary landfill (for location, cf. Figure 3) showing the leachate flow pathway. (b) 3D image using DC3dInvRes inversion of the gathered 2D-ERTs showing the contaminated zone and subsurface leachate flow beneath the sanitary landfill. (c) The 3D resistivity models in the form of depth slices of the gathered 2D resistivity profiles (Figure 11a).
DCR sounding (No. 8) and borehole (W2, W14, W15, W17 and W18) data are acquired (for location, cf. Figure 4) to evaluate the maximum thickness of MSW and MOW with leachate at the sanitary landfill zone. Obviously, the inversion results of DCR sounding present an average thickness of MW as 50 m (Figure 10). Regarding surface structural data (Figure 7), the increase in MW thickness at the sanitary landfill site can be attributed to previous quarry activities over the observed fault downthrown side, which, in turn, facilitates the MW disposal process.
In this case, it is clear that the 3D inversion using dense 2D profiles is valuable with a low cost and good resolution. Moreover, the 3D resistivity model obtained from Wenner beta data can characterize the MW in an uncontrolled dumpsite. On the other hand, the conventional 3D inversion is, in itself, more computational power and time consuming than 2D inversion [51]. However, the horizontal slices from the 3D inversion present no additional information compared with the individual 2D inversion results where the resolution is to some extent lower, especially in the edges and coroners of the model. Consequently, the reliability in the model corners is clearly very low. Obviously, MW distribution appears sharper in the abovementioned 2D inversion than in the 3D horizontal slices. Accordingly, this makes the individual 2D profiles easier to interpret and characterize the MW in the uncontrolled dumpsite. Conversely, the contaminated zone (i.e., leachate-rich sand) at the central part of the 3D model (Figure 11b) is clearly resolved and characterized, especially with increasing the model sensitivity and data coverage. Still, having dense 2D profiles more than twelve is definitely required to discern between the MW-rich zone and artifacts.
Finally, the integration of the geophysical inversion results with RS and geological data has provided quick and accurate MW characterization in urban areas, in particular for mapping the leachate flow pathway around the sanitary landfill sites. Yet, the MW quantification can be easily achieved. However, the geophysical DOI could be limited in some MW sites regarding the ground accessibilities in such ground conditions. Thus, the boreholes are also necessary to complement the MW characterization in uncontrolled dumpsites. Accordingly, the suggested approach and procedures can be used for improving the environmental sustainability at a global level.
Considering all the above-mentioned results that are obtained from the introduced approach, the desired objectives of the study are achieved, which includes a full assessment of the WAD setting and how it negatively affects the surrounding population areas. Figure 12a,b shows a constructed integrative 3D model for the geologic controls affecting the distribution of MW at WAD correlated to the LST values. There is a clear agreement between the results of the different datasets used, including LST values, geological structures affecting the area, the spatial distribution of MW, and thickness resulting from 1D and ERT data interpretation. Obviously, the main factor controlling the distribution of landfills and the difference in their thickness are the distributed faults and their accompanying differences in old topography maps (Figure 12b). Hence, the downthrows of the mapped faults are the topographic lows that act as collection sites for the MW through time. In addition, the maximum LST values (43°, Figure 6 and Figure 12a) are observed at the eastern border of WAD which also includes the sanitary landfill zone where the highest MW thickness can be observed.
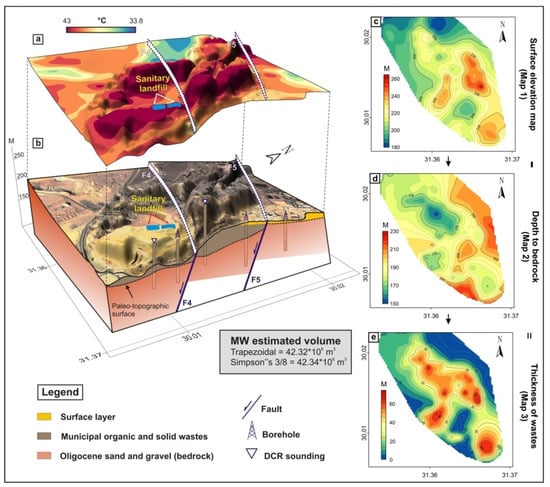
Figure 12.
(a,b) A 3D schematic model for the MW at WAD showing the relation between the LST values and the distribution of MW through the structural controlled paleo-lows. (c–e) Spatial distribution of (c) high resolution surface elevation using the total station (TS) technique, (d) bedrock depth based on borehole and geophysical data and (d) MW thickness at WAD, respectively.
MW characterization and quantification is becoming an income source for industry and creating new jobs [52]. Moreover, MW generates serous environmental contamination and health risks due to the waste scavenging. Accordingly, the MWQ quantification is essential and/or vital for environmental sustainability especially in developing and transition countries [53]. In order to quantify the MW, the inverse distance weighting (IDW) interpolation technique is carried out to produce a reliable spatial distribution of surface elevation using the total station (TS) technique (Figure 12c), bedrock depth (Figure 12d), and MW thickness (Figure 12e) in WAD, considering the borehole and geophysical data. Multiple interpolation techniques are implemented to choose the most representative technique, applying a cross-validation method. Representative data are randomly used as a validation dataset, while the remaining data are used at the same time as a training dataset. Visual inspection of the outputs showed that the IDW interpolation technique well represents the distribution of the measured data (i.e., elevation, depth, and thickness) in the WAD. Additionally, volumetric calculations have been used for a precise MW quantification. In general, the MW volume can be estimated applying numerical integration approaches, especially when the closed form can be achieved. In this study, extended trapezoidal (ET) and Simpson’s 3/8 (S3/8) methods are applied to quantify the MW at the WAD. Mathematically, the ET rule has a rather easy conceptualization and derivation. Moreover, S3/8 rule usually achieves a considerable level of accuracy faster than ET method (see Appendix A). Regarding the above-mentioned calculations, the estimated MW volume of WAD is ≈42.32 and 42.34 million cubic meters applying ET and S3/8 rules, respectively.
6. Conclusions
The value of land has increased significantly due to its limitation and higher demand to meet the demographic changes and world population growth. We applied and tested suggested procedures for studying the uncontrolled dumpsites in arid conditions with special and/or complex geological characteristics and a dearth of documentation for MW. The paper demonstrated that the MW classification in such environments is not simple, but, to a large degree, the suggested workflow can be a practical way to improve the understating of waste distributions and characterize the MW in an accurate qualitative and quantitative way for economic assessment.
The geographical growth of Cairo in the last 30 years created the dumpsite of WAD (≈385 acre) that was a few kilometers away from the urbanized areas in a central position. This created pressure on the environment and consequentially health-related issues. Remotely sensed data with old topographic maps enabled the simulation of the real picture of the dumpsite before its development. Satellite data processing provided real descriptions of the LU/LC, LST, SM and lineaments. The geologic setting of the WAD area was mapped, including geological structures, rock characteristics and lithologic units. Obviously, most of the dumpsite MW has larger surface quantities near the downthrows of the mapped faults, which may raise the geotechnical hazards related to the uncontrolled load of the MW on the possible reactivation of the nearby faults (e.g., land subsidence). Then, subsurface mapping of the dumpsite using DCR technique and borehole data was carried out in the form of 1D, 2D and 3D dimensions. For reducing the uncertainty in DCR inversion, the joint use of conventional, non-conventional and advanced inversion schemes was applied. Regarding MW thickness estimation, the paper showed that the joint application of 1D, 2D and 3D geoelectrical surveys, in a simultaneous manner, are essential for MW characterization and quantification.
In the DCR results, low resistivity anomalies related to MOW and landfill leachates were evaluated. Moreover, the MSW was characterized in the form of high resistivity anomalies calibrated with borehole data and our field observation. The very-low resistivity anomalies around the abandoned sanitary landfill were effectively characterized by 3D inversion of the measured 2D-ERTs. Accordingly, the 3D-ERT method is believed to be valuable for landfill leachate flow mapping. Moreover, 2D-ERT can be efficient if the MW is not too thick and the electrical resistivity contrast between the MW and the host sediments is sufficient. In addition, the DCR sounding is considered to be more realistic than 2D/3D-ERT technique for MW thickness determination with redundant borehole data and, consequently, quantifying the MW. As a result, the volumetric calculation of MW was carried out (≈42.32 MCM) at a low cost compared with conventional drilling procedures. Therefore, the joint use of RS, geological, structural and DCR (1D/2D/3D) data is useful to evaluate and quantify MW in uncontrolled dumpsites. Our findings, therefore, highlight the significant use of the advocated procedures for improving the sustainability at a global level in uncontrolled dumpsites with poor MW documentation. In outlook studies, 4D-ERT monitoring with induced polarization spectra measurements will be required to track the leachate flow paths/rates and analyze/image the MW decomposition under waste compaction processes.
Author Contributions
Individual contributions to the research is as follows: Conceptualization, I.A.E.-M., M.A., M.E.B., A.G., A.H. and S.Z.; methodology, M.A., A.H. and S.Z.; formal analysis M.A., A.H. and S.Z.; field investigation, M.A. and A.G.; project administration, I.A.E.-M., M.A. and M.E.B.; writing—original draft preparation and review and editing, I.A.E.-M., M.A., M.E.B., A.H. and S.Z.; writing—review and editing, I.A.E.-M. M.A., M.E.B., A.H. and S.Z.; software and visualization, M.A., A.H. and S.Z.; supervision, I.A.E.-M., M.A. and M.E.B.; funding acquisition, I.A.E.-M., M.E.B. All authors have read and agreed to the published version of the manuscript.
Funding
This research received no external funding.
Informed Consent Statement
Not applicable.
Data Availability Statement
Not applicable.
Acknowledgments
A part of this article was presented at the 2ndEdition of World Congress onGeology and Earth Science (GeoEarth-2021), online, 4–6 October 2021. Mohamed Attwa (M.A.) expresses thanks to A.T. Basokur, I. Akca (Ankara Uni. Turkey) and T. Günther (LIAG institute, Hannover, Germany) for great assistance with inversion software during the preparation of this paper.
Conflicts of Interest
The authors declare no conflict of interest.
Appendix A. (MW Quantification Using ET and S3/8 Approaches)
In ET rules, the MW volume can be calculated as follows:
Note, the pattern of the coefficients in ET rule is {1,2,2,2,…,2,2,1}.
In S3/8 rule, the volume can be calculated as follows:
Note, the pattern of the coefficients in S3/8 method is {1,3,3,2,3,3,2,…,3,3,2,1}: where, is the grid column spacing, is the grid row spacing and is the grid node value in row i and column j.
References
- Diesendorf, M. Sustainability and sustainable development. In Sustainability: The Corporate Challenge of the 21st Century; Dunphy, D., Benveniste, J., Griffiths, A., Sutton, P., Eds.; Allen & Unwin: Sydney, Australia, 2000; Chapter 2; pp. 19–37. [Google Scholar]
- Naudet, V.; Revil, A.; Rizzo, E.; Bottero, J.-Y.; Bégassat, P. Groundwater redox conditions and conductivity in a contaminant plume from geoelectrical investigations. Hydrol. Earth Syst. Sci. 2004, 8, 8–22. [Google Scholar] [CrossRef]
- El Maguiri, A.; Kissi, B.; Idrissi, L.; Souabi, S. Landfill site selection using GIS, remote sensing and multicriteria decision analysis: Case of the city of Mohammedia, Morocco. Bull. Eng. Geol. Environ. 2016, 75, 1301–1309. [Google Scholar] [CrossRef]
- Rodríguez, A.I.; Ocaña, R.E.; Flores, D.; Martinez, P.; Casas, A. Environment diagnosis for land-use planning based on a tectonic and multidimensional methodology. Sci. Total Environ. 2021, 800, 149514. [Google Scholar] [CrossRef] [PubMed]
- Aljammaz, A.; Sultan, M.; Izadi, M.; Abotalib, A.Z.; Elhebiry, M.S.; Emil, M.K.; Abdelmohsen, K.; Saleh, M.; Becker, R. Land Subsidence Induced by Rapid Urbanization in Arid Environments: A Remote Sensing-Based Investigation. Remote Sens. 2021, 13, 1109. [Google Scholar] [CrossRef]
- Nazari, R.; Alfergani, H.; Haas, F.; Karimi, M.E.; Fahad, G.R.; Sabrin, S.; Everett, J.; Bouaynaya, N.; Peters, R.W. Application of Satellite Remote Sensing in Monitoring Elevated Internal Temperatures of Landfills. Appl. Sci. 2020, 10, 6801. [Google Scholar] [CrossRef]
- Mallick, J. Municipal Solid Waste Landfill Site Selection Based on Fuzzy-AHP and Geoinformation Techniques in Asir Region Saudi Arabia. Sustainability 2021, 13, 1538. [Google Scholar] [CrossRef]
- Martínez-Segura, M.A.; Vásconez-Maza, M.D.; García-Nieto, M.C. Volumetric characterisation of waste deposits generated during the production of fertiliser derived from phosphoric rock by using LiDAR and electrical resistivity tomography. Sci. Total Environ. 2020, 716, 137076. [Google Scholar] [CrossRef]
- Kondracka, M.; Stan-Kłeczek, I.; Sitek, S.; Ignatiuk, D. Evaluation of geophysical methods for characterizing industrial and municipal waste dumps. Waste Manag. 2021, 125, 27–39. [Google Scholar] [CrossRef]
- Guérin, R.; Munoz, M.L.; Aran, C.; Laperrelle, C.; Hidra, M.; Drouart, E.; Grellier, S. Leachate recirculation: Moisture content assessment by means of a geophysical technique. Waste Manag. 2004, 24, 785–794. [Google Scholar] [CrossRef]
- Tsourlos, P.; Vargemezis, G.; Fikos, I.; Tsokas, G. DC geoelectrical methods applied to landfill investigation: Case studies from Greece. First Break 2014, 32, 6968. [Google Scholar] [CrossRef]
- Audebert, M.; Clément, R.; Moreau, S.; Duquennoi, C.; Loisel, S.; Touze-Foltz, N. Understanding leachate flow in municipal solid waste landfills by combining time-lapse ERT and subsurface flow modelling-Part I: Analysis of infiltration shape on two different waste deposit cells. Waste Manag. 2016, 55, 165–175. [Google Scholar] [CrossRef] [PubMed]
- SWEEP-net “The Regional Solid Waste Exchange of Information and Expertise Network in the MENA region” (2014) Country Report on the Solid Waste Management in EGYPT. Deutsche Gesellschaft fürInternationaleZusammenarbeit (GIZ), German Federal Ministry for Economic Cooperation and Development (BMZ). Available online: https://www.retech-germany.net/fileadmin/retech/05_mediathek/laenderinformationen/Aegypten_RA_ANG_14_1_Laenderprofile_sweep_net.pdf (accessed on 5 January 2022).
- Günther, T. Software DC2DINVRES. Direct Current 2D Inversion and Resolution. 2007. Available online: http://www.resisitivty.net (accessed on 5 January 2022).
- Akça, I.; Basokur, A.T. Extraction of structure-based geoelectric models by hybrid genetic algorithms. Geophysics 2010, 75, 15–22. [Google Scholar] [CrossRef]
- Clément, R.; Descloitres, M.; Günther, T.; Oxarango, L.; Morra, C.; Laurent, J.P.; Gourc, J.P. Improvement of electrical resistivity tomography for leachate injection monitoring. Waste Manag. 2010, 30, 452–464. [Google Scholar] [CrossRef] [PubMed]
- Meshref, W.M. Tectonic framework of Egypt. In The Geology of Egypt; Said, R., Ed.; Balkema: Rotterdam, The Netherlands, 1990; pp. 133–155. [Google Scholar]
- Henaish, A. Fault-related domes: Insights from sedimentary outcrops at the northern tip of the Gulf of Suez rift, Egypt. Mar. Pet. Geol. 2018, 91, 202–210. [Google Scholar] [CrossRef]
- Kharbish, S.; Henaish, A.; Zamzam, S. Geodiversity and geotourism in Greater Cairo area, Egypt: Implications for geoheritage revival and sustainable development. Arab. J. Geosci. 2020, 13, 451. [Google Scholar] [CrossRef]
- Henaish, A. Soft-linkage transfer zones: Insights from the Northern Eastern Desert, Egypt. Mar. Pet. Geol. 2018, 95, 265–275. [Google Scholar] [CrossRef]
- Henaish, A.; Attwa, M. Internal structural architecture of a soft-linkage transfer zone using outcrop and DC resistivity data: Implications for preliminary engineering assessment. Eng. Geol. 2018, 244, 1–13. [Google Scholar] [CrossRef]
- Henaish, A.; Kharbish, S. Linkage style of rift-associated fault arrays: Insights from central Cairo-Suez district, Egypt. Carpathian J. Earth Environ. Sci. 2020, 15, 189–196. [Google Scholar] [CrossRef]
- Attwa, M.; Henaish, A. Regional structural mapping using a combined geological and geophysical approach—A preliminary study at Cairo-Suez District, Egypt. J. Afr. Earth Sci. 2018, 144, 104–121. [Google Scholar] [CrossRef]
- Abdullah, A.; Akhir, J.M.; Abdullah, I. Automatic mapping of lineaments using shaded relief images derived from digital elevation model (DEMs) in the maran—Sungilembing area, Malaysia. Electron. J. Geotech. Eng. 2010, 15, 949–957. [Google Scholar]
- Hung, L.Q.; Batelaan, O.; De Smedt, F. Lineament extraction and analysis, comparison of Landsat ETM and ASTER imagery. Case study: Suoimuoi tropical karst catchment, Vietnam. In Remote Sensing for Environmental Monitoring, GIS Applications, and Geology V; SPIE: Bellingham, WA, USA, 2005; p. 5983. [Google Scholar]
- Yan, W.Y.; Mahendrarajah, P.; Shaker, A.; Faisal, K.; Luong, R.; Al-Ahmad, M. Analysis of multi-temporal landsat satellite images for monitoring land surface temperature of municipal solid waste disposal sites. Environ. Monit. Assess. 2014, 186, 8161–8173. [Google Scholar] [CrossRef] [PubMed]
- Oguz, H. LST calculator: A program for retrieving Land Surface Temperature from Landsat TM/ETM+ imagery. Environ. Eng. Manag. J. 2013, 12, 549–555. [Google Scholar] [CrossRef]
- Herndon, K.; Muench, R.; Cherrington, E.; Griffin, R. An Assessment of Surface Water Detection Methods for Water Resource Management in the Nigerien Sahel. Sensors 2020, 20, 431. [Google Scholar] [CrossRef] [PubMed] [Green Version]
- The World Bank. Planning, Connecting, and Financing Cities—Now: Priorities for City Leaders; World Bank Publications: Washington, DC, USA, 2013. [Google Scholar]
- Attwa, M.; Zamzam, S. An integrated approach of GIS and geoelectrical techniques for wastewater leakage investigations: Active constraint balancing and genetic algorithms application. J. Appl. Geophys. 2020, 175, 103992. [Google Scholar] [CrossRef]
- Attwa, M.; El Bastawesy, M.; Ragab, D.; Othman, A.; Assaggaf, H.M.; Abotalib, A.Z. Toward an Integrated and Sustainable Water Resources Management in Structurally-Controlled Watersheds in Desert Environments Using Geophysical and Remote Sensing Methods. Sustainability 2021, 13, 4004. [Google Scholar] [CrossRef]
- Ebong, E.D.; Abong, A.A.; Ulem, E.B.; Ebong, L.A. Geoelectrical Resistivity and Geological Characterization of Hydrostructures for Groundwater Resource Appraisal in the Obudu Plateau, Southeastern Nigeria. Nonrenew. Resour. 2021, 30, 2103–2117. [Google Scholar] [CrossRef]
- LaBrecque, D.J.; Miletto, M.; Daily, W.; Ramirez, A.; Owen, E. The effects of noise on Occam’s inversion of resistivity tomography data. Geophysics 1996, 61, 538–548. [Google Scholar] [CrossRef]
- Audenrieth, I.; Martin, R.; Yogeshwar, P.; Willig, D. Analysis of measurement errors from electrical resistivity imaging investigation of First World War mining tunnels in La Boisselle, France. Near Surf. Geophys. 2020, 18, 561–573. [Google Scholar] [CrossRef]
- Constable, S.C.; Parker, R.L.; Constable, C.G. Occam’s inversion: A practical algorithm for generating smooth models from electromagnetic sounding data. Geophysics 1987, 52, 289–300. [Google Scholar] [CrossRef]
- Weichenthal, S.; Van Rijswijk, D.; Kulka, R.; You, H.; Van Ryswyk, K.; Willey, J.; Dugandzic, R.; Sutcliffe, R.; Moulton, J.; Baike, M.; et al. The impact of a landfill fire on ambient air quality in the north: A case study in Iqaluit, Canada. Environ. Res. 2015, 142, 46–50. [Google Scholar] [CrossRef] [Green Version]
- Gemail, K.S.; Attwa, M.; Eleraki, M.; Zamzam, S. Imaging of wastewater percolation in heterogeneous soil using electrical resistivity tomography (ERT): A case study at east of Tenth of Ramadan City, Egypt. Environ Earth Sci. 2017, 7, 666. [Google Scholar] [CrossRef]
- Günther, T. Inversion Methods and Resolution Analysis for the 2D/3D Reconstruction of Resistivity Structures from DC-Measurements. Ph.D. Thesis, University of Mining and Technology, Freiberg, Germany, 2004. [Google Scholar]
- Günther, T.; Rücker, C.; Spitzer, K. 3-D modeling and inversion of dc resistivity data incorporating topography—Part 2: Inversion. Geophys. J. Int. 2006, 166, 506–517. [Google Scholar] [CrossRef] [Green Version]
- Maury, S.; Balaji, S. Geoelectrical method in the investigation of groundwater resource and related issues in Ophiolite and Flysch formations of Port Blair, Andaman Island, India. Environ. Earth Sci. 2013, 71, 183–199. [Google Scholar] [CrossRef]
- Bobachev, A. IPI2Win V 3.1.0 2C: User’s Guide, Programs Set for VES Data Interpretation; Department of Geophysics, Moscow State University: Moscow, Russia, 2008. [Google Scholar]
- Basokur, A.T.; Akça, I.; Siyam, N.W.A. Hybrid genetic algorithms in view of the evolution theories with application for the electrical sounding method. Geophys. Prospect. 2007, 55, 393–406. [Google Scholar] [CrossRef]
- Sun, Q.; Wu, Z.; Tan, J. The relationship between land surface temperature and land use/land cover in Guangzhou, China. Environ. Earth Sci. 2011, 65, 1687–1694. [Google Scholar] [CrossRef]
- Peng, W.; Wang, J.; Zhang, J.; Zhang, Y. Soil moisture estimation in the transition zone from the Chengdu Plain region to the Longmen Mountains by field measurements and LANDSAT 8 OLI/TIRS-derived indices. Arab. J. Geosci. 2020, 13, 168. [Google Scholar] [CrossRef]
- Baek, W.-K.; Jung, H.-S.; Jo, M.-J.; Lee, W.-J.; Zhang, L. Ground subsidence observation of solid waste landfill park using multi-temporal radar interferometry. Int. J. Urban Sci. 2018, 23, 406–421. [Google Scholar] [CrossRef]
- Attwa, M.; Henaish, A.; Zamzam, S. Hydrogeologic Characterization of a Fault-Related Dome Using Outcrop, Borehole and Electrical Resistivity Data. Nat. Resouces Res. 2020, 29, 1143–1161. [Google Scholar] [CrossRef]
- Kumar, P.; Tiwari, P.; Singh, A.; Biswas, A.; Acharya, T. Electrical Resistivity and Induced Polarization signatures to delineate the near-surface aquifers contaminated with seawater invasion in Digha, West-Bengal, India. CATENA 2021, 207, 105596. [Google Scholar] [CrossRef]
- Audebert, M.; Clément, R.; Touze-Foltz, N.; Günther, T.; Moreau, S.; Duquennoi, C. Time-lapse ERT interpretation methodology for leachate injection monitoring based on multiple inversions and a clustering strategy (MICS). J. Appl. Geophys. 2014, 111, 320–333. [Google Scholar] [CrossRef]
- Gaël, D.; Tanguy, R.; Nicolas, M.; Frédéric, N. Assessment of multiple geophysical techniques for the characterization of municipal waste deposit sites. J. Appl. Geophys. 2017, 145, 74–83. [Google Scholar]
- El-Saadawy, O.; Gaber, A.; Othman, A.; Abotalib, A.Z.; El Bastawesy, M.; Attwa, M. Modeling Flash Floods and Induced Recharge into Alluvial Aquifers Using Multi-Temporal Remote Sensing and Electrical Resistivity Imaging. Sustainability 2020, 12, 10204. [Google Scholar] [CrossRef]
- Lysdahl, A.K.; Bazin, S.; Christensen, C.; Ahrens, S.; Günther, T.; Pfaffhuber, A.A. Comparison between 2D and 3D ERT inversion for engineering site investigations—A case study from Oslo Harbour. Near Surf. Geophys. 2017, 15, 201–209. [Google Scholar] [CrossRef]
- Ferronato, N.; Torretta, V. Waste Mismanagement in Developing Countries: A Review of Global Issues. Int. J. Environ. Res. Public Health 2019, 16, 1060. [Google Scholar] [CrossRef] [PubMed] [Green Version]
- Vongdala, N.; Tran, H.-D.; Xuan, T.D.; Teschke, R.; Khanh, T.D. Heavy Metal Accumulation in Water, Soil, and Plants of Municipal Solid Waste Landfill in Vientiane, Laos. Int. J. Environ. Res. Public Health 2018, 16, 22. [Google Scholar] [CrossRef] [PubMed] [Green Version]
Publisher’s Note: MDPI stays neutral with regard to jurisdictional claims in published maps and institutional affiliations. |
© 2022 by the authors. Licensee MDPI, Basel, Switzerland. This article is an open access article distributed under the terms and conditions of the Creative Commons Attribution (CC BY) license (https://creativecommons.org/licenses/by/4.0/).