1. Introduction
With the advent of the industrialization era, global surface temperatures have steadily risen, and the resulting climate change has resulted in an increase in temperature, change in precipitation patterns, and increase in evapotranspiration, which are predicted to have a significant impact on drought [
1,
2,
3,
4]. Drought is a meteorological disaster that occurs worldwide alongside flood disasters, and it has a great economic and environmental impact on society [
5,
6]. With global warming, the average drought period on Earth is expected to gradually increase, and owing to changes in moisture supply and demand, approximately two-thirds of the world’s population will gradually experience severe drought [
7,
8]. Moreover, spatial changes in drought severity increase across climate zones, which can increase water stress throughout Asia [
9]. While most natural disasters occur instantly without a forecast, drought is caused by water shortages over a long period of time. Therefore, drought damage should be defined as the basic concept of water shortage rather than simply a statistical figure of precipitation. In a wide range of drought definitions, a lack of precipitation causes meteorological drought, which affects soil moisture, and can be termed an agricultural and hydrological drought [
10]. As meteorological drought is dominated by precipitation processes, its forecast is fundamentally an issue of long-range weather forecasting. Hydrological and agricultural droughts are driven by meteorological droughts; therefore, their forecasts also heavily depend on weather forecasting [
11].
Considering these definitions of drought, various drought indices have been developed worldwide to quantitatively analyze drought. A drought index is an essential tool for characterizing and monitoring drought, as it can simplify complex climate functions and quantify climate abnormalities in terms of severity, duration, and frequency [
12]. This index makes it easier to deliver information about climate abnormalities to various users and allows scholars to quantitatively evaluate climate abnormalities in terms of intensity, duration, frequency, and spatial range [
5]. Various drought indices have been designed to accurately represent the characteristics of drought according to needs and purposes and have been adopted in a variety of studies.
In South Korea, research on drought indices has been actively conducted. According to the Korea Meteorological Administration, Korea’s annual precipitation ranges from 1000 to 1800 mm in the southern region and 1100–1400 mm in the central region, which is relatively high compared to the world’s average precipitation of about 990 mm [
13,
14].
However, more than half of the annual precipitation is concentrated in summer, and winter precipitation accounts for less than 10% of the total annual precipitation; hence, it cannot be said that we are safe from drought. Considering this environment, South Korea’s public institutions, such as the Ministry of Environment, the Korea Meteorological Administration, the Korea Water Resources Corporation, and the Korea Rural Community Corporation, have adopted drought indices to present the current status and indicators of drought.
Although it is important to display and analyze the current status of drought from the past to the present using existing data, it is also necessary to predict future drought considering climate change to prevent drought.
One of the methods employed to predict future climate is the climate change scenario, which is a future climate outlook estimated by applying artificial changes caused by human activity to the global system model [
15]. The SSP scenario was introduced in the sixth evaluation report most recently published by the Intergovernmental Panel on Climate Change (IPCC), and it is a scenario that considers “future socioeconomic changes” and “efforts to mitigate climate change”, in addition to the existing concept of representative concentration pathways (RCP). In the sixth evaluation report, all five SSP scenarios announced that the temperature will increase by 1.5 °C in the near future (2021–2040) and increase by 3.3–5.7 °C in the distant future (2081–2100) if the situation proceeds according to the highest emission scenario. Therefore, it is important to successfully implement climate policies and adapt to changing temperatures in the future. To adapt well to changing temperatures, it is necessary to take countermeasures based on the predictions of future droughts. Sharma et al. (2021) expressed drought in Nepal with the SPI using the SSP scenario [
16]. Su et al. (2021) demonstrated drought with SPI and SPEI considering the four representative pathways of SSP-RCP, as well as SSP1-1.9, SSP4-3.4, and SSP4-6.0 [
17]. In South Korea, future drought trends were analyzed using RCP scenarios and drought indices [
18,
19,
20]. Kim et al. (2021) analyzed the flood control capacity of domestic reservoirs by analyzing the precipitation frequency based on SSP scenarios [
21]. However, studies on domestic drought analyses using SSP scenarios remain insufficient.
This study aimed to predict drought over the next 80 years in South Korea using SSP scenarios. The two drought indices, SPI and RDI, were compared according to each of the SSP1-2.6 and SSP5-8.5 scenarios, and a more detailed analysis was conducted by analyzing the drought index by region for SSP5-8.5 scenarios in which there is no climate policy and CO2 emissions still occur.
2. Background Theory
2.1. SSP Scenario
Starting with the SA90 scenario used in the first evaluation report of IPCC in 1990, various climate change scenarios have been developed for over approximately 30 years and play a key role in climate analysis [
22,
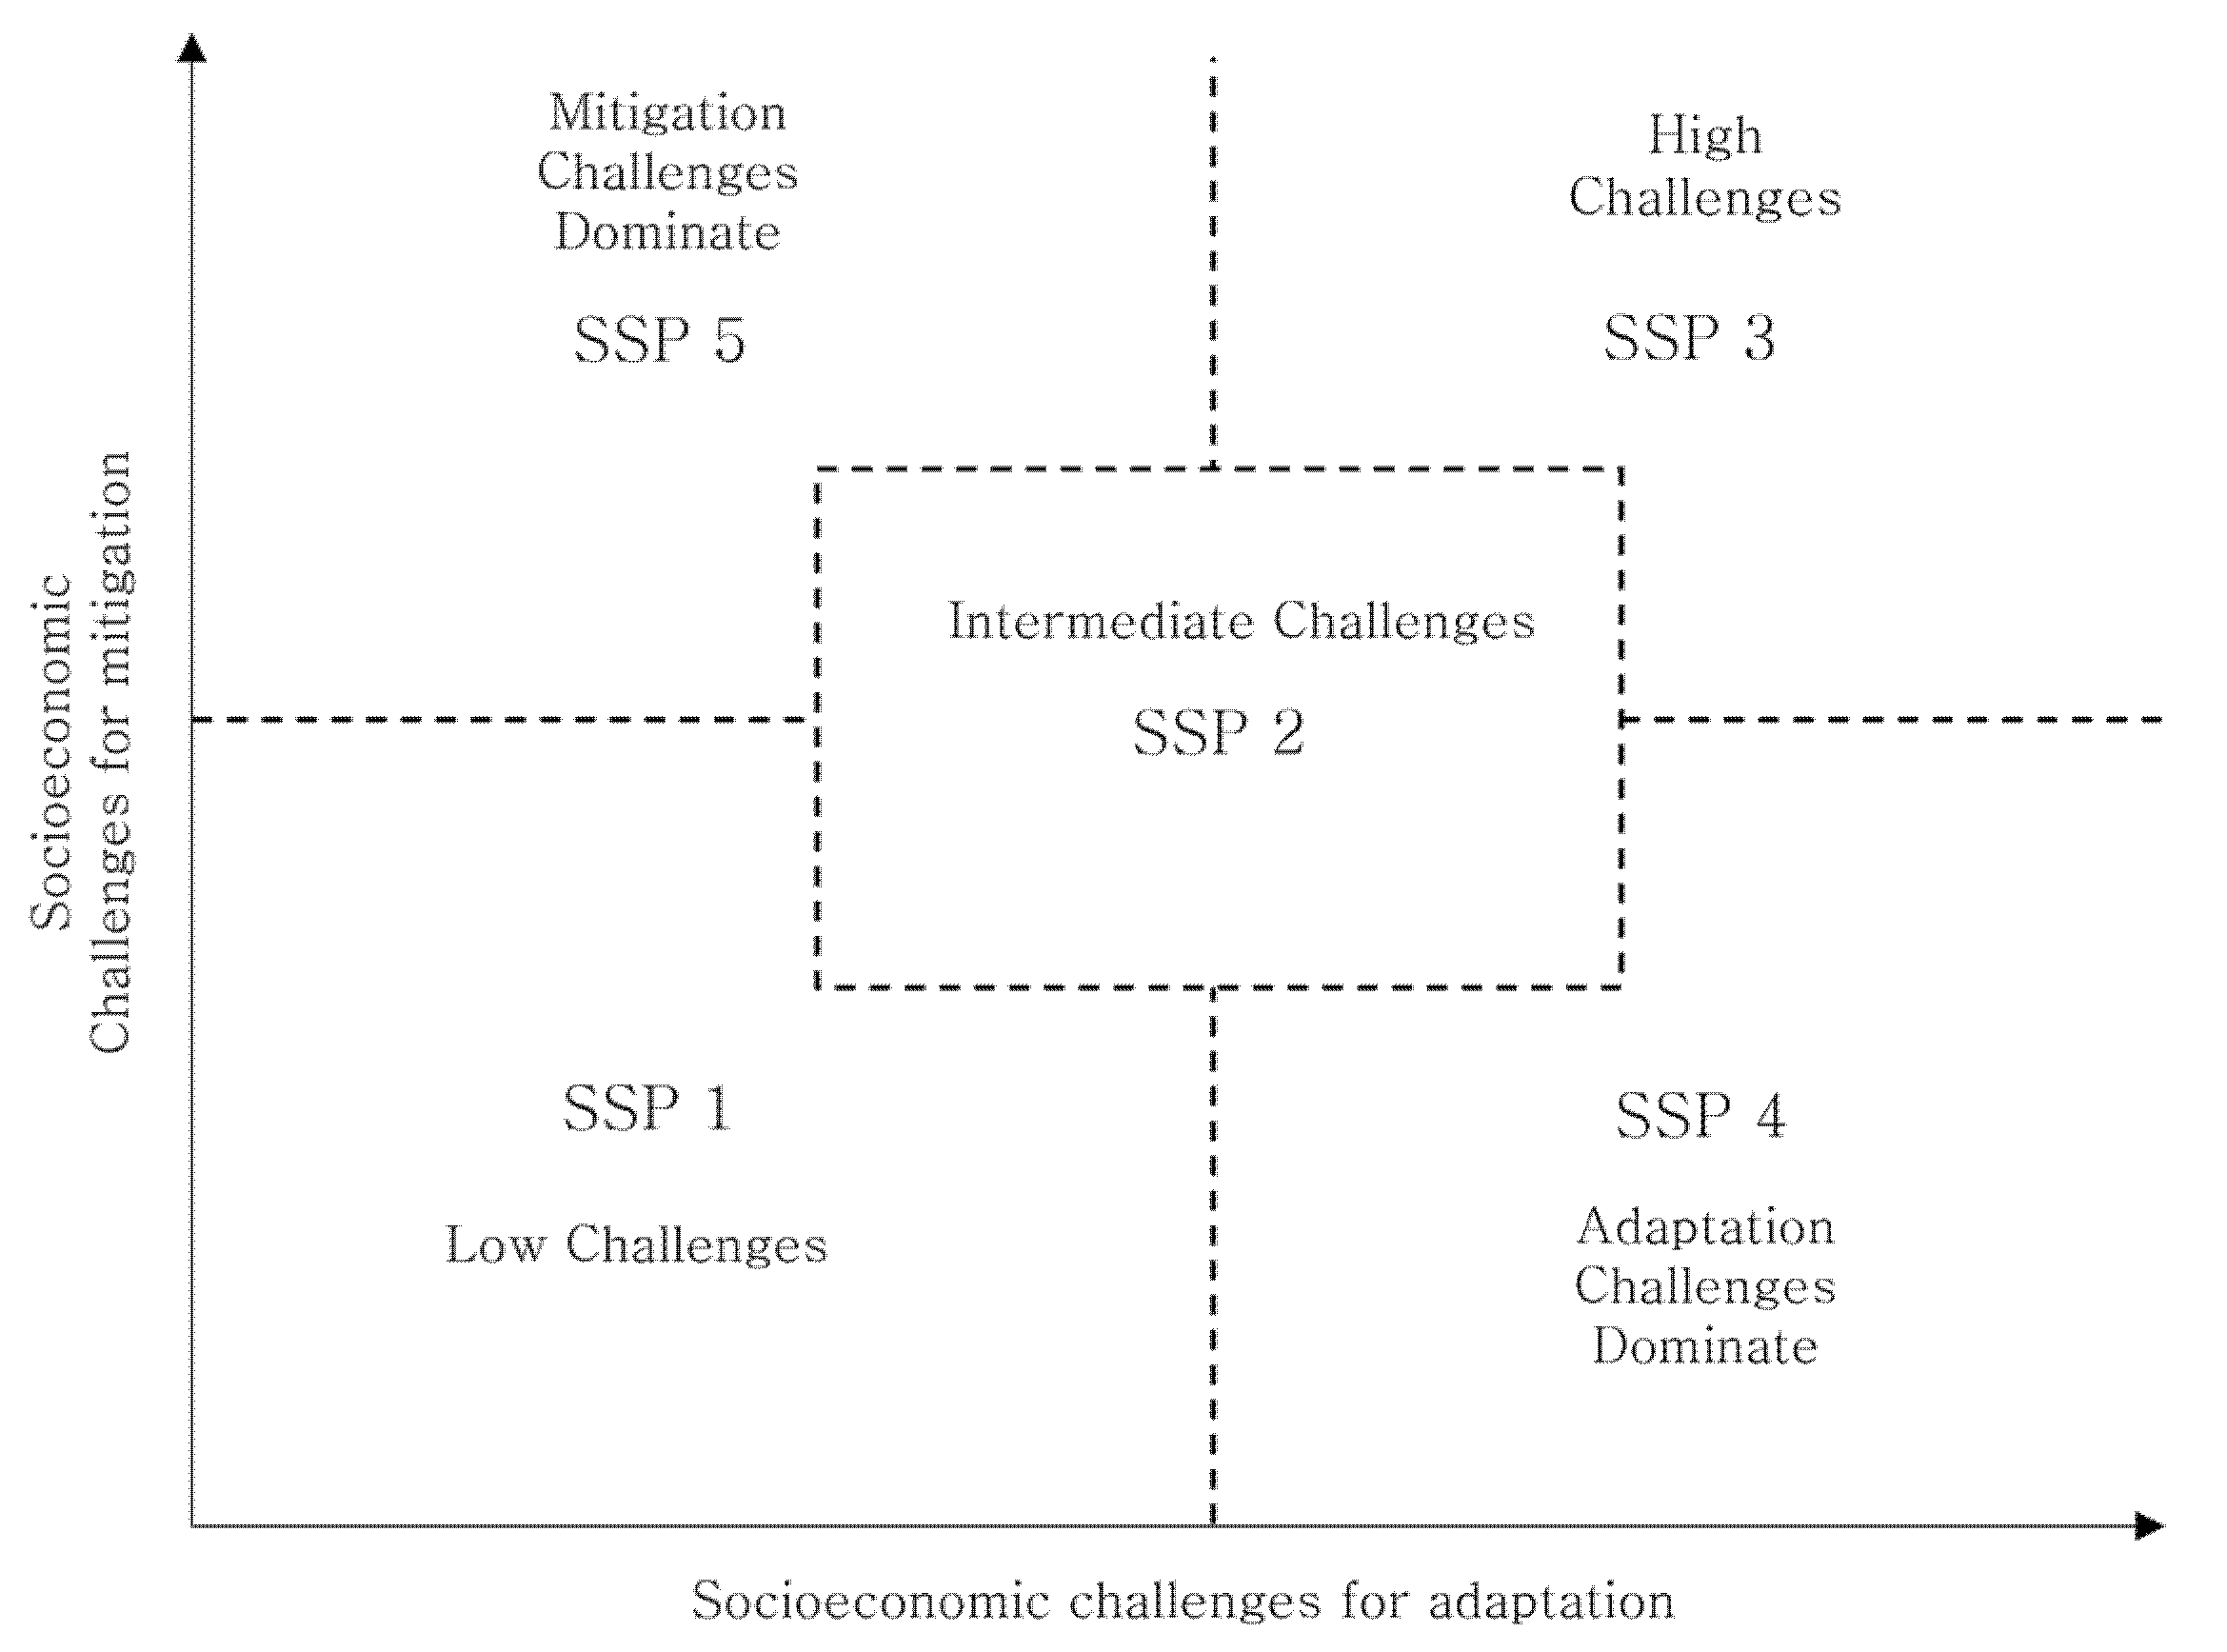
23]. The most recently published shared socioeconomic pathways (SSP) scenario is used in the sixth IPCC evaluation report, which considers future socioeconomic changes and climate change mitigation efforts in addition to the existing concept of the RCP scenario and divides them into five pathways. SSP considers various socioeconomic change factors, such as demographics, economic development, welfare, ecosystems, resources, systems, technological development, social factors, and policy development.
Figure 1 illustrates the SSP scenario, with socio-economic efforts to mitigate and adapt to climate change on the
y-axis and
x-axis, respectively.
Mitigation refers to the state in which efforts are made to reduce greenhouse gas emissions, and there are notable achievements, while adaptation refers to adjusting to a new climate environment, responding to it, and developing accordingly to the changing environment [
24]. Here, socioeconomic means that economic variables directly related to society are considered and conditions related to future climate change are excluded. Furthermore, ecological variables such as biodiversity were considered. Of course, climate change and biodiversity in reality interact with each other; however, to develop an SSP scenario that estimates the impact of future climate change on biodiversity, we assumed a hypothetical future in which biodiversity is not affected by climate change. This is as important as applying economic or other variables directly related to society [
25].
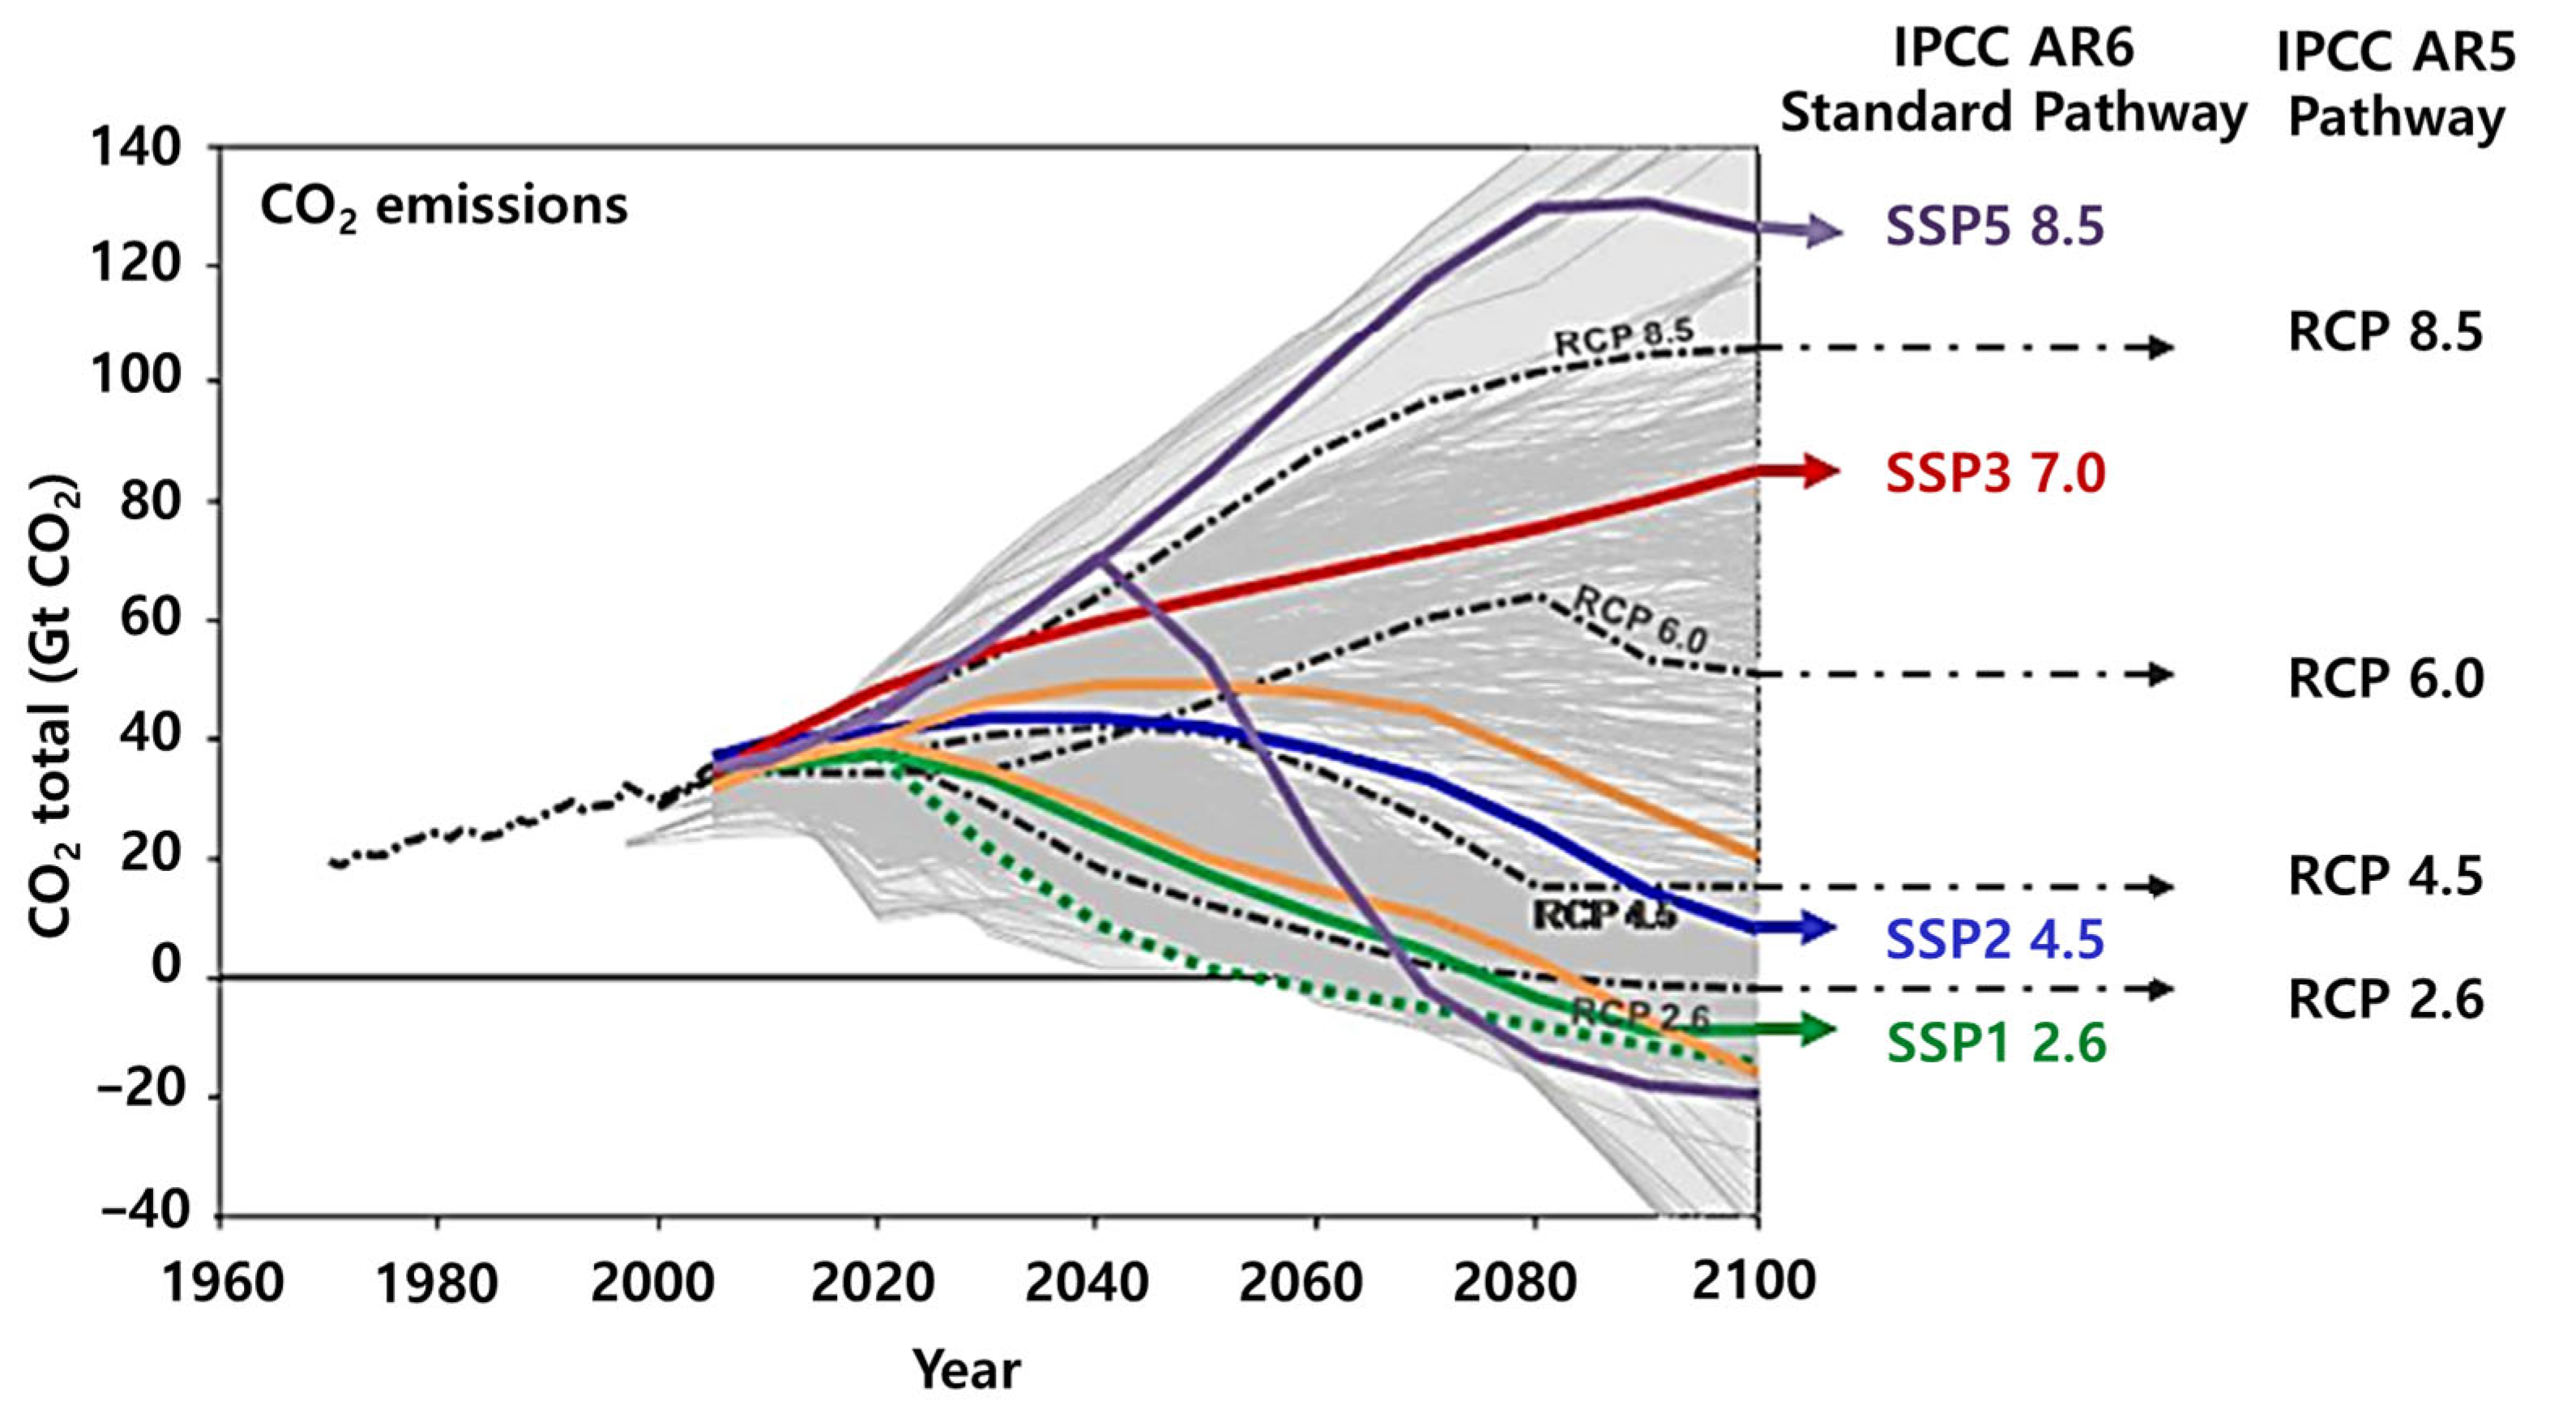
Figure 2 is a graph of the CO
2 emissions according to the SSP and RCP scenario pathways over time.
Among all pathways, the standard pathways were SSP1-2.6, SSP2-4.5, SSP3-7.0, and SSP5-8.5 by IPCC [
28]. The number indicated later for each pathway represents the amount of solar energy additionally absorbed in 2100, as in the RCP scenario. This means that the solar radiation energy currently absorbed by Earth is approximately 238
, but the CO
2 concentration in the atmosphere increases differently for each scenario, and by 2100, RCP 2.6 and RCP 8.5 will absorb more energy by 2.6
and 8.5
, respectively.
2.2. Drought Index
2.2.1. Standard Precipitation Index (SPI)
The Standardized Precipitation Index (SPI), developed by McKee et al. (1993), is currently one of the most widely used drought indices [
29]. SPI considers that each component of the water resource system responds to a lack of precipitation according to different time scales [
5]. SPI is based on the precipitation probability distribution. Because it is a normalized index, various locations and climates can be compared properly. The calculation of the SPI begins with the adjustment of the precipitation recorded for the gamma distribution. The parameters and gamma probability density functions were adjusted for the frequency distribution of the total amount of precipitation, as shown in Equation (1) [
29]:
where
is the scale parameter,
is the shape parameter, x is the amount of precipitation, and
is the Gamma function. Parameters
and
of the Gamma probability density function are estimated for each station and time scale (1, 3, 6, 12 months, etc.). Estimates of the maximum precipitation of
and
are described in Equation (2) [
29]:
where n is the number of observation values, and the results of the parameter are used to determine the cumulative probability of observed precipitation events for specific months and timescales at the corresponding location. Because the gamma function is not defined at x = 0 and the precipitation distribution of 0 may be included, the cumulative probability is stated in Equation (4) [
29]:
where q is the precipitation probability of 0, and G(x) is the cumulative probability of the incomplete gamma function.
If m is the number of zeros in the precipitation time series, then q can be estimated as m/n. The cumulative probability H(x) is converted into a standard normal random variable z with an average of 0 and variance of 1, which becomes an SPI value [
30,
31]. Drought occurred when the index continuously reached an intensity of −1.0 or less. The event ended when the SPI index was 0 or higher. Therefore, each drought had a period defined by its beginning and end, along with the intensity of each month during which the event lasted. The drought severity obtained by using SPI is classified as presented in
Table 1 [
29].
2.2.2. RDI (Reconnaissance Drought Index)
RDI is a balance between precipitation and evapotranspiration and has been developed to approach drought more accurately [
32,
33]. It is based on cumulative precipitation (
P) and potential evapotranspiration (PET). The initial value of RDI (
) is calculated for the
i-th year based on the
k-month time, as shown in Equation (5) [
32,
33]:
where
and
are precipitation and potential evapotranspiration in the
j-th month of the
i-th year, respectively, and
N is the total number of years for the available data.
Potential evapotranspiration can be calculated with various methods, but in this study, it was calculated using the Thornthwaite method. Vangelis. H. et al. performed a comparative analysis of various PET calculation methods [
34]. The Thornthwaite method was used to calculate the potential evapotranspiration lower than the Hargreaves, Blaney-Criddle, and AO P-M methods. Furthermore, it followed the same pattern as that of the Blaney–Criddle method. However, based on the results of calculating the RDI drought index using this potential evapotranspiration, all four methods indicated approximately the same value with insignificant differences. Therefore, in this study, the potential evapotranspiration (PET) was calculated using the Thornthwaite method, as shown in Equation (6) [
32,
33]:
where
is average monthly temperature (°C),
is average monthly sunlight time (h/day), and
is number of days in every month.
can be defined as described in Equation (7) [
32,
33].
Finally,
is an index for a column calculated as the sum of the 12-month values, according to Equation (8) [
32,
33].
The
value follows the log-normal and gamma distributions on a wide range of locations and different time scales [
35]. Assuming that the log normal distribution is applied, an equation such as Equation (9) can be used for calculating
[
32,
33].
where
is
,
is the arithmetic average, and
is the standard deviation.
When the Gamma distribution is applied,
can be calculated using the gamma probability density function for the given frequency distribution,
. Furthermore, using this approach, in the case of a short reference period, such as monthly periods,
can include a value of 0 for cumulative precipitation during the period and perform calculations based on a complex cumulative distribution function, including a precipitation probability of 0 and a gamma cumulative probability. In Equation (5),
assumes that it follows a logarithmic normal distribution. Therefore, the standardized RDI may be expressed in a manner similar to that of SPI. The drought severity of
can be expressed by the drought classification of SPI in
Table 1.
SPI and RDI can represent various durations, such as 1, 3, 6, and 12 months. Pei et al. (2020) studied the characteristics of a drought index based on such time scales [
36]. WMO (2012) claimed that SPI6 can exhibit seasonal precipitation trends and is effective in showing a clear trend in precipitation over the season [
37]. In this study, SPI and RDI over a 6-month duration were adopted to reflect the seasonal characteristics of South Korea.
3. Data Collection and Analysis
3.1. Data Collection from SSP Scenario
South Korea provides climate change scenarios at the Climate Information Portal (
http://www.climate.go.kr/, accessed on 1 May 2021) organized by the Korea Meteorological Administration [
38]. Various climate change scenarios from SRES to RCP and SSP are subdivided into global, East Asian, Korean Peninsula, and South Korean scenarios, but SSP scenarios for only the global and East Asian ranges are currently open to the public.
Because the spatial research scope of this study was the South Korean region, the climate change scenario of East Asia, which has a higher resolution than the global range, was selected. The spatial resolution of the East Asian climate outlook was 25 km, and the temporal resolution was chosen to be monthly rather than yearly. Data from 2021 to 2100 were selected to determine future drought indices. Furthermore, the SSP scenario provides information on temperature, precipitation, wind, and relative humidity, and in this study, precipitation data essential for the drought index and temperature data necessary to calculate the evapotranspiration of RDI were selected.
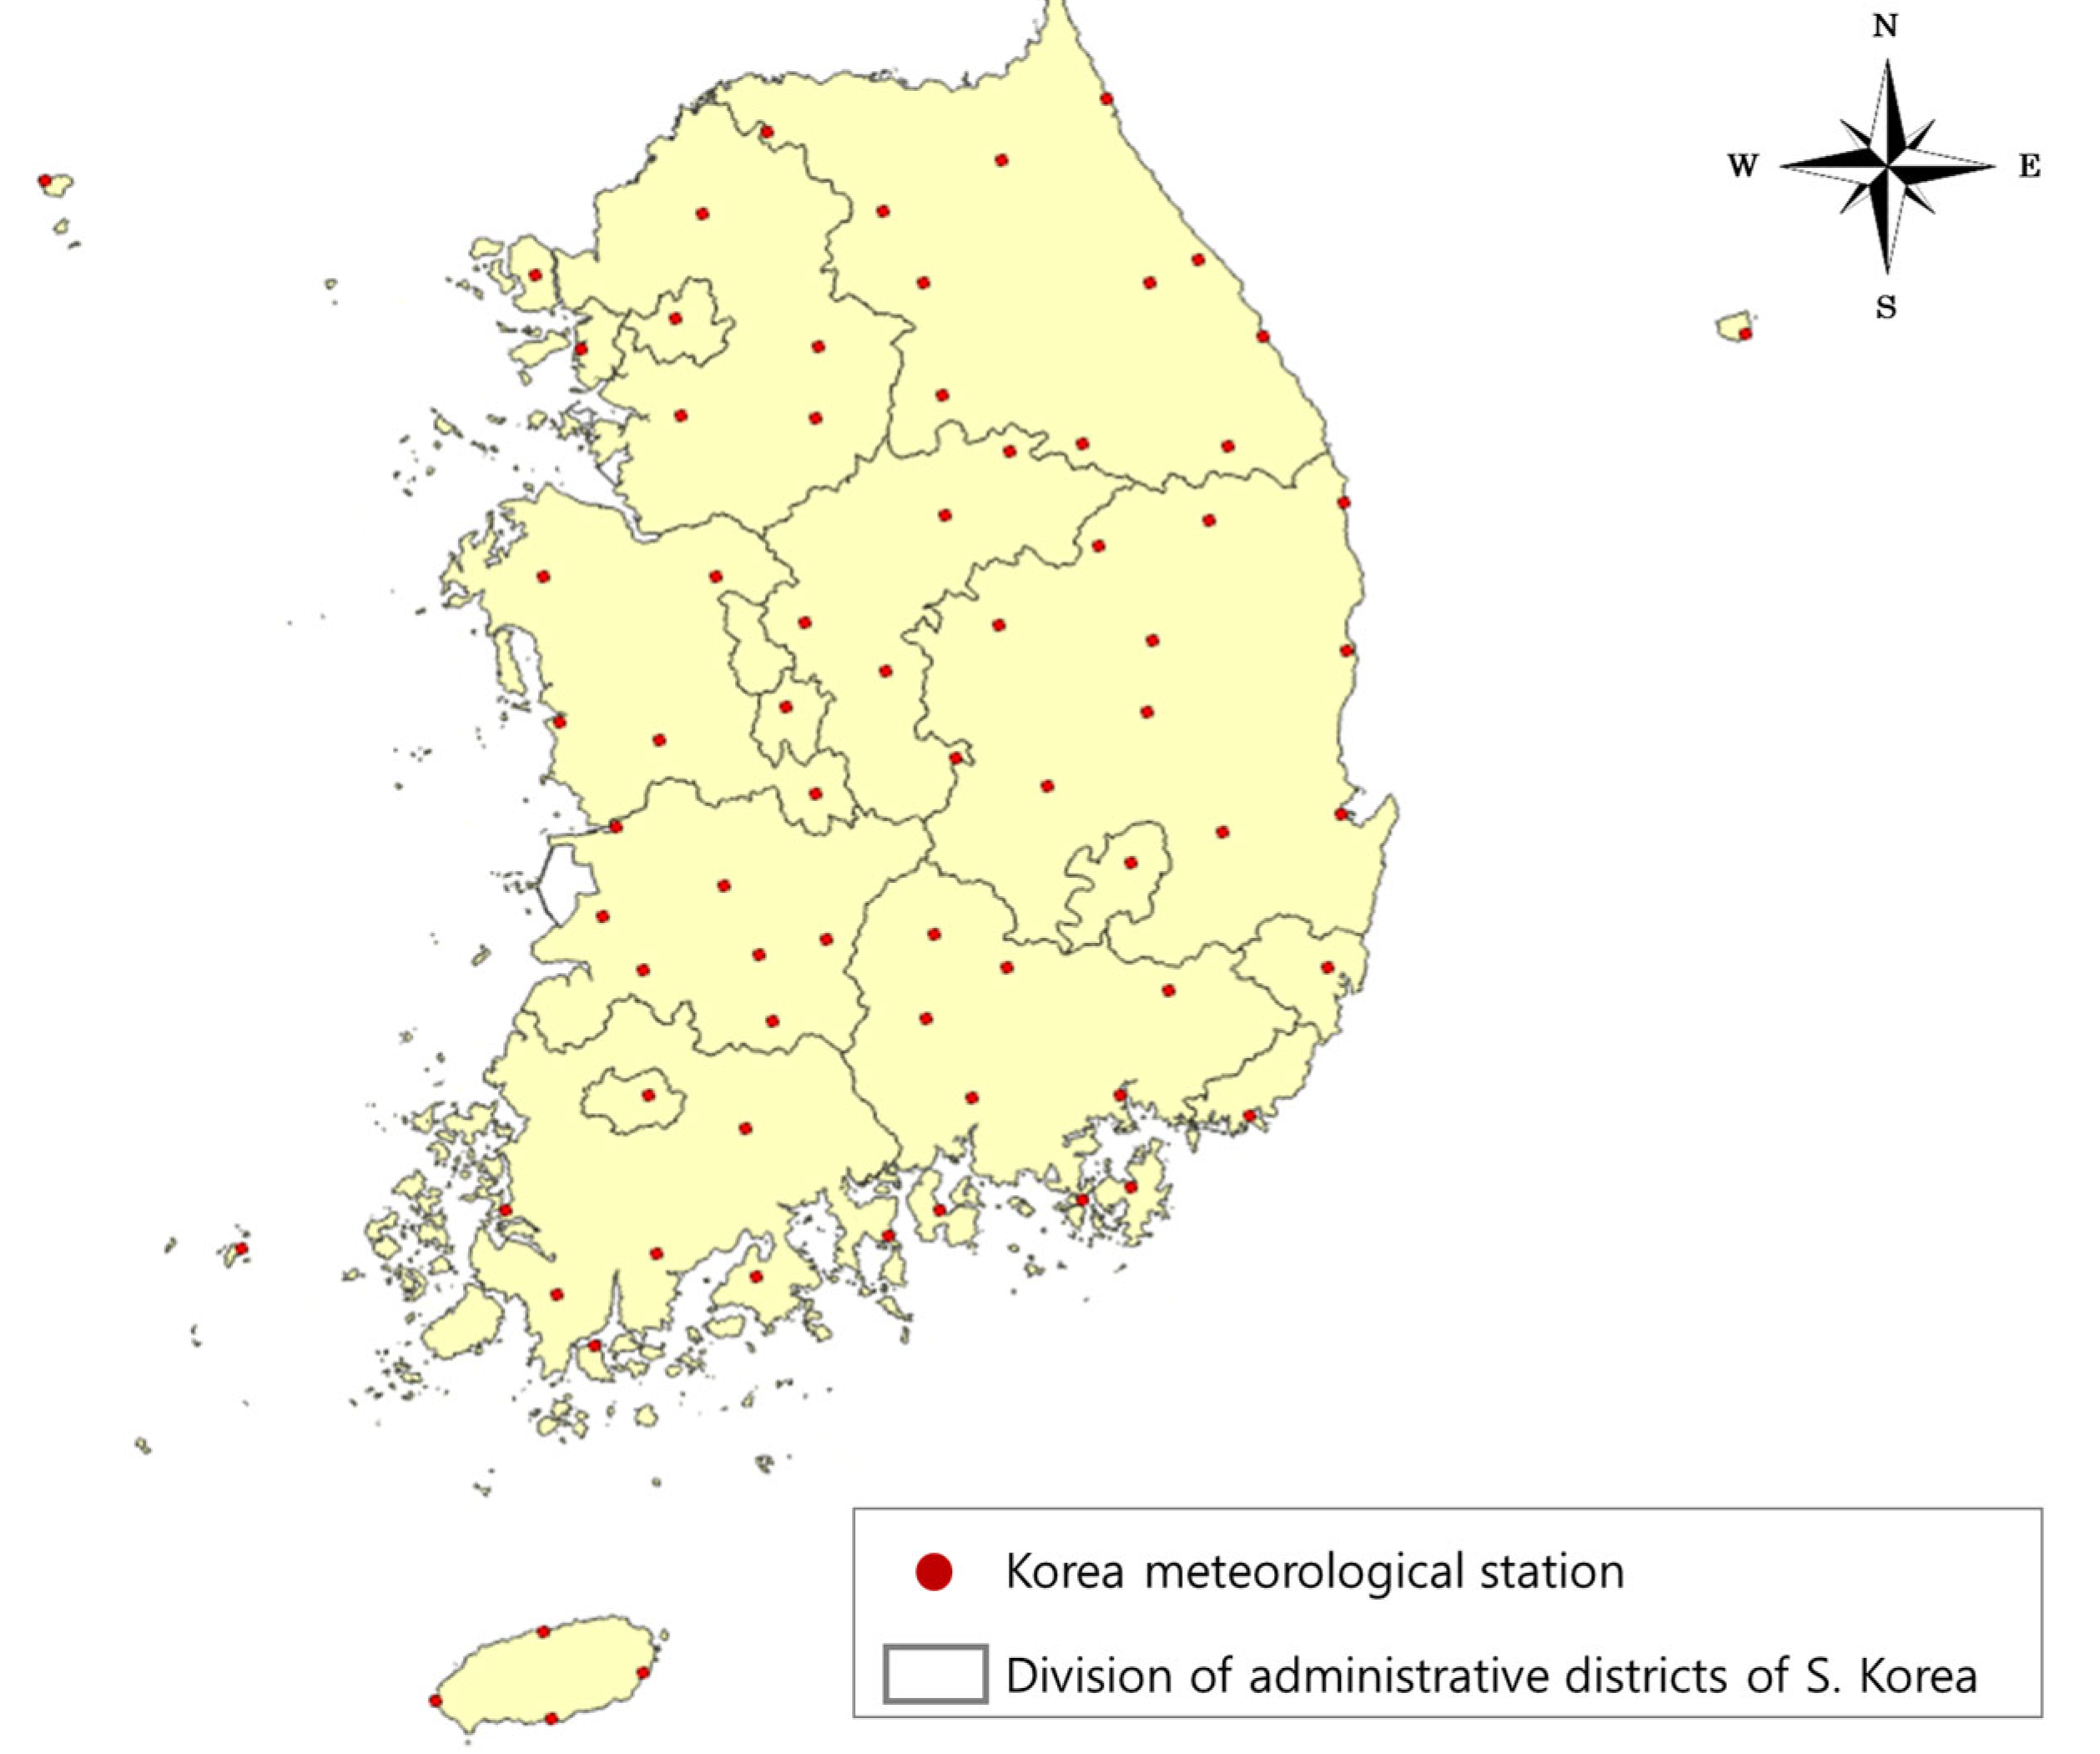
This study aimed to analyze the overall future drought index of Korea according to the scenario and regional changes in the drought index over time; hence, the entire country was selected as the research area.
Figure 3 illustrates Korea’s division of administrative districts and meteorological stations.
Although climate change scenario data can be obtained from the administrative district, the SSP scenario does not provide data for this district. Therefore, the locations of 73 ground weather stations nationwide, provided by the Korea Meteorological Administration, were used. Precipitation, the most important factor for calculating SPI and RDI, was extracted for each month at each weather station using SSP1-2.6 and SSP5-8.5. SSP data are provided by the Korea Meteorological Administration.
3.2. Analysis of Precipitation and Temperature
The precipitation required for the drought index calculation was calculated for each month at each weather station using SSP1-2.6 and SSP5-8.5 scenarios.
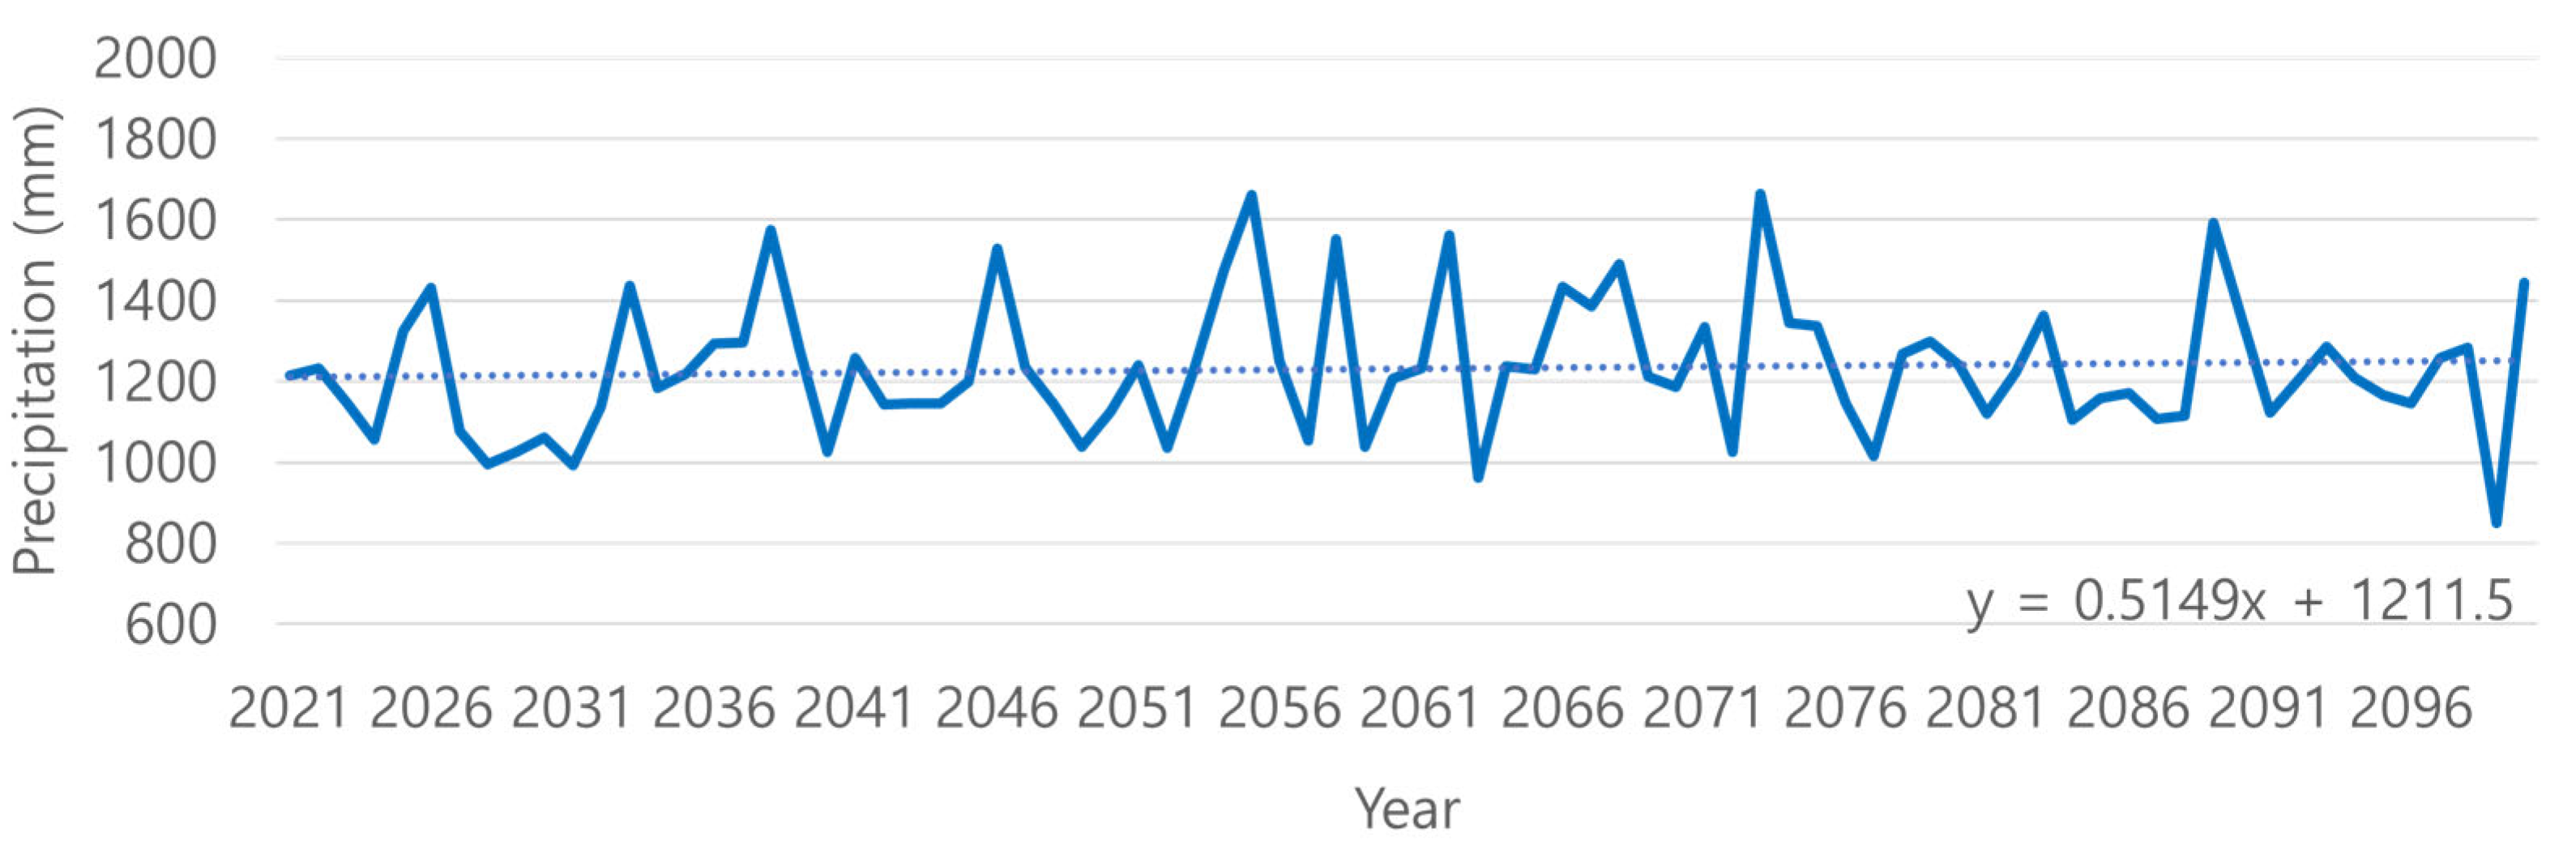
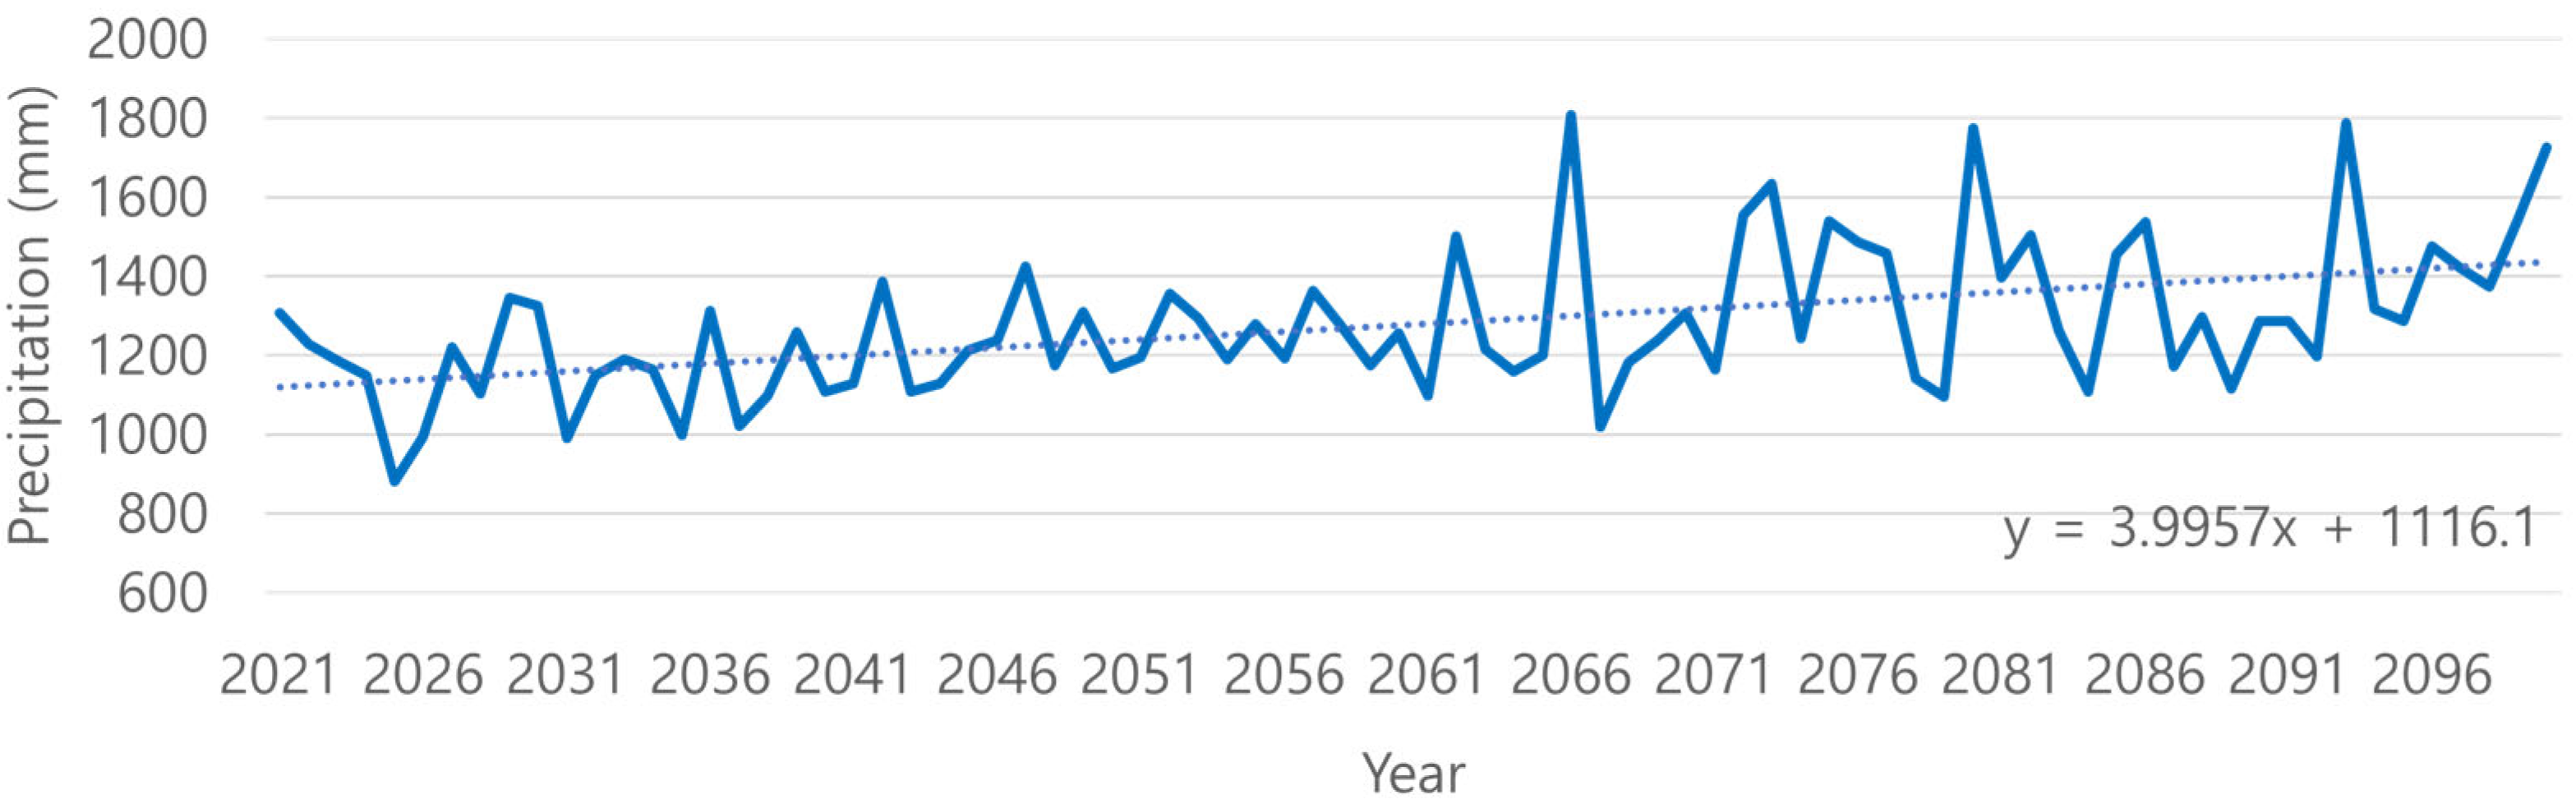
Figure 4 and
Figure 5 include graphs illustrating the average annual precipitation in Korea for scenarios SSP1-2.6 and SSP5-8.5, respectively. Scenario SSP1-2.6 has a trend line slope for the average annual precipitation of approximately 0.149 until 2100, and the trend line slope of the SSP5-8.5 scenario is 0.9599, indicating that it has a larger increase in average annual precipitation than the SSP1-2.6 scenario.
Table 2 presents the results of the statistical analysis of precipitation in two scenarios.
In SSP1-2.6, the highest average annual precipitation was 1663.20 mm in 2073, and the lowest average annual precipitation was 848.6 mm in 2099. The standard deviation of the average annual precipitation under the SSP1-2.6 scenario was 168.09. Moreover, when 80 years were divided into near-term future (2020–2040), mid-term future (2041–2070), and long-term future (2071–2100), the standard deviation of precipitation in the near-term future was 161.09; in the mid-term future, it was 178.20; and in the long-term future, it was 163.77, indicating that the mid-term future had the largest standard deviation.
In the SSP5-8.5 scenario, the highest precipitation was recorded to be 1807.66 mm in 2066, which is 144.46 mm higher than the highest precipitation in the SSP1-2.6 scenario. In addition, the lowest precipitation recorded was 880.40 mm in 2025. The standard deviation of the average annual precipitation was 187.78 mm, indicating that the deviation in precipitation was larger than in the SSP1-2.6 scenario. Furthermore, the standard deviations for the near-term, mid-term, and long-term futures were 128.57 mm, 147.49 mm, and 197.93 mm, respectively, indicating that the difference in average annual precipitation becomes very severe in the distant future. This suggests that water use may become uneven in the future for purposes such as agriculture, industrial manufacturing, and domestic use.
Because RDI considers evapotranspiration, temperature data are required. Similarly to precipitation, it was calculated for each month at each weather station using the SSP1-2.6 and SSP5-8.5 scenarios.
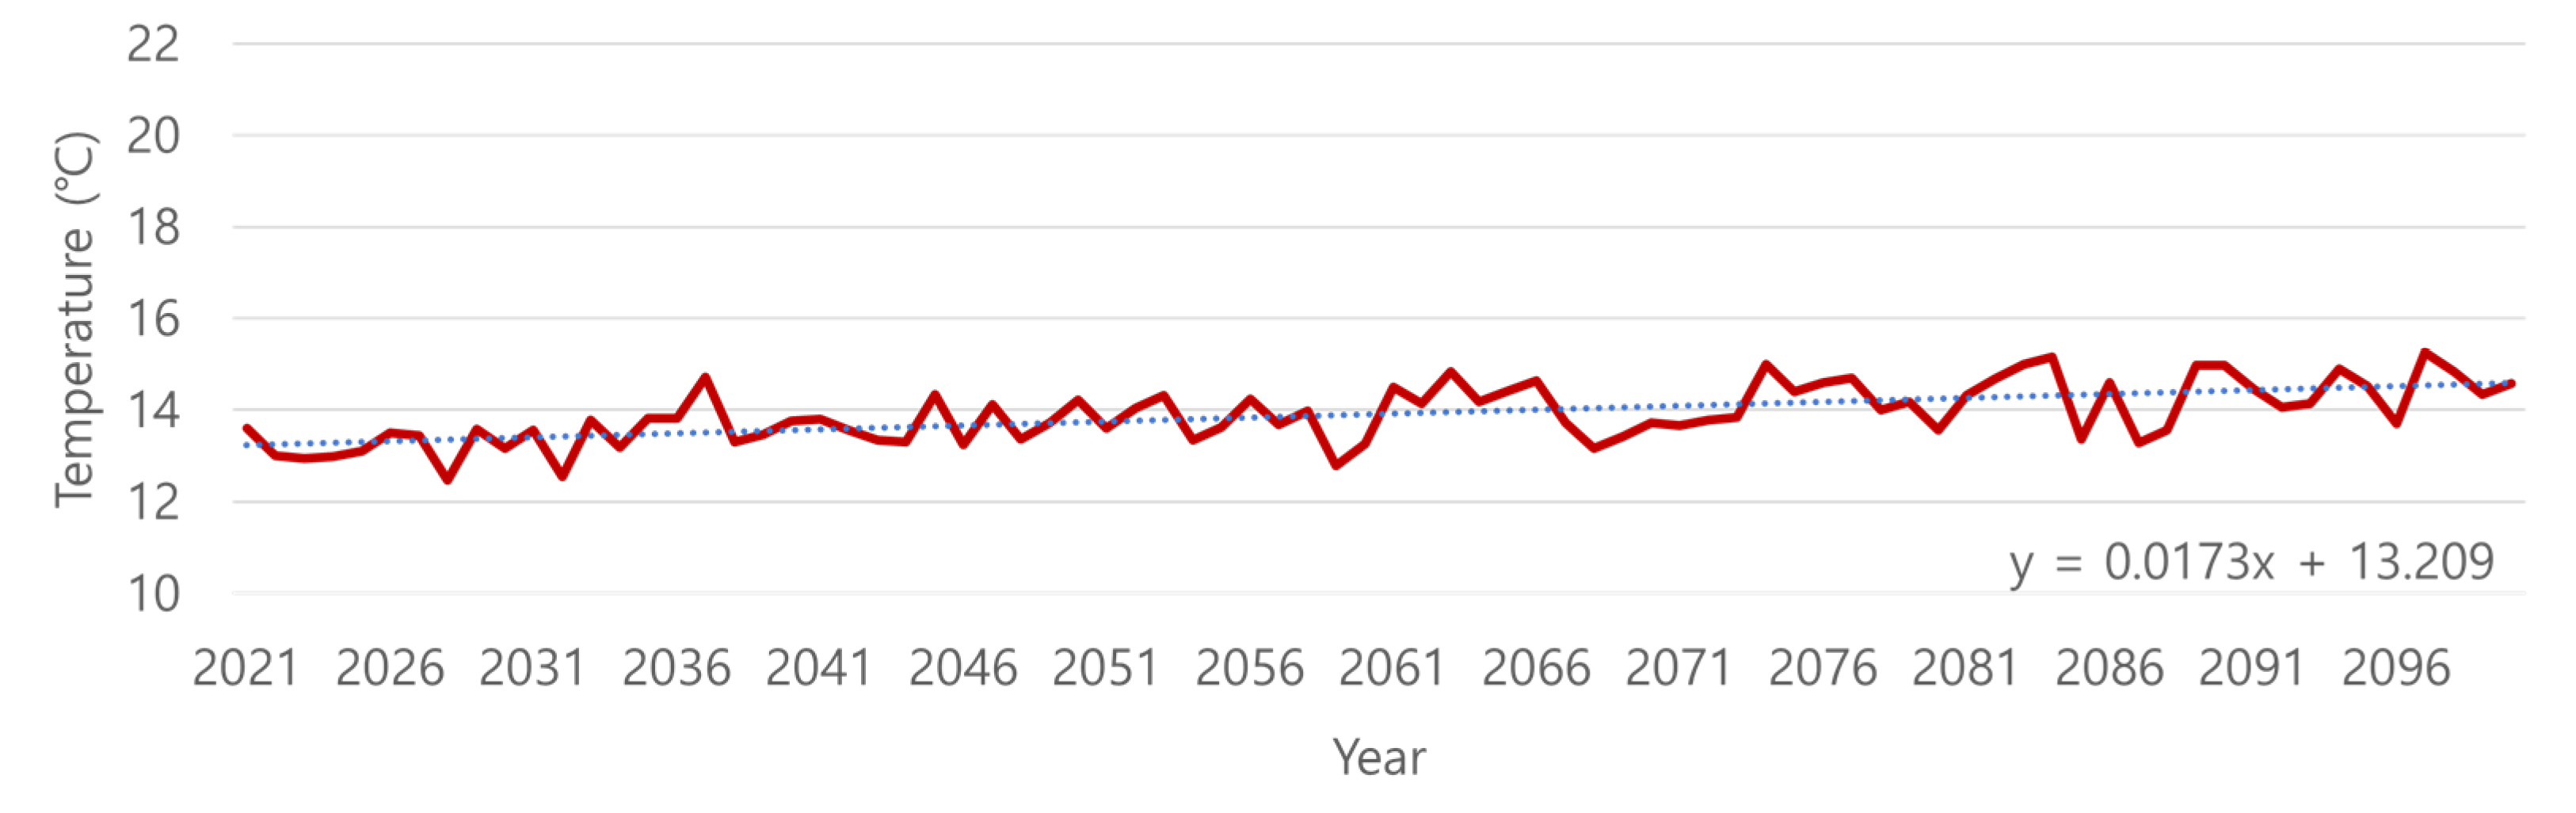
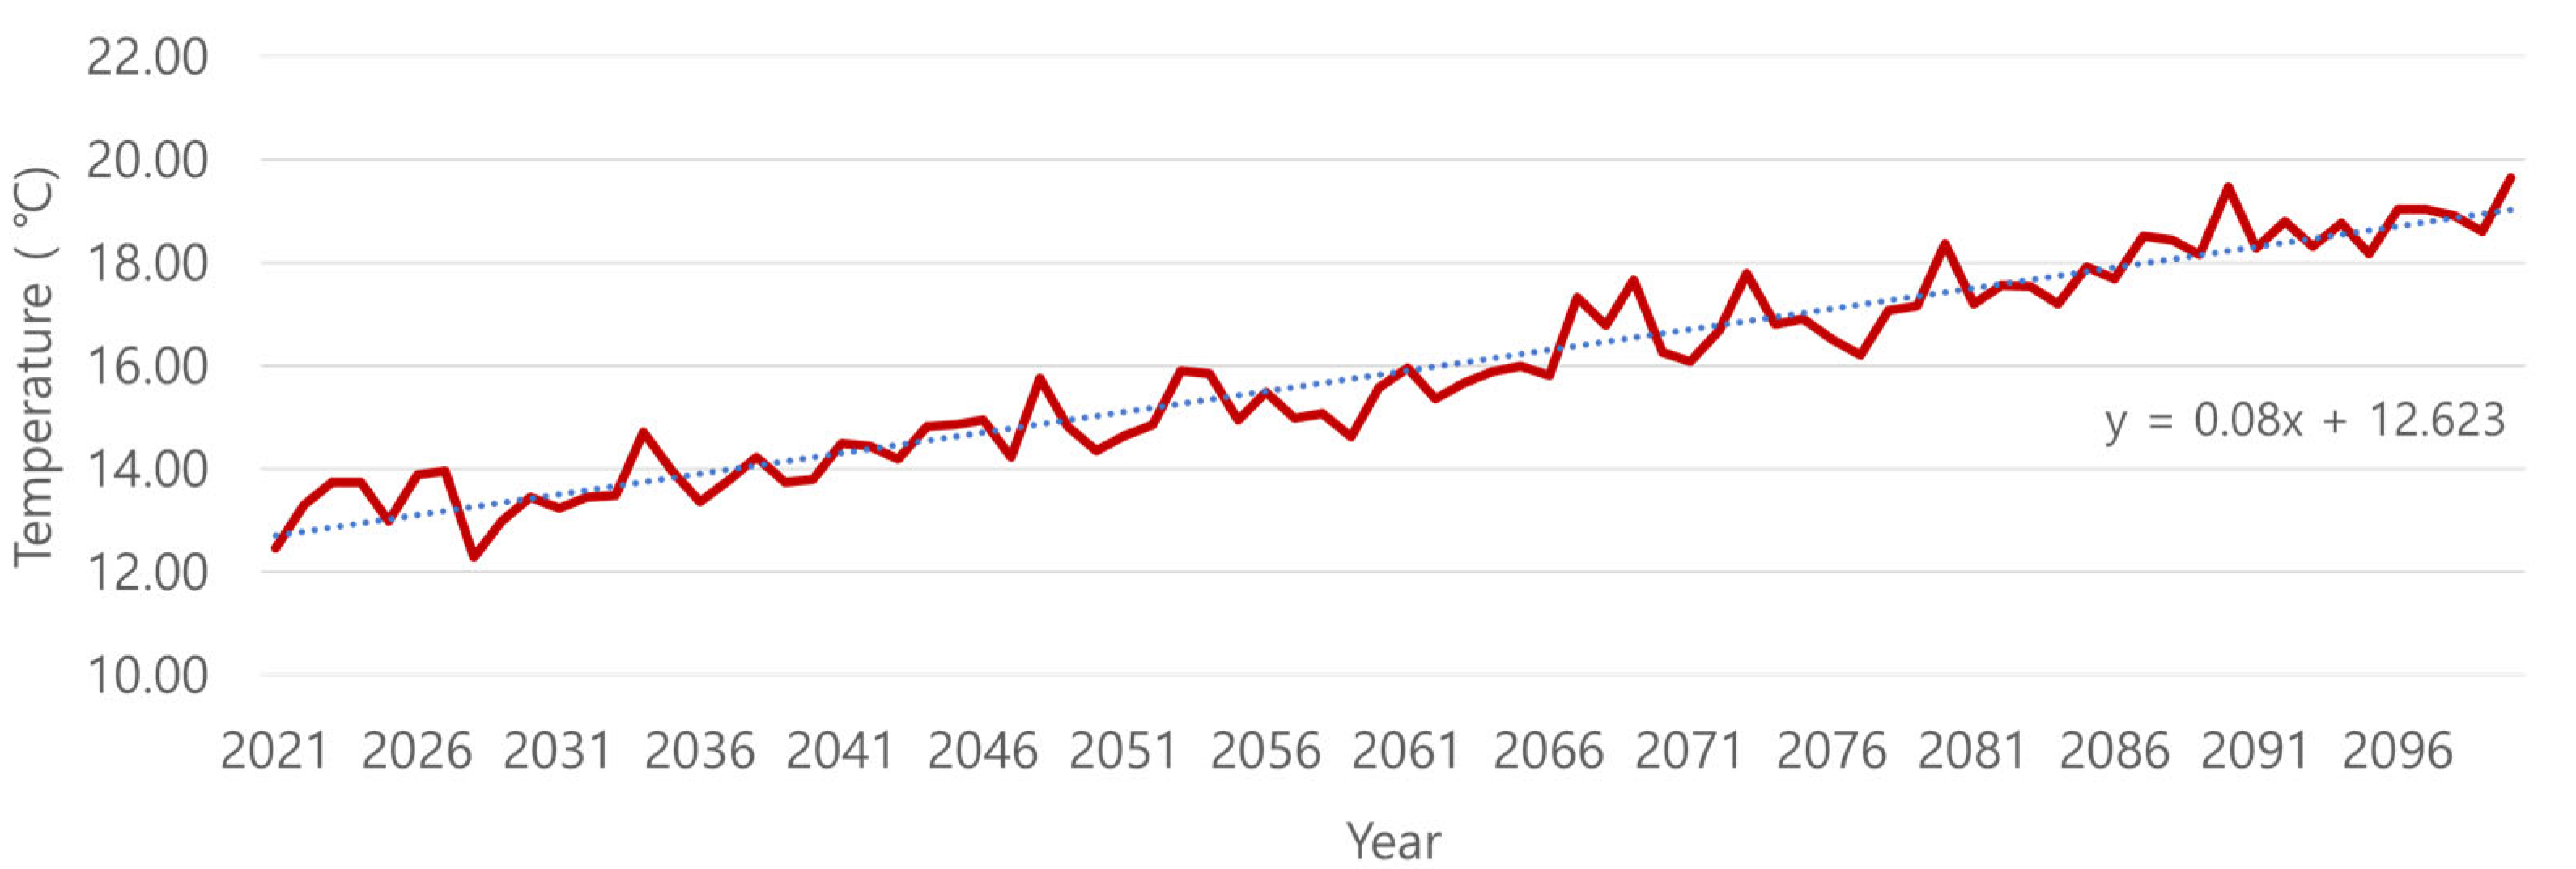
Figure 6 and
Figure 7 are graphs illustrating the average annual temperature in Korea for the SSP1-2.6 and SSP5-8.5 scenarios, respectively. In SSP1-2.6, the average annual temperatures increased slightly until 2100. The highest average annual temperature until 2100 was 15.26 °C in 2097, and the lowest average annual temperature was 12.46 °C in 2028. The standard deviation of the average annual precipitation under the SSP1-2.6 scenario was 0.64 °C. Furthermore, the standard deviation of the average annual temperature in the near-term, mid-term, and long-term future was 0.50 °C, 0.50 °C, and 0.56 °C, respectively. The standard deviation of the long-term future was the largest, and the slope of the trend line was 0.0173 °C.
In the SSP 5-8.5 scenario, the average annual temperature rose until 2100. By 2100, the highest temperature was recorded to be 16.66 °C in 2100, and the lowest temperature was 12.29 °C in 2028. In addition, the results of calculating the standard deviation of precipitation for near-term, mid-term, and long-term futures indicate that the average annual temperature difference becomes very severe as it proceeds into the distant future, with standard deviations of 0.57, 0.87, and 0.96, respectively, for near-term, mid-term, and long-term futures.
According to the Korea Meteorological Administration, the average annual temperature measured at 70 observation stations excluding Daegu, Jeonju, and Juam stations out of 73 observation stations (1990–2020) was 12.65 °C; however, in the SSP5-8.5 scenario, the long-term future average value of 70 observation stations was 18.1 °C, indicating that the average annual temperature increased by 5.55 °C. It was determined that this was within the Earth’s future temperature range predicted using SSP scenarios in the classification of
Table 1.
4. Calculation of Drought Indices and Analysis of Results
With increasing interest in climate change, interest in mitigating or adapting to climate change by predicting the future climate has also increased. Accordingly, research on the prediction and analysis of the future using climate change scenarios is active in various fields. In this study, the characteristics of future drought in South Korea were analyzed using a newly developed SSP scenario. We used the SSP1-2.6 scenario with the best mitigation and adaptation to climate change and the lowest solar radiation alongside the SSP5-8.5 scenario with the best adaptation to climate change and the highest solar radiation but with a low degree of mitigation. A total of 73 weather station points were selected as locations for calculating the drought index. The durations of both SPI and RDI were set to six months for calculation. In addition, 80 years were analyzed after dividing them into near-term future (2021–2040), mid-term future (2041–2070), and long-term future (2071–2100).
4.1. Comparative Analysis of SSP1-2.6 and SSP5-8.5 Scenarios
The average annual precipitation and temperature increased more in the SSP5-8.5 scenario than in the SSP1-2.6. Using these data, SPI and RDI were calculated, and the degree of drought was divided according to the drought classification criteria. To compare droughts according to the SSP1-2.6 and SSP5-8.5 scenarios, the number of droughts occurring at 73 observation points by 2100 was analyzed.
Table 3 presents the rate of increase or decrease in drought occurrence in the SSP5-8.5 scenario compared to the SSP1-2.6 scenario.
The total number of drought occurrences in the SPI and RDI slightly decreased in the SSP5-8.5 scenario. The number of “moderately dry” drought occurrences decreased by 20.09% and 16.14% for SPI and RDI, respectively, while the number of “severely dry” drought occurrences increased by 3.38% and 13.41% for SPI and RDI, respectively. However, the number of “extremely dry” droughts increased by 102.22% for SPI and 182.86% for RDI. This suggests that even if the number of drought occurrences is similar for each scenario, drought damage can become more severe.
Table 4 presents the average number of drought occurrences over time in the SSP1-2.6 scenario. This indicates the average number of drought occurrences by intensity during each period. These values represent average annual droughts.
In SPI, the average number of drought occurrences for all intensities decreased in the long-term. In RDI, the number of occurrences of “severely dry” and “extremely dry” droughts decreased toward the long-term future, but the number of “moderately dry” drought occurrences increased. In RDI, the average number of all drought occurrences decreased from 13.25 in the near-term future to 10.87 in the mid-term future, but it increased again to 12.9 in the long-term future.
Table 5 presents the average number of drought occurrences over time in SSP5-8.5. Both SPI and RDI indicated the least “moderately dry”, “severely dry”, and “extremely dry” droughts in the mid-term. In SPI, the average number of drought occurrences was 21.15, 6.67, and 7.7 in the near-term, mid-term, and long-term futures, respectively, indicating that drought is concentrated in the near-term future. In RDI, the average number of drought occurrences was 9.4, 6.4, and 19.73 in the near-term, mid-term, and long-term futures, respectively, indicating that the occurrence of drought increases in the long-term future.
4.2. Comparative Analysis of SPI and RDI
To compare droughts according to the SSP1-2.6 and SSP5-8.5, the number of droughts occurring at 73 observation points by 2100 was expressed as a time series.
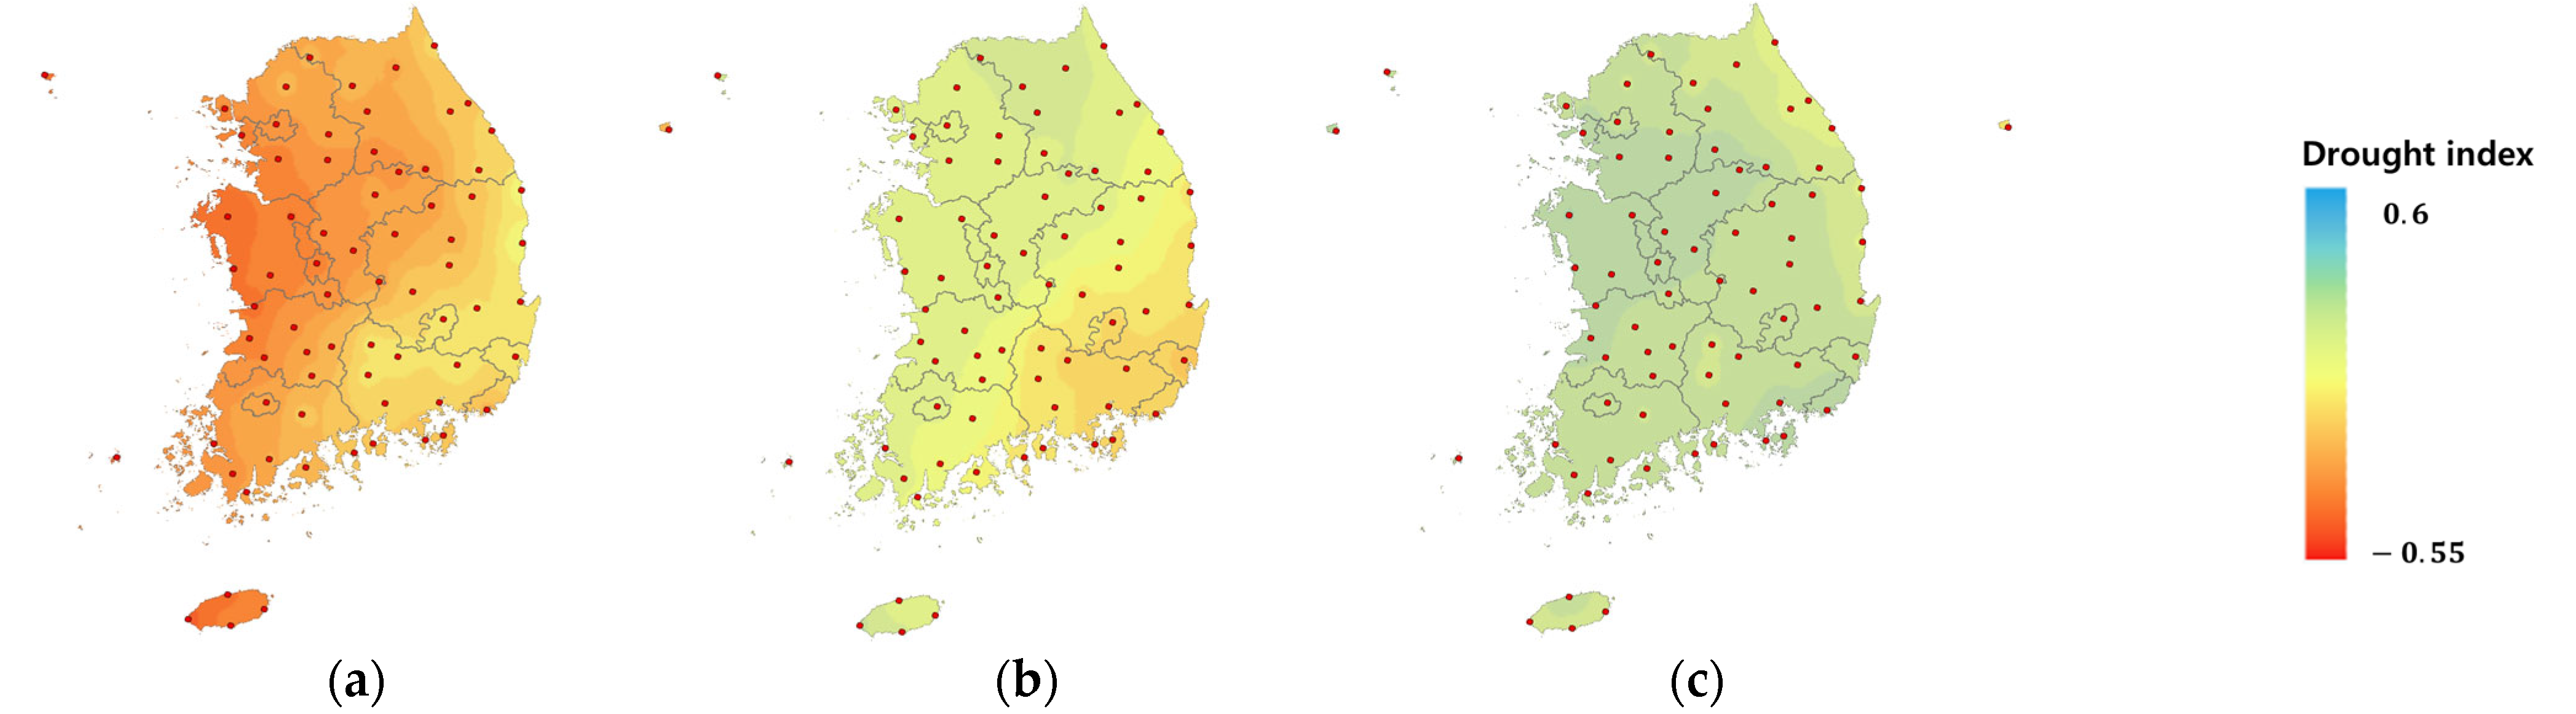
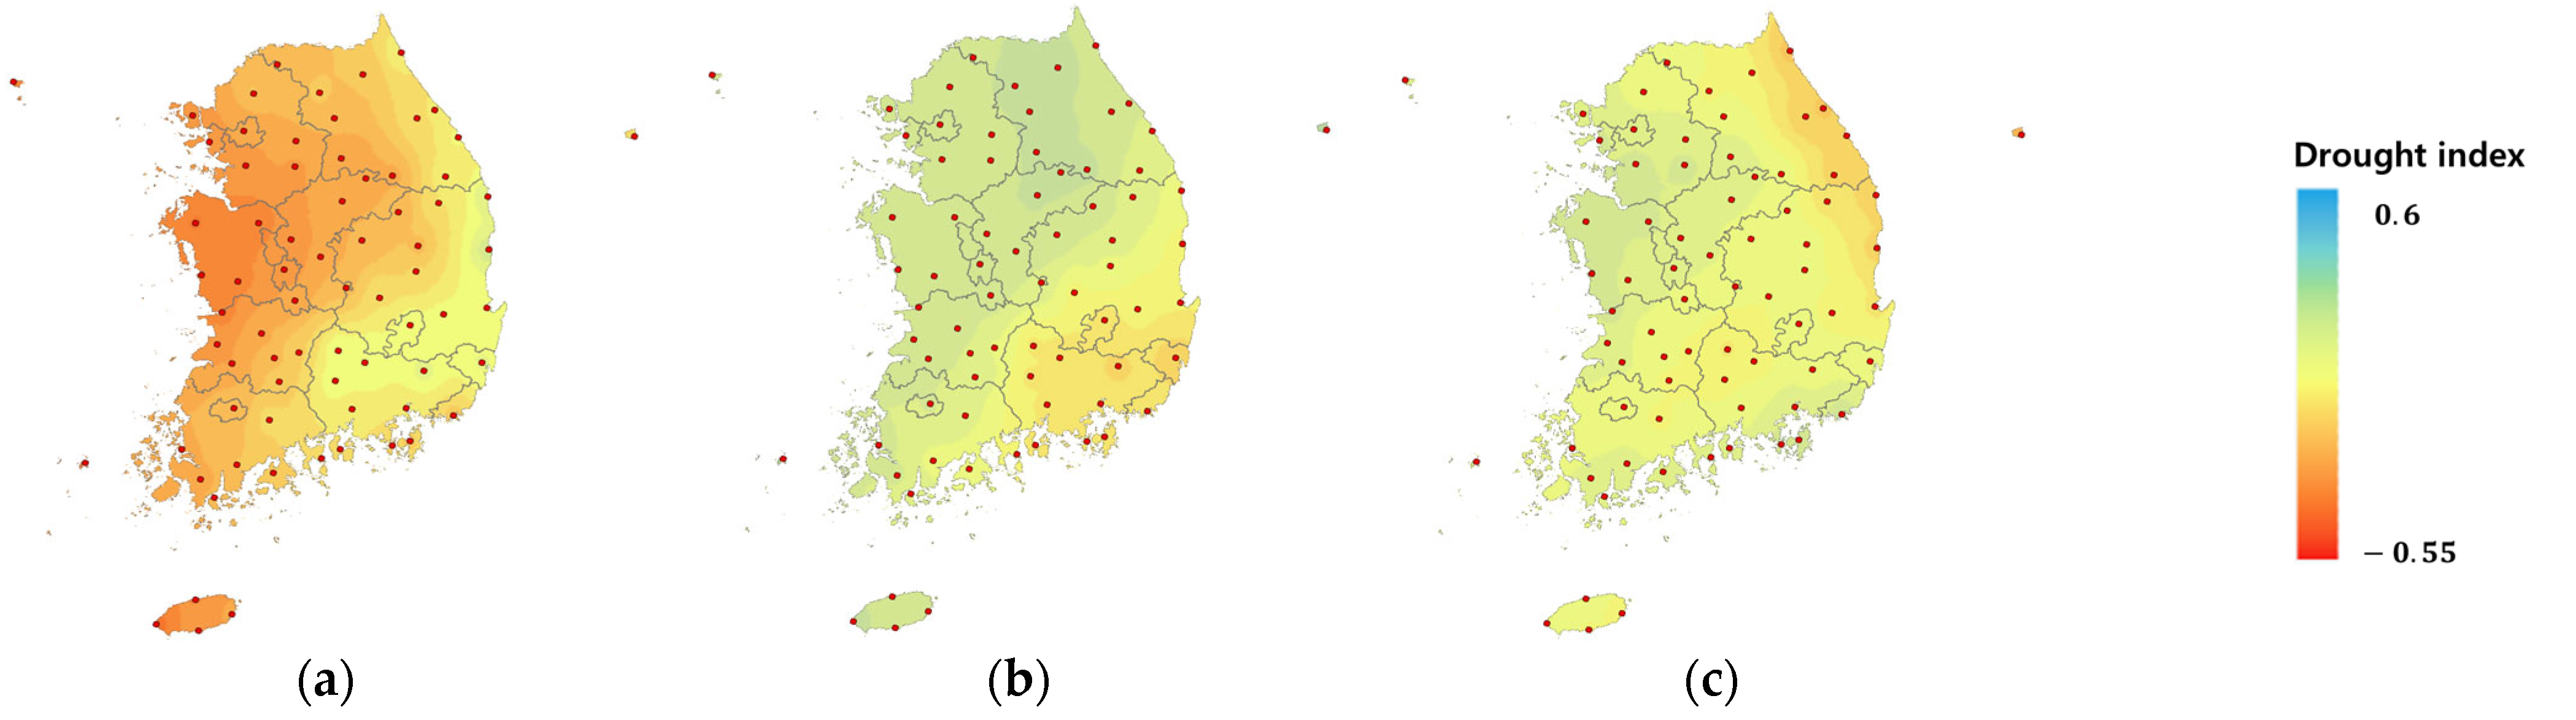
Figure 8 illustrates the average SPI by region by dividing the SSP1-2.6 scenario into near-term, mid-term, and long-term futures, and
Figure 9 illustrates = RDI. In the near future, SPI and RDI indicated lower drought indices for the West Sea region, including Seosan, alongside Jeju region, while Gyeongsangnam-do and Gyeongsangbuk-do, including Busan and Andong, had higher drought indices than the other regions. However, in the mid-term future, the SPI and RDI in some parts of Gyeongsangnam-do and Gyeongsangbuk-do were lower than those in the near-term future, while the drought index was higher in other regions. In the long-term future, both SPI and RDI in Gyeongsangbuk-do and Gyeongsangnam-do regions also increased, but the overall drought index in RDI decreased compared with the mid-term future. The drought index in the East Sea regions, such as Sokcho, Gangneung, Daegwallyeong, and Wonju, was lower than that in other regions. In the SSP1-2.6 scenario, SPI and RDI generally exhibited the same tendency, but SPI was more sensitive than RDI in the near-term future, whereas RDI appeared to be more sensitive than SPI in the long-term future.
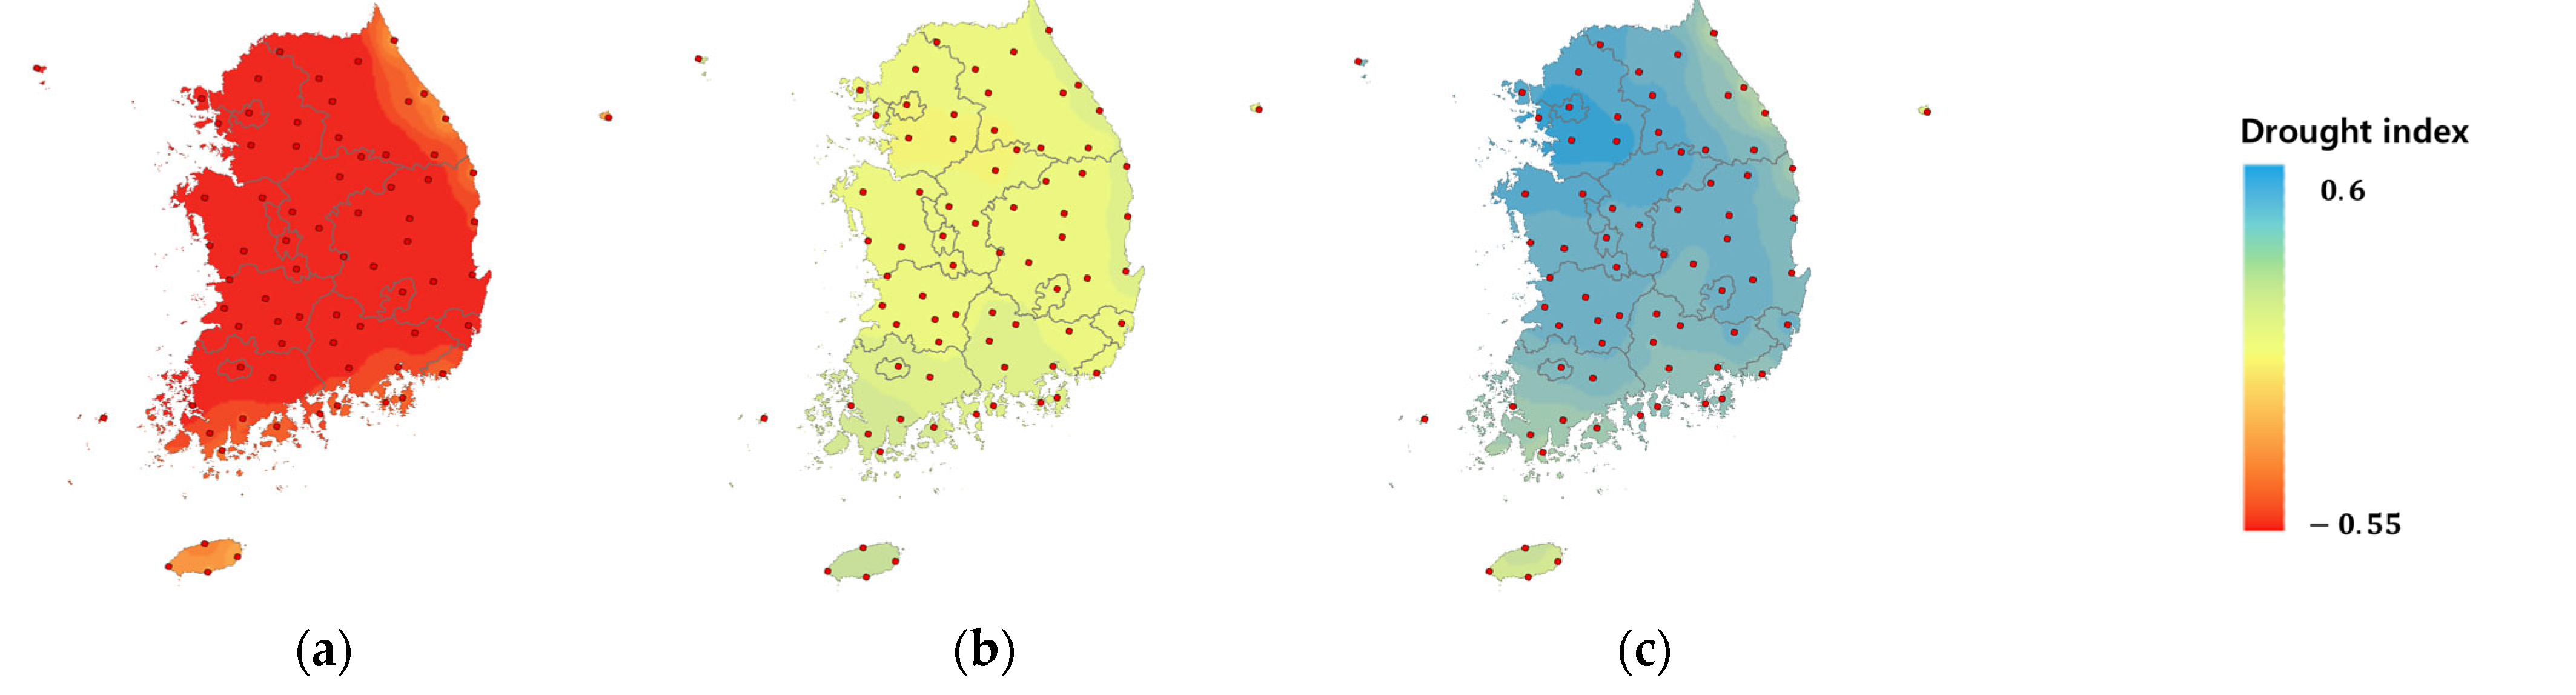
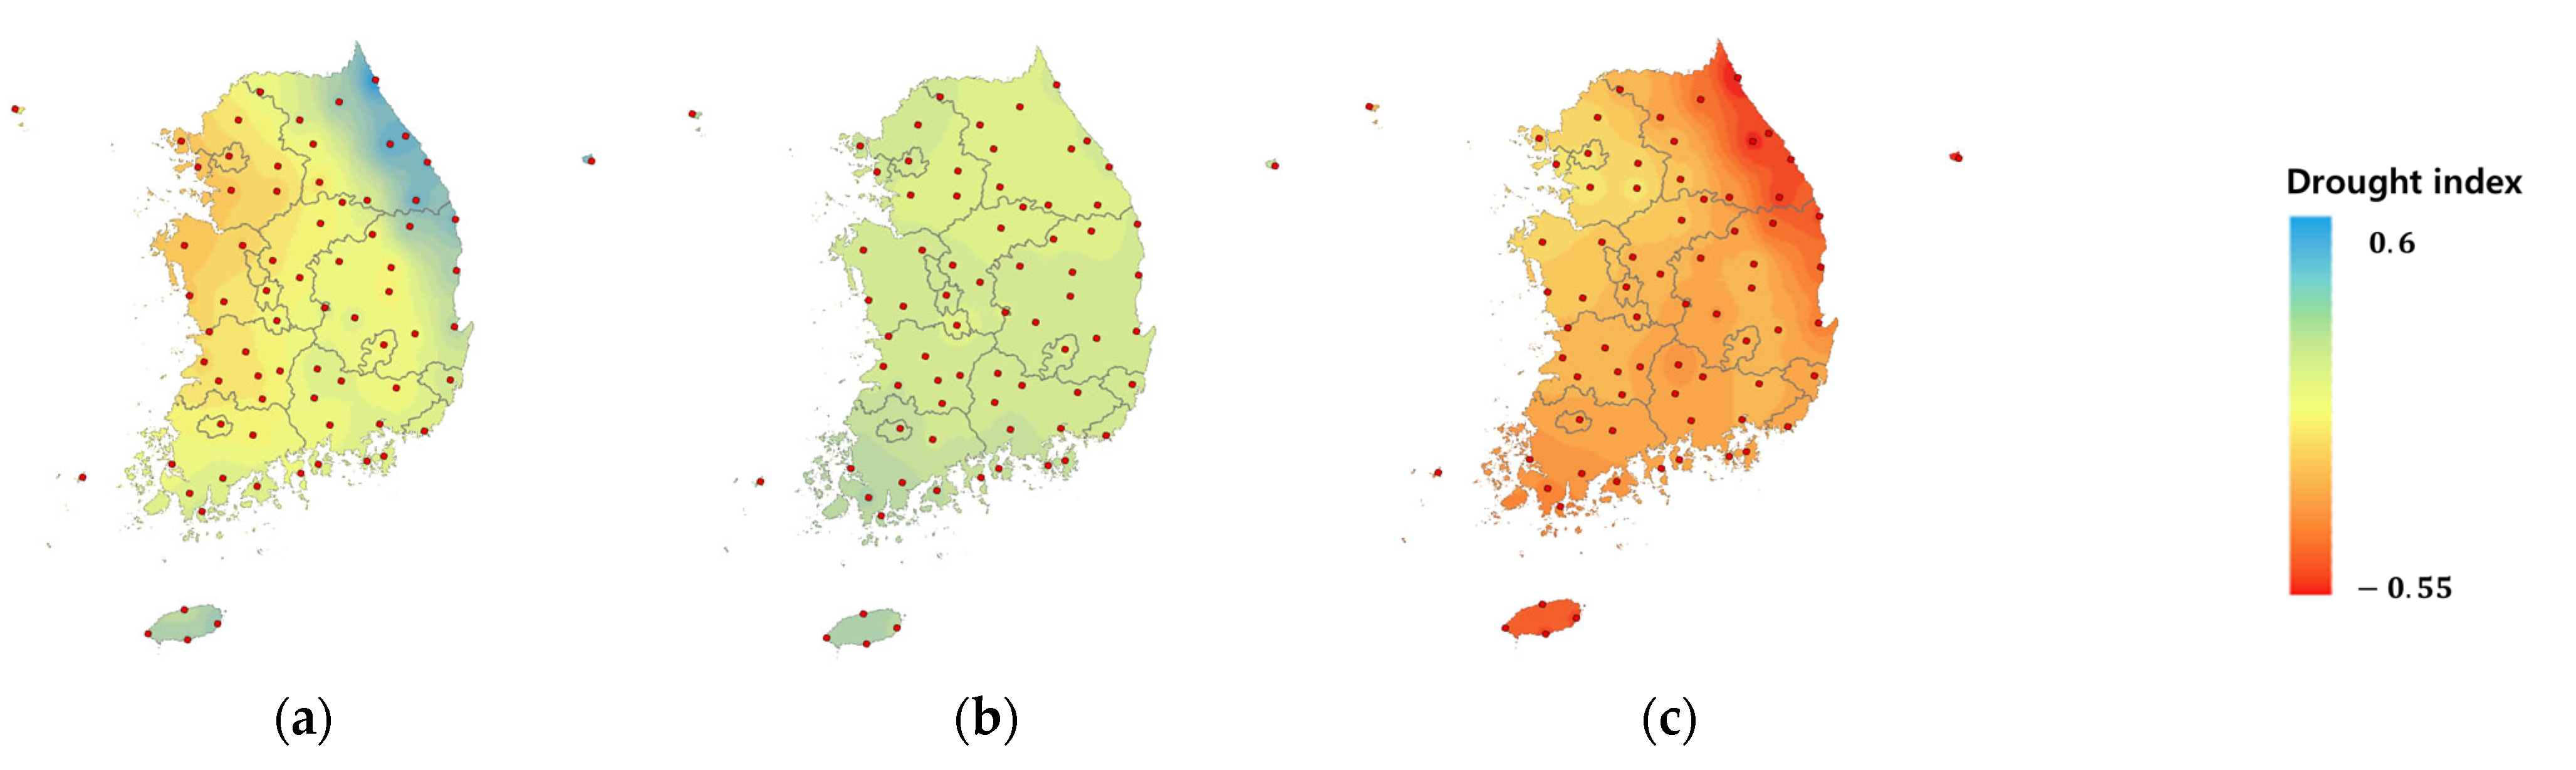
Figure 10 and
Figure 11 illustrate SPI and RDI by period on maps for the SSP5-8.5 scenarios. In the near future, SPI indicated that Gangwon, Jeju, and some regions located in the South Sea had a higher drought index than other regions and that all regions had normal condition. Since then, the overall drought index increased as it proceeded into the long-term future. However, Gangwon-do, Jeju-do, and some regions located in the South Sea became regions with the lowest drought index in the long-term future, as the drought index increase rate of these regions was less than that of other regions in the long-term future. In the near future, RDI indicated that the East Sea region had a high drought index and the West Sea region had a low drought index; hence, more droughts occurred in the West Sea region. As the long-term future progressed, the drought indices in the East and West Sea regions decreased and improved, respectively. The four measurement points on Jeju Island also had a relatively high drought index in the near-term and mid-term futures, but the drought index decreased sharply in the long-term. When comparing SPI and RDI, in SPI, the occurrence of drought decreased in the entire region as it proceeded into the long-term future, while in RDI, the occurrence of drought generally increased in the long-term future. However, it can be observed that the tendency of the drought index to change in the entire region is the same, with the drought index worsening in Jeju and Gangwon regions compared to other regions as the long-term future progresses.
5. Discussions
This study investigated the domestic drought index in SSP1-2.6 and SSP5-8.5 scenarios. In
Section 4.1, droughts by scenario were analyzed, and in
Section 4.2, regional differences were analyzed by examining the distribution of SPI and RDI. The 80-year future was analyzed by dividing it into near-term (2021–2040) future, mid-term future (2041–2070), and long-term future (2071–2100).
In the past, the representative climate change scenario used for hydrological analysis was the RCP scenario proposed in IPCC’s AR5, which was used for a variety of drought analyses. In this research, the SSP scenario presented in IPCC’s AR6 was used for drought index analysis. Results of comparison with RCP-based drought index research made in Korea are as follows.
Jang (2018) calculated SPI and RDI drought indices from 2011 to 2100 using the RCP 8.5 scenario [
20]. In RCP 8.5-based research, the short-term (2011–2040) forecast was, overall, wetter for SPI than for RDI. In the mid- (2041–2070) and long- (2071–2100) terms, RDI was drier than SPI on average, and that difference only increased over time. In this research, drought index calculation results and their temporal variation characteristics in the short-, mid-, and long-term based on the SSP5-8.5 scenario were found to be the same as in preceding RCP-based research studies. Shortly, SPI was drier in the short-term, whereas RDI was drier in the long-term.
Results of applying the SSP1-2.6 scenario showed that although RDI clearly appeared to get drier than SPI in the long-term, the difference was smaller than in the SSP5-8.5 scenario. As in the RCP scenario, considering the effects of evapotranspiration, RDI was found to be drier than SPI in the SSP scenario too. In particular, SSP5-8.5 showed a bigger difference in the short-, mid-, and long-term drought index results than SSP1-2.6. Moreover, in Korea, in both scenarios, it was observed that RDI, which considers evapotranspiration effects, shows a bigger difference than SPI.
In the case of SSP5-8.5, since the average temperature increases more sharply than SSP1-2.6 as it proceeds closer to 2100, drought indices were affected by evapotranspiration effects and showed the same tendency as preceding RCP5-8.5-based research. As shown in the SSP1-2.6 scenario, the more CO2 reduction is relatively expected in the scenario, droughts are less expected to happen due to the suppression of temperature increases.
6. Conclusions
In this research study, long-term drought indices in Korea were predicted using SSP1-2.6 and SSP5-8.5 scenarios. The conclusions drawn are as follows.
The results of calculating drought indices in the short-, mid-, and long-term until 2100 predicted that, in both the SSP1-2.6 and 8.5 scenarios, the “Moderately Dry” weather will occur frequently. In the case of SPI, the frequency of occurrence is high in the near term and high in the long-term in RDI.
When comparing the drought indices of SSP1-2.6 and SSP5-8.5, it was observed that the frequency of occurrence of the “Extremely dry” weather in both SPI and RDI was higher in SSP5-8.5 than in SSP1-2.6. In particular, RDI increased by 183%, which predicts frequent extreme droughts according to future climate change scenarios.
The SSP5-8.5 scenario showed a higher tendency for precipitation and temperature increases in the long-term than SSP1-2.6. Despite this tendency for precipitations to increase, it was found that droughts might also occur frequently in the long-term according to evapotranspiration effects caused by temperature increases.
Results of analyzing SPI and RDI indices over time in the form of distribution charts revealed that drought tendencies in the short-, mid- and long-term were all different. According to both SPI and RDI indices, the frequency of occurrence of droughts was relatively high in west areas in the short-term, southeast areas in the mid-term, and northeast areas in the long-term.
Owing to the uncertainty in climate change data, it is not guaranteed that the droughts suggested in this study will occur in the future. This study is useful for presenting future drought trends using SSP scenarios and for considering drought prevention measures. In addition, to present the possibility of various droughts, research must be conducted to predict future droughts in South Korea by using more realistic SSP scenario pathways or other analytical methods.


