1. Introduction
The coastal zones can be found near the interface between sea and land, being well known for the opportunities they provide, this being the case for abundant energy resources, job opportunities or tourism activities. Approximately 50% of the global population is concentrated on a strip of land 200 km from the shoreline, making these regions among the most productive areas [
1]. The enclosed seas are defined by particular features, this also being the case for the Black Sea. The Romanian nearshore at the Black Sea with 256 km of coastlines covers 5% of the entire sea. Although this sector can be considered to be relatively small compared to other regions (ex: Turkey 1700 km), this is defined by important features such as the presence of the only biosphere delta in the world, namely the Danube Delta [
2]. The gas resources from the Black Sea are comparable to the ones from the North Sea, and as a consequence by the end of 2026 a more active engagement of Romania in this sector is expected, projected to extract around 10 billion cubic meters per year, which will cover at least 8% of the internal annual consumption [
3]. The Romanian coastal waters are defined by multiple maritime routes that connect the local ports to the regions from Bulgaria, Ukraine or Bosporus strait. It is estimated that this traffic covers almost 40% from the entire Black Sea activities, Constanta Port being one of the busiest ports in Europe (fifth position) in terms of the cargo activities [
4].
On the other hand, the south-eastern part of Romanian land provides suitable conditions for the implementation of the wind farms starting from Galati County, going down to the Tulcea and the Dobrogea region (near the sea). This is not a surprise, taking into account that Dobrogea is considered to be the second most promising area in terms of the wind potential from Europe, where the annual average wind speed can easily reach 9 m/s. The wind sector from Romania is very dynamic, starting with only 14 MW in 2009 reaching 462 MW in 2010 and 2594 MW in 2014 [
5]. For the year 2020, the wind energy sector has had an installed capacity of 3029 MW, that covered almost 12% of Romania’s electricity needs. Nevertheless, it is expected that this contribution will raise to almost 35% by the end of 2030 [
6]. Definitely, from this region we can mention the Cogealac-Fântânele wind farm which with an approximate investment of EUR 1.1 billion and a capacity of 600 MW (120 turbines) is one of the most important projects in Europe. With an energy production of 255,970 MW/h in 2010, the operating company reached an important step, obtaining with this project a total share of 35.50% from all the Romanian’s green certificates [
7].
Nevertheless, in the long term, the offshore areas seem to be more promising in terms of the wind energy potential. From a technical point of view, the capacity factor of the newly developed offshore wind farms is now in the range of 35–55%, compared to a maximum 35% resulted for the similar projects developed on land. Additionally, in the Green Deal agreement promoted by the European Union, offshore wind is considered a major pillar, expected to reach an installed capacity of 60 GW and 300 GW by the years 2030 and 2050, respectively [
8]. In the entire Black Sea area, the northwestern part presents more interest for the offshore wind sector since it is defined by more energetic wind resources. During the winter time, this area is defined by an average wind power of 823.4 W/m
2 (historical data) that may easily increase up to 857.2 W/m
2 in the near future (2021–2050) [
9]. These results confirm the previous studies in which the western part of this sea was highlighted as an important source of wind and wave energy [
10]. The reanalysis of wind data is frequently used to assess the wind conditions, from a meteorological or renewable energy point of view. From the analysis of the Romanian coastal area, according to the ERA5 wind data (
U100) it is clear that the wind conditions gradually increase from land (ex: Tulcea) to the sea. In fact, there is a clear distinction between the onshore and offshore wind distribution, the latter indicating much higher values that can go up to 8.76 m/s during the wintertime. It was also indicated that the wind speed starts to stabilize or to slightly decrease as we reach the eastern boundary of the Romanian exclusive economic zone, located at 180–260 km from the shoreline [
11]. From the comparison of the ERA5 data with the in situ measurements, it was found that the reanalysis data underestimate the land wind conditions by at least 11%, this bias increasing as we go to the shoreline [
12]. The implementation of an offshore wind farm may have a positive impact in this area, this being the case of the port of Constanta where the pollution emissions associated with the berth time may be partially reduced throughout a cold ironing project [
4].
In this context, the main objective of the present work is to highlight the wind variations of a coastal area located near the Danube Delta by using different sources of data and the expected influence on a generic wind turbine performance. Since some in situ measurements will be used, as a secondary objective, the accuracy of the reanalysis datasets will be discussed on a general level by considering various time scales.
2. Materials and Methods
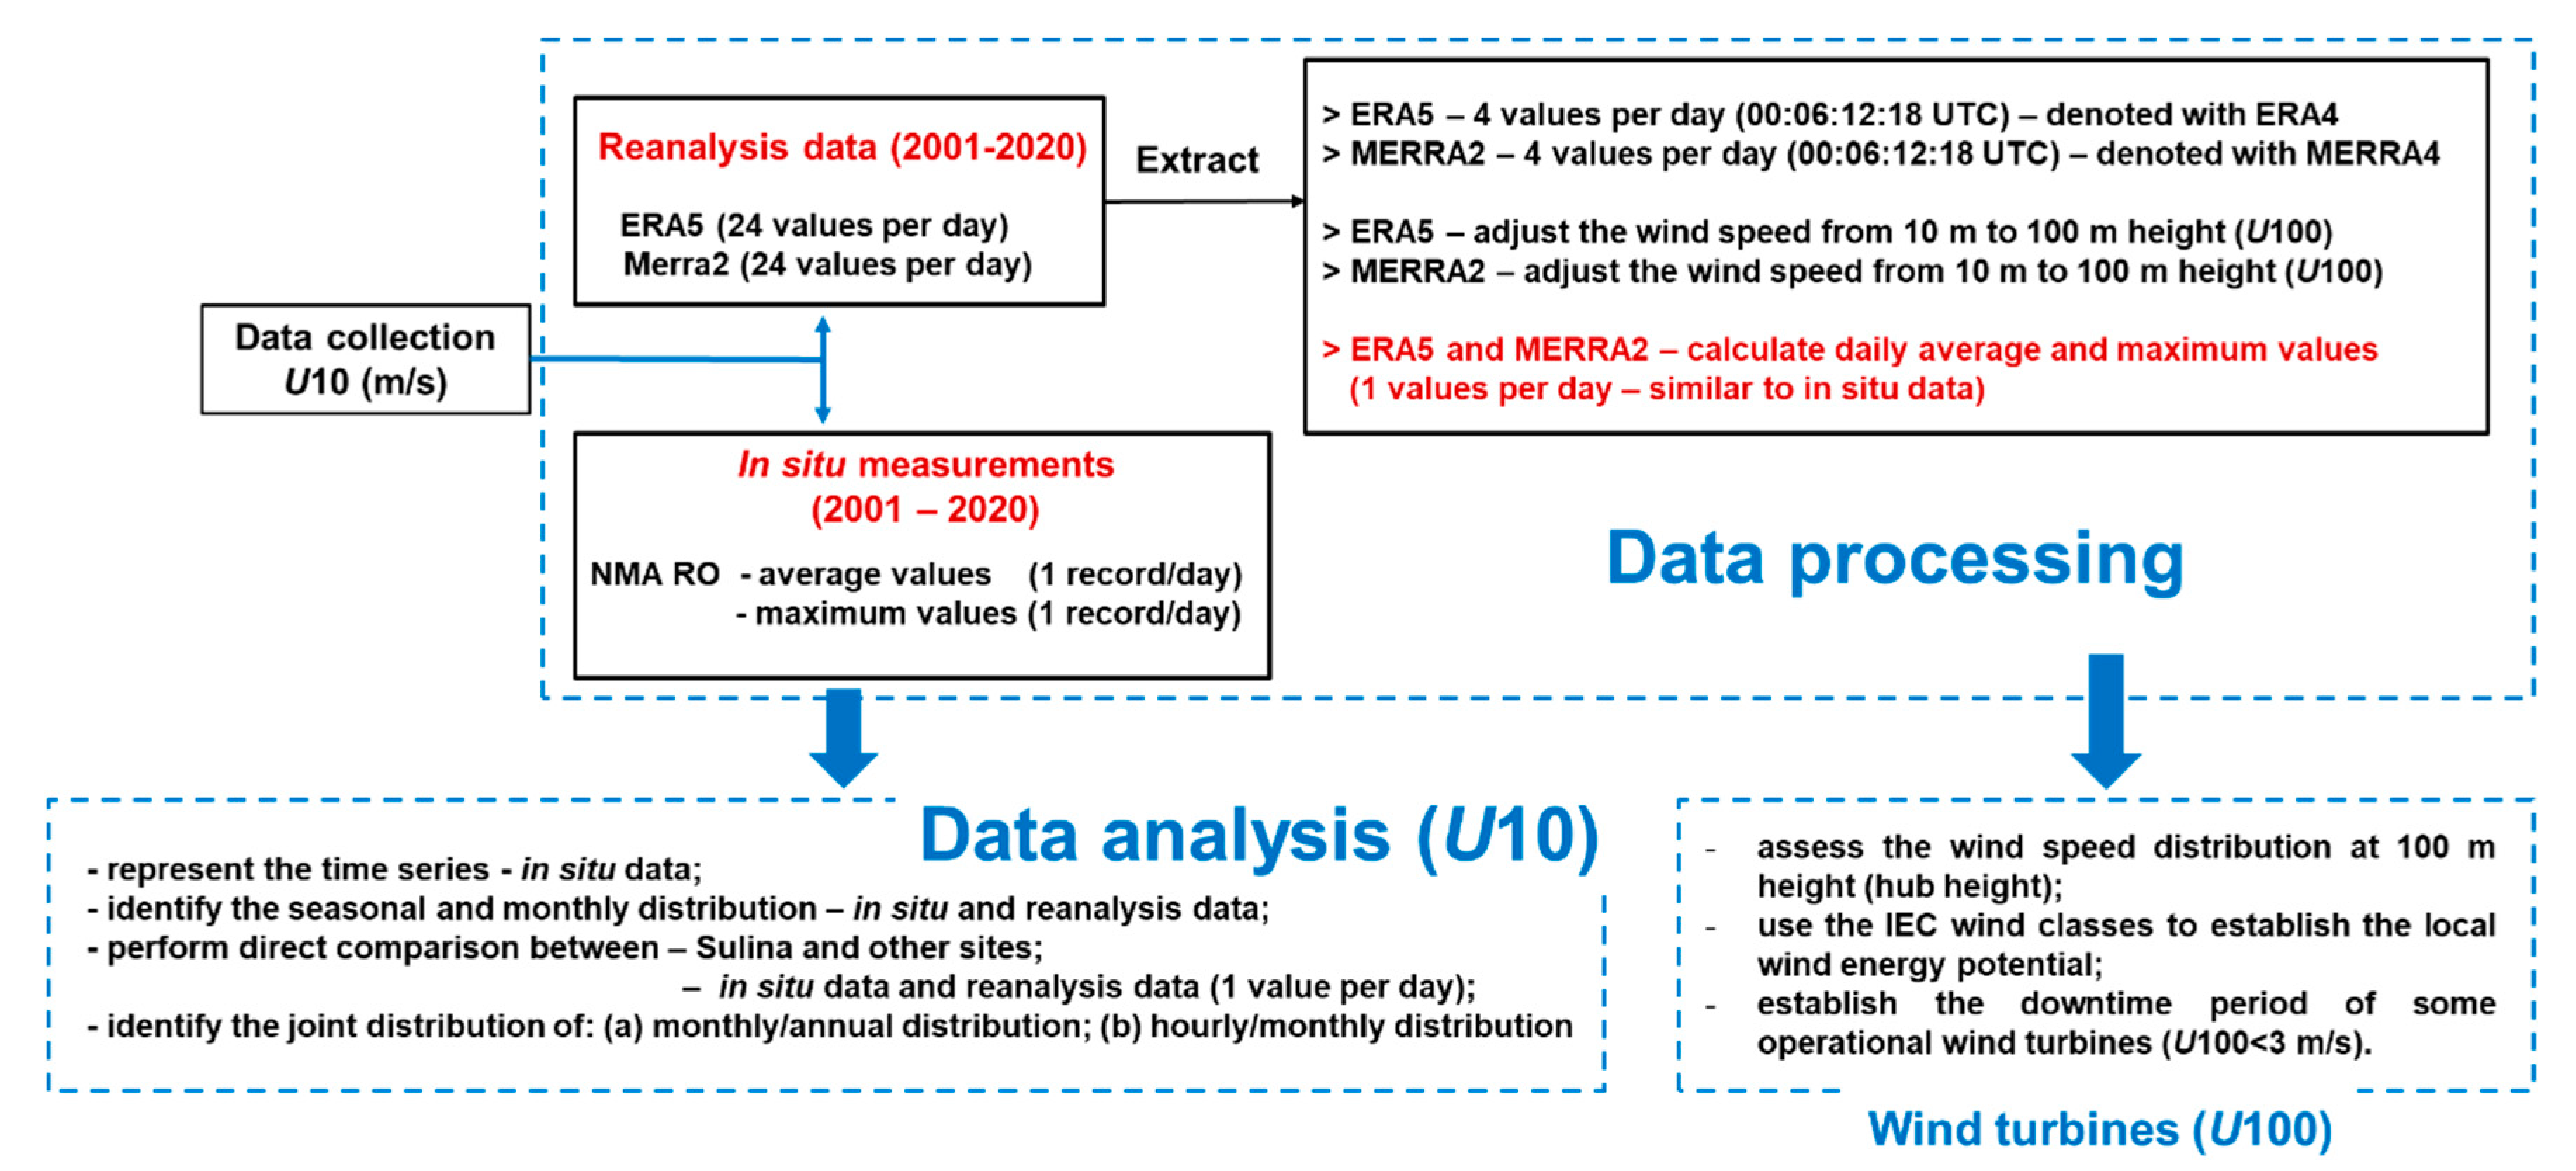
Figure 1 presents the general structure of the present work, while in
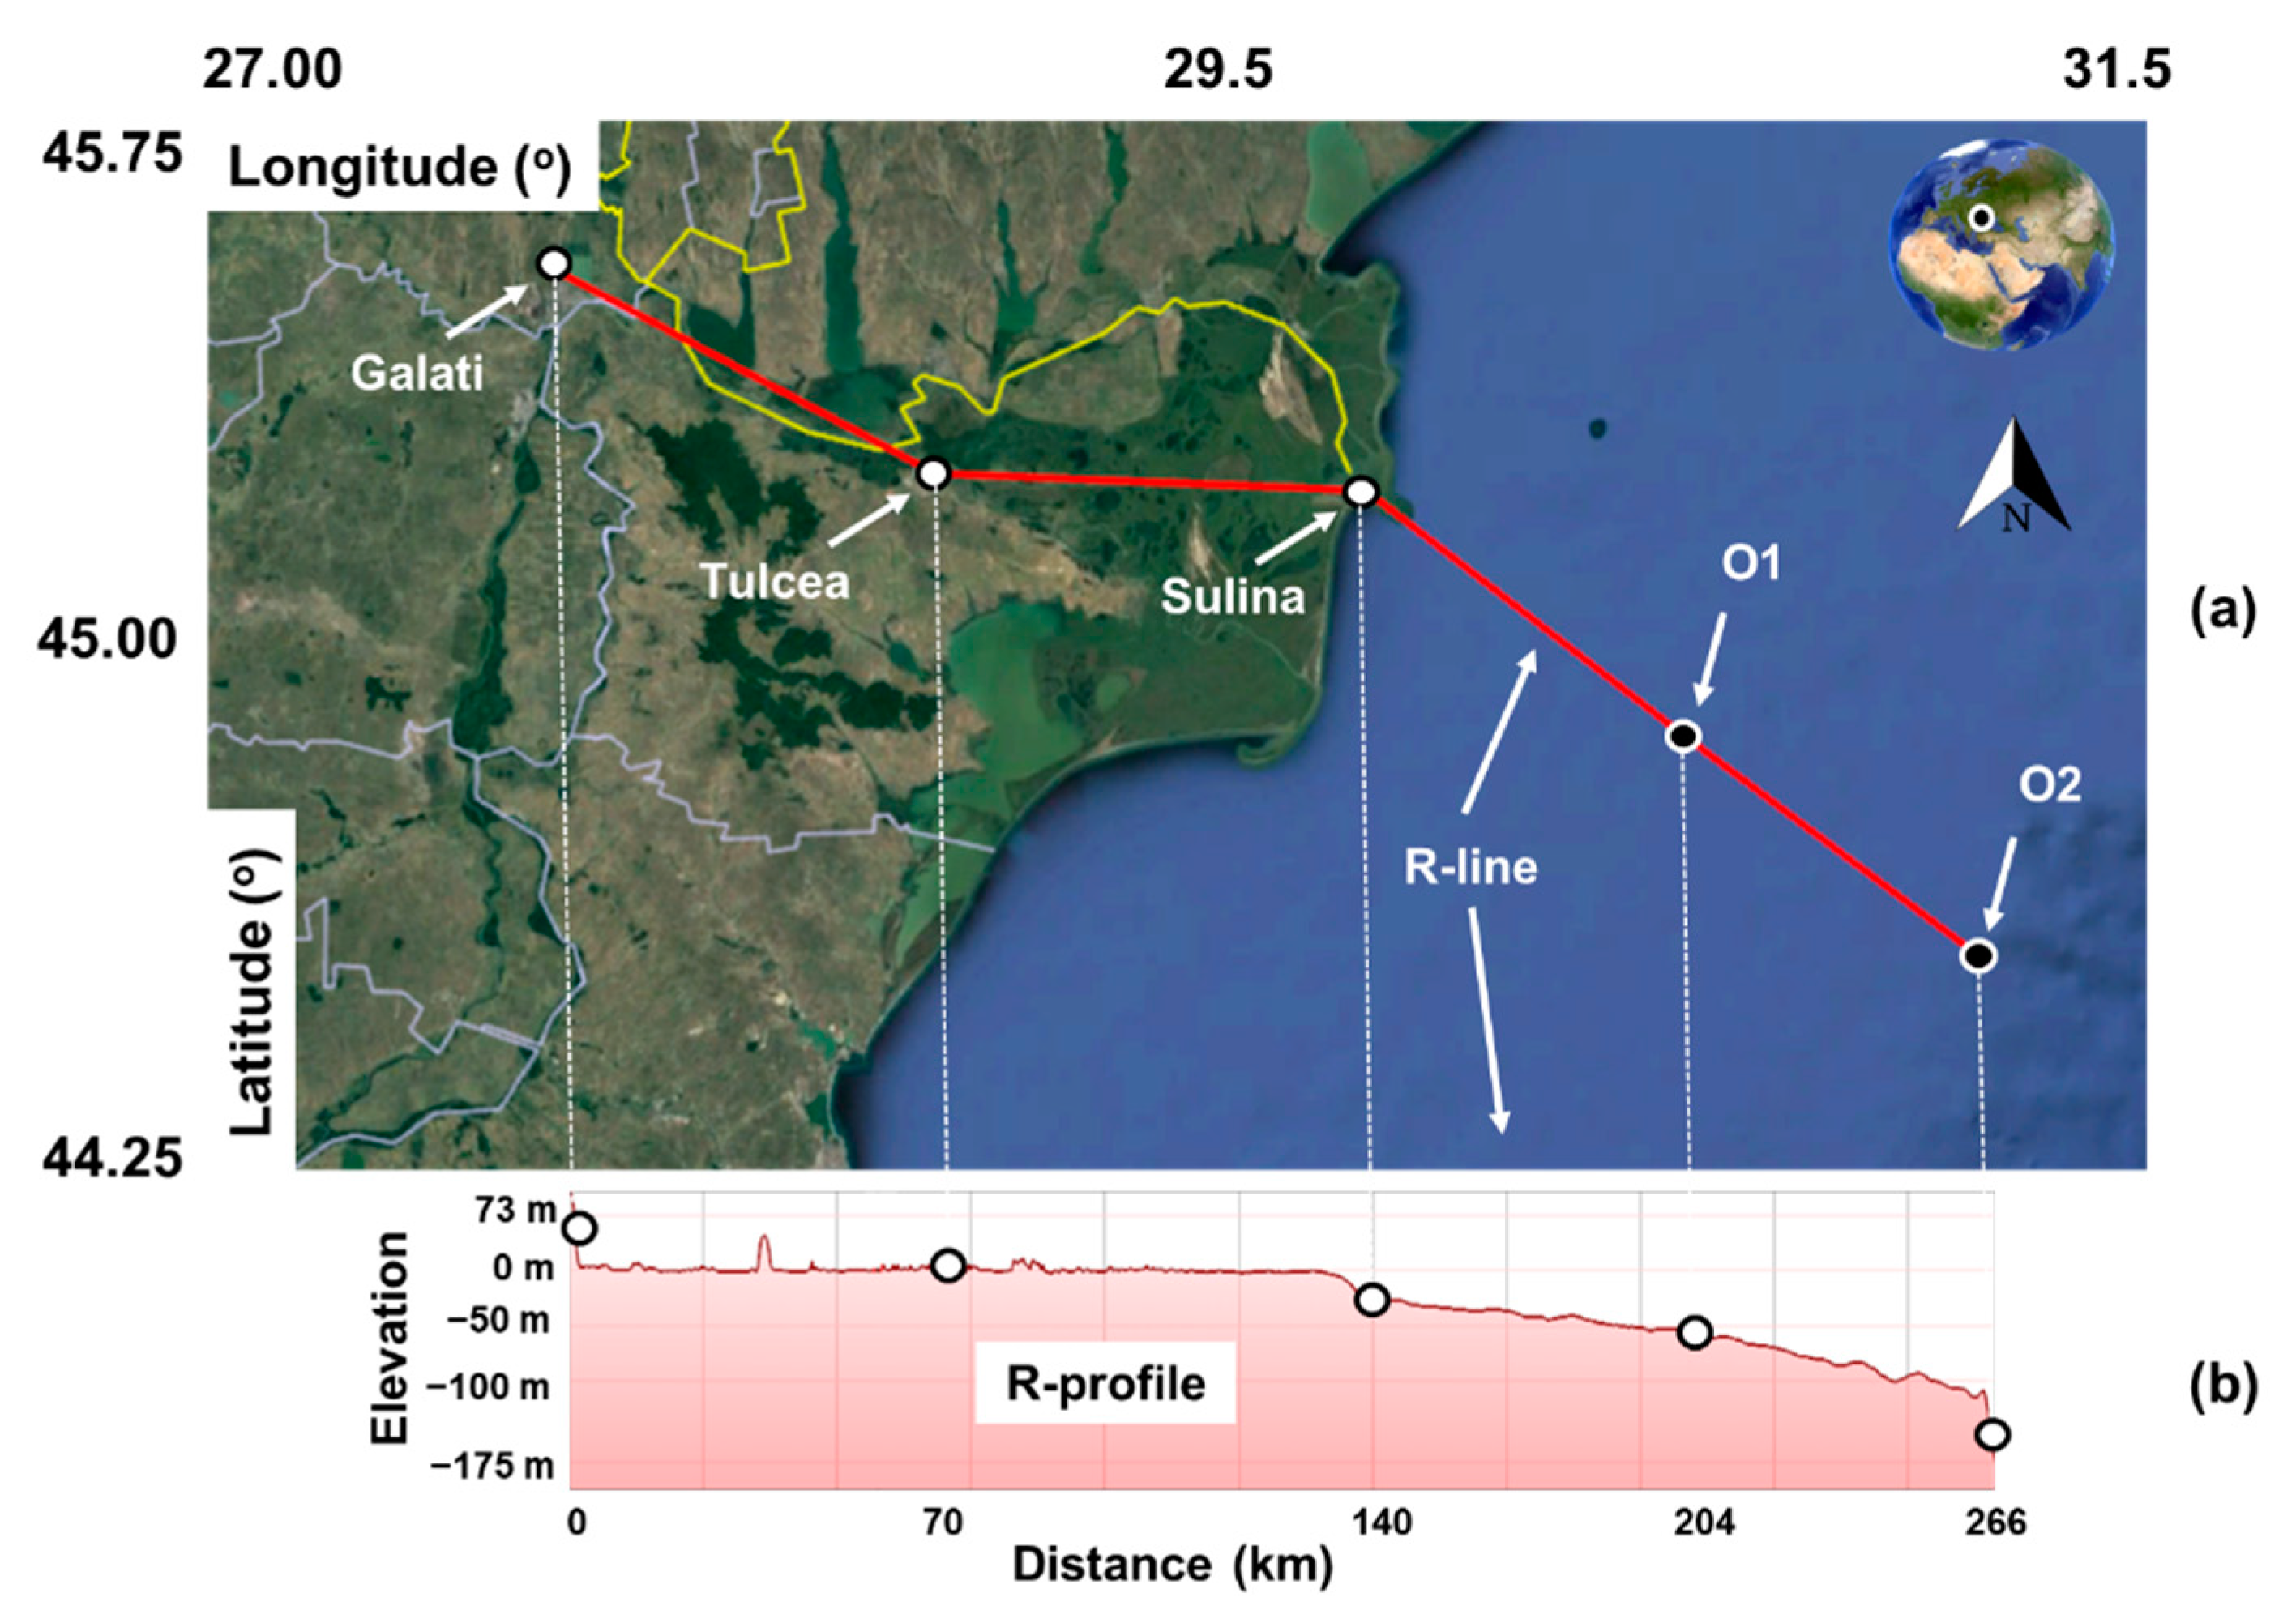
Figure 2 the target area is highlighted. This covers the northeastern part of Romania, more precisely the Galati-Tulcea region and also the offshore area located in front of the Danube Delta. The wind profile characteristics of this environment will be evaluated by considering several reference points located onshore (Galati, Tulcea and Sulina) and also by adding two points from the offshore area (O1 and O2). In
Table 1 and
Figure 2b, more details regarding these points are presented, that goes from an altitude of 72 m (Galati site) to a water depth of 171 m (O2 site). Compared to the Sulina site (located near the shoreline), the O2 site is located at a distance of 126 km, being exceeded by the Galati site with 140 km.
Several datasets will be considered in the present work, as it can be seen from
Table 2. For the sites located onshore (Galati, Tulcea and Sulina), the primarily source of data is related to the in situ measurements, corresponding to the wind speed registered at a height of 10 m (further denoted with
U10). These measurements are provided by the National Meteorological Administration of Romania [
13], covering a 20-year time interval (January 2001–December 2020) of average and maximum values (1 value per day). From a preliminary analysis of these time series, it was noticed that there are no gaps or missing values. At this point, it has to be highlighted that from the knowledge of the authors, this is the first scientific paper in which the accuracy of various reanalysis wind databases processed for this environment is discussed by making a direct comparison with in situ measurements (time series).
The reanalysis datasets are frequently used to assess the wind conditions from both a meteorological and a renewable energy project point of view, in particular for the Black Sea area where the in situ measurements are limited [
14,
15,
16]. One of these datasets is ERA5 that is produced by the European Centre for Medium-Range Weather Forecasts (ECMWF), being considered an improved version of the ERA-Interim project that ended in 2019. This hourly dataset has a global coverage, which includes multiple variables related to the oceanic, land and atmospheric parameters. The existing historical observations are introduced into a numerical model by using a data assimilation system, being possible to create in this way a grid that covers the entire Earth on a spatial resolution of 30 km (≈0.25°), which is structured on 137 levels starting from the surface to a height of 80 km [
17]. Although ERA5 covers the period from 1979 and is continuously expanding, for the present work only the interval from January 2001 to December 2020 was considered, in order to match the same period covered by the in situ observations available for the land sites (ex: Galati).
The main ERA5 dataset is defined by 24 values per day (also denoted with ERA24), from which a sub-dataset of 4 values per day (00:06:12:18 UTC) was extracted, which will be indicated as ERA4. In order to reduce the computational demand, a common way to assess the marine resources on a longer term period (ex: climatological) is to use only four values per day reported at these particular time intervals [
18]. Since this work involves in situ observations, this represents a good opportunity to assess the accuracy of the reanalysis dataset for various scenarios (4 values and 24 values). Regardless of the scenario considered for comparison, the reanalysis data were pre-processed in order to obtain daily values of average and maximum wind speeds (one value per day—similar to in situ).
The MERRA-2 (Modern-Era Retrospective analysis for Research and Applications, Version 2) is the second reanalysis wind data considered in this work. This is produced by the NASA’s Global Modeling and Assimilation Office (GMAO), based on a model that involves a cubed-sphere horizontal discretization defined by a spatial resolution of 0.5° × 0.625° and 72 levels from the surface to 0.01 hPa. Several wind observation sources are considered for this project from which we can mention the wind vectors from the operational satellites ASCAT and WindSat. More details related to this project can be found in Gelaro et al. [
19]. MERRA-2 is frequently used to assess the wind resources [
20,
21] being estimated and in some cases could indicate much higher wind conditions compared to in situ observations [
22]. For the Black Sea area, this dataset was previously used to only evaluate the performances of some wave models on a large scale [
23], but it was never used to assess the wind conditions from a meteorological/renewable perspective. A direct analysis with the in situ measurements will be performed by considering two datasets, covering 4 (denoted with MERRA4) or 24 (MERRA24) values per day.
Table 2 provides more details regarding the data processed.
3. Results
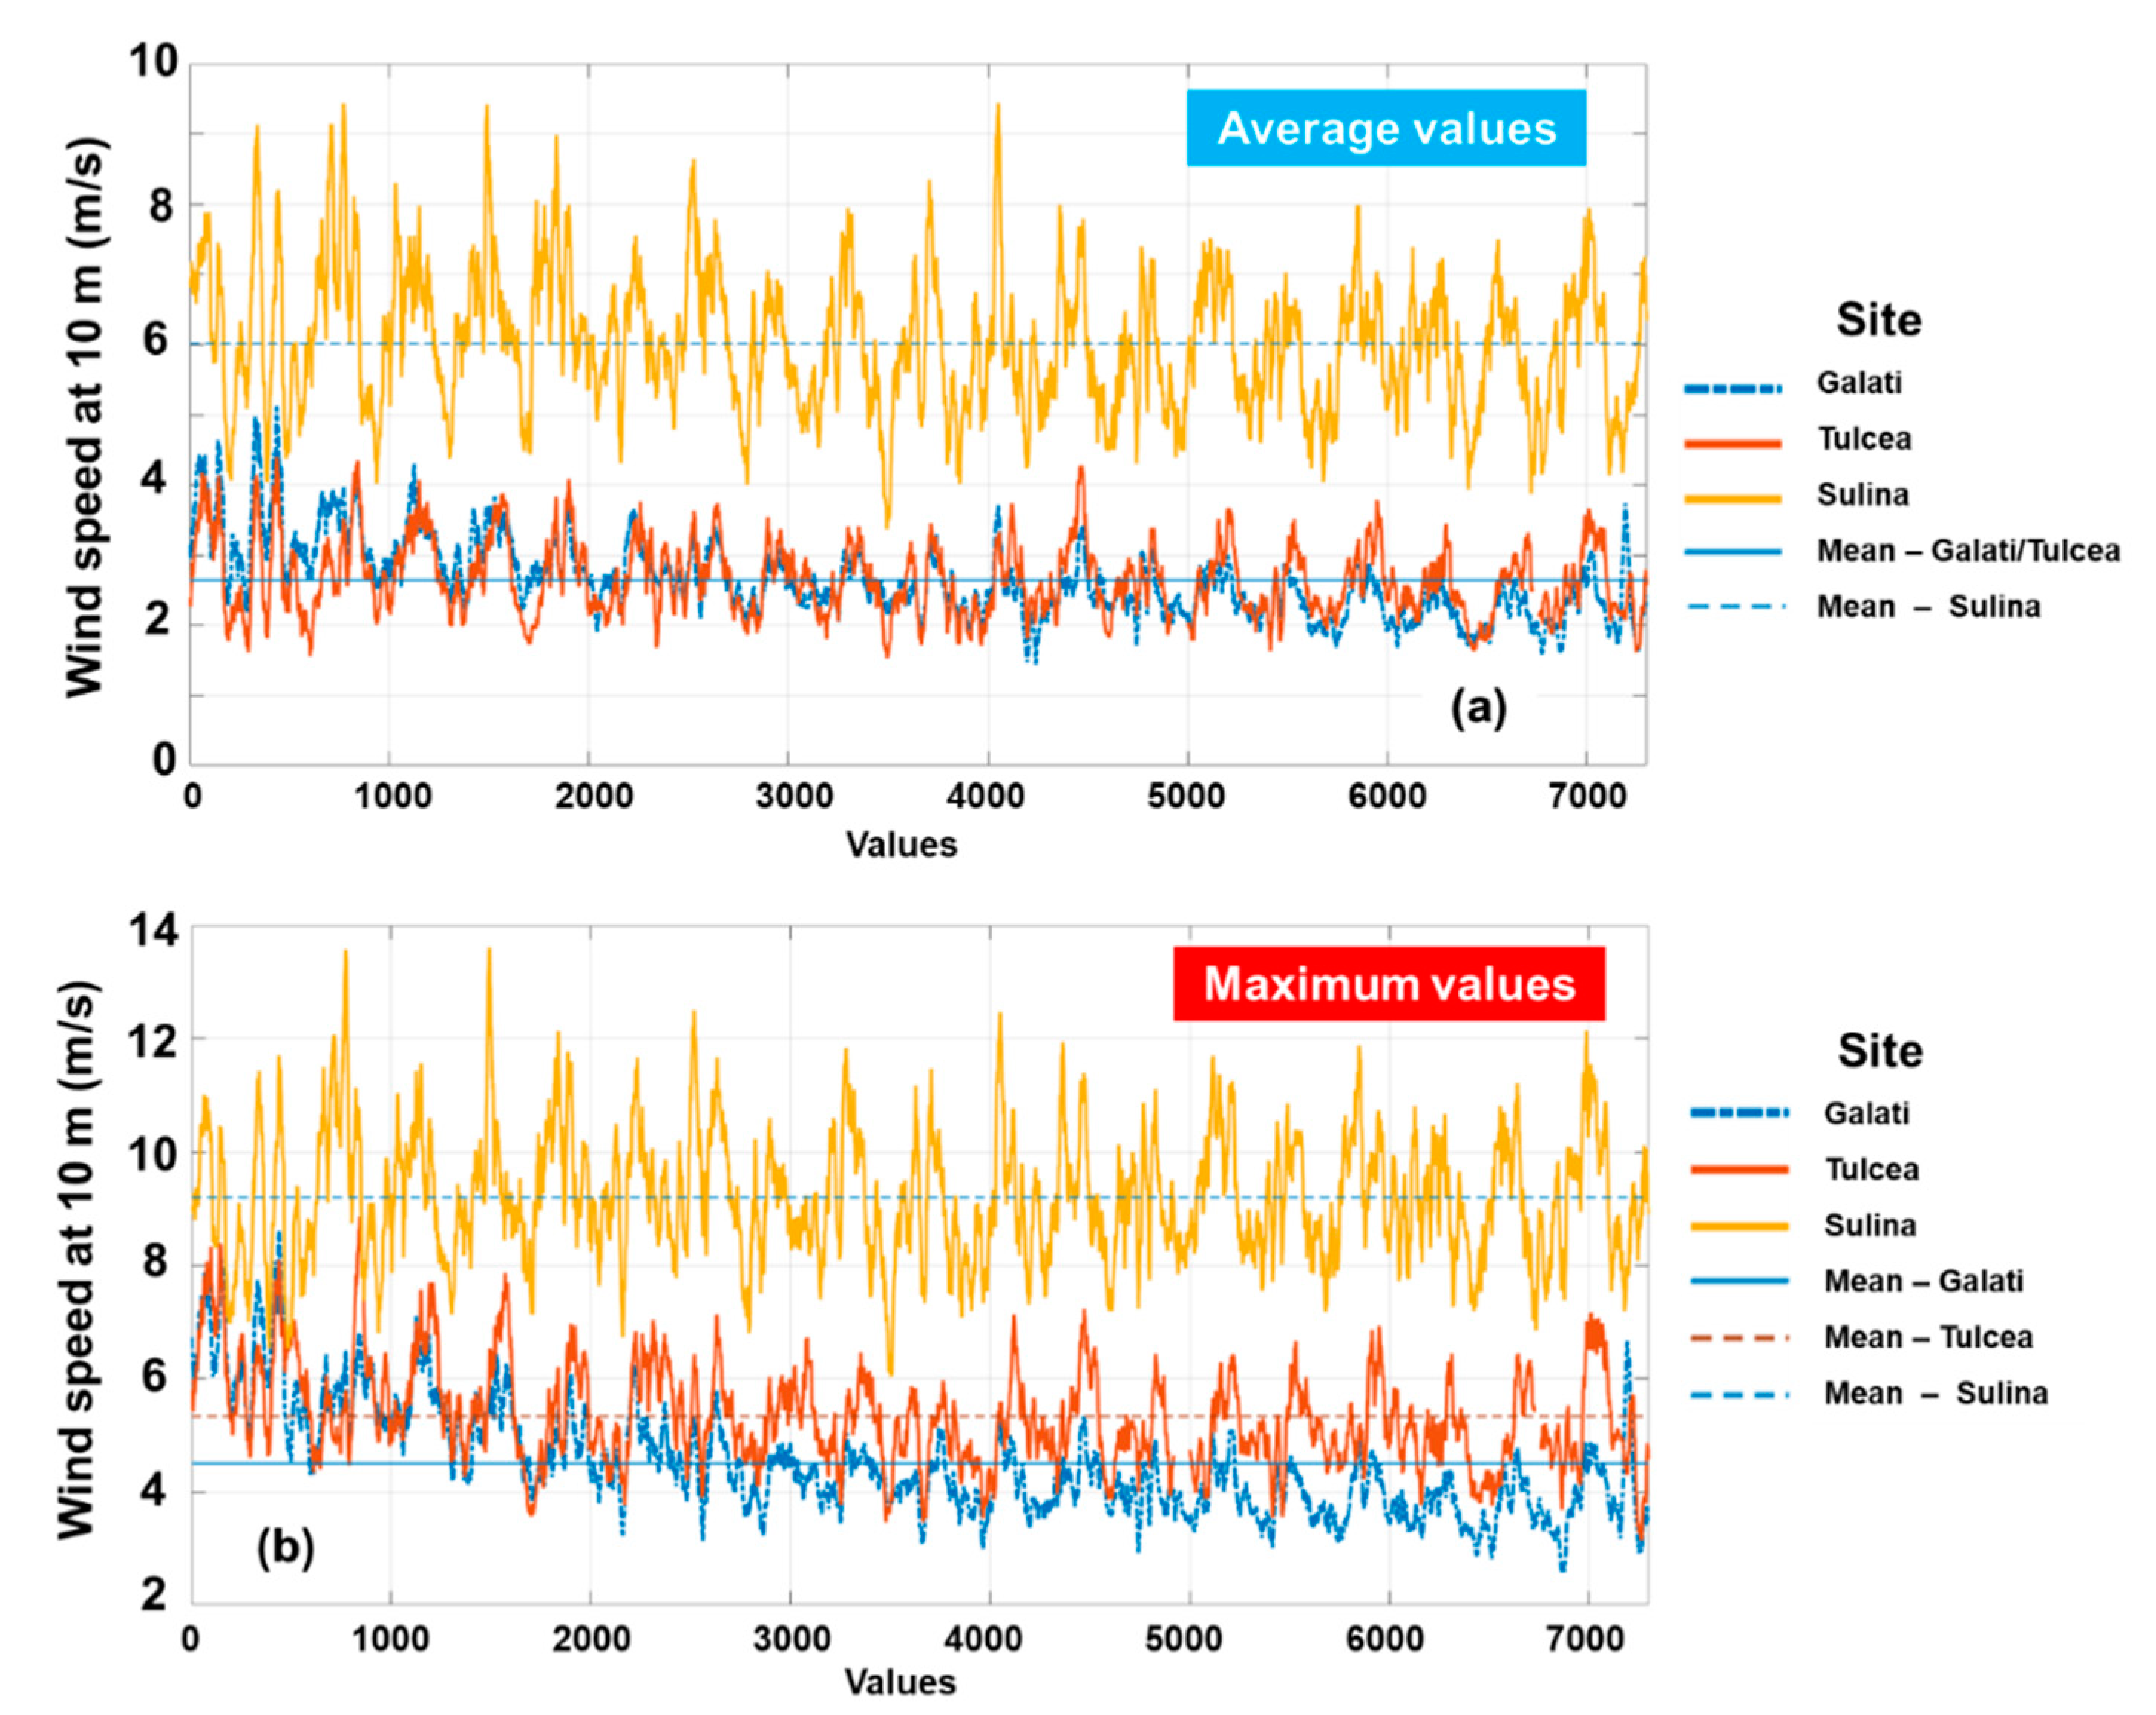
A first impression of the local wind resources is provided in
Figure 3 and
Table 3, where only the in situ measurements were considered. From the analysis of the time series, we can clearly notice that the Sulina site (located near the shoreline) presents more consistent wind resources, than the Galati and Tulcea sites. In terms of the mean values, Sulina with 6.02 m/s exceeded by far as only a mean wind speed value of 2.64 m/s was noticed at the Galati/Tulcea sites, with the mention that the time series of the two sites were quite similar. In order to highlight more clearly the distribution of the
U10 parameter, a one month running filter (30 days) was applied (only for
Figure 3), this being the reason why the statistical values from
Table 3 may indicate a different pattern.
This is the case in the maximum values, were occasionally some high wind values may occur near the Galati site (28.00 m/s). From the analysis of the time series (
Figure 3b), the Sulina site stands up with higher values, constantly reporting values of 8 m/s (mode indicator). This is followed by the Tulcea site, which for the second part of the considered time interval (2010–2020) indicates much higher values than Galati. Based on this information, we can clearly see that the wind speed gradually increases from the land to the nearshore, reporting a significant jump at the sea–land interface of the northern Romania sector.
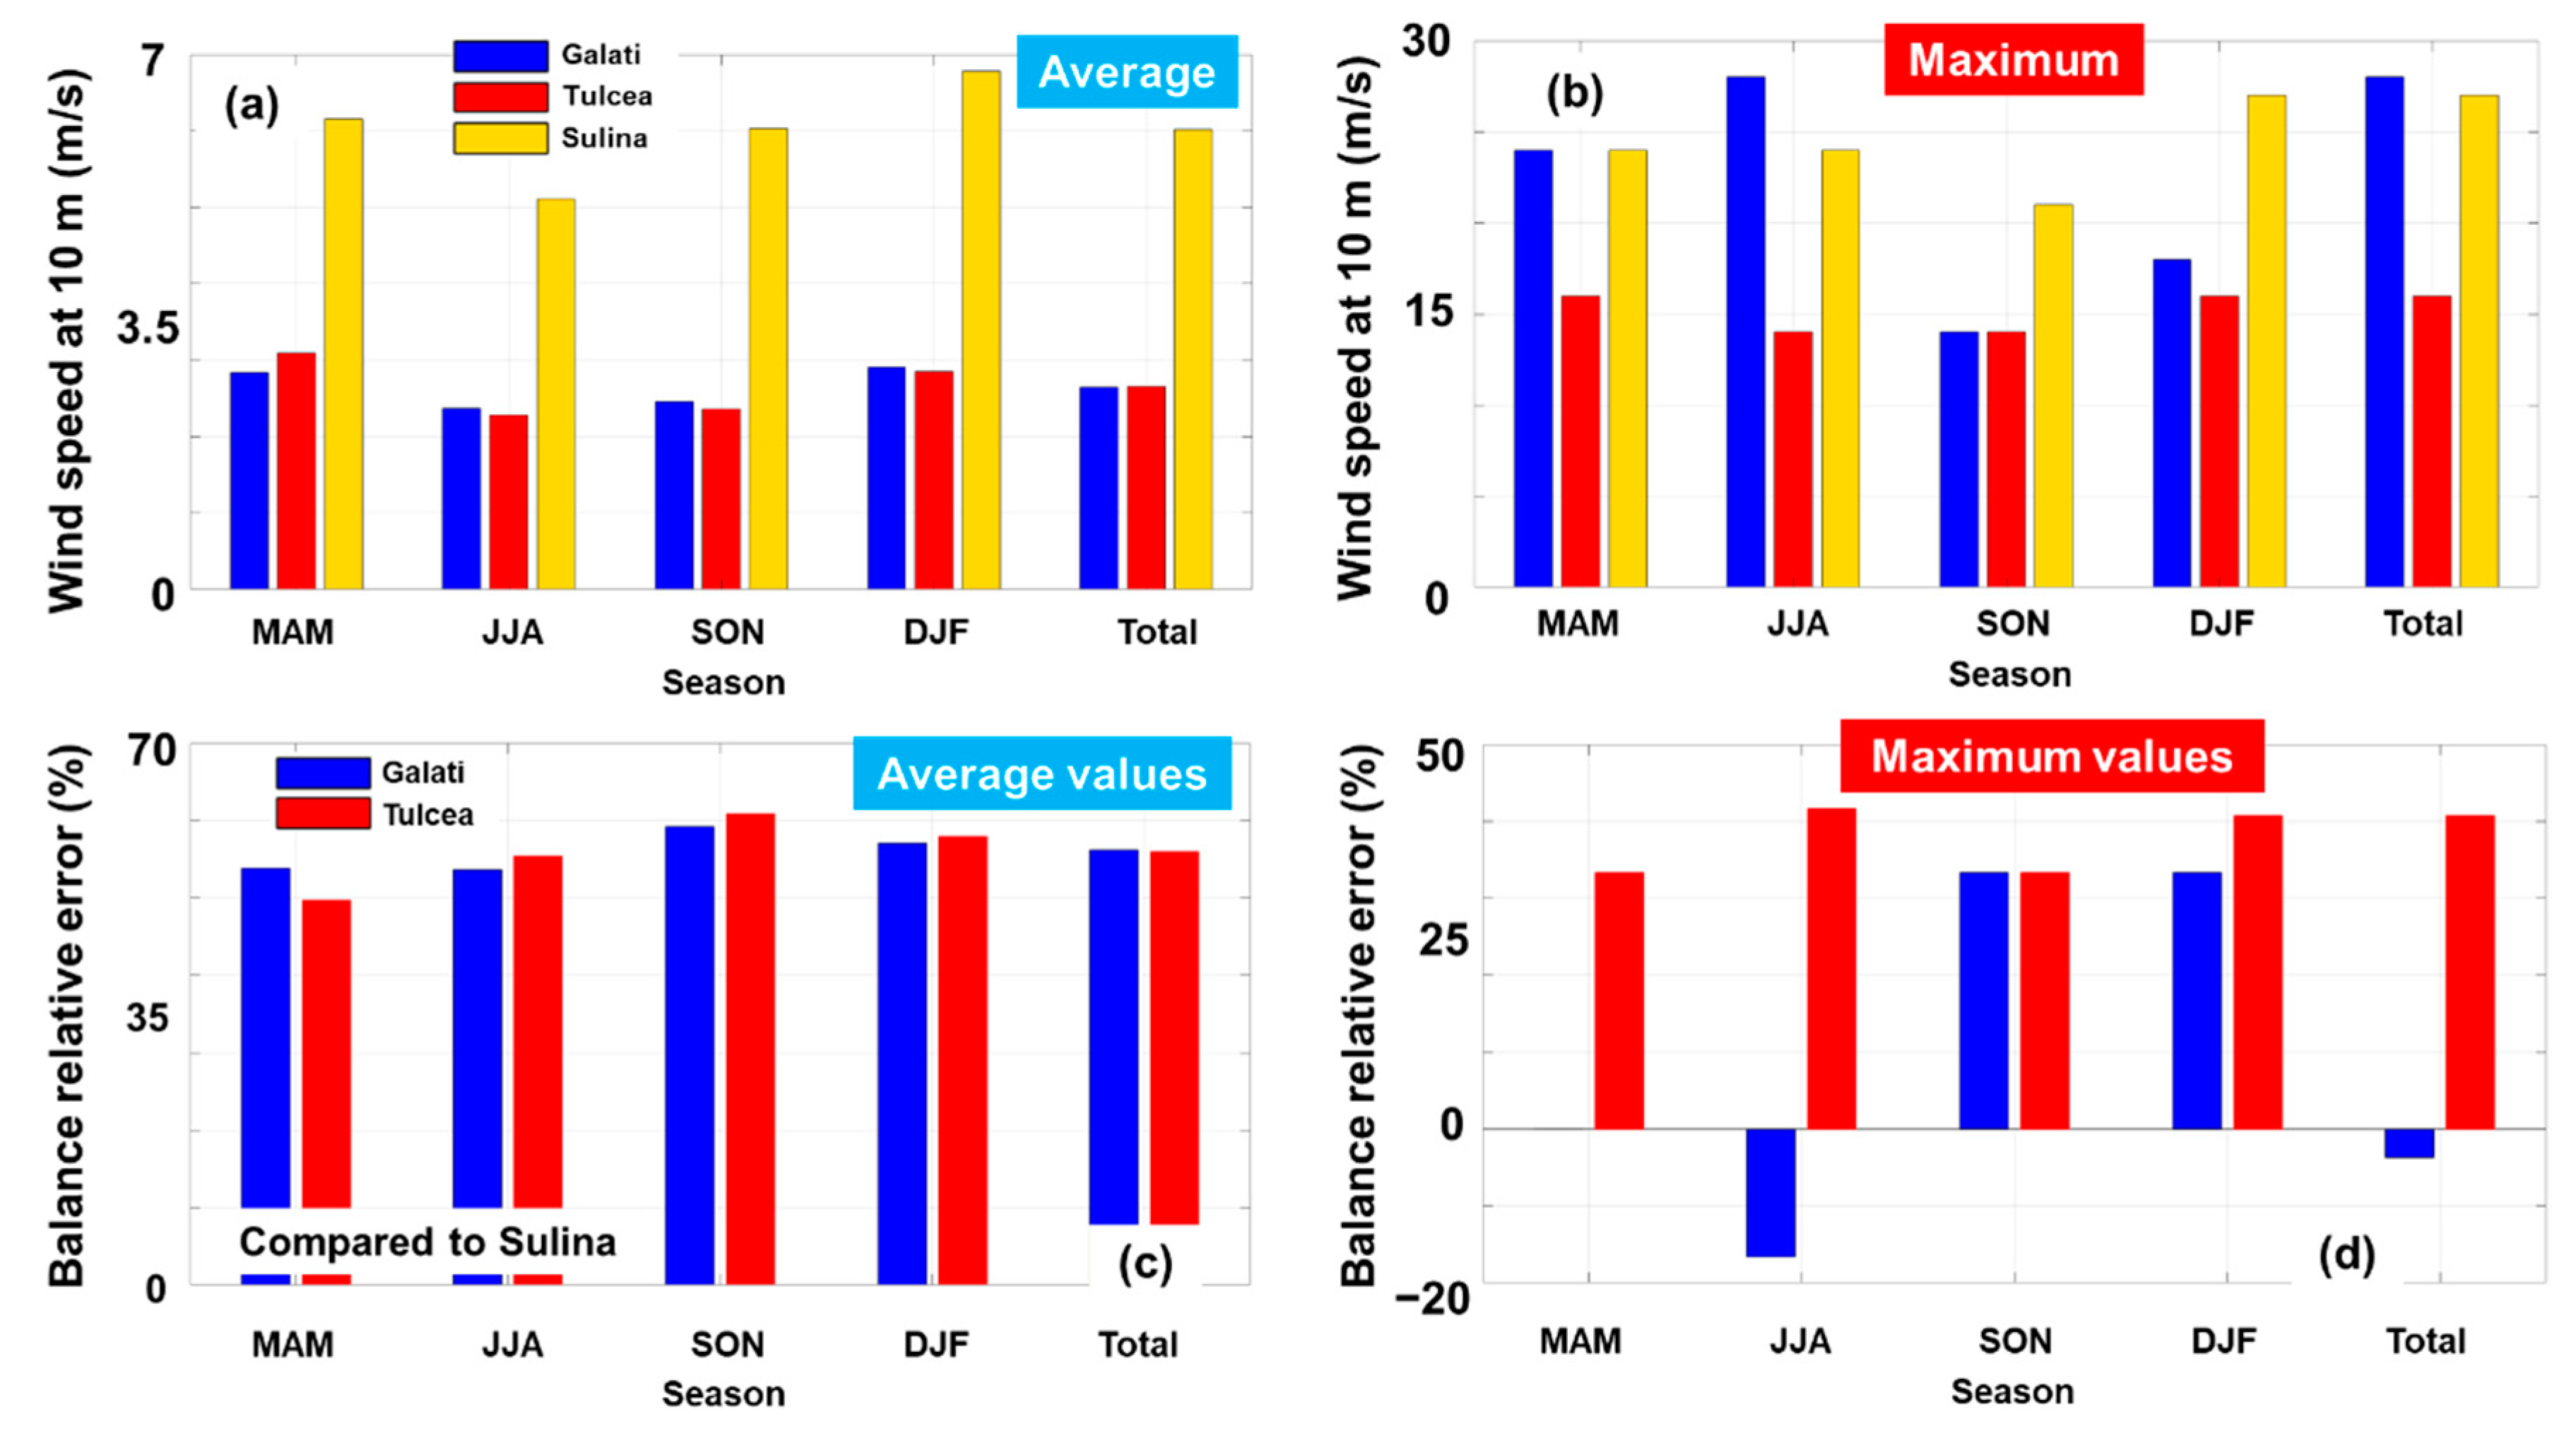
Figure 4 provided a more detailed analysis of the in situ observations, focusing this time on the main seasons (MAM: March–April–May; JJA: June–July–August; SON: September–October–November; DJF: December–January–February). During the wintertime (DJF), the average values reach a maximum value of 6.78 m/s near Sulina and a minimum of 2.28 m/s also near Sulina during summer (JJA). Regarding the summertime, the average conditions from the Galati site slightly exceed the wind resources from Tulcea, reaching a
U10 value of 2.91 m/s during winter. As for the maximum values, the Galati and Sulina are defined by conditions that may exceed 25 m/s, which represent the operability limit for most of the commercial wind turbines. Nevertheless, a more detailed investigation will be required in order to identify the occurrence of some adverse wind events that may influence the structural integrity of a wind system.
By using the Sulina site as a reference, the balance relative error, BRE (in %), for the in situ observation was computed as [
24,
25]:
where
Xbase—in situ measurements associated with Sulina site; and
Xcompared—in situ measurements associated with Galati/Tulcea sites. This comparison is more relevant for the average values (
Figure 4c), where we can observe that the wind speed from Sulina shows more consistent differences. For example, during the autumn season (SON) a maximum difference of 60.9% is observed from the comparison with Tulcea, while a minimum of 49.8% is noticed for the same site, but during the springtime.
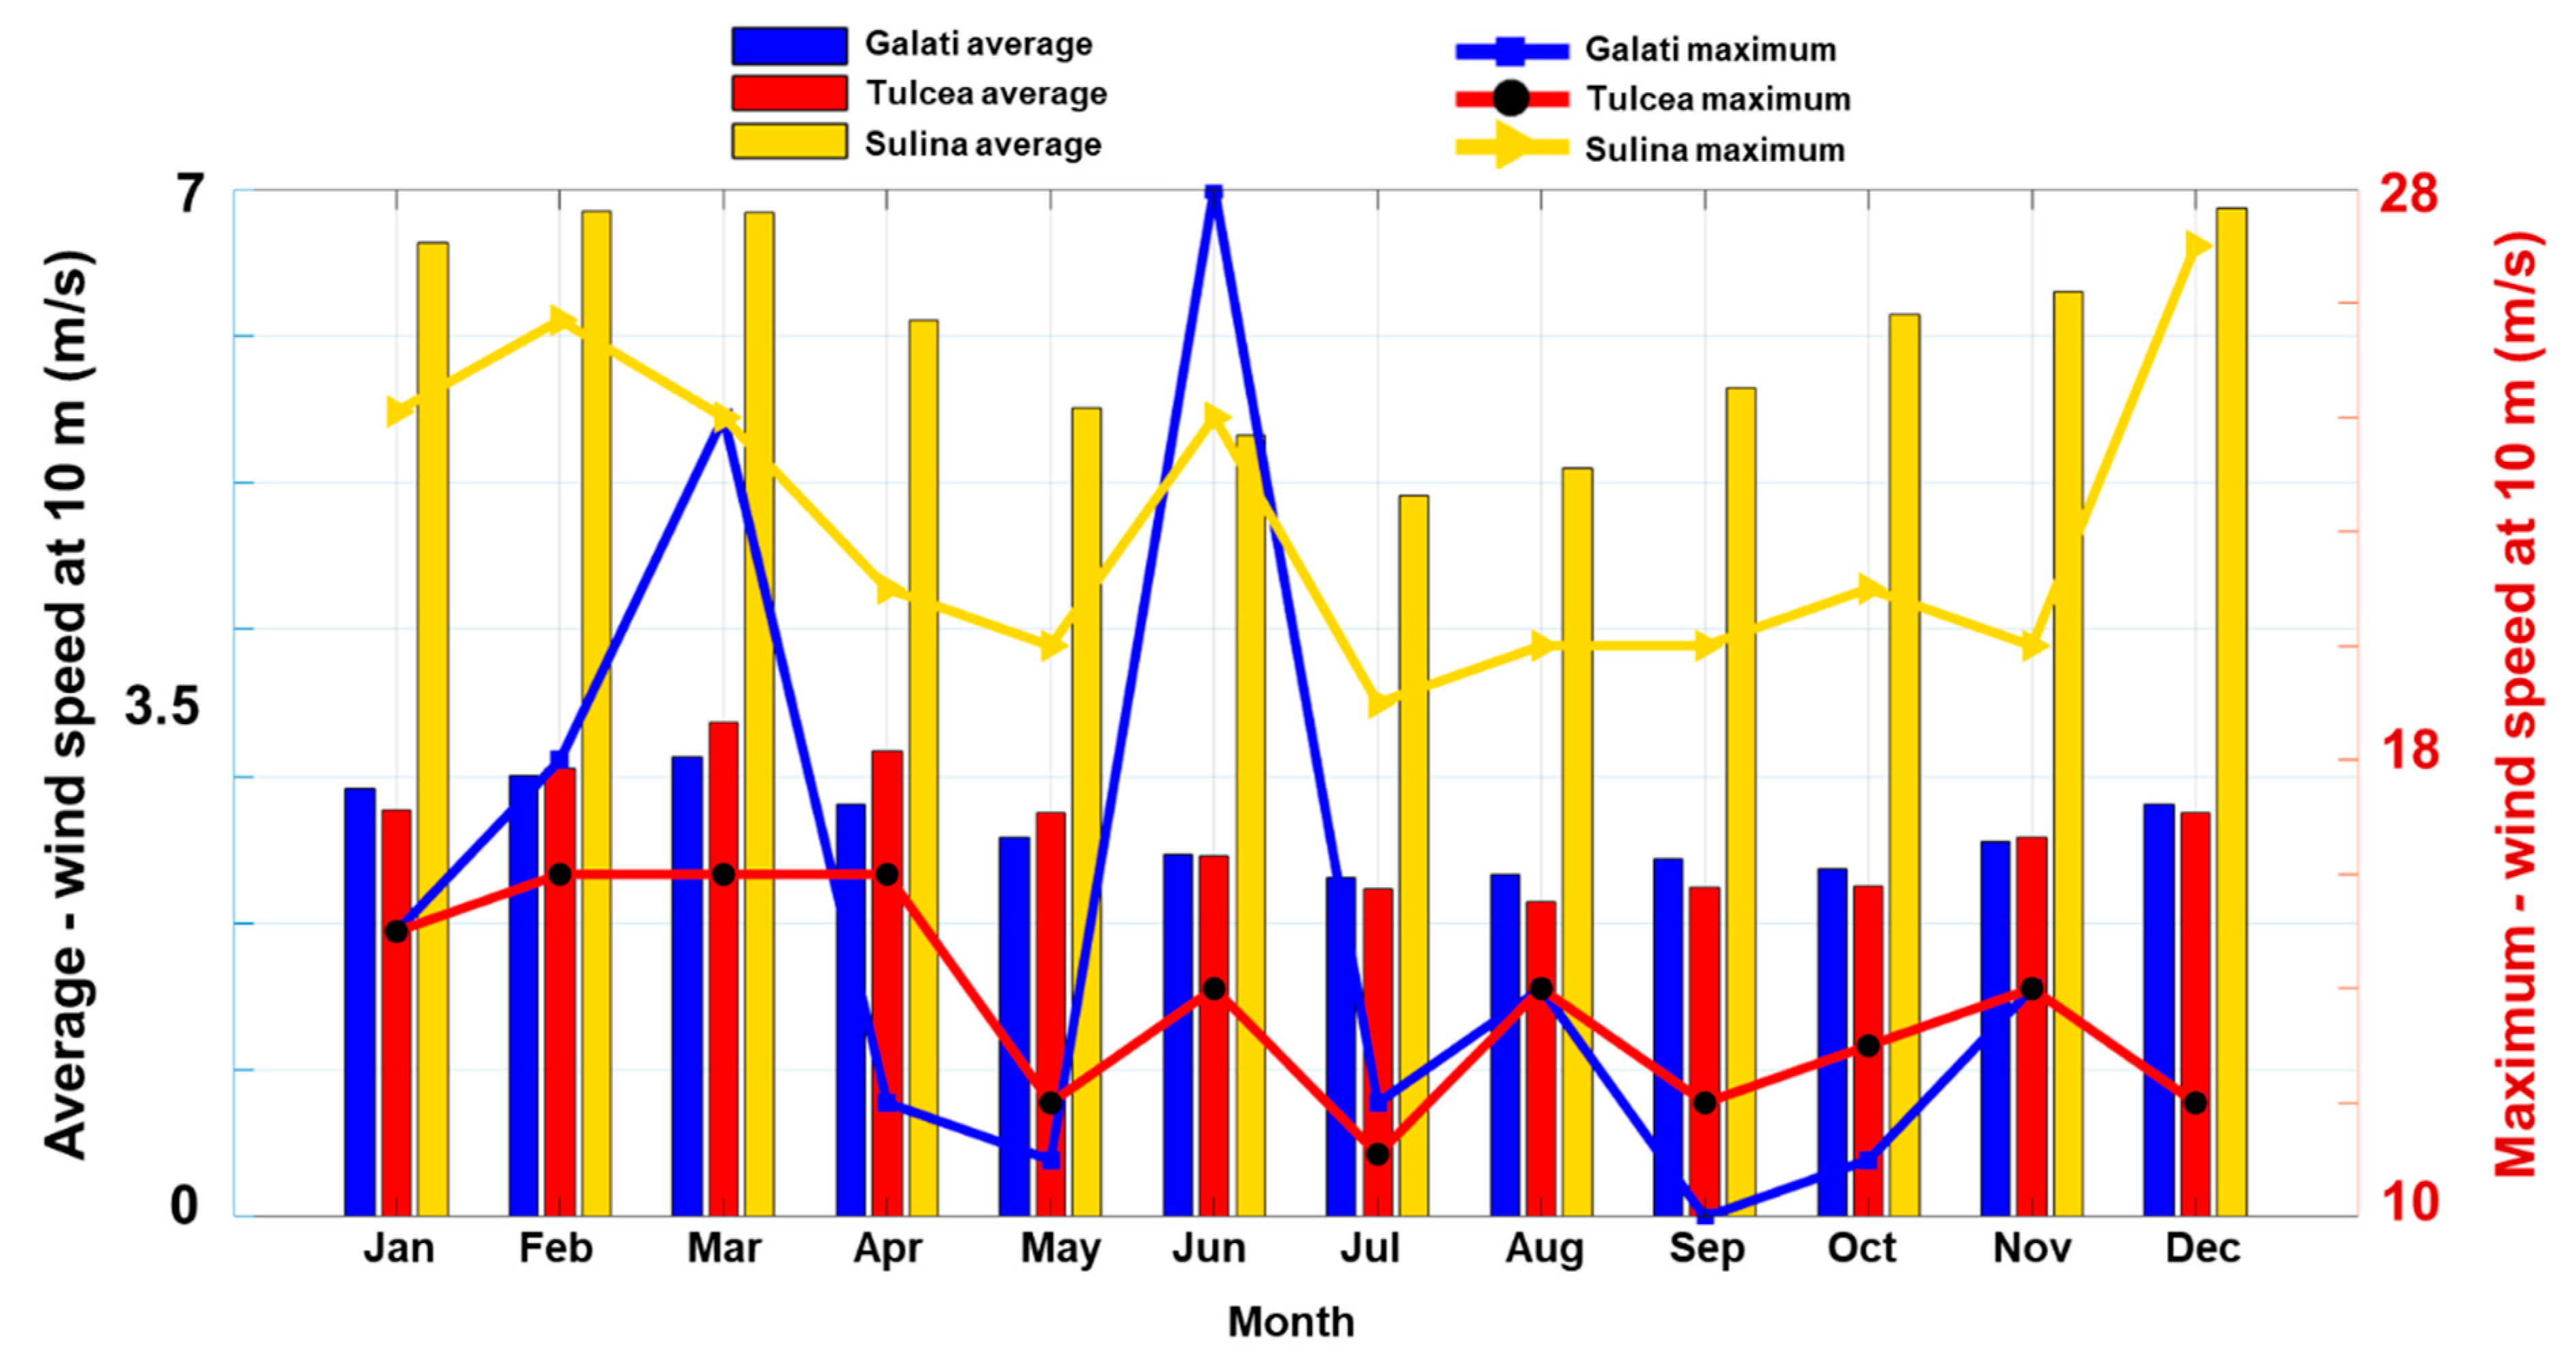
The monthly distribution of the wind conditions is presented in
Figure 5, including the average (left legend) and maximum values (right legend). The average values show a seasonal pattern of the conditions, with a minimum during the summer and maximum in the winter. For the maximum values (line representation), there is a random distribution, with peaks occurring during the entire year, which for example in the case of the Galati site can go up to a 28 m/s (in June). This looks somehow counterintuitive, taking into account that this value is reported during a summer month, also exceeding the maximum value associated with the Sulina site (27 m/s in December).
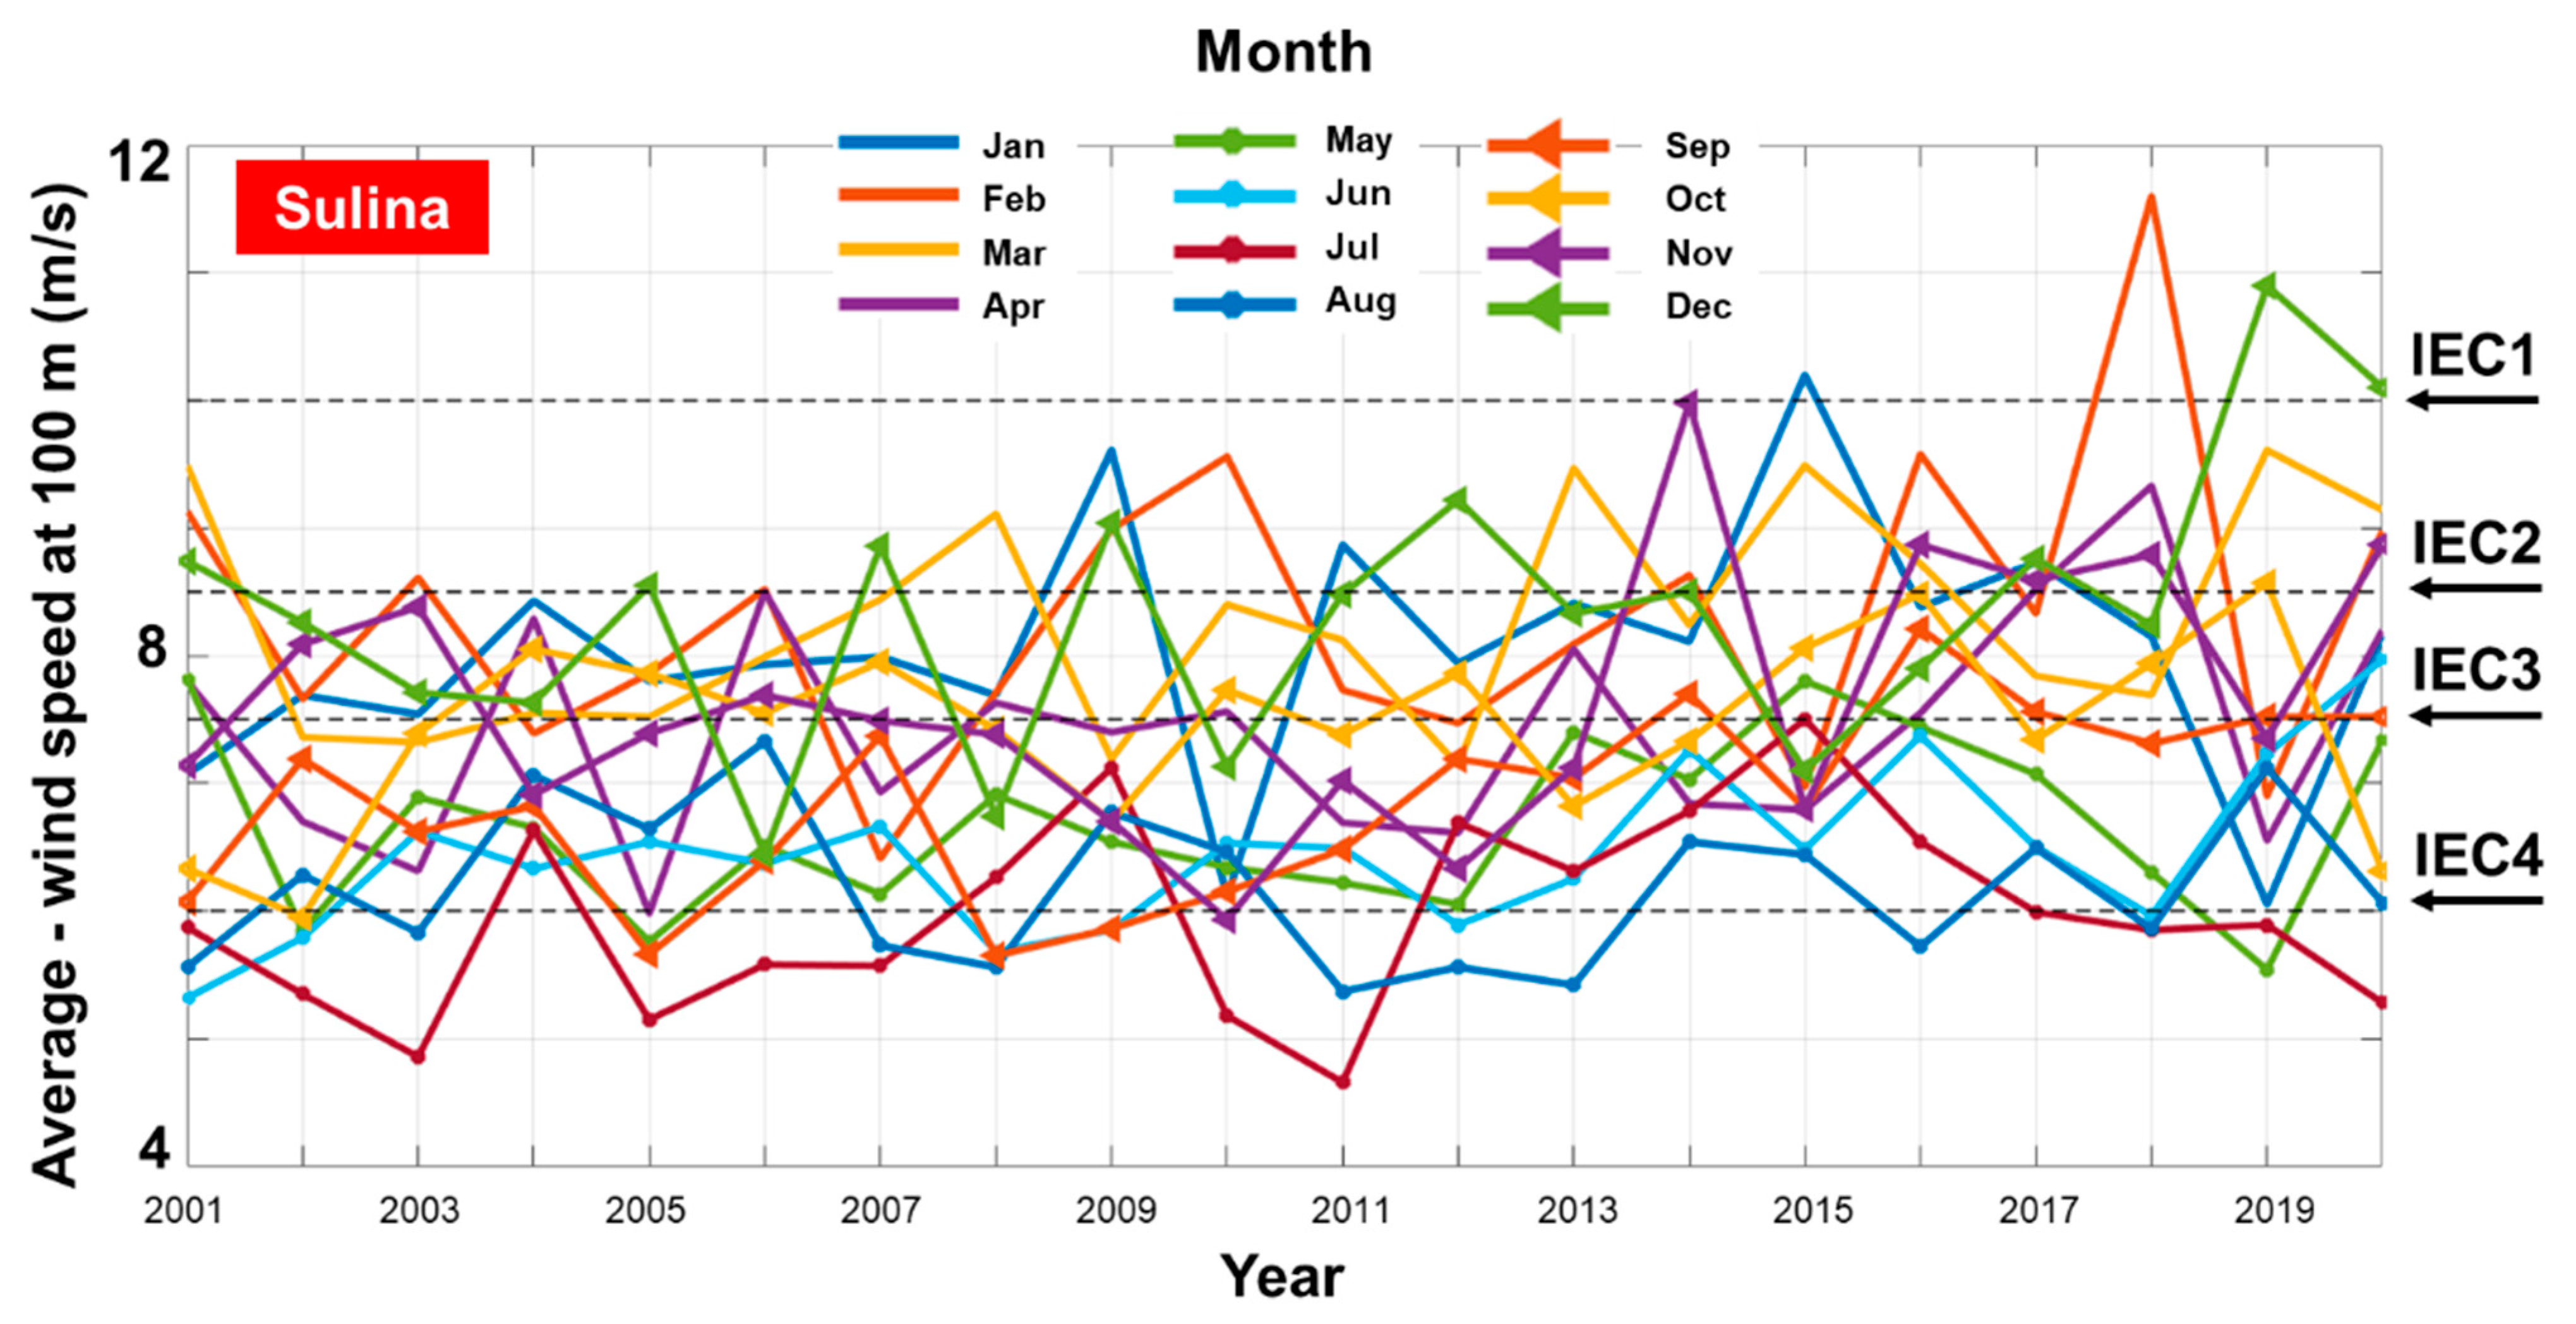
Since the Sulina site indicates more interesting wind conditions from a renewable energy point of view,
Figure 6 includes a more detailed representation of the average wind conditions (by month and year), also highlighting the inclusion of a particular IEC wind class [
26]. There are four main classes, sorted according to average wind speed (10 m/s, 8.5 m/s, 7.5 m/s and 6 m/s), a suitable wind site for a renewable energy project being expected to cover the top wind classes. Additionally, the selection of a particular wind turbine may be carried out according to a particular IEC wind class. As a limitation, for the present work the turbulence and the gust parameters were not taken into account. The IEC criteria are related to the hub height of a particular turbine, and in this case a 100 m height was considered, since this seems to be at this moment the height at which most of the turbines operate, at least for the offshore industry [
27,
28].
Although in the ERA5 data a wind dataset directly reported at 100 m height is available, for consistency with the other data, the
U10 wind speed was adjusted by using the following expression [
29,
30]:
where
U100—wind speed at 100 m (in m/s);
U10—wind speed at 10 m (in m/s);
z100 and
z10—reference heights (100 m and 10 m); and
z0—roughness of the sea surface.
From the information provided in
Figure 6, an IEC1 class was only noticed in the recent years (2015–2020), with the mention that for the last three consecutive years the values exceeded 10 m/s (February 2018, December 2019 and 2020). During the winter, summer and autumn seasons the presence of the IEC2 and IEC3 values is visible, while during the summertime most of the values fall into category IEC4 (or below). Usually, the IEC4 class is not considered to be suitable for the development of a wind project, being possible to encounter these types of conditions even during winter. From this point of view, July represents the less energetic month with values in the range of 4.66–7.50 m/s. Per total, in recent years, the IEC2 class starts to become more frequent, this aspect being highlighted by the March and November distributions.
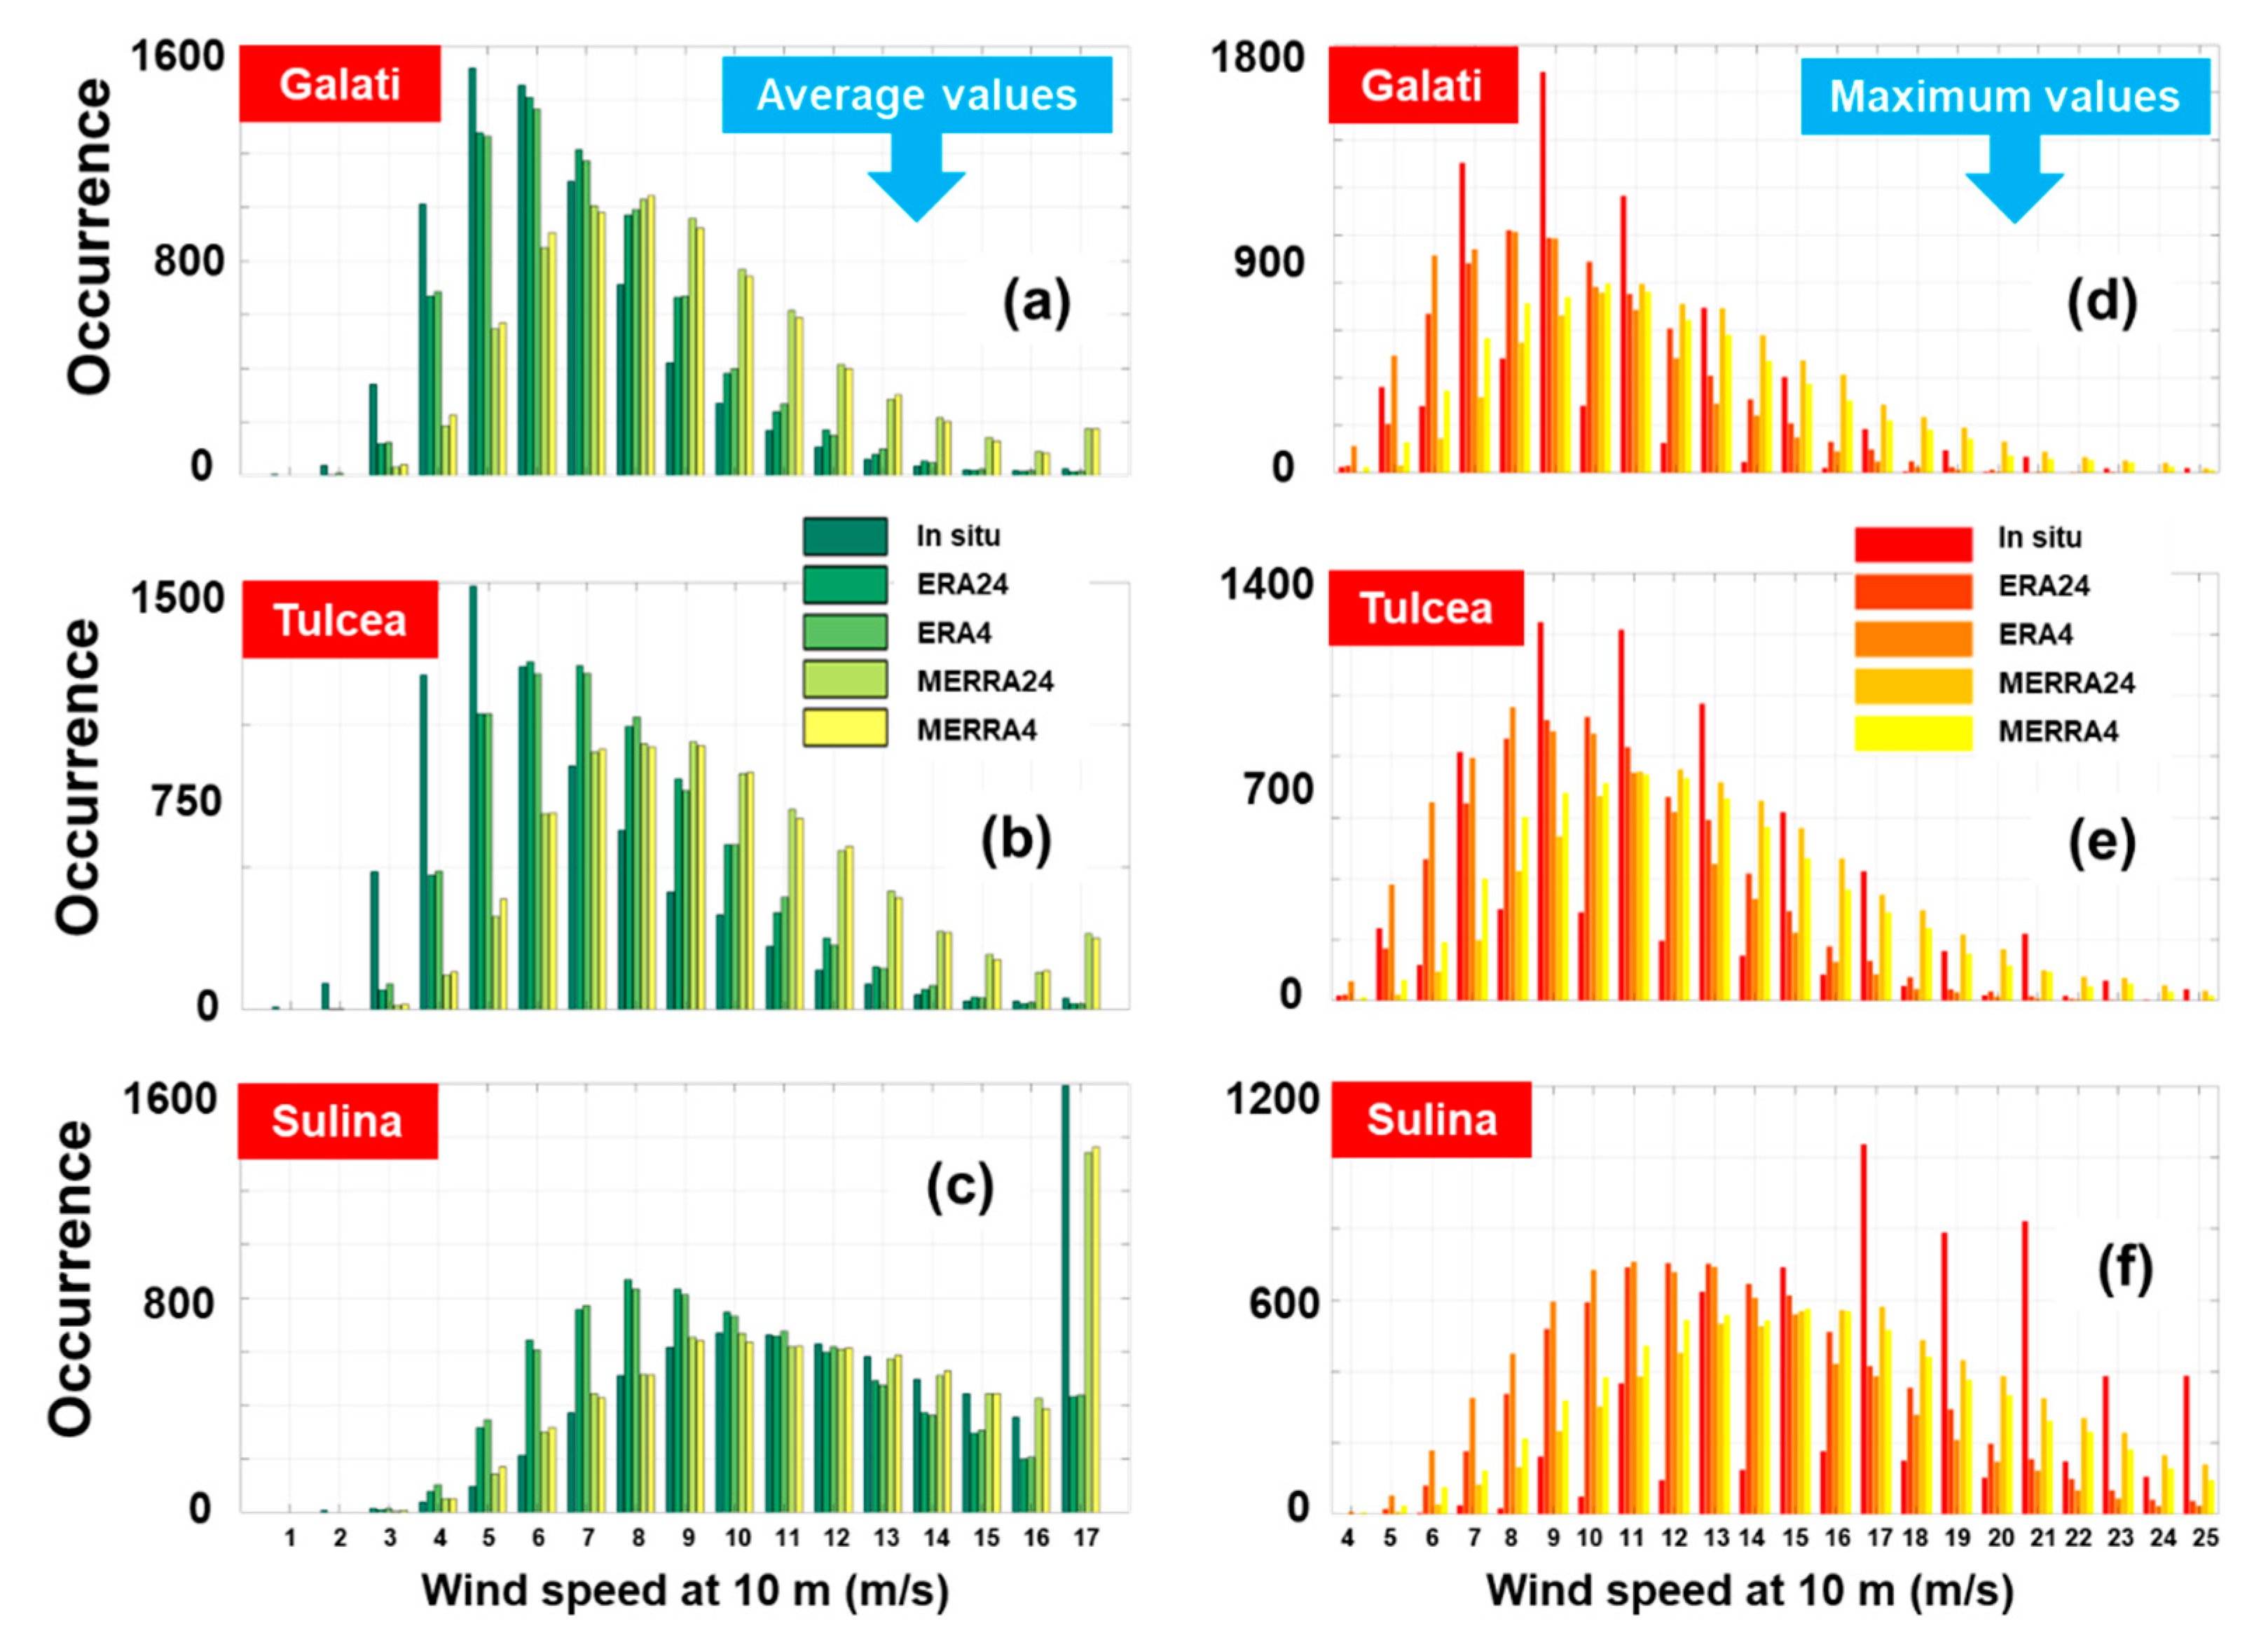
The frequency distribution of the wind classes is presented in
Figure 7, by including all the available wind datasets reported for the time interval January 2001–December 2020, also including the average and maximum values. For the Galati and Tulcea sites, the average values are concentrated in the interval 3–10 m/s, while for Sulina there is a constant distribution in the range of 6–16 m/s and a peak for the 16–17 m/s interval.
From the Galati and Tulcea sites, the in situ observations (average values) are much higher for the wind conditions located below 6 m/s, after this threshold has constantly been under the distribution indicated for the reanalysis data. As we go to the higher values, the MERRA datasets overestimate the wind conditions, also exceeding the ERA5 values. For the Sulina site (
Figure 7c), the ERA5 presents much higher values for the interval 0–10 m/s and seems to underestimate the wind resources for higher wind classes. From the databases considered (24 values and 4 values), it seems that in most of the cases the 24-value category provides slightly higher results, the differences observed being quite small. For the maximum values (
Figure 7d–f), the existing peaks are accounted by the in situ measurements, being distributed below 10 m/s for the onshore sites (Galati and Tulcea) and over 16 m/s in the case of Sulina.
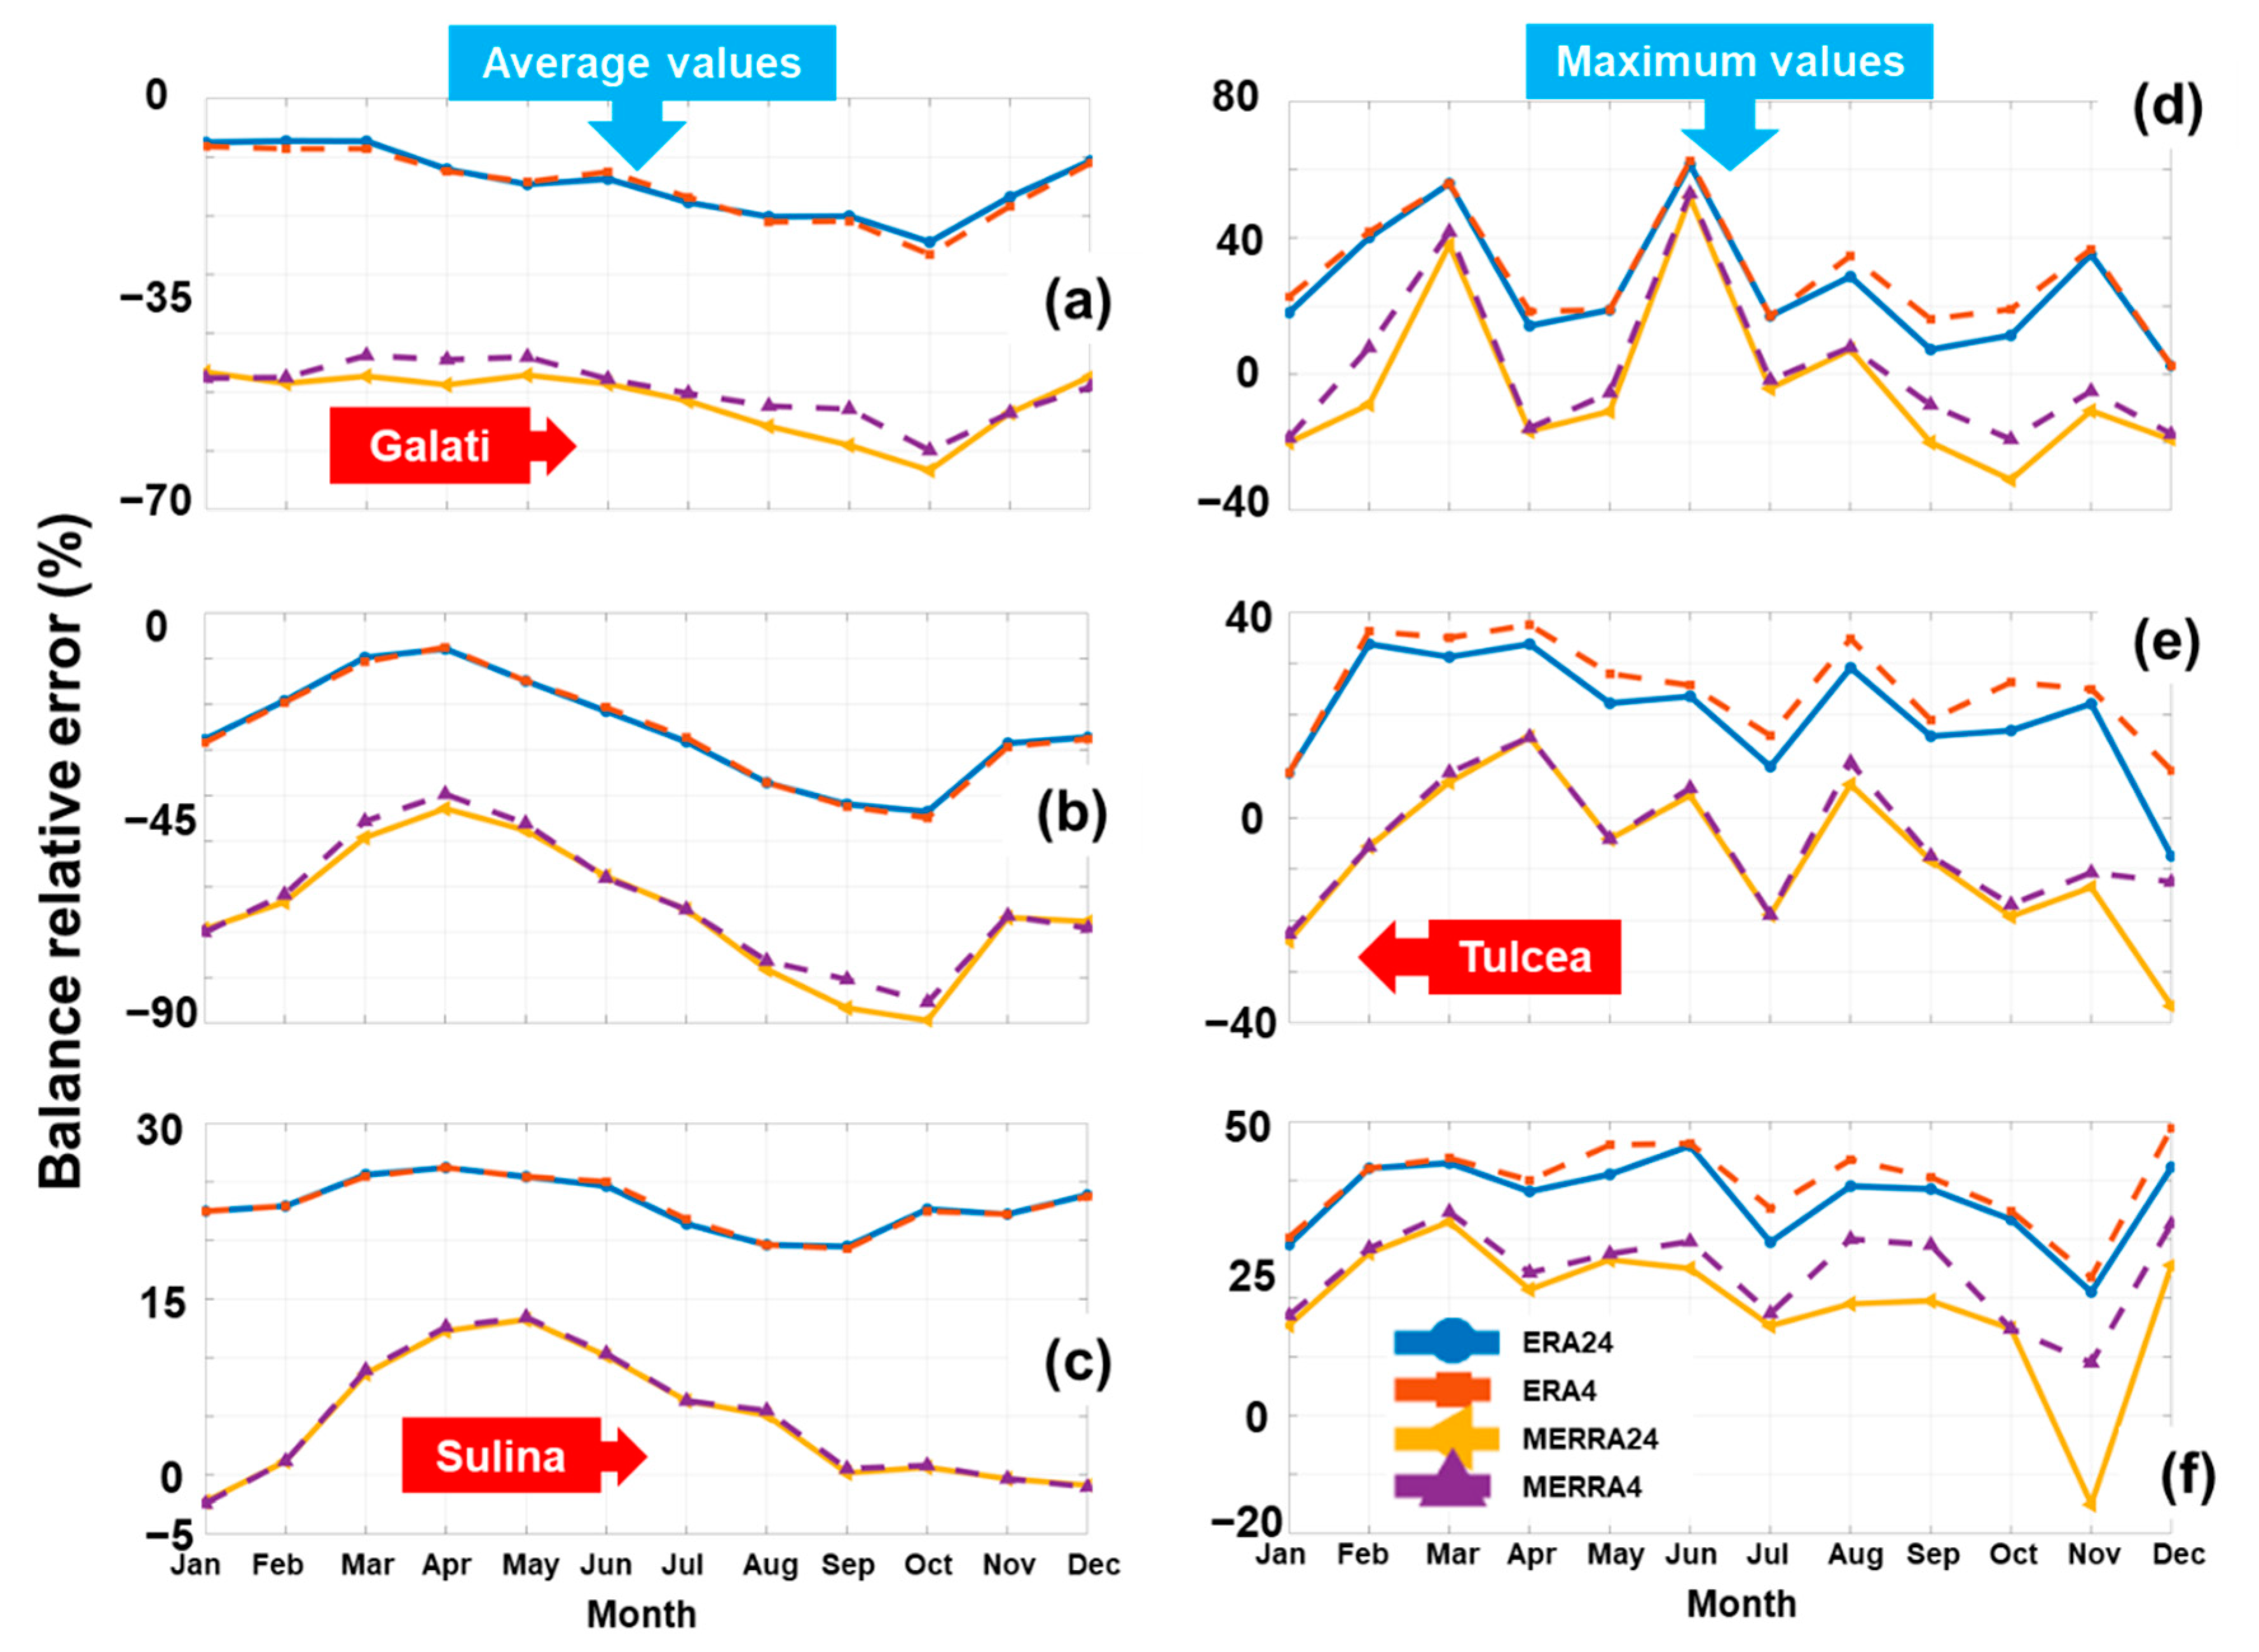
In
Figure 8 the in situ measurements are compared with the reanalysis data, these results being indicated in terms of BRE indicator. From the analysis of the average values (
Figure 8a–c), we can clearly see that there are very little differences between the two categories of data (4 values and 24 values). In most of the cases, the evolution of the values are identical, as in the case of Sulina site. In terms of accuracy, the ERA5 dataset provides better results for the onshore sites (Galati and Tulcea), while for the Sulina site the MERRA-2 values are much closer to the in situ observation. The expected differences are negative in the case of the Galati and Tulcea sites, with values in the following ranges: [7.31–26.6]% ERA5, [46.6–63.3]% MERRA-2 for Galati and [7.89–44.9]% ERA5/[39.7–89.3]% MERRA-2 for Tulcea. In the case of Sulina, most of the differences are positive, indicating results in the following ranges: [19.6–25.6]% for ERA5 and [0.31–13.2]% for MERRA-2, respectively.
For the maximum values (
Figure 8d–f) there is no clear pattern, the differences being either negative or positive. For the Galati site, a minimum value of 2.5% (positive) is indicated for ERA5 in December while a value of 1.67% (negative) is associated with MERRA-2. Compared to these, for Tulcea, the MERRA-2 underestimates the wind resources by a maximum of 36.7% (MERRA24), while ERA5 constantly overestimates the wind resources with values in the range [7.5–37.5]%. In the case of the Sulina site, the two datasets (ERA5 and MERRA-2) present a similar pattern, with the mention that MERRA-2 values are much closer to the in situ observations. For this site, all the values are positive with a maximum of 48.9% (ERA4) and 34.6% (MERRA4), respectively.
A direct comparison between the two data collections (24 values and 4 values per day) is presented in
Table 4 only for the ERA5 wind dataset, where for the first time we introduced the offshore points O1 and O2, respectively. As indicated in
Figure 8, the differences between the average values are quite small (close to zero), more important variations being accounted by the maximum values (ex: O2 site) and mode parameter. A similar analysis is performed in
Table 5,for the MERRA-2 data, where similar variations are being noticed.
The hourly distribution of the wind conditions (average and maximum values) is indicated in
Figure 9, considering only the reanalysis data. In the case of the average values, the MERRA-2 data constantly indicate higher values than ERA5 during the entire day, and regardless of the site considered. For the Galati and Tulcea sites, a wind turbine will perform much better during the daytime (07:00–16:00 UTC) reaching a maximum peak around 12:00 UTC. As for Sulina, according to ERA5, more important resources occur during 05:00 and 15:00 UTC. On the other hand, the MERRA-2 data indicate
U10 values higher than 5.9 m/s during the interval 05:00 and 10:00 UTC, while the values drop below 5.6 m/s in the second part of the day (14:00–18:00 UTC). From the plot providing the maximum values (
Figure 9b), there is a constant distribution during the entire day, with the mention that for the Sulina site, the MERRA-2 data are significantly higher during the first part of the day and gradually decrease from 23 m/s to a minimum of 18.2 m/s near 13:00 UTC. In this case, lower values are indicated by the ERA5 dataset for the onshore Galati and Tulcea sites, respectively.
As a next step, a more detailed assessment of the wind conditions at a 100 m height (hub height) will be carried out by using only the ERA5 dataset, which seems to show a better agreement with the in situ measurements for two (of three) in situ stations. More than this, the ERA5 data are frequently used to assess the wind energy [
31], showing good agreement with observations on a global scale [
32].
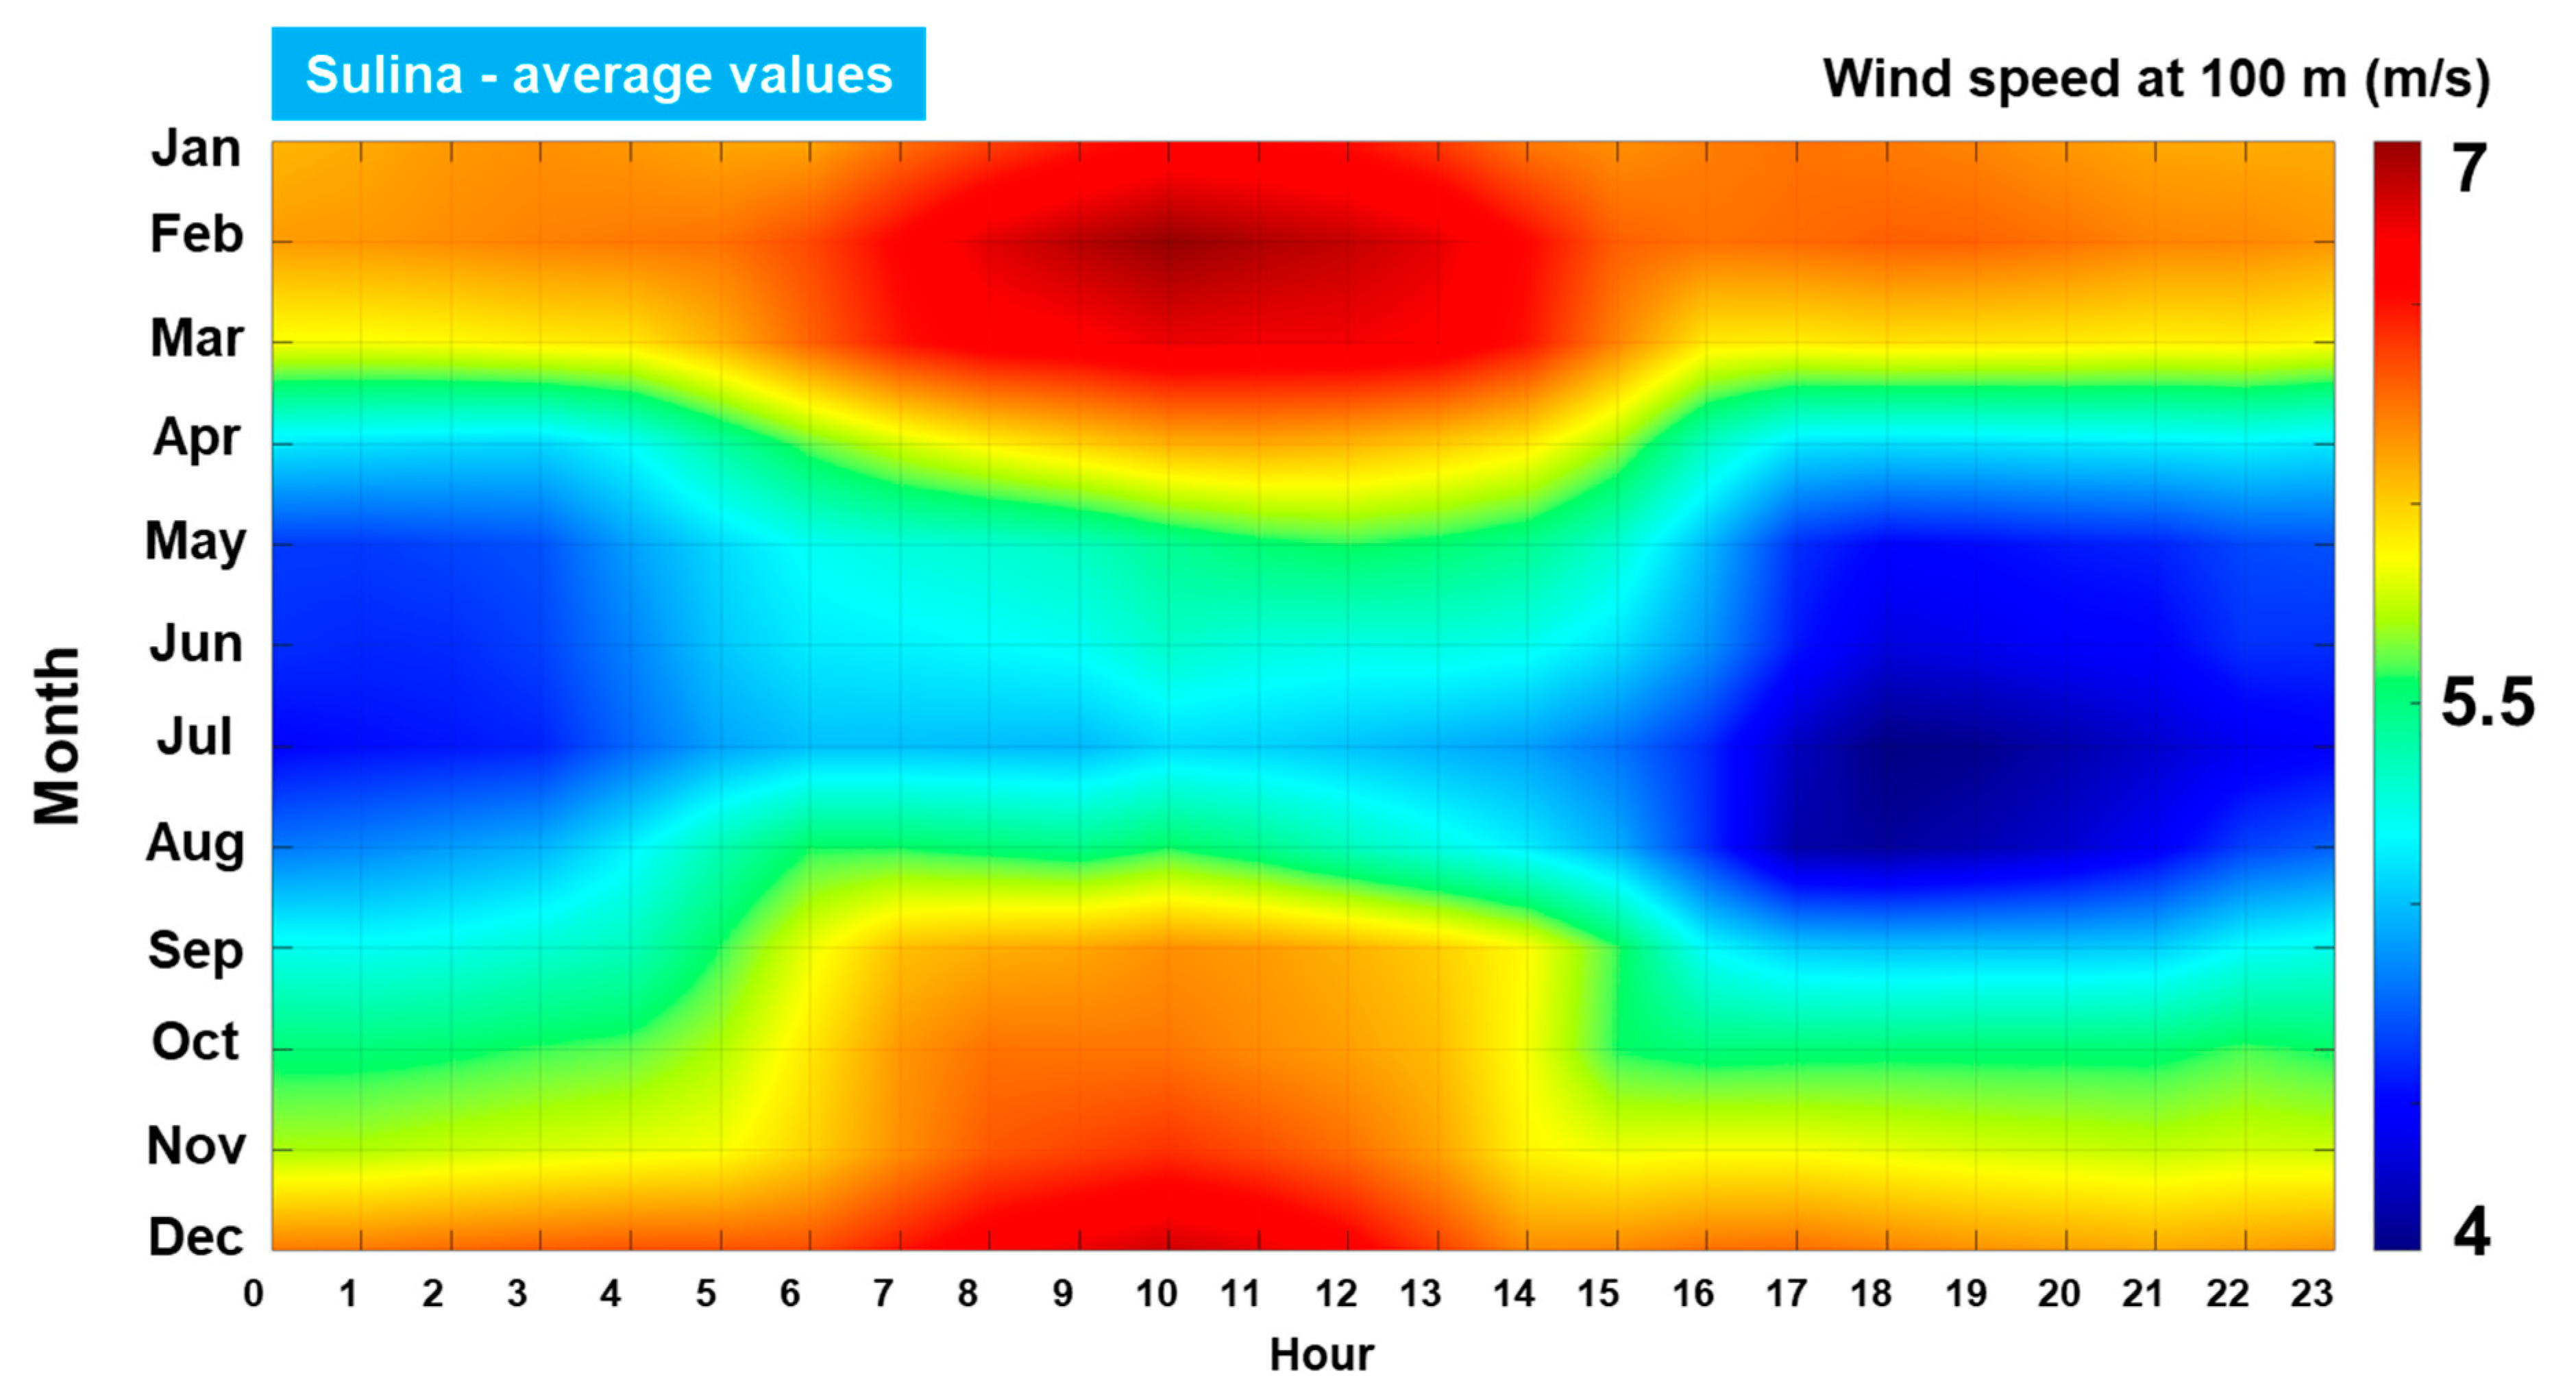
Figure 10 presents the distribution of the
U100 parameter (average) by months and hours, considering only the Sulina site. The seasonal variations are more important than the diurnal distribution, expecting higher wind resources during the November–March interval with a maximum peak for the time interval 07:00–13:00 UTC. During this period, the wind conditions frequently reach 7 m/s, also reporting periods with values in the range [6–6.5] m/s. For the summertime, maximum wind speed values of 5 m/s are noticed during the day, while during the night the values drop down to 4 m/s. In this case, the transition between the two energy areas is noticed around 03:00 UTC and 17:00 UTC, respectively.
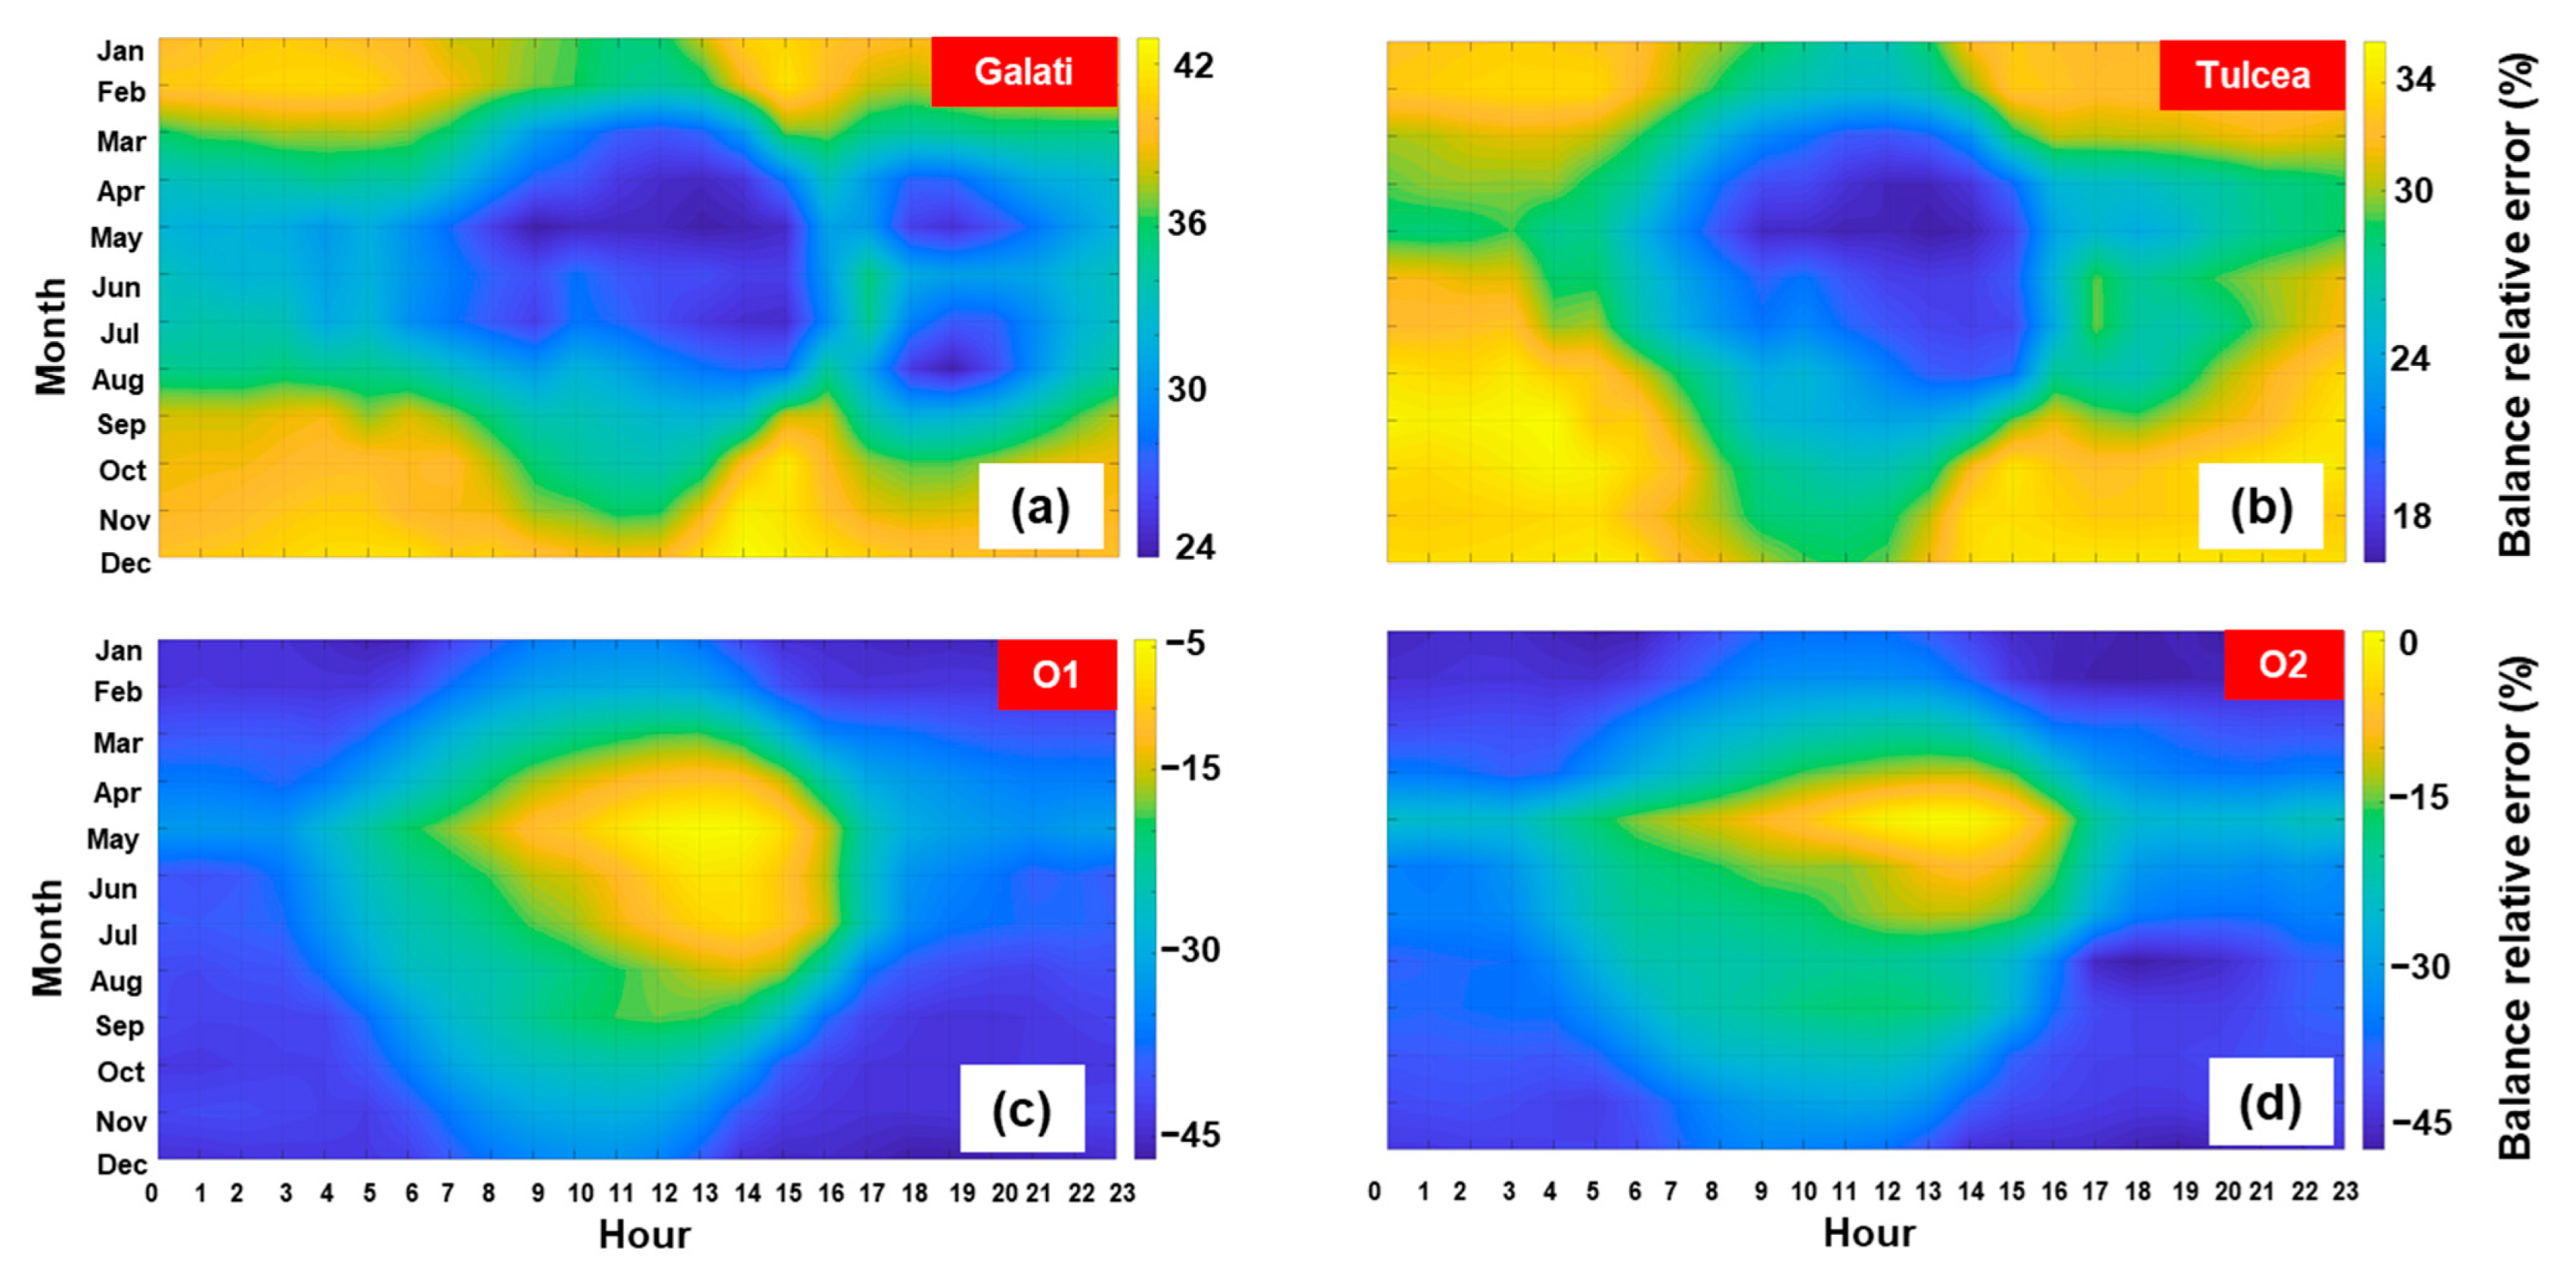
By using the Sulina site as a base,
Figure 11 illustrates the BRE differences of the
U100 parameter (average values) as they are indicated for the other reference points. A clear distinction can be made between the onshore (Galati and Tulcea) and offshore sites (O1 and O2), in the sense that the first ones present much lower values that may go up to 42%, while for the second ones 34% is noticed. In addition to Tulcea, in the case of Galati, two spots of low wind speed that occur at 19:00 UTC during May and August (24%) are noticed. Maximum differences usually occur during the wintertime, but in the case of Tulcea for example, these types of values are noticed during all the months, except for the center part of distribution where the hourly influence has a higher influence (
Figure 11b). The O1 and O2 differences are very similar, highlighting a better agreement during May (≈20%) compared to the rest of the months. Nevertheless, during the interval 11:00 and 15:00 UTC, the site O1 is defined by a much better agreement with the Sulina site, these variations being in the range [5 and 16] %.
A common way to preliminary assess the performance of a wind turbine is to consider the downtime period, during which a particular generator will not operate. This period is located below the cut-in value of a wind turbine, and during this time no electricity will be produced since it is not economical to run a turbine at low wind speeds. The downtime periods can be also used to perform various operation and maintenance tasks that are difficult to complete during extreme environmental conditions [
33,
34,
35]. Each wind turbine is defined by a particular cut-in value, in most cases this is located around 3 m/s [
12]. The value that will be further considered for assessment.
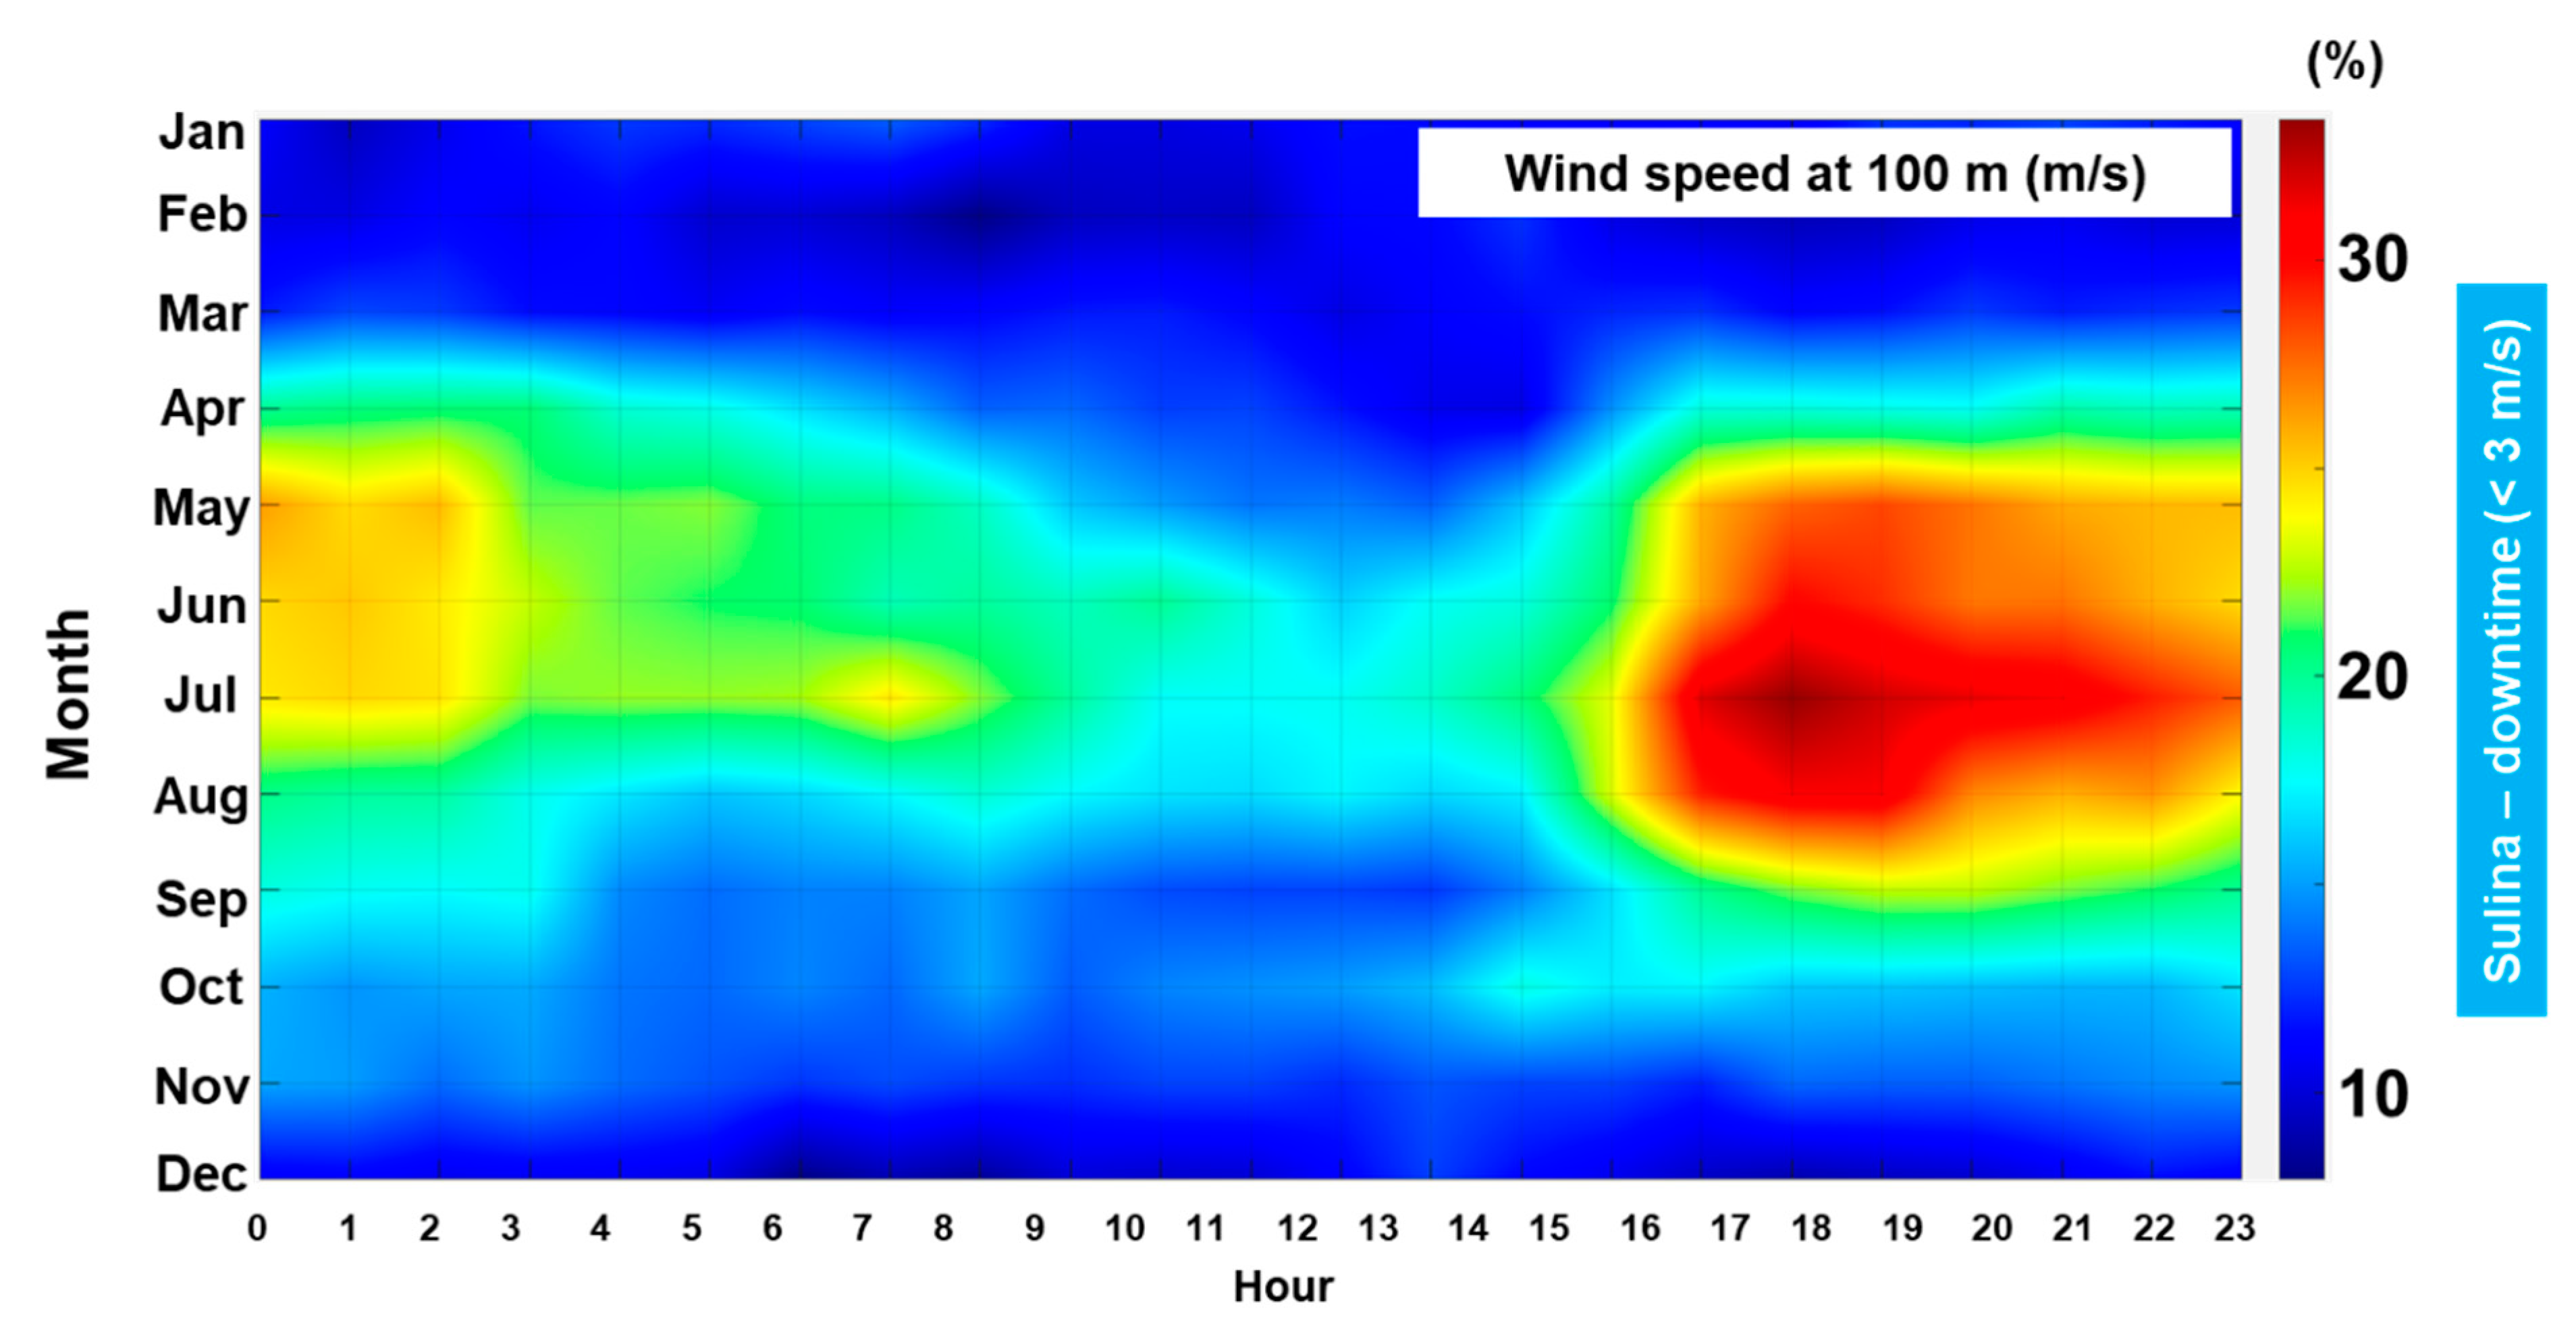
In
Figure 12, the downtime distribution for the Sulina site is presented. A maximum value of 33.12% is indicated during the summertime after 16:00 UTC, while minimum values of 8% are frequently noticed during the winter (January–February–December). Based on these values, it is expected that a maintenance task will be planned during the summertime, in particular during the nighttime.
The downtime periods associated with the rest of the sites are illustrated in
Figure 13. For the onshore sites, inactivity periods of 63% may be expected during summer (ex: Galati), compared to only a maximum of 23% for the offshore ones (ex: O1). During the wintertime, which is considered to be more energetic, the values can go down to: Galati—20.36%; Tulcea—15.39%; O1—3.95%; and O2—3.8%. From the onshore sites, Tulcea also presents a lower downtime period during August–December, in particular for the interval 06:00–14:00 UTC.
For the offshore sites, the inactivity period that defines the O1 site is centered around June/July (15:00 UTC), while for the O2 site this covers a longer strip that corresponds to the interval between April and August, respectively. Although they are located in the same area, the maximum downtime period for O1 occurs during July, while for O2 similar events may be noticed in May.
4. Discussion
The objective of the European Green Deal is to achieve climate neutrality by reducing the gas emission by at least 55% (compared to 1990) until 2030 and to promote the use of renewable solutions. In terms of energy consumption from renewable sources (indicated for 2019), Romania with 24% is in 10th place, being located near Lithuania and Slovenia, but quite far from Sweden, Finland and Latvia that can go up to 56%. As for the year 2020, the Romanian energy mix was divided between fossil fuels (36%), hydropower (28%), nuclear (20%) and wind production (12%), respectively [
36].
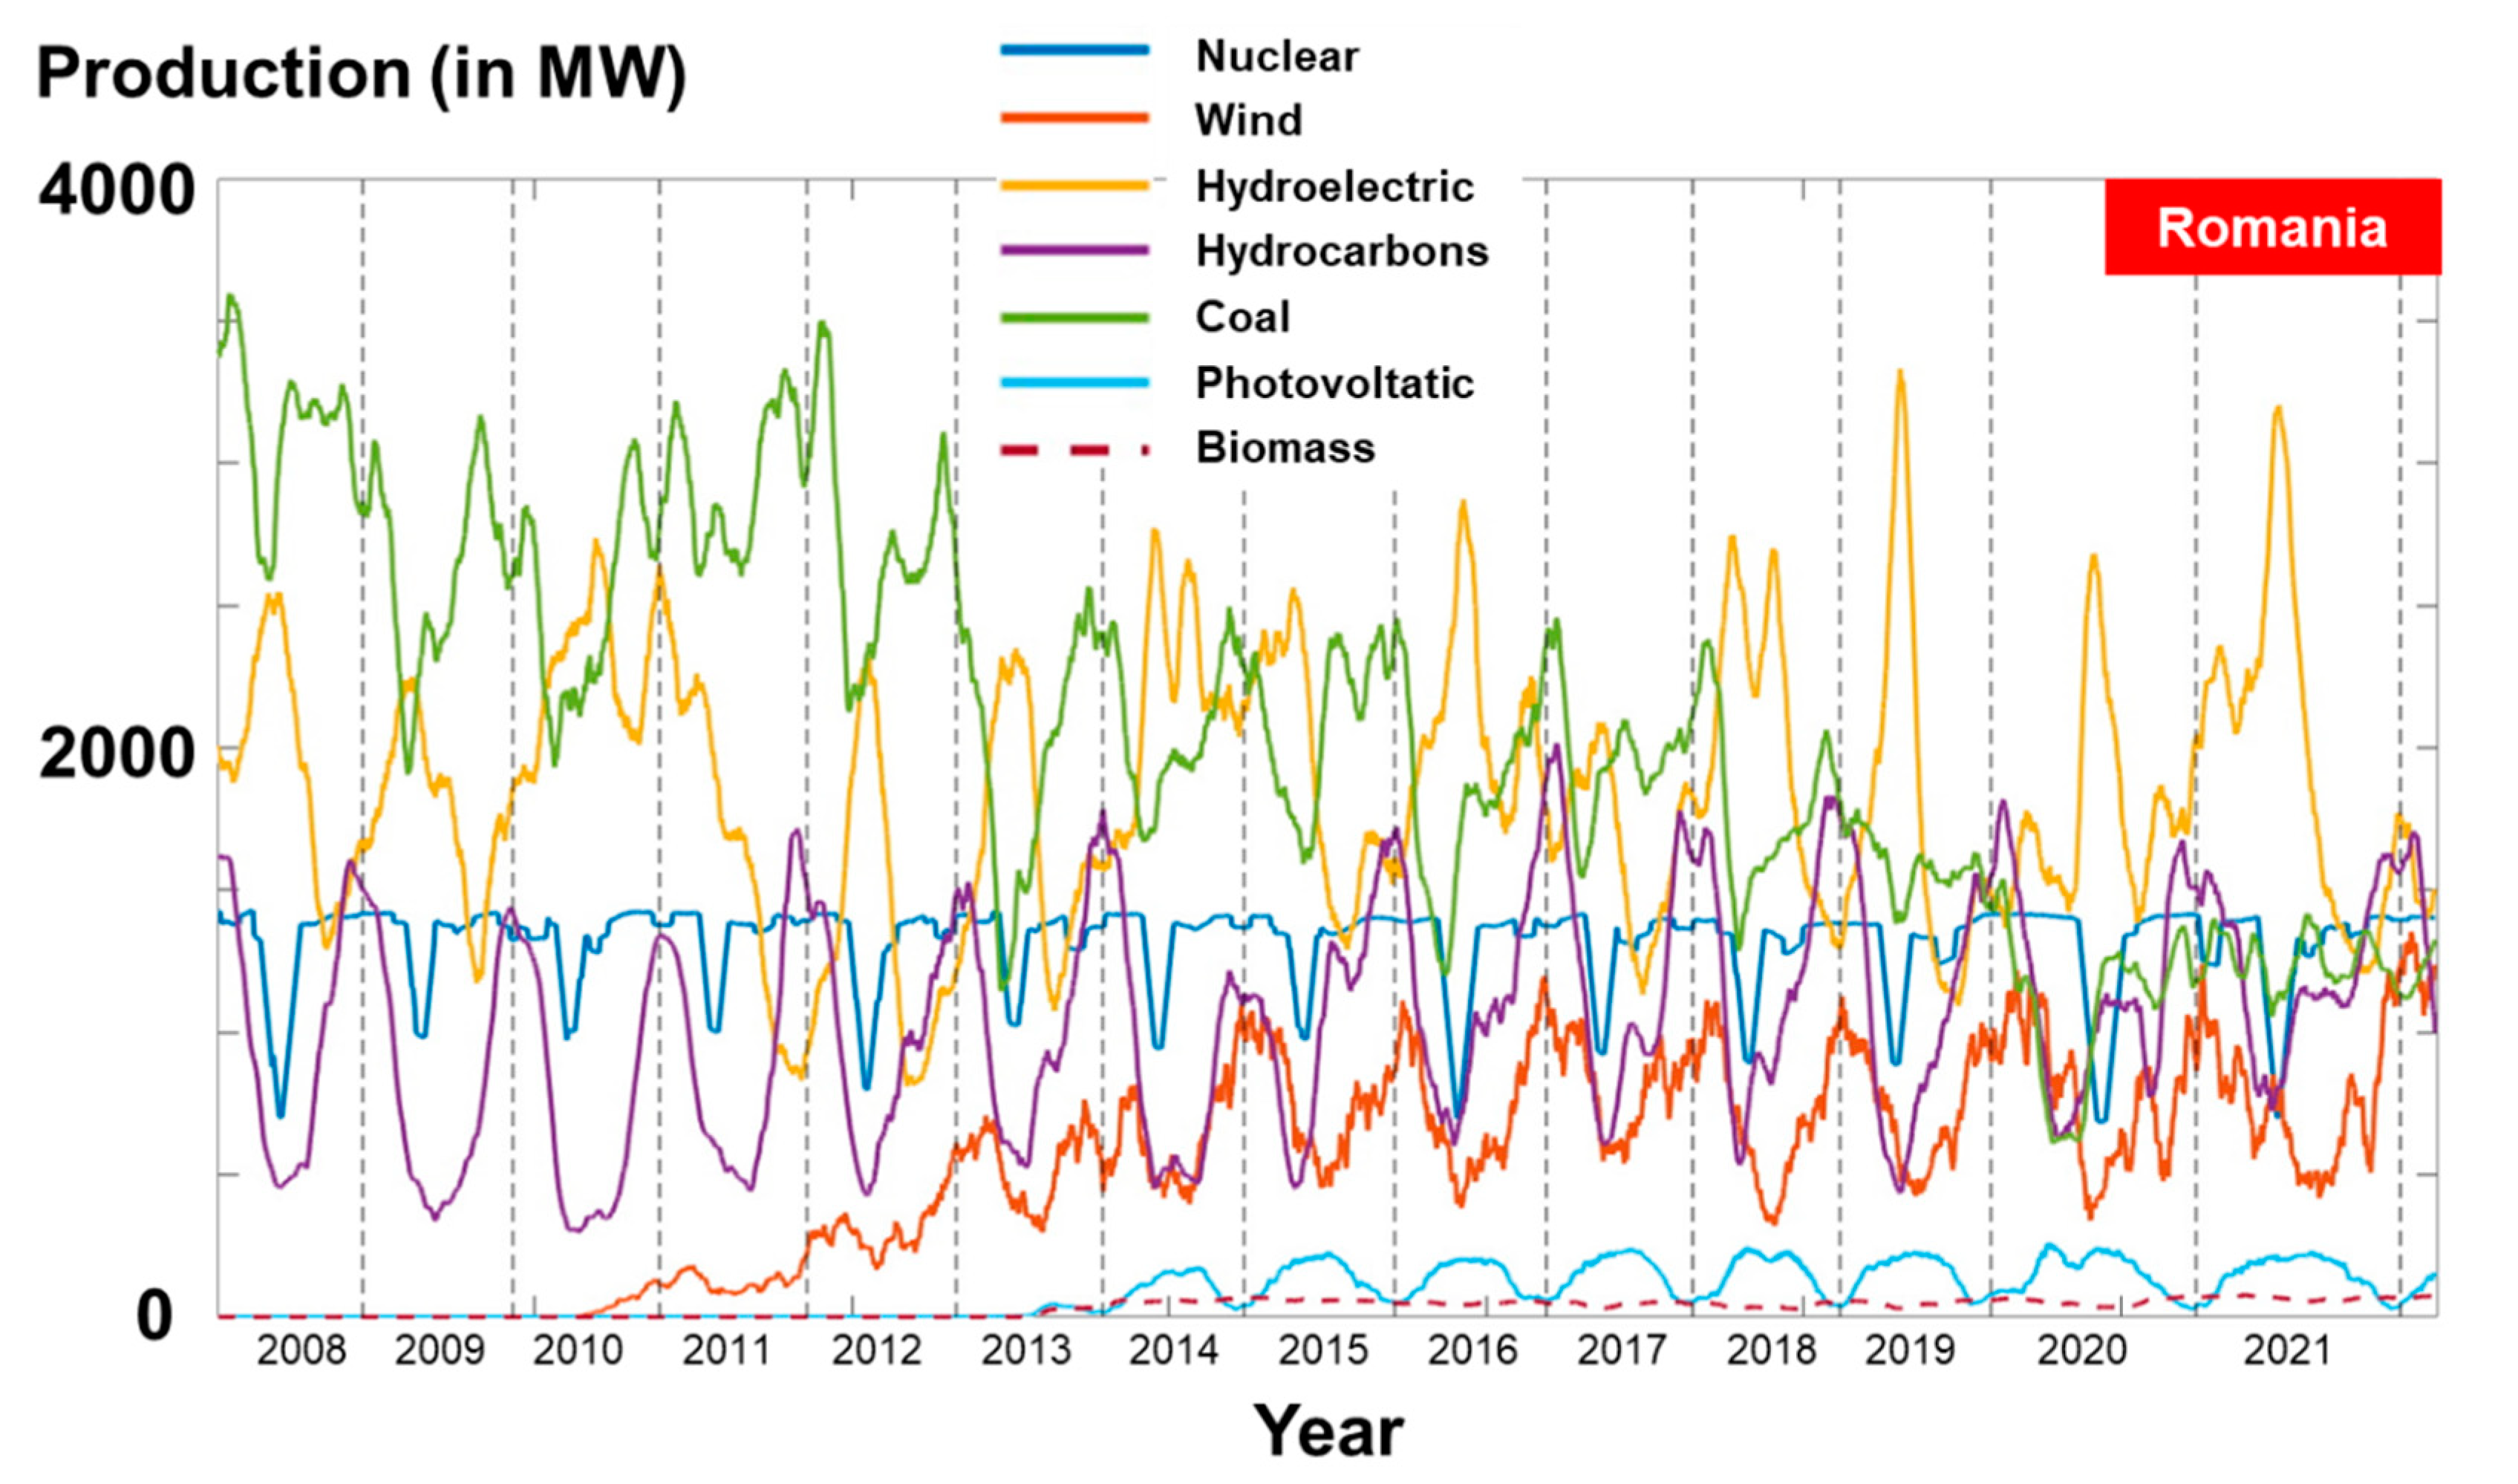
In
Figure 14, the evolution of energy production from Romania is represented in more details, by considering all the major sources. First, we need to highlight the evolution of the coal industry, which constantly decays from a production of 3500 MW (interval 2008–2012) to values located below 1500 MW at the end of 2021. From the renewable sources, the hydroelectric sector covers a significant share of production, reaching peak values that may exceed 3000 MW (year 2019). Nevertheless, this type of energy is defined by very high fluctuation being significantly affected by the occurrence of the dry seasons. The onshore wind activities start to become visible from the middle of 2010, reporting a gradual increase on a time scale, as the capacity production was accumulated. Clearly, we can see that during the wintertime the energy production goes up (ex: 1000 MW in 2015), while during the summertime this is reduced by almost 50%. At the end of 2021, the electricity obtained from the wind exceeded coal production and it was relatively close to the values obtained from the nuclear sector.
The Romanian electricity sold (average values) is presented in
Table 6 for different time intervals or particular events. For the covered time interval, the electricity sold is positive (+230 MW), which means that during most of the time Romania exported electricity, especially during the interval 2014–2016, when on average a value of 723 MW was sent outside the network. Nevertheless, during the interval 2020–2021, this balance was negative reaching a minimum of 269 MW.
This situation can get even worse during crisis events, this being the case during the coal mine strike that happened near the end of 2018 or the occurrence of the Ukrainian War in 2022. For the first event, a negative sale of 275 MW was reported (two months of strike) while for the second one a value of 327 MW is associated (25 days). It is important to mention that as an emergency solution, the Romanian government considered o accelerating the coal production for March 2022 (up to 60%) in order to supply the Paroşeni thermal power plant, that was once under insolvency [
38]. This action arises in a context where on a European level there is general agreement to close all coal power plants by the end of 2030 [
39].
As for the wind energy, at this moment there is a trend to study and to develop generators that operate at hub heights of 100 m (both onshore and offshore). For example, in the work of von Krauland et al. [
40], a wind atlas of the United States was assembled by taking into account various restrictions. More than this, a 100 m height seems to be recommended for the installation of a wind turbine, taking into account that for the onshore areas this will significantly exceed the forest vegetation and will increase the number of sites suitable for the development of such a project. For the offshore environment, it is estimated that the wind conditions from the layer located in the range of 60–100 m will be less affected by processes induced by the sea–land interface [
41].
Since sites located both onshore and offshore were considered in the present work, it is important to discuss the most possible scenarios for the development of a particular wind farm. Previous research studies highlighted the fact that an offshore site is suitable for the development of a large project, making it possible to increase the distance between the turbines and to use a larger rotor diameter. In some cases, this does not mean a much higher electricity production compared to a similar project located onshore, but will be motivated more by the economic interests, such as the rapid recovery of higher offshore costs [
42]. More than this, the offshore tendency is to use larger wind turbines that in the near future can easily reach rated capacities of 15–20 MW related to a single generator that can be installed on monopole or floating platforms, compared to the onshore sites, where the capacity of the turbines seems to be limited to 5 MW [
43,
44]. The Cogealac-Fântânele wind project (600 MW) is one of the largest onshore wind farms in Europe, located on the Dobrogea Plateau at approximately 17 km from the Black Sea. The operating hub height of the 250 generators is located at 100 m, the present work being in the line with the existing trend in this industry. On a global scale, this project is in 19th position exceeding important projects from China, United States or United Kingdom, respectively [
5,
45].
The Romanian shoreline area is well covered by the national electricity transmission network, one of these routes linking Constanta Nord to Tulcea Vest and includes transformation stations of 400/110 kW, at which we can add Isaccea with stations of 750/400 kW. These routes can definitely be adjusted to incorporate the electricity provided from an offshore wind farm, in the context where the electricity production from the coal mines located in the western part of the country will gradually reduce [
46]. Besides the grid connection, another issue is related to the environmental aspects, since the Dobrogea Plateau is located in a major migratory bat corridor. During a four-year study, a total of 2394 bat incidents were registered, associated with a rate of 14.2 bats/MW/year. Nevertheless, it is possible to reduce this fatality by over 78% if a curtailment measure is applied at a wind speed located below 6.5 m/s [
47] or eventually by using some other solutions, such as acoustic deterrents [
48].
Based on the results obtained and compared to previous works of the authors (or others), the following elements of novelties can be highlighted:
- -
For the first time, several in situ wind time series are used to quantify the variation of the wind conditions as we go from onshore to offshore (Galati-Tulcea-Braila). These results confirm the previous studies focused on spatial analysis of the wind conditions where only the reanalysis datasets (ERA-Interim, NCEP or ERA5) were processed.
- -
The differences between the hourly values (24 values) and 4 values (at 00:06:12:18 UTC) of the reanalysis dataset were carried out. For the present target area and for the time interval considered (2001–2020), there are no significant differences which indicates that much smaller data can be used to force, for example, a wave model. From the knowledge of the authors, such an evaluation was not performed yet.
- -
The MERRA-2 wind data were used for the first time for the north-western part of the Black Sea in order to assess the wind energy potential. From the comparison with the in situ data, they seem to provide a better agreement for the sites located along the shoreline, compared to ERA5. Nevertheless, this aspect needs to be further developed.
5. Conclusions
The southeastern part of Romania is defined by important wind resources and as a consequence it is targeted by the wind energy developers, with most of the projects being located between the Galati County and the shoreline of the Black Sea. According to some previous research works based on reanalysis data, it was found that the local wind energy significantly increases as we go from onshore to offshore regions, with a significant jump near the shoreline profile. In this context, for the present work a total of 20 years of data (2001–2020) were evaluated by taking into account in situ measurements from three onshore sites (Galati, Tulcea and Sulina) and two reanalysis datasets (ERA5 and MERRA-2) that also include some marine sites located near the Danube Delta. According to the in situ observations (U10), the difference between the two onshore sites (Galati and Tulcea) is quite small in terms of the average values (≈2.65 m/s), compared to Sulina where a maximum of 6.02 m/s is noticed. At this point, we can say that the Sulina site is more attractive for a wind project, with future works expected to include some offshore measurements (ex: Gloria platform) in order to confirm this trend for the marine regions. From the comparison with reanalysis data, ERA5 provides a better agreement for the onshore sites (Galati and Tulcea) in terms of the average values, while for the Sulina site (shoreline area) the MERRA-2 values are more accurate. This type of analysis was covered in general lines, the first time when MERRA-2 wind data were used for the Romanian coastal area, and as a consequence further analysis will be required in order to confirm this pattern.
In order to reduce the computational demand, for long-term/climatological studies only four values per day (00:06:12:18 UTC) are considered instead of hourly data. Coincidently (or not), the selection of these time frames seems to be suitable for these types of studies, very little differences being noticed between the two data categories. This agreement is noticed for both databases (ERA5 and MERRA-5) in terms of the average values, while for the maximum values, the four-value category always underestimates these types of events.
From the distribution of the IEC classes (U100 values—in situ data), it was highlighted that during the winter and spring periods, the dominant wind classes are C2 and C3, with C1 values (four events) briefly noticed during January, February and December. More than this, on an inter-annual level the wind profile is shifting, with more energetic wind conditions being noticed over the last 10 years (2010–2020). During the summer and autumn, most of the wind conditions fall in the category C4, which is considered to be unattractive for a wind project. For this interval, better performances might be expected in April and October, during which a C3 class frequently occurs (U100 > 7.5 m/s).
According to the downtime period (U100 < 3 m/s), the onshore Galati and Tulcea sites are defined by a lower inactivity period during the daytime (05:00–15:00 UTC), indicating that maintenance tasks should be performed during the nighttime, preferably in summer and autumn. The inactivity period can go up to 60%, compared to only 33% for the Sulina site. For the offshore sites (O1 and O2), the downtime values are directly influenced by the monthly distribution, but even so they do not exceed a maximum of 23%.
Finally, we can conclude that the Romanian wind sector is continuously expanding, constantly occurring new projects near the Black Sea coastline (onshore), and if this trend is maintained, some offshore wind farms are expected to be seen in the near future.


