Abstract
The competition between bus companies plays an important role in the effects of bus subsidy schemes for operation-sharing networks. This paper presents a bi-level programming model considering the competition to design bus subsidy schemes. In the upper sub-model, a subsidy scheme is given with the target of minimizing the total social costs (TSC). Further, in the lower sub-model, each bus company competes with other companies under the subsidy scheme. The competition is portrayed as a non-cooperative game where each company changes the departure frequency of their lines separately to obtain the maximum profit. The subsidy schemes can minimize the TSC when all bus companies pursue the maximum profit. A specific approach combining genetic algorithm and best response dynamics is proposed to solve the model. To validate the constructed model, a real-world case study is conducted in Guangzhou. From the results, as the scheme is implemented, the bus companies will be inspired to increase the line departure frequency, leading to a reduction of the passenger waiting time and performing a higher level of service. The TSC are reduced by 28.6%, among which the total waiting time costs are reduced by 43.0%. The model can guide bus subsidy scheme design for operation-sharing bus networks.
1. Introduction
With the development of cities, the problems caused by urban traffic become more and more serious. Public transport can not only relieve traffic congestion but also improve the urban living environment, reduce carbon emissions and promote urban sustainability. Therefore, public transport has been vigorously developed in many cities. To make the established public transport system more attractive, the government, on the one hand, invests in and constructs accompanying infrastructure to improve accessibility, such as the Park-and-Ride facility [1,2,3]. On the other hand, the government subsidizes bus companies to improve the performance of the bus network and the service level of passengers. From the experience of bus subsidy in the major cities of China, bus subsidy affects the operation strategies of bus companies and the performance of bus networks dramatically [4]. To improve the bus network performance, some cities have continuously increased bus subsidies, resulting in serious financial burdens and unsustainable subsidy schemes. Take Guangzhou as an example, in 2017, the bus subsidy expenditure accounted for 7.4‰ of the fiscal revenue of that year [5]. Unfortunately, it is not always true that the bus network performance will be improved so long as governments subsidize companies [6]. An improper subsidy scheme not only fails to motivate companies to improve the bus network performance but also sometimes brings negative effects. For example, a scheme with fixed subsidies would induce companies to reduce operating expenditures to get a higher profit, which damages the service quality [7]. Therefore, how to enhance the overall performance bus network (OPBN) within a subsidy budget is the main point of the bus subsidy scheme design problem (BSD).
The subsidy schemes based on key performance indicators (KPI-SCs) are implemented in many cities to hit the subsidy target. The key to designing KPI-SCs is to integrate the government objectives and the companies’ objectives based on the one-to-one relationship between the government and the companies, that is, to realize the OPBN maximization while bus companies pursue the maximum profit after implementing the KPI-SC [8,9]. These bus networks have only one company or multiple companies without interference in operating. Bus companies are regarded as a whole to pursue the maximum profit without the mutual influence between them.
However, some cities have changed the operation mode of the bus system from the monopoly of one company to sharing by multiple companies in recent years. The companies run in the same area and compete with each other [10]. In the operation-sharing network, not only the operating schemes of the bus companies will be influenced by the competition among the companies [10,11,12], but also the OPBN will become the combined result of all companies’ operations instead of the simple superposition. When integrating government objectives and companies’ objectives based on the one-to-one relationship, these two factors are not fully considered. As a result, after the government subsidizes the companies according to the designed KPI-SC, the OPBN is not always optimal while each company pursues profit maximization. Therefore, for the BSD of the operation-sharing network, when identifying the relationship between the KPI-SC and the OPBN, it is necessary to introduce competition. Only in this way can we know the influence of the KPI-SC on the OPBN and then design subsidy schemes that not only hit the government targets but are also used easily.
As shown in Figure 1, we introduced a mechanism to estimate the changes in the OPBN after a KPI-SC is implemented. Based on this mechanism, a programming model to design the subsidy schemes is proposed. The goal of this model is to minimize the total social costs (TSC) within the budget, which means the optimal OPBN is realized. Secondly, we select vehicle kilometers (VKM) as the only KPI. The subsidy scheme consists of the subsidies per VKM of each line. The government subsidizes the companies according to the scheme and the total VKMs of each line. Crucially, we give the concrete mechanism of the KPI-SC affecting the TSC. Under a KPI-SC, multiple bus companies compete with each other. They play a non-cooperative game by adjusting the departure frequency of their line to obtain maximum profit. The best response dynamics are introduced to analyze the game, and the game converges on an approximate Nash equilibrium. Finally, the corresponding TSC are worked out.
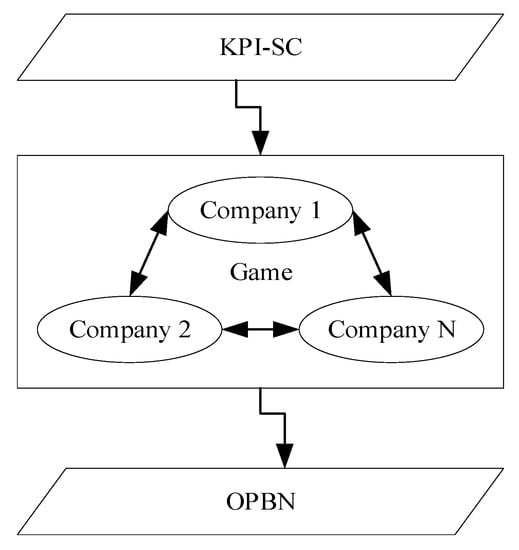
Figure 1.
Mechanism of the KPI-SC affecting the OPBN.
In China, operation-sharing networks exist in many cities. It is of broad practical value to consider competition among bus companies for BSD. This paper describes the competition as a non-cooperative game and proposes an optimization model to design a KPI-SC. The proposed model can provide guidance of BSD to the government and ensure the sustainability of bus subsidies.
This paper is organized as follows: Main findings of the literature are discussed in Section 2. In Section 3, we give the formal representations of the problem, and a bi-level programming model is specified. Section 4 presents the solution approach. A case study is conducted in Section 5, and some conclusions are drawn in Section 6.
2. Literature Reviews
In this section, we review studies about BSD and the bus competition analysis using game theory.
Previous studies of BSD always focus on the improvement of OPBN, which are the global goal from the government’s standpoint, such as maximizing social benefits [13], maximizing social surplus [8,9,14], etc. These studies identify two kinds of solutions to realize the goal. One solution establishes models to determine the allocation of subsidies by introducing economic theories, such as pricing optimization, cost-benefit analysis, and so on [13,15,16,17]. Based on the Laffont–Tirole model, Zou [13] et al. designed an incentive subsidy scheme that encourages bus companies to reduce deficits and obtain premiums, realizing the minimization of total subsidy and the maximization of social benefits. Mattson and Ripplinger [15] defined bus subsidies as the difference between average cost and marginal cost. Based on this definition, the subsidies of small and medium-sized cities were worked out to maximize social welfare. Antos [16] analyzed the costs and social benefits of the Chicago public transport system and established the framework of a public transport subsidy mechanism to relieve the pressure of public transport system financial subsidies. Many ideal assumptions about bus networks are made in these models, and some data used in these economic theories are difficult to collect. Therefore, the adaptability and operability of this kind of method are not ideal [18]. Few cities use the bus subsidy schemes designed by this kind of solution.
The second method designs KPI-SCs by introducing the incentive supervision theory [8,9,19,20,21,22]. This kind of method uses KPIs, such as VKM, vehicle-hour, ridership, etc., to establish the organic connection between the OPBN and the bus subsidy and then maximize the OPBN by optimizing the KPI-SC. The government can calculate subsidies easily according to the KPI values and the KPI-SC, which exists in the form of a subsidy contract between the government and companies. Hensher [8] and Stanley proposed a performance-based subsidy contract framework for Australia; the performance considered contains ridership, externality, minimum service levels as defined by VKM. Marshment [19] pointed out that the U.S. government allocates subsidies to public transit operators according to ranking, which mainly considers various KPIs, and comprehensively considers regional area, population, etc. Larsen [21] and Johansen et al. [22] put forward the model used by the subsidy contract of Hordaland country, Norway. In the model, revenue-VKM and bus capacity were selected as KPIs to realize the maximization of social welfare when bus companies get the maximum revenue by choosing the optimal revenue-VKM and bus capacity. The main challenge of the KPI-SC design is to integrate the goals of the government and bus companies [9]. The government not only hopes to improve the level of bus service but also hopes to pay as little subsidies as possible. However, bus companies pursue more revenue and less cost.
There are some bus competition models based on game theory, mainly non-cooperative game theory. Fisk [23] modeled and analyzed the problem of carriers competing for intercity passenger travel by introducing the Nash non-cooperative and Stackelberg games. For the bus line franchise allocation problem, Yao [10] took the competition into account, which was described as a non-cooperative game between multiple bus companies, and provided an allocation scheme with the minimum passenger travel time. Zubieta [11] modeled the competition among several lines, and Feng [12] specifically modeled the competition between overlapping lines. In their model, all lines played a non-cooperative game by adjusting the departure frequency to attract more passengers and maximize their profit. Zhou [24] presented a bi-level bus fare equilibrium model where the transit competition is portrayed as a non-cooperative game by changing the line fare structure separately to maximize the profit of each company. All of these studies about bus competition show that: (1) The competition among companies has a strong impact on the OPBN. Demsetz [25] once pointed out that competition is an effective way to improve efficiency. (2) Economic factors such as operation costs, incomes and profit mainly affect the competition. The subsidy scheme is no exception. Therefore, after the implementation of the KPI-SC, each company will adjust operating strategies to compete thoroughly, and the OPBN will change.
3. Problem Description and Modeling
3.1. Problem Description
There are two types of roles in the operation-sharing network: the government and the companies. The government regulates the operation of companies by subsidy, hoping to improve the network performance. As independent economic individuals, the companies map out operation strategies and pursue the maximum profit [24]. However, they hardly pay attention to the enhancement of network performance. Meanwhile, there exists a non-cooperative game between the companies. Take the bus network shown in Figure 2 as an example, Line1 is operated by company A, and Line2 and Line3 are operated by company B. Three lines overlap with each other, especially Line1 and Line2, which indicates that they can serve many of the same passengers. In this case, to gain more profit, the two companies will adjust their operation strategies, usually by adjusting the line departure frequency [19,20,26]. Other operation strategies, such as short-turn and limited-stop, can only be used to handle the specific passenger demand and are not often used. The departure frequency can represent the operation strategy. Company A increases the departure frequency of Line1 to serve more passengers. Similarly, company B increases the departure frequency of Line2. There is an equilibrium state when any bus company can not get a higher profit by adjusting departure frequencies separately. When the government implements a new subsidy scheme, the elements of the game change, each company will play the game to achieve a new equilibrium, and the network performance will also change with it.
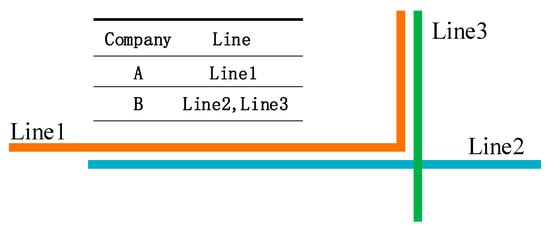
Figure 2.
A non-cooperative game between companies.
To hit the government target of enhancing the OPBN, we propose a bus subsidy scheme design model considering the non-cooperative game between bus companies, as shown in Figure 3. The upper model represents the government that designs a subsidy scheme within the budget to realize the lowest TSC. We employ the VKM as the only KPI. The subsidy scheme consists of the subsidies per VKM of each line. The VKM is the core indicator in many KPI-SCs implemented in practice. It reflects the level of services provided by bus companies [8,9] and is also closely related to bus operation costs and ridership. The TSC contains the total waiting time costs (TWC), the total variable costs (TVC) and the subsidy costs (SC). In the lower model, the companies play a non-cooperative game where the game strategy of each company consists of the departure frequency of their lines, and the goals are to maximize their own profit. The game converges to an approximate Nash equilibrium, and the departure frequency of each line is worked out. According to the equilibrium, the TSC and the total subsidies (TS) of the given scheme are obtained. Finally, the subsidy scheme with the lowest TSC is found in the upper model.
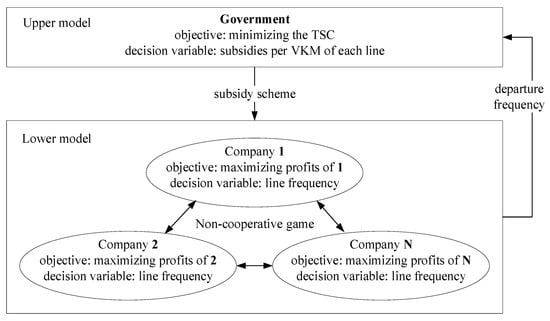
Figure 3.
Structure of the bi-level programming model.
3.2. Notations and Assumptions
The representation of the bus network in this paper is shown in Figure 4. Different lines pass the same bus stop sometimes. A station-OD is defined as a combination of a pair of different bus stops in which O refers to the bus stop where passengers enter the bus network, and D refers to the bus stop where passengers leave the bus network. Station-OD is abbreviated as OD in the following text. A section is defined as a portion between two adjacent stops on lines. If two stops are adjacent for several bus lines, the corresponding section is shared by all of the lines. The overlap among lines implies that the passengers of one OD can be served by multiple lines, and multiple lines can pass through a section. In addition, there is more than one company in the bus network where each company operates at least one line, and one line can only be operated by one company.

Figure 4.
Representation of the bus network.
The notations of the bus network used in this paper are presented in Table 1.

Table 1.
Notations of the bus network.
To eliminate the influence of some unimportant network details and focus on the key points of the problem, we make assumptions as follows:
- (i)
- For any OD , is fixed and generated evenly.
- (ii)
- For any section that line passes, is fixed.
- (iii)
- For any company , the fixed costs are constant.
Assumptions (i) and (ii) are used in many studies. In the early classical studies about bus passenger flow allocation [27,28], in order to simplify the expression and focus on key issues, these two assumptions were introduced and were inherited by many later studies [29]. For the bus subsidy scheme design problem, we focus on the long-term characteristics of passenger flow and bus travel time. From this point of view, assumptions (i) and (ii) are scientific and will not have a substantial impact on the results of the model. The fixed costs mainly include salaries of personnel except for drivers, vehicle depreciation, vehicle insurance, station rental, etc. [30]. These costs are either proportional to the fleet of vehicles or relatively stable, and they will not change with VKM. The fleet of vehicles is fixed, so the fixed costs are constant. It should be emphasized that different companies have different fixed costs.
3.3. Formulation of Bus Network Status
It can be seen from Figure 3 that the subsidy scheme is given by the upper model, and the line departure frequency under the subsidy scheme is obtained by solving the lower model. These details will be clarified in the next section. We focus on the calculation of the bus network status in this subsection. The status is calculated under the situation that the subsidy scheme and the departure frequency, namely and , of each line are given already.
When multiple lines pass the two stops of OD , these lines can serve the passengers of . The passengers always want to spend the shortest time on trips. Therefore, they will choose some of as the attractive lines to take. According to the studies of Chriqui [27] and Spiess [28], there exists a set of attractive lines for .
in which, is the power set of .
Chriqui [27] provides a heuristic algorithm to work out quickly.
Equation (1) represents the condition that when the passengers of take the bus of that arrives first, they will have the shortest expected travel time. The probability of passengers riding each line is proportional to the line departure frequency [28]. The results of the ridership assignment are from Equation (2):
where is the ridership of assigned to line .
According to Equations (1) and (2), when multiple bus lines serve the same OD, if the departure frequency of one line is higher, it will serve more passengers.
The passenger average waiting time of depends on the departure frequency of all lines [28]:
The TWC can be calculated as:
The ridership of line when passes section is given by:
The ridership of company can be calculated as:
Some of the studies pointed out that the operating costs of bus companies are divided into fixed costs and variable costs [30,31,32], and the details of these two costs are modeled in various ways [31]. The variable costs of companies generally contain driver’s wages, fuel costs, vehicle repair costs, etc. [30]. Meanwhile, using the VKM as the main output of bus companies has been extensively approved in many studies [33], and using VKM to measure the variable costs is a convention for bus companies. Therefore, we use the VMK to measure the variable costs, and the variable costs of companies are considered to vary in proportion to the total VKMs of companies [30]. Therefore, the variable costs of company can be calculated as:
Then, the TVC is expressed by:
The number of vehicles required by company is given by [10]:
The revenue of companies consists of the ticket income and the subsidy. We assume that the fixed costs are constant, so the operating costs are only affected by the variable costs. In this model, the specific value of fixed costs has no affection on the decision variable, so we set the fixed costs as zero. Thus, the profit of is the revenue minus the variable costs, that is:
The TS are the sum of all lines’ subsidies, namely:
The implementation of the subsidy scheme will bring some additional costs, that is the SC, which is given by:
3.4. Bi-Level Programming Model
Based on the calculations of the bus network status, namely Equations (1)–(12), we specify the bi-level programming model in this subsection.
The government hopes to design a subsidy scheme within budget to realize the lowest TSC for the network. The upper model is as follows.
Objective function:
Subject to:
The Objective Function (13) minimizes the TSC, which consists of the TWC, TVC and SC. Constraint (14) ensures that the subsidies are less than or equal to the budget.
In the lower model, the companies play a non-cooperative game. They change line departure frequency to get the maximum profit. Let be the game strategy of company which is a set of the departure frequency of , i.e., .
We define the non-cooperative game with a common expression, that is:
In which:
- Each company has a finite set of strategies .
- Each company adopts an operation strategy and gets the response profit .
- Let represent the combination of the operation strategies of all companies; that is, . The profit of company is defined as where = . The formula represents the profit of dependent not only on its operation strategy but also on the operation strategies of other companies. Although the profit also depends on the subsidy scheme. As a constant in the lower model, the subsidy scheme does not affect the profit as a variable. Actually, is calculated by Equation (10).
For game , there exists a Nash equilibrium state when any company adopts the operation strategy that is the best response to the other companies’ strategies. In other words, no company can obtain higher profit by separately adjusting the line departure frequency. The Nash equilibrium of game is defined as follows:
Definition 1.
For non-cooperative gameis a Nash equilibrium, if and only if:
Because the conditions satisfying Nash equilibrium are harsh, the Nash equilibrium often does not exist [34]. In practice, bus companies do not strictly pursue the highest profit. Because the adjustment of operation strategy may bring some risks and costs, when companies can’t get significantly higher profit than they get now, they won’t adjust the operation strategies. Considering the two points, we introduce approximate Nash equilibrium as a substitute for Nash equilibrium.
Definition 2.
For non-cooperative gameis an approximate Nash equilibrium, if and only if for,, such that:
whereis a small constant.
Definition 2 means that when any company cannot unilaterally adjust its operation strategy to make its profit exceed that obtained by adopting by a certain percentage , all companies will keep . Therefore, an approximate Nash equilibrium is found.
We transform the definition of approximate Nash equilibrium into another expression as follows:
Definition 3.
For non-cooperative gameis an approximate Nash equilibrium, if and only if:
Considering the constraints of government regulations and company resources in practice, the solution of the lower model should satisfy the constraints (19)–(22).
Constraint (19) is equivalent to Inequation (18), which guarantees that the solution is an approximate Nash equilibrium. Constraint (20) ensures that the frequency of each line is greater than or equal to the lower bound specified by the government. Constraint (21) indicates that the average load factor is less than or equal to the upper bound specified by the government. Meanwhile, it also ensures that all trip demands are satisfied. Constraint (22) indicates that the number of vehicles used by the companies cannot exceed the total number of vehicles owned respectively.
4. Solution Approach
4.1. Solution Procedure
An approach combining genetic algorithm and best response dynamics is used to solve the model. The solution procedure is shown in Figure 5.
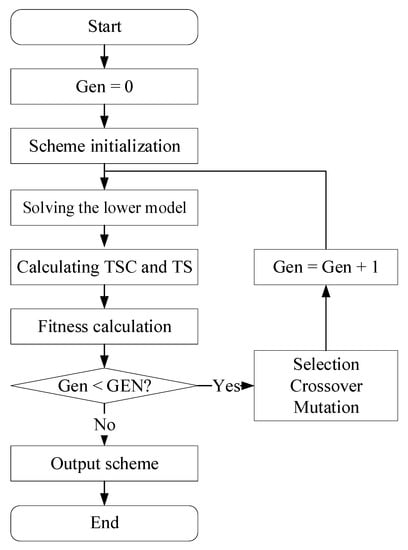
Figure 5.
Solution procedure.
Each chromosome in the population represents a subsidy scheme. The chromosome is coded by the real number. Each bit of the chromosome is the subsidy per VKM of one line. After the upper model gives the subsidy scheme, i.e., the scheme initialization, the lower model is solved by employing the best response dynamics. Then, the chromosome fitness is calculated based on the TSC and the TS. If the termination condition is satisfied, the subsidy scheme will be output. Otherwise, selection, crossover and mutation are performed in turn to produce a new generation. Finally, the procedure enters the next iteration. In the approach, GEN is a constant, indicating the maximum number of iterations. When the number of iterations equals GEN, the subsidy scheme is output.
4.2. Best Response Dynamics
We employ the best response dynamics to solve the lower model. The bus companies cannot fully know all the information about each other, such as operating costs and some resource constraints. In this case, the non-cooperative game is a game with bounded rationality [35]. The best response dynamic model is a powerful tool to analyze this kind of game. The model simulates the situation where the players are clear about their information, but cannot predict other players’ behaviors, so they can only take actions according to other players’ previous behaviors [36]. The situation is consistent with the reality of bus companies.
After the lower model receives the subsidy schemes, the bus companies start to play multiple rounds of the game. In each round, the bus companies can only determine operation strategies according to the strategies adopted by other companies in the previous round. Finally, the best response dynamics converge to an approximate Nash equilibrium. The solution process of the lower model is as the following Algorithm 1.
| Algorithm 1: The solution process of the lower model. | ||||
| Input: a chromosome representing a bus subsidy scheme | ||||
| Process: | ||||
| Initialize using a chromosome | ||||
| Initialize the strategies | ||||
| Calculate the initial profit | ||||
| Set the round flag | ||||
| While True | ||||
| for do | ||||
| End for | ||||
| Calculate | ||||
| If and satisfies the constraints (20)–(22) then | ||||
| Break | ||||
| Else | ||||
| If then | ||||
| Break | ||||
| End if | ||||
| End if | ||||
| Output: | ||||
In each round of the game, intending to maximize its profit, every company adopts the best response strategy to the strategies adopted by other companies in the previous round, namely:
where is the expected maximum profit when adopts in round .
The actual profit of in round also relies on the strategies adopted by other companies in this round, namely:
To judge if the best response dynamics converge to an approximate Nash equilibrium, we compare the expected profit with the actual profit of all companies by calculating the profit-gap ratio in each round. The profit-gap ratio of the -th round is defined as follows:
In which:
where is the actual profit of in round .
The judgment rules are as follows:
- (i)
- If , it means satisfies constraint (19). The difference between the expected profit and actual profit is small for all companies. No company will change its strategy in the -th round, and all companies will keep the strategy adopted in round − 1. Meanwhile, if satisfies Constraints (20)–(22), it will be the solution of the lower model.
- (ii)
- If , it means does not satisfy constraint (19). There exists some companies that expect to obtain significantly higher profits in the -th round than the actual profit in the ( − 1)th round. The companies will adjust their strategies in the -th round, which means that the game does not converge to an approximate Nash equilibrium. However, if , the subsidy scheme cannot regulate the operation to an equilibrium state. The bus companies will constantly adjust the departure frequency. However, the government always hopes the bus network can operate stably. For this case, we consider that the scheme should be rejected. Therefore, are all set to positive infinity, which implies the corresponding scheme is infeasible.
5. Case Study
5.1. Experiment Setup
Guangzhou is a metropolis in China. Its bus network is huge, where more than 600 bus lines are operated. The bus demand is quite high; the average daily passenger flow exceeds 4 million. As mentioned above, the bus subsidy has been a huge burden for Guangzhou. We take the local bus network composed of four lines in Guangzhou as the field test scenario. There are 103 bus stops, and the total length of lines is 76.1 km. The four lines are operated by two companies, C1 and C2, which have 42 vehicles and 40 vehicles, respectively. The four lines overlap to a certain extent, especially Line2 and Line3. The two lines share 19 stops. There exists some common ridership that can be served by any one of the two companies, showing that competition exists on the test network. It can reasonably represent the bus network in the city. The information of four lines is shown in Table 2, the corresponding network is shown in Figure 6, and the number of stops shared by lines is shown in Table 3.

Table 2.
Bus lines information.
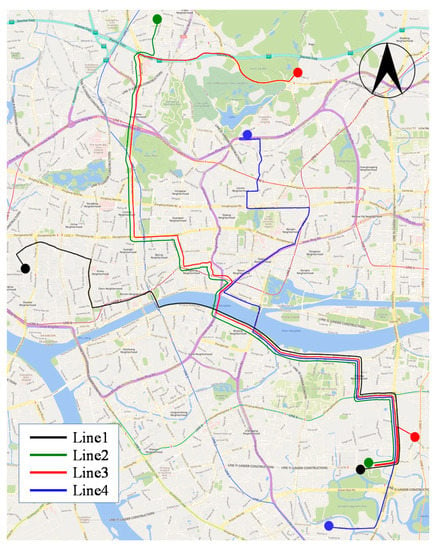
Figure 6.
Bus network.

Table 3.
The number of stops shared by lines.
We used the ridership data of four lines collected during the peak time (07:00 a.m.–09:00 a.m.) of weekdays in September 2017. On this day, the ridership was not affected by weather or epidemic diseases, and the selected period is representative. The ridership data contains the passenger boarding and alighting information. The total ridership was 6232 passengers, of which the common ridership that can be served by the two companies was 2203 passengers, and the monopolistic ridership of C1, C2 were 2400 passengers, 1629 passengers, respectively. In this period, the passenger flow was large, and the companies competed with each other fiercely. The values of the model constant parameters are shown in Table 4. All the parameters were set according to the reality of the megalopolis in China. Yuan is the unit of RMB used in China. According to the survey, the values of solution approach parameters are shown in Table 5.

Table 4.
Values of the model constant parameters.

Table 5.
Values of the solution approach parameters.
5.2. Results of Experiment
The results of subsidy schemes with and are shown in Table 6. means no subsidies. After the subsidy scheme was implemented, the TVC increased by 70.1%, and the TWC decreased by 43.0%. The TSC were reduced by 28.6%, showing that the subsidy scheme reduced the TSC effectively.

Table 6.
Costs before and after subsidy.
Figure 7 shows the convergence process of the best response dynamics under the subsidy scheme with . As the number of game rounds increased, the profit-gap ratio gradually decreased. The gap between the expected profit in the third round and the actual profit of the second round was small for C1 and C2, respectively. In the third round, the profit-gap ratio was less than 0.01, which means that both C1 and C2 no longer adjusted their operation strategies, and the game converged to an approximate equilibrium.
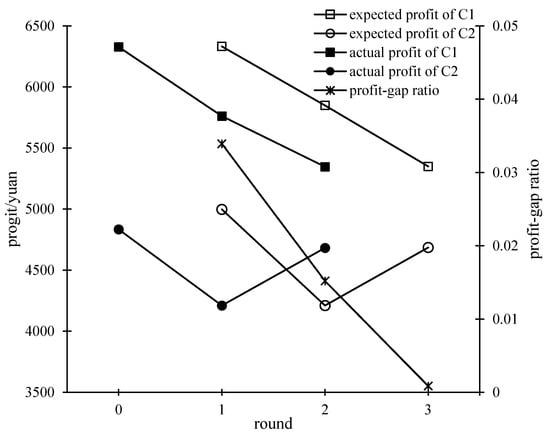
Figure 7.
Convergence process of the best response dynamics.
When the subsidy scheme is implemented, the companies will increase the departure frequency to get more subsidies and passengers. Table 7 shows the operation status of the bus network before and after the subsidy. After the subsidy scheme is implemented, both companies increase the line departure frequency. Therefore, the TVC increases, and the TWC decreases. The government spends RMB 2937.1 in subsidies, of which RMB 2214.2 is used to pay for the increased TVC, and the remaining RMB 722.9 becomes the companies’ profit. The subsidy scheme effectively motivates companies to increase the line departure frequency, realizing the decrease in TSC.

Table 7.
Operation status of the bus network before and after the subsidy.
The difference in of each line is apparent. Specifically, the of Line2 and Line3 is lower than that of Line1 and Line4. It can be seen from Table 3 and Figure 6 that Line2 and Line3 overlap more, and they belong to two companies, respectively. The competition between the two lines is stiffer. Overall, the values of the two lines illustrate that fewer subsidies can encourage the lines to increase departure frequency. Moreover, a lot of passengers can be served by the two lines at the same time. The waiting times for these passengers are already low. Therefore, there is no need to allocate more subsidies to enhance the departure frequency of the two lines. On the contrary, Line1 and Line4 have less overlap with the other three lines, indicating that the passenger waiting time is relatively high. More subsidies are required to encourage the companies to increase the departure frequency, thereby effectively reducing the waiting times.
5.3. Budget Constraint and Efficiency of Subsidy Scheme
Different governments may set different subsidy budgets. We discuss the influence of the budget on subsidy effects. The costs of bus subsidy schemes under different budgets are shown in Figure 8. With the budget increase, the TVC and the SC increase gradually, while the TWC and the TSC decrease gradually. The TSC decrease more slowly and finally are reduced to a fixed value. When the budget increases from RMB 4000 to 5000, the TSC remain unchanged. The reason lies in that the increment of the sum of TVC and SC is equal to the reduction of TWC when the budget increases beyond RMB 4000. Even if the government is willing to offer more subsidies, the TSC will not fall again.
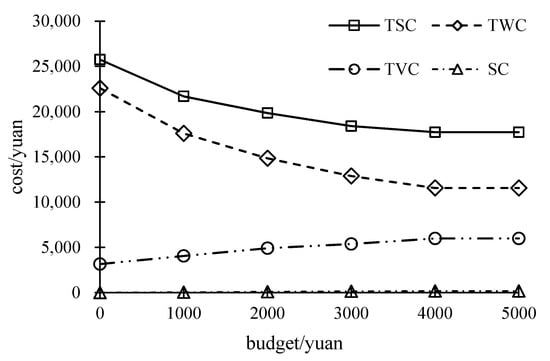
Figure 8.
Costs of subsidy schemes under different budgets.
We define the efficiency of the subsidy scheme as Equation (28):
where is the TSC with no subsidy and is constant. is the average reduction of TSC to which the government spending per yuan on subsidy contributes.
We also change the relationship between bus lines and companies to discuss the impact of the relationship on . Let Line1 and Line4 be operated by C1, Line2 and Line3 be operated by C2. This relationship is notated as relationship B, and the original relationship in Table 2 is notated as relationship A. Under different budgets, the comparison of between the two relationships is shown in Figure 9.
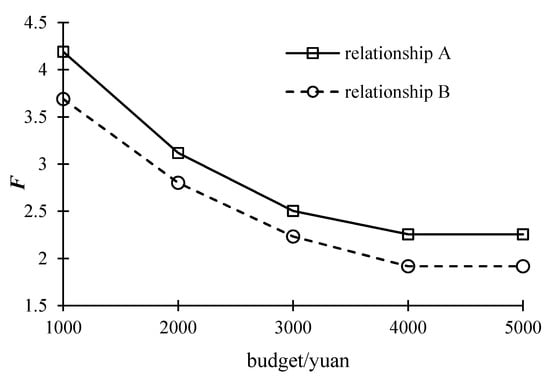
Figure 9.
Efficiency of the subsidy schemes.
It can be seen that: (i) Whether we follow relationship A or relationship B, with the budget increase, the subsidy efficiency gradually decreases. Figure 8 implies that the more subsidies the government offers, the lower TSC are realized, but the average reduction of TSC per RMB subsidy becomes lower. (ii) The subsidy efficiency of relationship B is lower than that of relationship A under each budget, which indicates that for relationship B, more subsidies are needed to reduce the TSC. In relationship B, Line2 and Line3 belong to the same bus company, which means that the competition among companies is not sufficient comparing that of relationship A. Each company monopolizes its passenger market to a certain extent. It is difficult to encourage companies to increase the line departure frequency.
6. Conclusions
In this study, we propose a bi-level programming model, introducing the competition between bus companies, to design a KPI-SC. The model portrays the competition as a non-cooperative game. Based on this, the relationship between the KPI-SC and the TSC is established, which realizes the OPBN maximization when the bus companies pursue the maximum profit. By solving the model, a KPI-SC that consists of the subsidies per VKM of each line is obtained. The government can subsidize the companies according to the total VKMs of each line and the KIP-SC easily, realizing the lowest TSC. The proposed model can provide guidance of BSD to the government and ensure the sustainability of bus subsidies.
Through the case study of Guangzhou, it is found that the subsidy scheme worked out by this model can motivate companies to increase the departure frequency of each line. The total waiting costs and the total social costs are reduced when the total variable costs are increased. By analyzing the details of the subsidy scheme, we find that the subsidies for different lines are different. The subsidies for lines that have more overlap with other lines are relatively low. In fact, the waiting time of passengers who take overlap lines is relatively low [27]. It is arguably unnecessary to allocate more subsidies on the overlap lines. On the contrary, the lines with fewer overlaps get more subsidies. It shows that the scheme can allocate subsidies reasonably according to the actual service quality. Not only is the distribution result consistent with our experience, but also a more accurate subsidy distribution is realized.
We analyze the influence of the budget constraint on the subsidy scheme and the efficiency of the subsidy scheme. It is found that the more the government subsidizes companies, the lower total social costs are realized. However, the lower subsidy efficiency is worked out. With the subsidy increasing, the departure frequency of lines increases and the waiting time of passengers decreases. It is more and more difficult to reduce the total social costs, implying that the marginal utility of subsidies is decreasing gradually. For some cities with tight revenue, they can choose to offer fewer subsidies to realize a relatively effective improvement of the bus network efficiency. Next, discuss the influence of the operation relationship on the subsidy efficiency. In an insufficiently competitive bus network, the subsidy scheme works out unsatisfied results with lower subsidy efficiency, which indicates the limitation of the model. In other words, enough competition among companies is an essential precondition for creating an effective subsidy scheme for the model. This also enlightens us on the problem. By adjusting the franchise of bus lines, we can make the competition more sufficient [10], thus increasing the subsidy efficiency and reducing subsidies.
Based on the results, some suggestions and policies can be considered by the government:
- (i)
- For operation-sharing networks, when the government designs subsidy schemes, it is necessary to consider and make use of the competition between bus companies, which can effectively reduce the total social costs.
- (ii)
- With the subsidies increasing, the marginal utility is decreasing. The bus network with fiercer competition has better subsidy efficiency. When the government hardly improves the service quality and reduces the social costs by subsidy, restructuring the bus network into a more competitive one can be a method worth considering. In fact, many cities are implementing this kind of plan at present.
- (iii)
- Different lines should allocate different subsidies. In particular, there should be fewer subsidies for lines with more overlap.
Considering the results and limitations in this paper, some extensions could be developed:
- (i)
- While designing subsidy schemes, we can consider the franchise allocation of lines, and design the allocation scheme and subsidy scheme at the same time, achieving lower total social costs with fewer subsidies.
- (ii)
- We assume that the demand is fixed, but in fact, as the departure frequency increases, the demand for buses may increase, which is not considered in the model. In the future, we will consider the change in demand to make the model more realistic.
- (iii)
- Additionally, we only design the VKM-oriented subsidy scheme. There exist other subsidy modes such as the ridership-oriented mode and mixed-mode, etc. Different modes are suitable for different development stages of the bus network. For this, we will connect the bus subsidy mode with the bus network development stages, realizing the generalization of the model.
Author Contributions
Conceptualization, S.J. and Z.H.; Data curation, S.J. and J.Z.; Formal analysis, S.J. and J.Z.; Funding acquisition, Z.H.; Methodology, S.J. and Z.H.; Project administration, S.J. and J.Z.; Resources, Z.H.; Supervision, Z.H.; Validation, S.J.; Visualization, S.J. and J.Z.; Writing—original draft, S.J.; Writing—review & editing, S.J., J.Z. and Z.H. All authors have read and agreed to the published version of the manuscript.
Funding
This study has not received external funding.
Institutional Review Board Statement
Not applicable.
Informed Consent Statement
Not applicable.
Data Availability Statement
Not applicable.
Conflicts of Interest
The authors declare no conflict of interest.
References
- Macioszek, E.; Kurek, A. The analysis of the factors determining the choice of park and ride facility using a multinomial logit model. Energies 2021, 14, 203. [Google Scholar] [CrossRef]
- Kitthamkesorn, S.; Chen, A.; Opasanon, S.; Jaita, S.A. P-Hub Location Problem for Determining Park-and-Ride Facility Locations with the Weibit-Based Choice Model. Sustainability 2021, 13, 7928. [Google Scholar] [CrossRef]
- Macioszek, E.; Kurek, A. P&R parking and bike-sharing system as solutions supporting transport accessibility of the city. Transp. Probl. 2020, 15, 275–286. [Google Scholar]
- Zeng, W.D. The Reform of Bus Subsidy Under the New Situation—Taking the Shenzhen’s New Round of Subsidies as an Example. Traffic Transp. 2020, 33, 204–208. [Google Scholar]
- Guangzhou Municipal Finance Bureau. Brief Report on Performance Evaluation of Special Funds Financial Expenditure of Guangzhou Public Transport Financial Subsidy Project in 2017. Available online: http://czj.gz.gov.cn/GZ11/6.6/201812/a45d6d1ae3a44b80adcd6788c34e6c3e/files/cb2ff3a890ee47eeb6e353503c4e6ec4.pdf (accessed on 15 June 2018).
- Xue, Y.; Guan, H.; Corey, J.; Wei, H.; Yan, H. Quantifying. a financially sustainable strategy of public transport: Private capital investment considering passenger value. Sustainability 2017, 9, 269. [Google Scholar] [CrossRef]
- Hensher, D.A.; Ho, C.; Knowles, L. Efficient contracting and incentive agreements between regulators and bus operators: The influence of risk preferences of contracting agents on contract choice. Transp. Res. Part A Policy Pract. 2016, 87, 22–40. [Google Scholar] [CrossRef]
- Hensher, D.A.; Stanley, J. Performance-based quality contracts in bus service provision. Transp. Res. Part A Policy Pract. 2003, 37, 519–538. [Google Scholar] [CrossRef]
- Hensher, D.A.; Houghton, E. Performance-based quality contracts for the bus sector: Delivering social and commercial value for money. Transp. Res. Part B Methodol. 2004, 38, 123–146. [Google Scholar] [CrossRef]
- Yao, B.; Chen, C.; Zhang, L.; Feng, T.; Yu, B.; Wang, Y. Allocation method for transit lines considering the user equilibrium for operators. Transp. Res. Part C Emerg. Technol. 2019, 105, 666–682. [Google Scholar] [CrossRef]
- Zubieta, L. A network equilibrium model for oligopolistic competition in city bus services. Transp. Res. Part B Methodol. 1998, 32, 413–422. [Google Scholar] [CrossRef]
- Feng, S.; Hu, B.; Nie, C.; Shen, X.; Ci, Y. Game-based competition models between bus routes. J. Urban Plan. Dev. 2016, 142, 04015022. [Google Scholar] [CrossRef]
- Zou, W.; Yu, M.; Mizokami, S. Mechanism design for an incentive subsidy scheme for bus transport. Sustainability 2019, 11, 1740. [Google Scholar] [CrossRef]
- Qin, F.; Zhang, X. Designing an optimal subsidy scheme to reduce emissions for a competitive urban transport market. Sustainability 2015, 7, 11933–11948. [Google Scholar] [CrossRef]
- Mattson, J.; Ripplinger, D. Marginal cost pricing and subsidy of small urban transit. Transp. Res. Rec. 2012, 2274, 77–83. [Google Scholar] [CrossRef]
- Antos, J.D. Paying for Public Transportation: The Optimal, the Actual, and the Possible. Ph.D. Thesis, Massachusetts Institute of Technology, Cambridge, MA, USA, 2007. [Google Scholar]
- Glaister, S.; Lewis, D. An integrated fares policy for transport in London. J. Public Econ. 1978, 9, 341–355. [Google Scholar] [CrossRef]
- Elgar, I.; Kennedy, C. Review of optimal transit subsidies: Comparison between models. J. Urban Plan. Dev. 2005, 131, 71–78. [Google Scholar] [CrossRef]
- Marshment, R.S. Assessment of state procedures for allocating Section 5311 subsidies to rural public transit operators. Transp. Res. Rec. 1998, 1623, 63–67. [Google Scholar] [CrossRef]
- Matherly, D. Developing a performance-based transit allocation formula: Case study for a participatory process. Transp. Res. Rec. 1997, 1604, 83–91. [Google Scholar] [CrossRef]
- Larsen, O.I. Designing Incentive Schemes for Public Transport Operators in Hordaland County, Norway. In Proceedings of the 7th International Conference on Competition and Ownership of Land Passenger Transport, Molde, Norway, 25–28 June 2001. [Google Scholar]
- Johansen, K.W.; Larsen, O.I.; Norheim, B. Towards economic efficiency in public transport. J. Transp. Econ. Policy 2001, 35, 491–511. [Google Scholar]
- Fisk, C.S. Game theory and transportation systems modelling. Transp. Res. Part B Methodol. 1984, 18, 301–313. [Google Scholar] [CrossRef]
- Zhou, J.; Lam, W.H.; Heydecker, B.G. The generalized Nash equilibrium model for oligopolistic transit market with elastic demand. Transp. Res. Part B Methodol. 2005, 39, 519–544. [Google Scholar] [CrossRef]
- Demsetz, H. Why regulate utilities? J. Law Econ. 1968, 11, 55–65. [Google Scholar] [CrossRef]
- Forkenbrock, D.J.; Dueker, K.J. Transit assistance allocation. Transp. Res. Part A Gen. 1979, 13, 317–327. [Google Scholar] [CrossRef]
- Chriqui, C.; Robillard, P. Common bus lines. Transp. Sci. 1975, 9, 115–121. [Google Scholar] [CrossRef]
- Spiess, H.; Florian, M. Optimal strategies: A new assignment model for transit networks. Transp. Res. Part B Methodol. 1989, 23, 83–102. [Google Scholar] [CrossRef]
- Delle Site, P.; Filippi, F. Service optimization for bus corridors with short-turn strategies and variable vehicle size. Transp. Res. Part A Policy Pract. 1998, 32, 19–38. [Google Scholar] [CrossRef]
- Huang, X. Application of Variable Cost of Public Transport Enterprises in Optimizing Operational Kilometers. Financ. Account. Commun. 2014, 9, 56–58. [Google Scholar]
- Bunte, S.; Kliewer, N. An overview on vehicle scheduling models. Public Transp. 2009, 1, 299–317. [Google Scholar] [CrossRef]
- Hassold, S.; Ceder, A.A. Public transport vehicle scheduling featuring multiple vehicle types. Transp. Res. Part B Methodol. 2014, 67, 129–143. [Google Scholar] [CrossRef]
- Croissant, Y.; Roy, W.; Canton, J. Reducing urban public transport costs by tendering lots: A panel data estimation. Appl. Econ. 2013, 45, 3711–3722. [Google Scholar] [CrossRef]
- Brandt, F.; Fischer, F.; Holzer, M. Symmetries and the complexity of pure Nash equilibrium. J. Comput. Syst. Sci. 2009, 75, 163–177. [Google Scholar] [CrossRef][Green Version]
- Sun, L.J. Study on Models and Algorithms of Urban Transit System Based on Game Theory. Ph.D. Thesis, Beijing Jiaotong University, Beijing, China, 2009. [Google Scholar]
- Xie, Y.S. Economic Game Theory; Fudan University Press: Shanghai, China, 2002. [Google Scholar]
Publisher’s Note: MDPI stays neutral with regard to jurisdictional claims in published maps and institutional affiliations. |
© 2022 by the authors. Licensee MDPI, Basel, Switzerland. This article is an open access article distributed under the terms and conditions of the Creative Commons Attribution (CC BY) license (https://creativecommons.org/licenses/by/4.0/).