
Temporal and Spatial Evolution of Coupling Coordination Degree of Industrial Innovation Ecosystem—From the Perspective of Green Transformation


Abstract
:1. Introduction
2. Literature Review
3. Theoretical Model of Industrial Innovation Ecosystem
3.1. Knowledge Subsystem
3.2. Innovation Subsystem
3.3. Industrial Subsystem
4. Construction of Comprehensive Index System of Industrial Innovation Ecosystem
4.1. Construction of Comprehensive Evaluation Index System
4.2. Data Source and Processing
5. Temporal and Spatial Pattern of Coupling Coordination Degree of Industrial Innovation Ecosystem
5.1. Comprehensive Evaluation Level of Subsystem
5.2. Measurement of Coupling Coordination Degree
5.3. Spatiotemporal Distribution Characteristics of Coupling Coordination Degree
5.4. Trend Surface Analysis of Coupling Coordination Degree
6. Spatial Connection of Coupling and Coordination Degree of Industrial Innovation Ecological Subsystem
6.1. Gravity Model
6.2. Space Potential Energy Value

| Year | 2010 | 2013 | 2016 | 2019 | 2020 | 2021 | 2010 | 2013 | 2017 | 2019 | 2020 | 2021 |
|---|---|---|---|---|---|---|---|---|---|---|---|---|
| Region | Spatial Potential Energy | Proportion | ||||||||||
| Beijing | 75.792 | 81.786 | 87.652 | 99.006 | 102.429 | 107.373 | 18.053% | 17.826% | 17.765% | 17.931% | 17.937% | 18.009% |
| Tianjin | 43.412 | 47.178 | 50.391 | 54.183 | 56.441 | 59.406 | 10.273% | 10.167% | 9.567% | 9.457% | 9.851% | 10.369% |
| Hebei | 72.529 | 79.943 | 84.064 | 93.357 | 97.317 | 102.476 | 17.163% | 17.228% | 15.961% | 16.295% | 16.986% | 17.887% |
| Shanxi | 11.235 | 12.045 | 12.580 | 14.171 | 14.264 | 15.115 | 2.659% | 2.596% | 2.388% | 2.473% | 2.490% | 2.638% |
| Nei Mongol | 5.043 | 5.610 | 5.843 | 6.488 | 6.513 | 6.905 | 1.193% | 1.209% | 1.109% | 1.132% | 1.137% | 1.205% |
| Liaoning | 7.722 | 8.354 | 8.587 | 9.273 | 9.440 | 9.892 | 1.827% | 1.800% | 1.630% | 1.619% | 1.648% | 1.727% |
| Jilin | 4.850 | 5.117 | 5.335 | 5.797 | 5.875 | 6.154 | 1.148% | 1.103% | 1.013% | 1.012% | 1.025% | 1.074% |
| Heilongjiang | 2.819 | 2.950 | 3.150 | 3.328 | 3.411 | 3.564 | 0.667% | 0.636% | 0.598% | 0.581% | 0.595% | 0.622% |
| Shanghai | 14.923 | 16.374 | 18.242 | 20.939 | 21.484 | 22.279 | 3.531% | 3.529% | 3.464% | 3.655% | 3.750% | 3.889% |
| Jiangsu | 18.257 | 21.276 | 23.795 | 27.375 | 28.785 | 29.784 | 4.320% | 4.585% | 4.518% | 4.778% | 5.024% | 5.199% |
| Zhejiang | 12.972 | 14.450 | 16.075 | 18.652 | 19.254 | 19.942 | 3.070% | 3.114% | 3.052% | 3.256% | 3.361% | 3.481% |
| Anhui | 15.266 | 16.997 | 18.866 | 21.079 | 22.083 | 22.875 | 3.612% | 3.663% | 3.582% | 3.679% | 3.854% | 3.993% |
| Fujian | 8.506 | 9.243 | 10.184 | 11.636 | 11.834 | 12.362 | 2.013% | 1.992% | 1.934% | 2.031% | 2.066% | 2.158% |
| Jiangxi | 10.771 | 11.268 | 12.095 | 13.841 | 13.949 | 14.511 | 2.549% | 2.428% | 2.296% | 2.416% | 2.435% | 2.533% |
| Shandong | 15.029 | 17.262 | 18.563 | 20.364 | 21.773 | 22.873 | 3.556% | 3.720% | 3.524% | 3.555% | 3.800% | 3.992% |
| Henan | 12.528 | 14.066 | 15.198 | 17.021 | 17.568 | 18.369 | 2.965% | 3.031% | 2.886% | 2.971% | 3.066% | 3.206% |
| Hubei | 12.715 | 13.934 | 15.155 | 17.046 | 17.607 | 18.296 | 3.009% | 3.003% | 2.877% | 2.975% | 3.073% | 3.193% |
| Hunan | 10.286 | 11.067 | 11.889 | 13.490 | 13.828 | 14.362 | 2.434% | 2.385% | 2.257% | 2.355% | 2.414% | 2.507% |
| Guangdong | 7.337 | 8.031 | 9.380 | 11.529 | 11.858 | 12.248 | 1.736% | 1.731% | 1.781% | 2.012% | 2.070% | 2.138% |
| Guangxi | 6.285 | 6.610 | 7.134 | 7.903 | 8.166 | 8.345 | 1.487% | 1.424% | 1.354% | 1.379% | 1.425% | 1.457% |
| Hainan | 2.779 | 2.966 | 3.177 | 3.462 | 3.599 | 3.671 | 0.658% | 0.639% | 0.603% | 0.604% | 0.628% | 0.641% |
| Chongqing | 8.475 | 9.059 | 9.924 | 11.011 | 11.357 | 11.719 | 2.006% | 1.952% | 1.884% | 1.922% | 1.982% | 2.045% |
| Sichuan | 5.789 | 6.184 | 6.765 | 7.546 | 7.776 | 7.964 | 1.370% | 1.333% | 1.284% | 1.317% | 1.357% | 1.390% |
| Guizhou | 7.082 | 7.397 | 7.973 | 8.749 | 9.016 | 9.221 | 1.676% | 1.594% | 1.514% | 1.527% | 1.574% | 1.610% |
| Yunnan | 3.306 | 3.529 | 3.794 | 4.216 | 4.294 | 4.414 | 0.782% | 0.760% | 0.720% | 0.736% | 0.749% | 0.770% |
| Shaanxi | 10.128 | 11.043 | 11.793 | 13.605 | 13.780 | 14.269 | 2.397% | 2.380% | 2.239% | 2.375% | 2.405% | 2.491% |
| Gansu | 4.214 | 4.559 | 4.693 | 5.067 | 5.134 | 5.268 | 0.997% | 0.982% | 0.891% | 0.884% | 0.896% | 0.920% |
| Qinghai | 2.506 | 2.679 | 2.770 | 2.984 | 3.017 | 3.083 | 0.593% | 0.577% | 0.526% | 0.521% | 0.527% | 0.538% |
| Ningxia | 6.372 | 6.864 | 7.304 | 7.909 | 8.046 | 8.297 | 1.508% | 1.479% | 1.387% | 1.381% | 1.404% | 1.448% |
| Xinjiang | 0.911 | 0.966 | 1.023 | 1.133 | 1.142 | 1.176 | 0.216% | 0.208% | 0.194% | 0.198% | 0.199% | 0.205% |
7. Conclusions, Managerial Implications, and Research Limitations
7.1. Main Conclusions
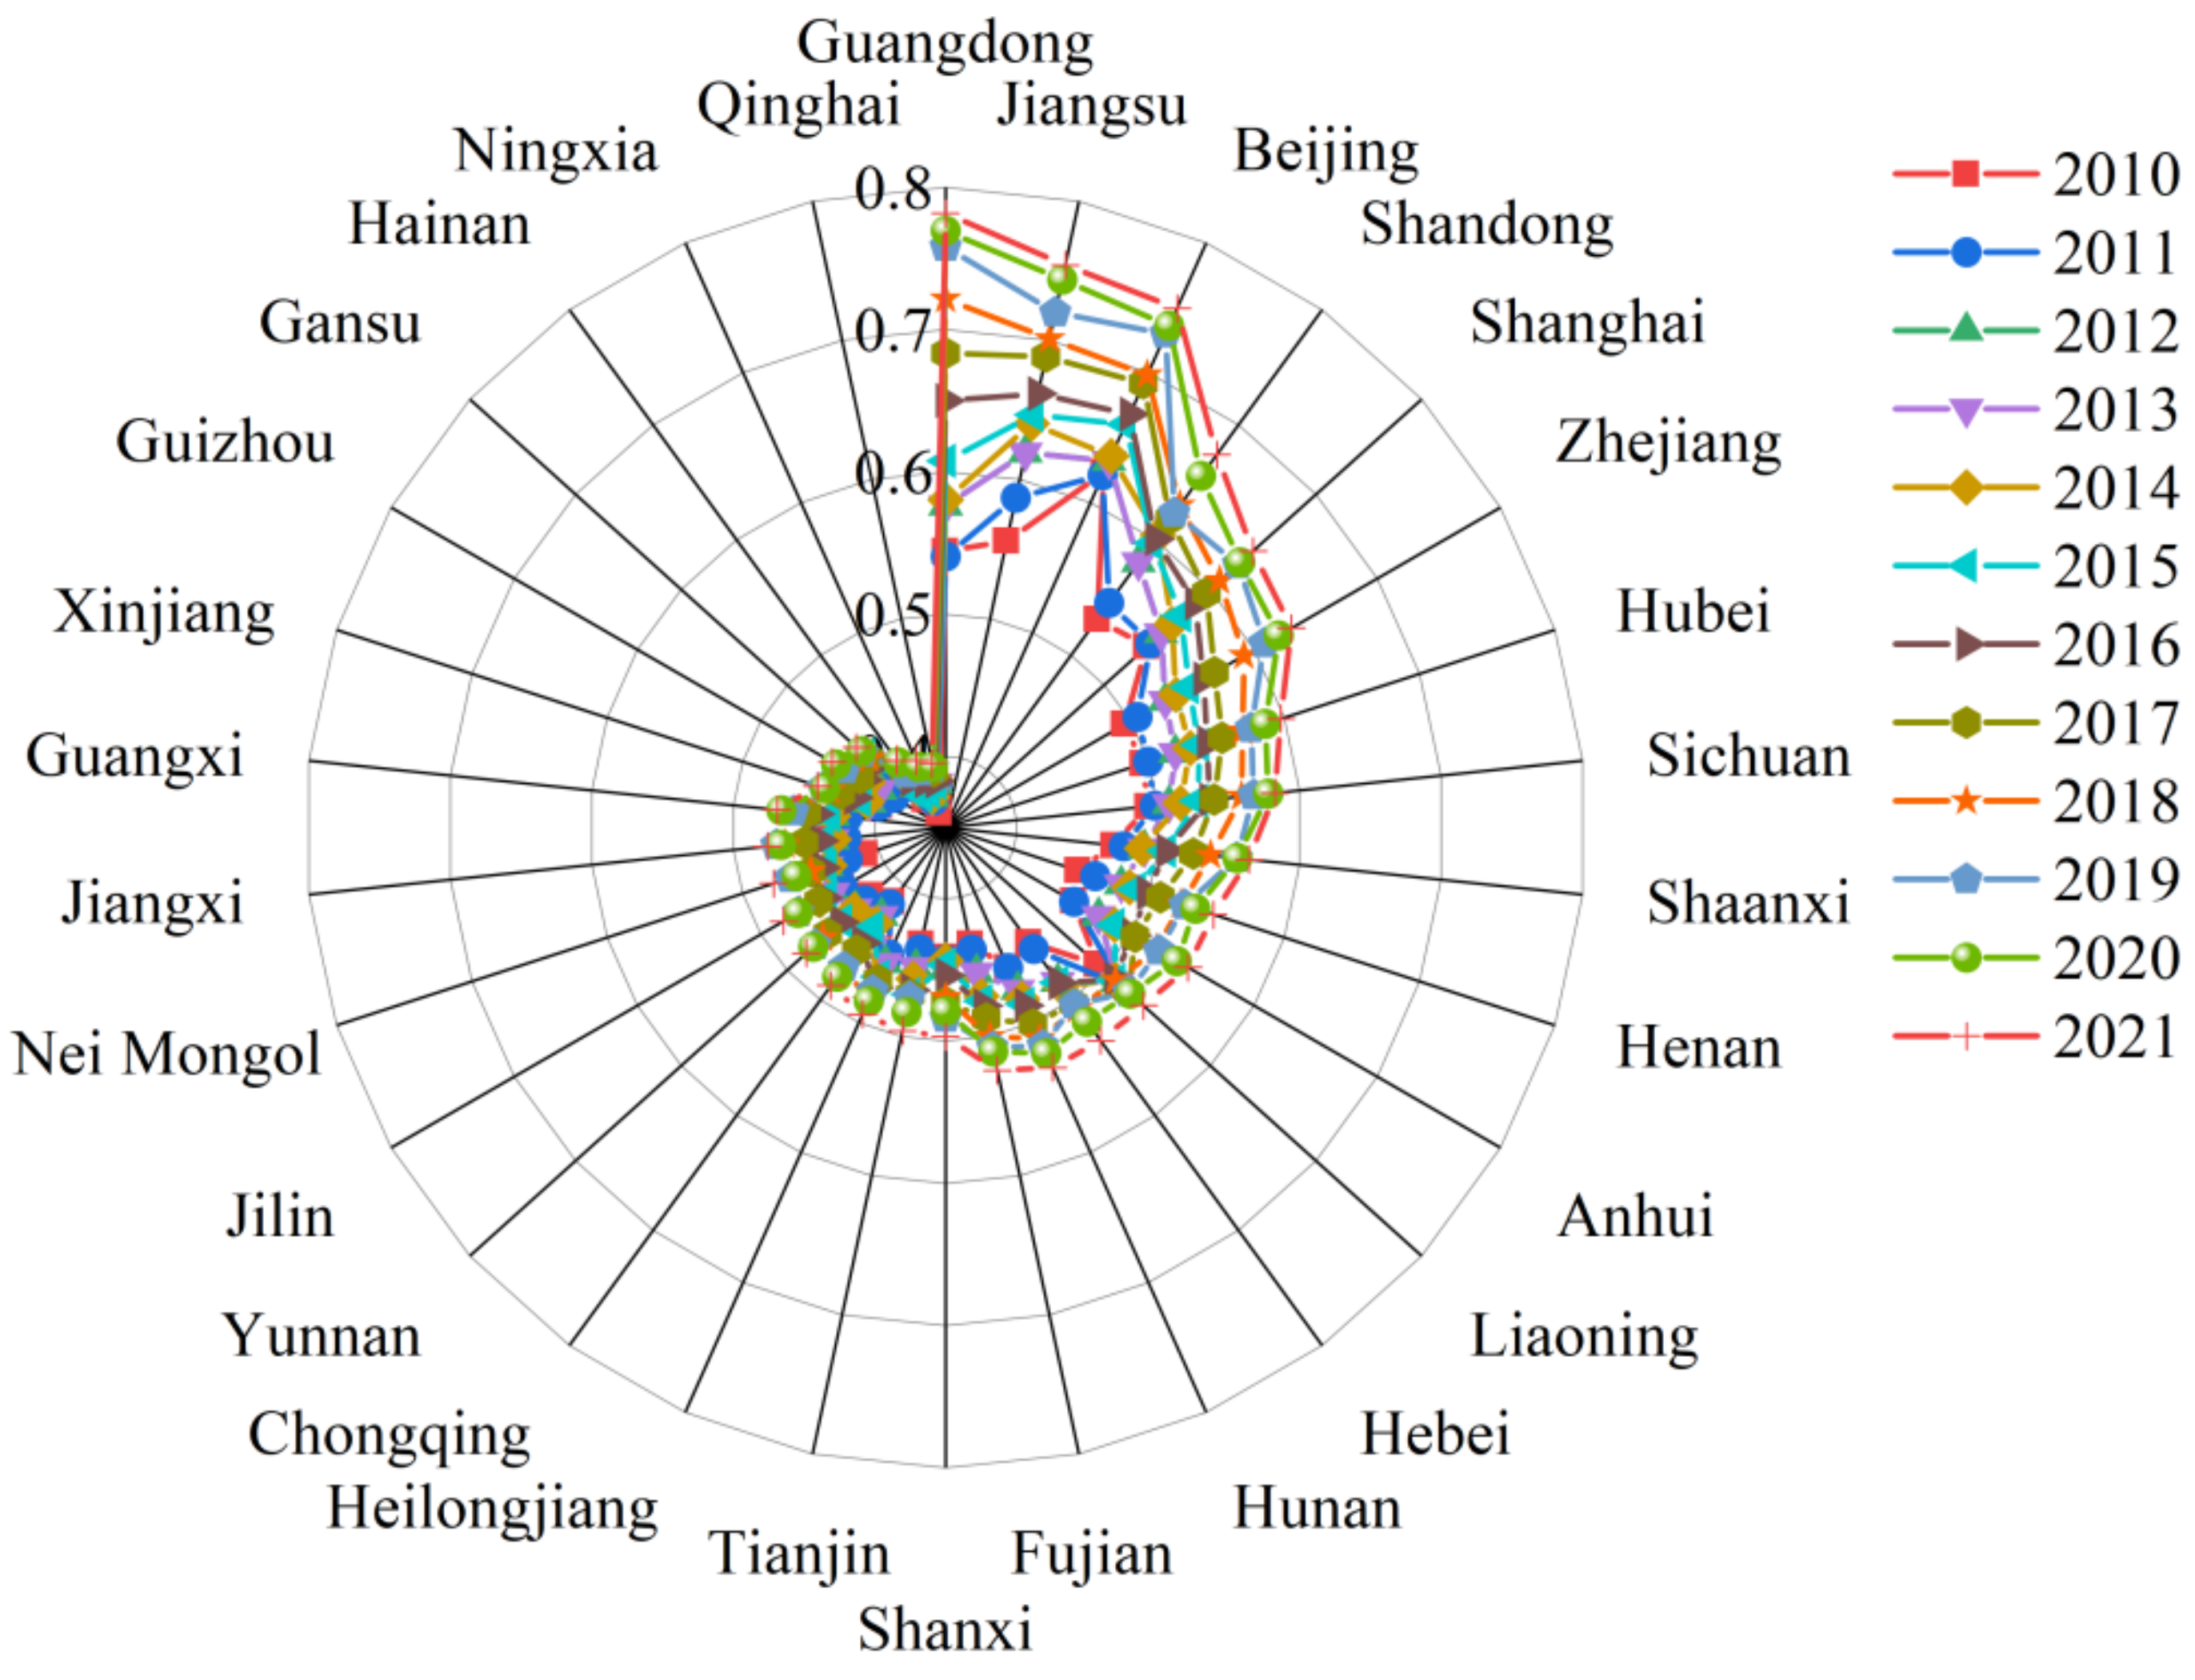
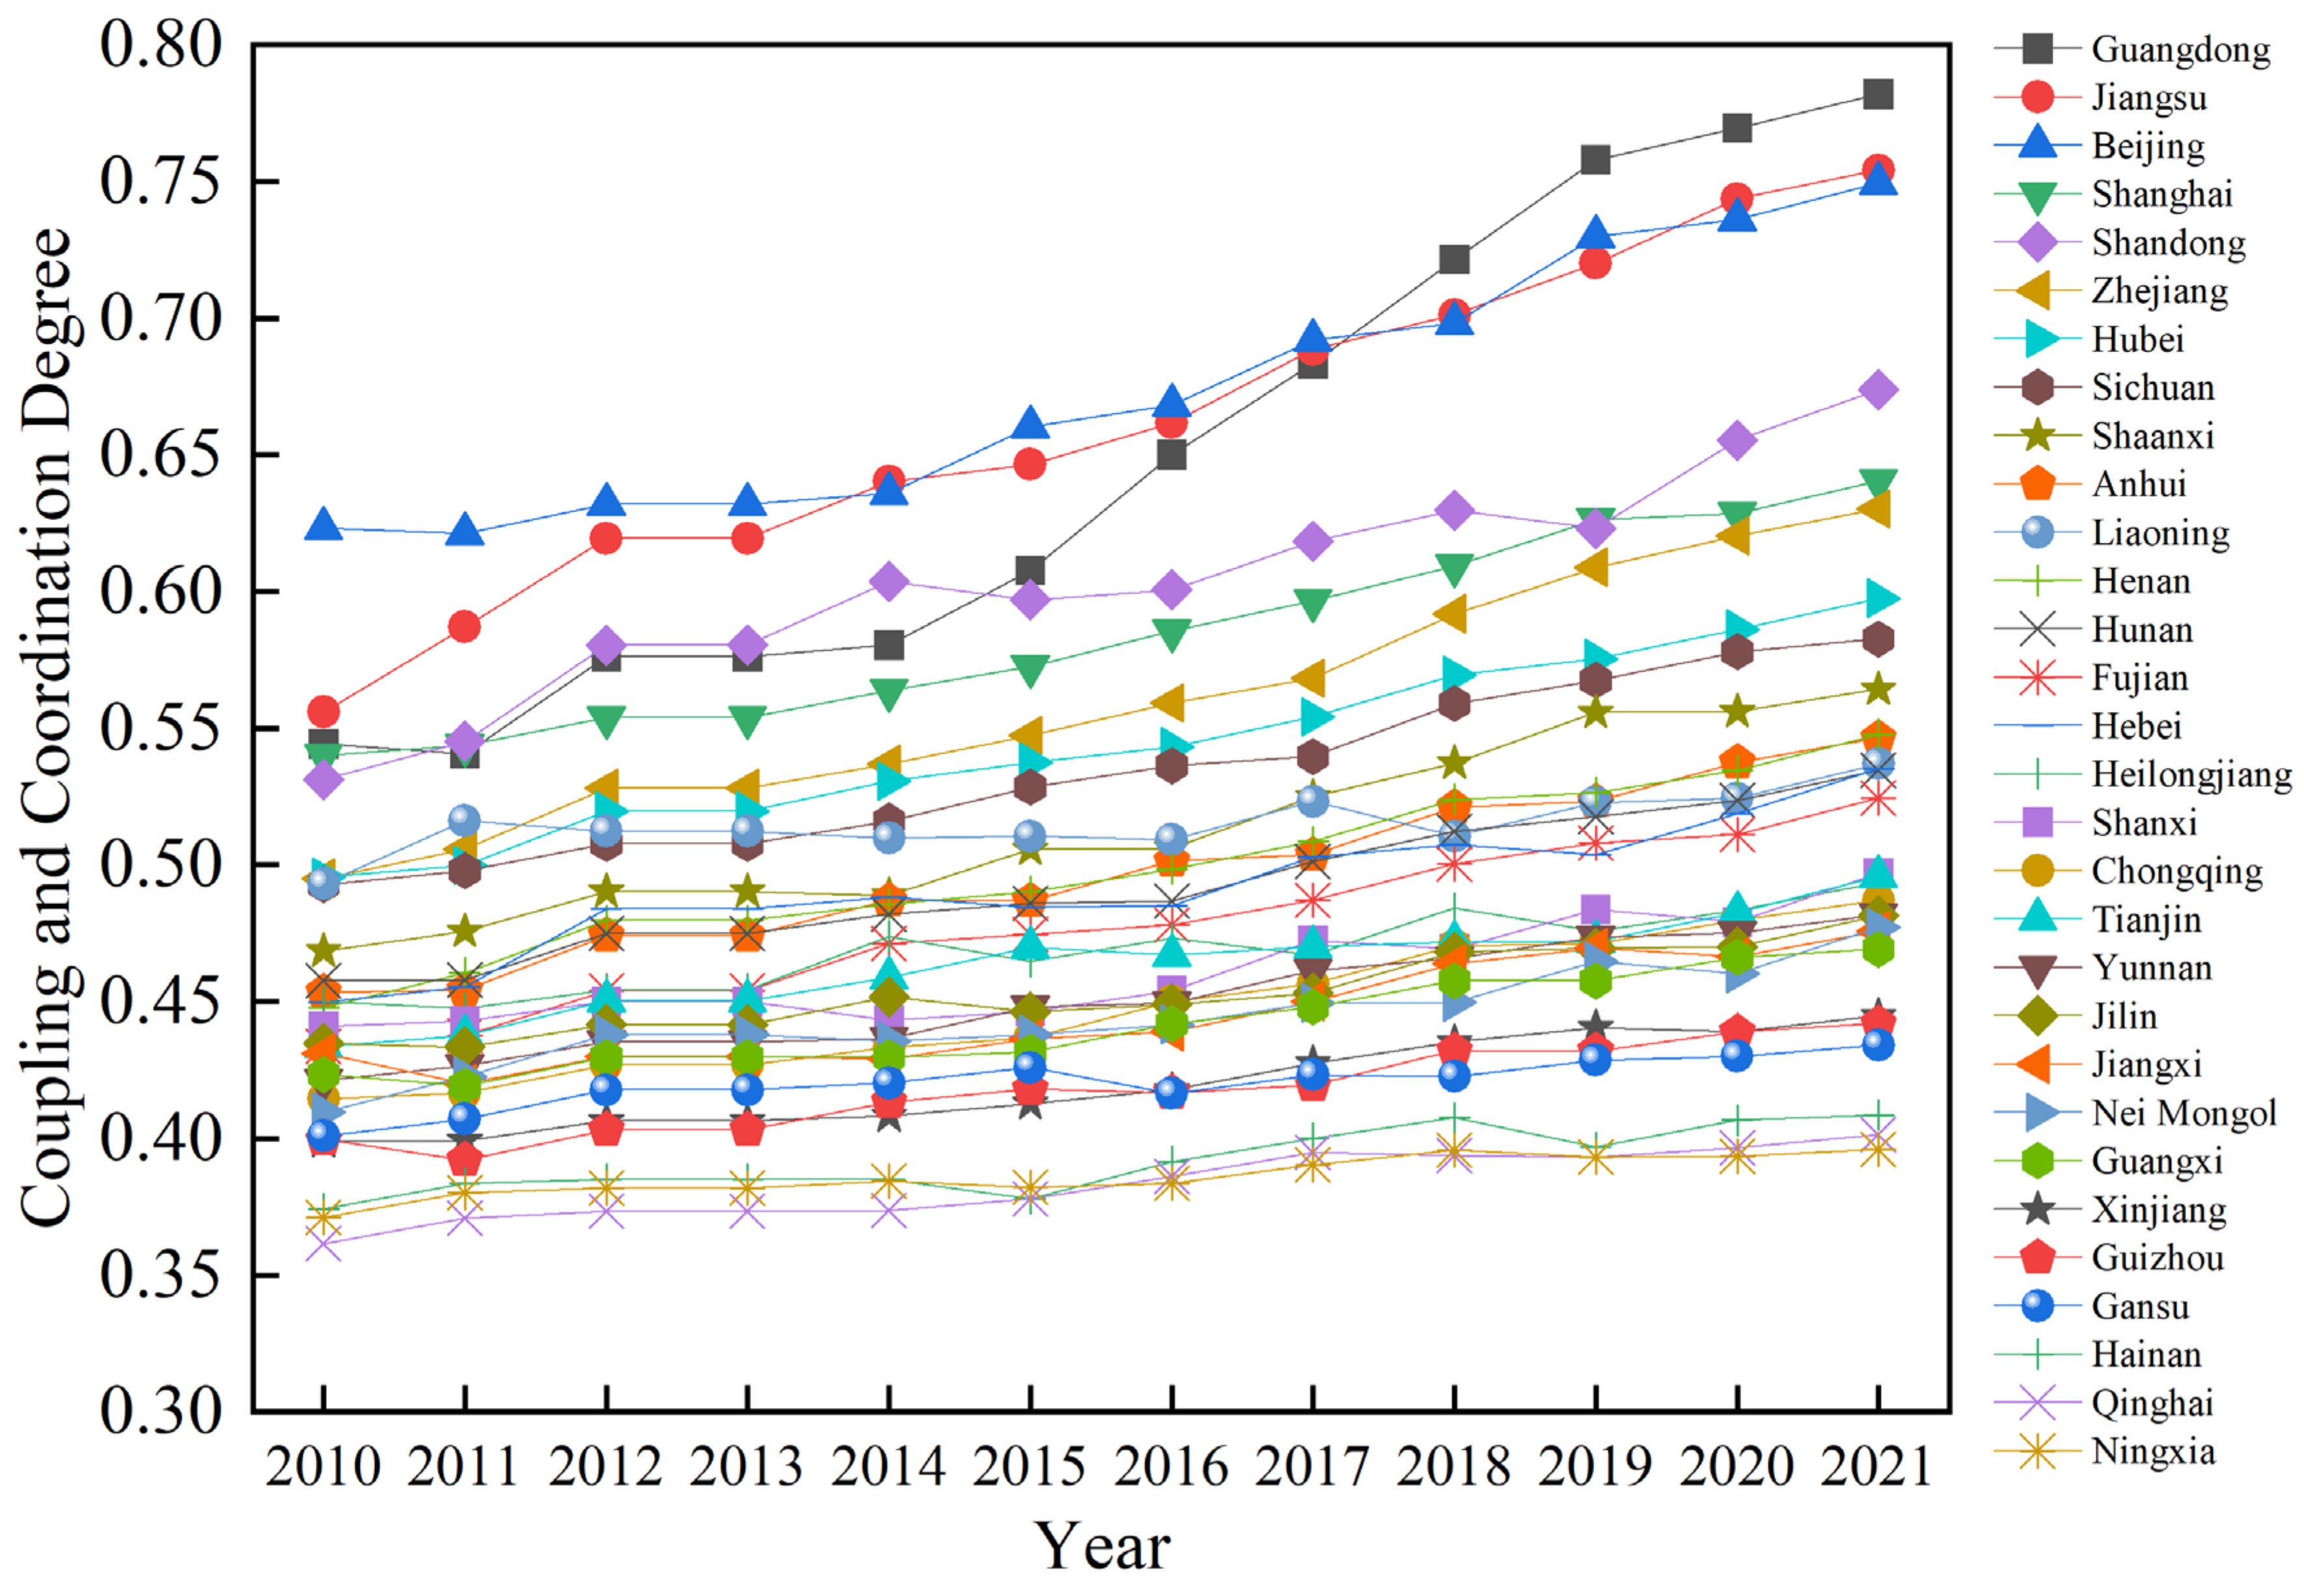
- According to the results of the coupling coordination model, at the spatial level, the development of the coupling coordination degree of the knowledge subsystem, innovation subsystem and industrial subsystem in each province is uneven. The regions with high coupling degree and rapid growth rate are distributed in the Bohai Economic Circle, Jiangsu Coastal Economic Zone, Yangtze River Delta Economic Zone and Guanzhong-Tianshui Economic Zone, among which, Guangdong, Jiangsu, Beijing, Shandong and Shanghai remained in the grinding-in stage during the research period. In terms of time, from 2010 to 2021, the overall degree of coupling coordination showed an upward trend, and the system was developing towards benign coupling.
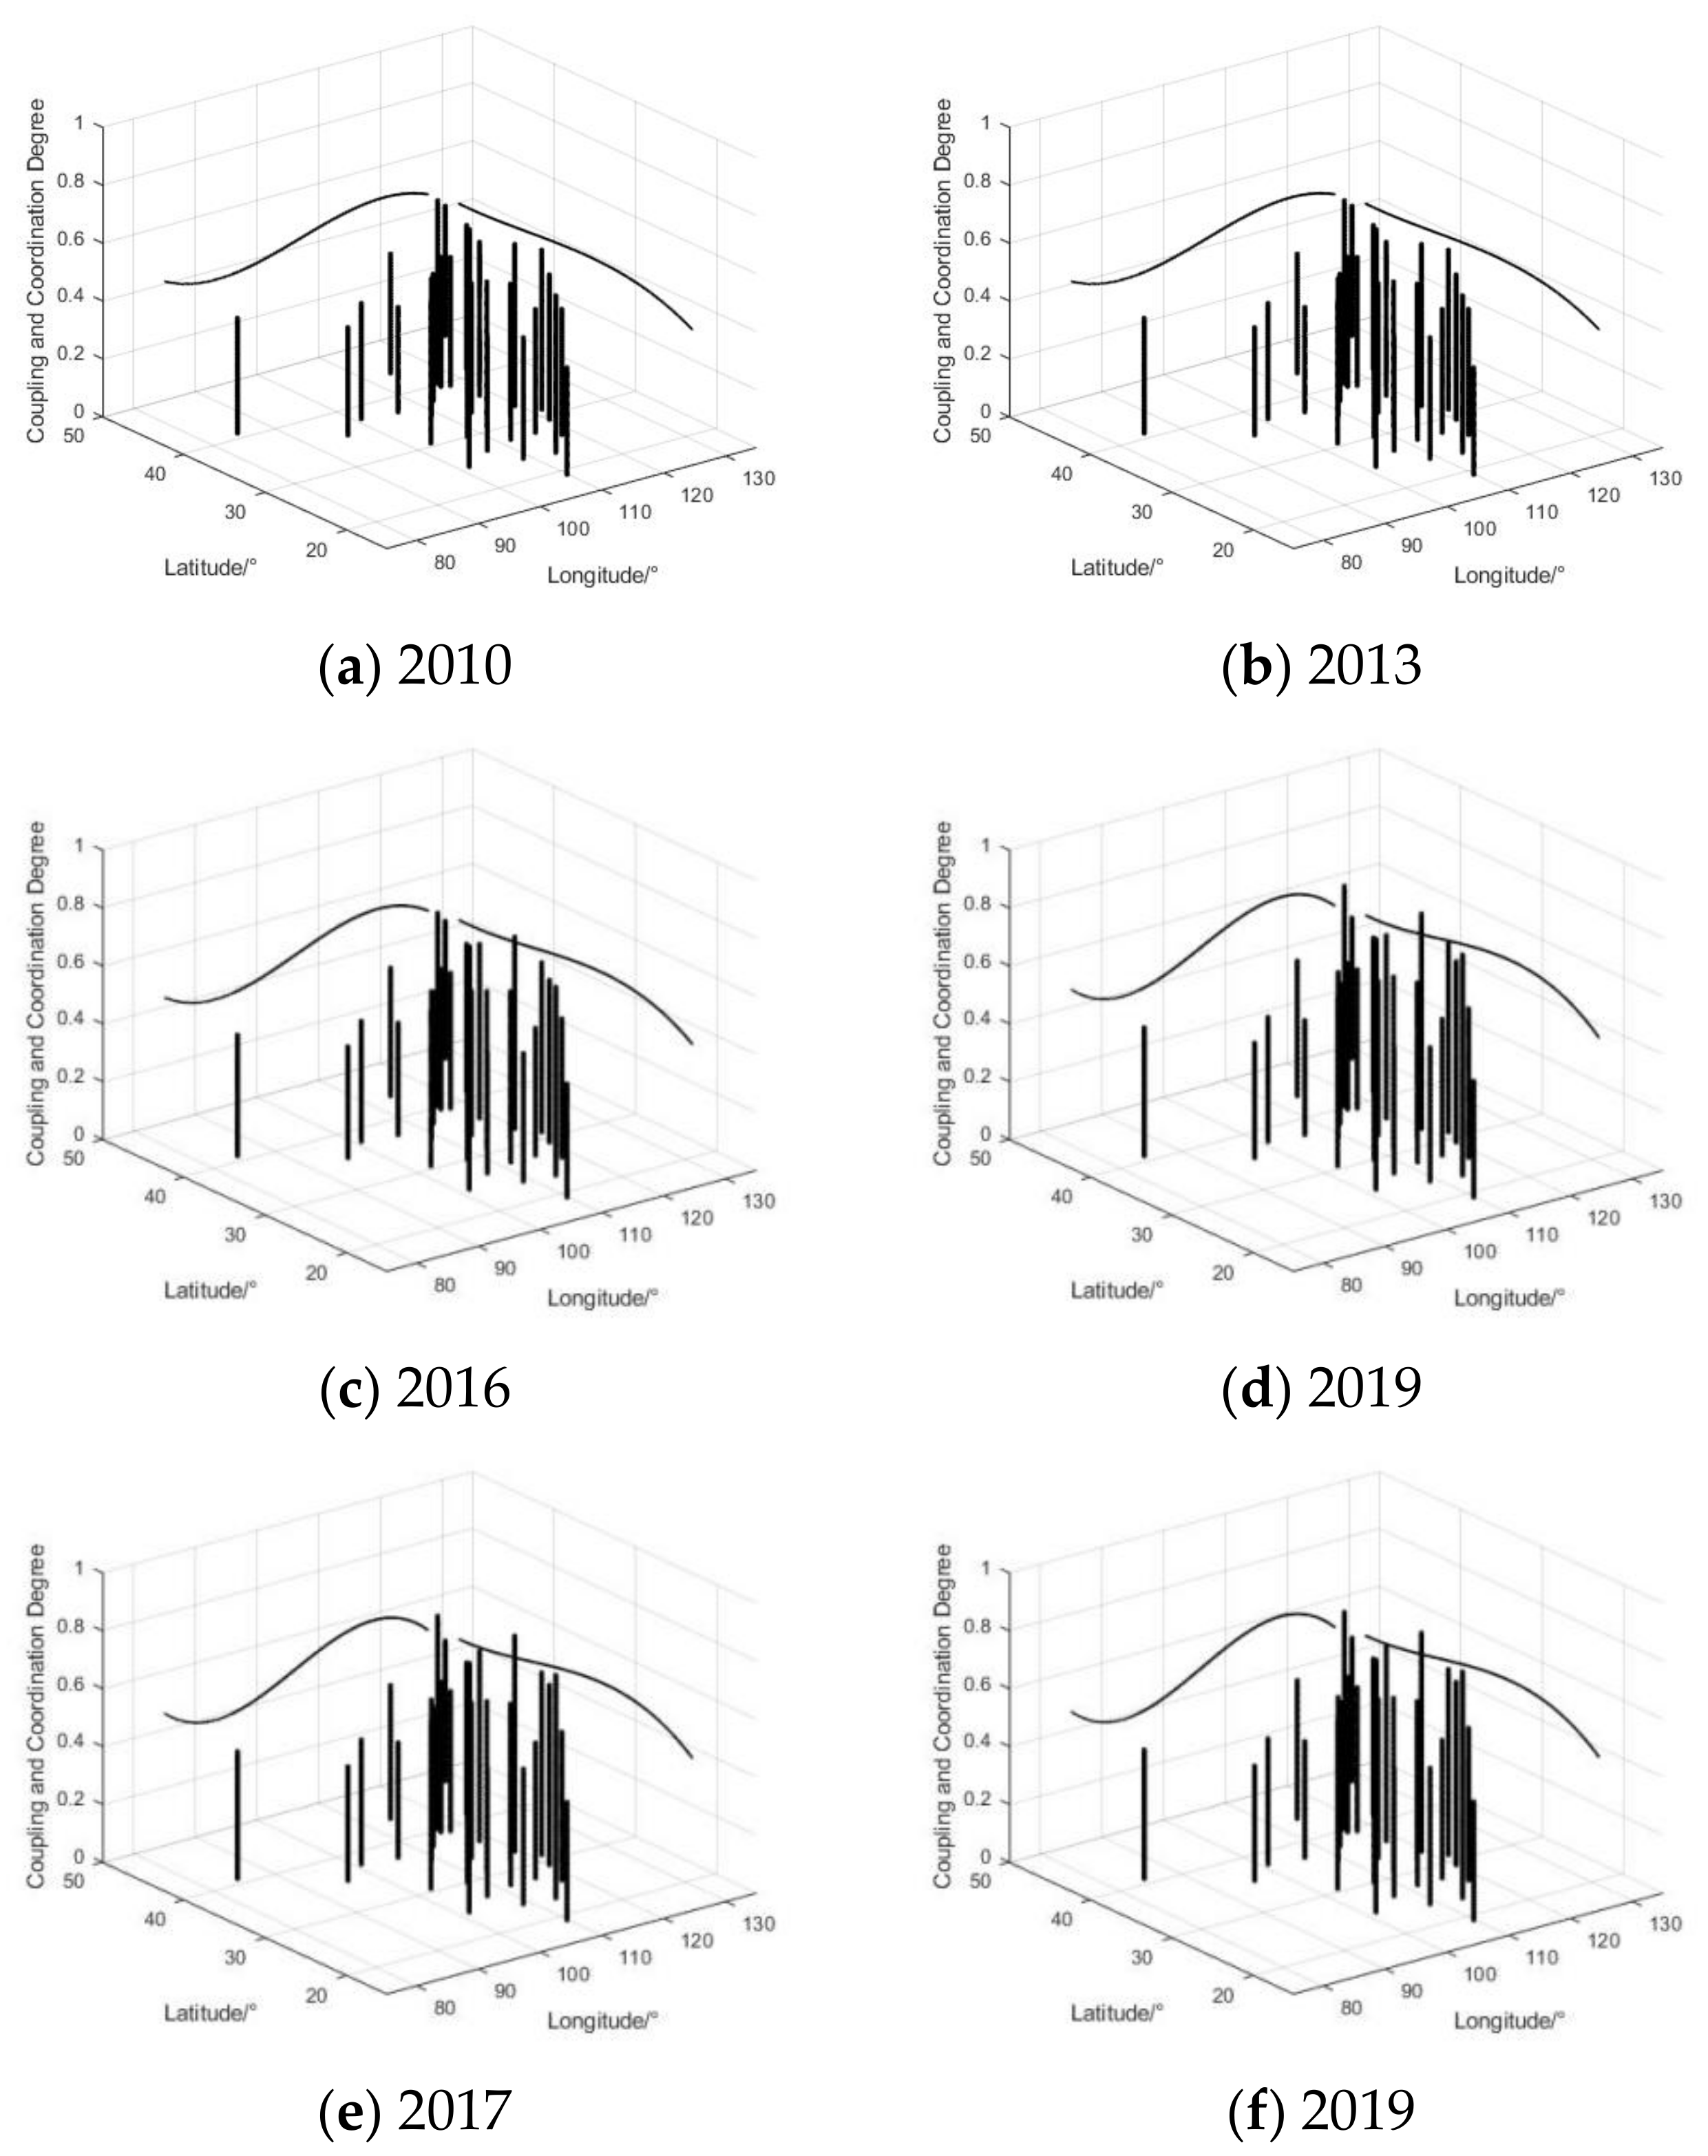
- According to the results of the trend surface model, the projection trend lines of the coupling coordination degree in the east-west direction and the north-south direction of China show the characteristics of “positive U-shape first and then inverted U-shape”. The highest point appears in the southeast region and the lowest point appears in the northwest region, indicating that the coupling and coordinated development level of the southeast region is higher, which is a typical region of systematic and orderly evolution. The formation of “U-shape” in the east-west direction is deeper than that in the north-south direction, indicating that the spatial distribution difference of the coupling coordination degree of the three systems in the east-west direction is greater than that in the north-south direction. At the same time, the “U-shape” in every direction is gradually deepening, showing that the problem of unbalanced development between regions has occurred in the coupling process of industrial innovation ecosystem.
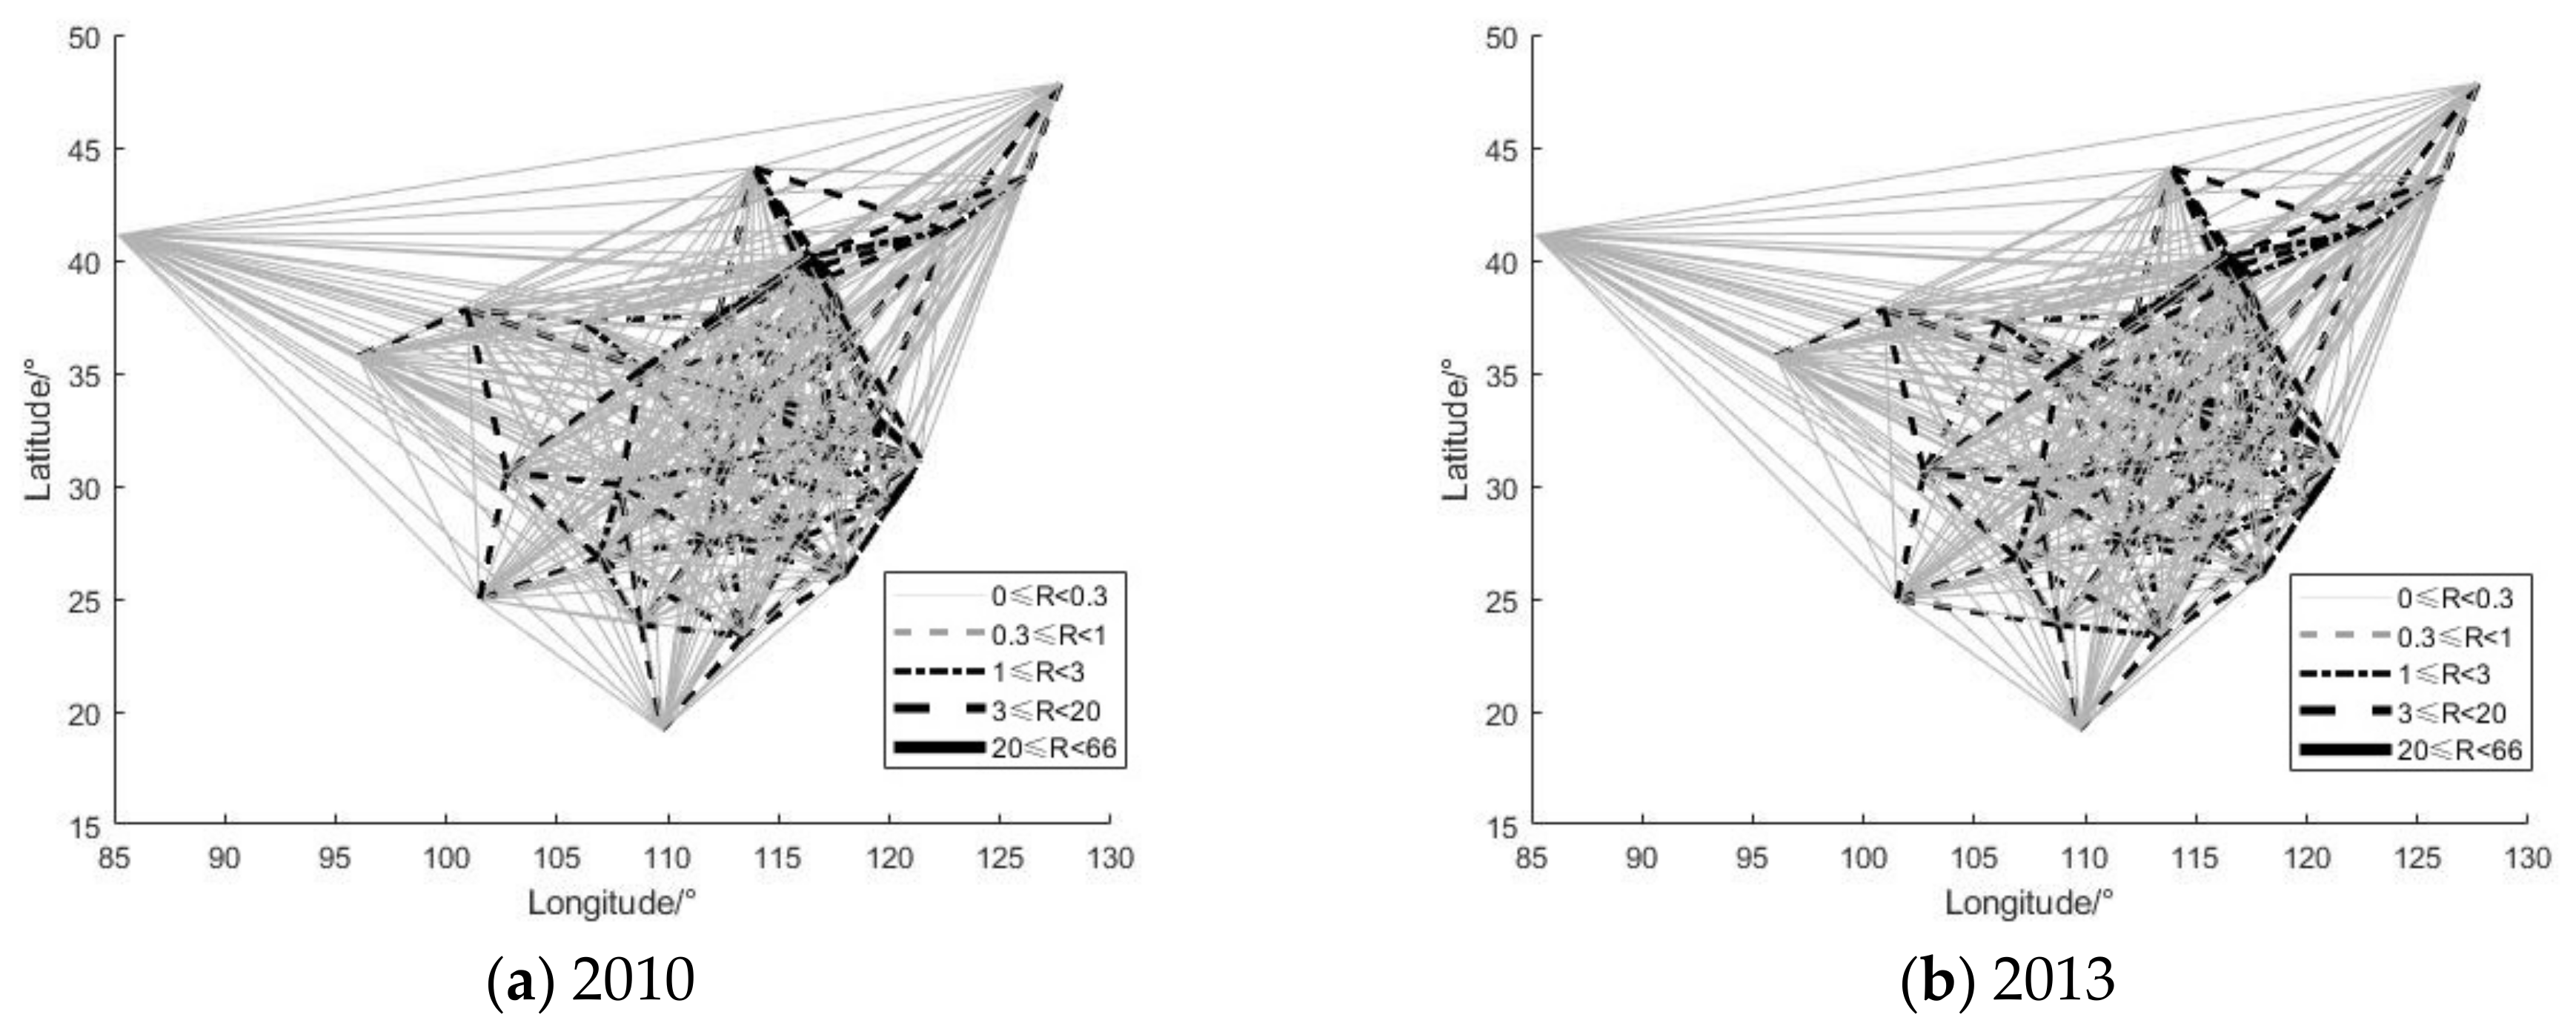
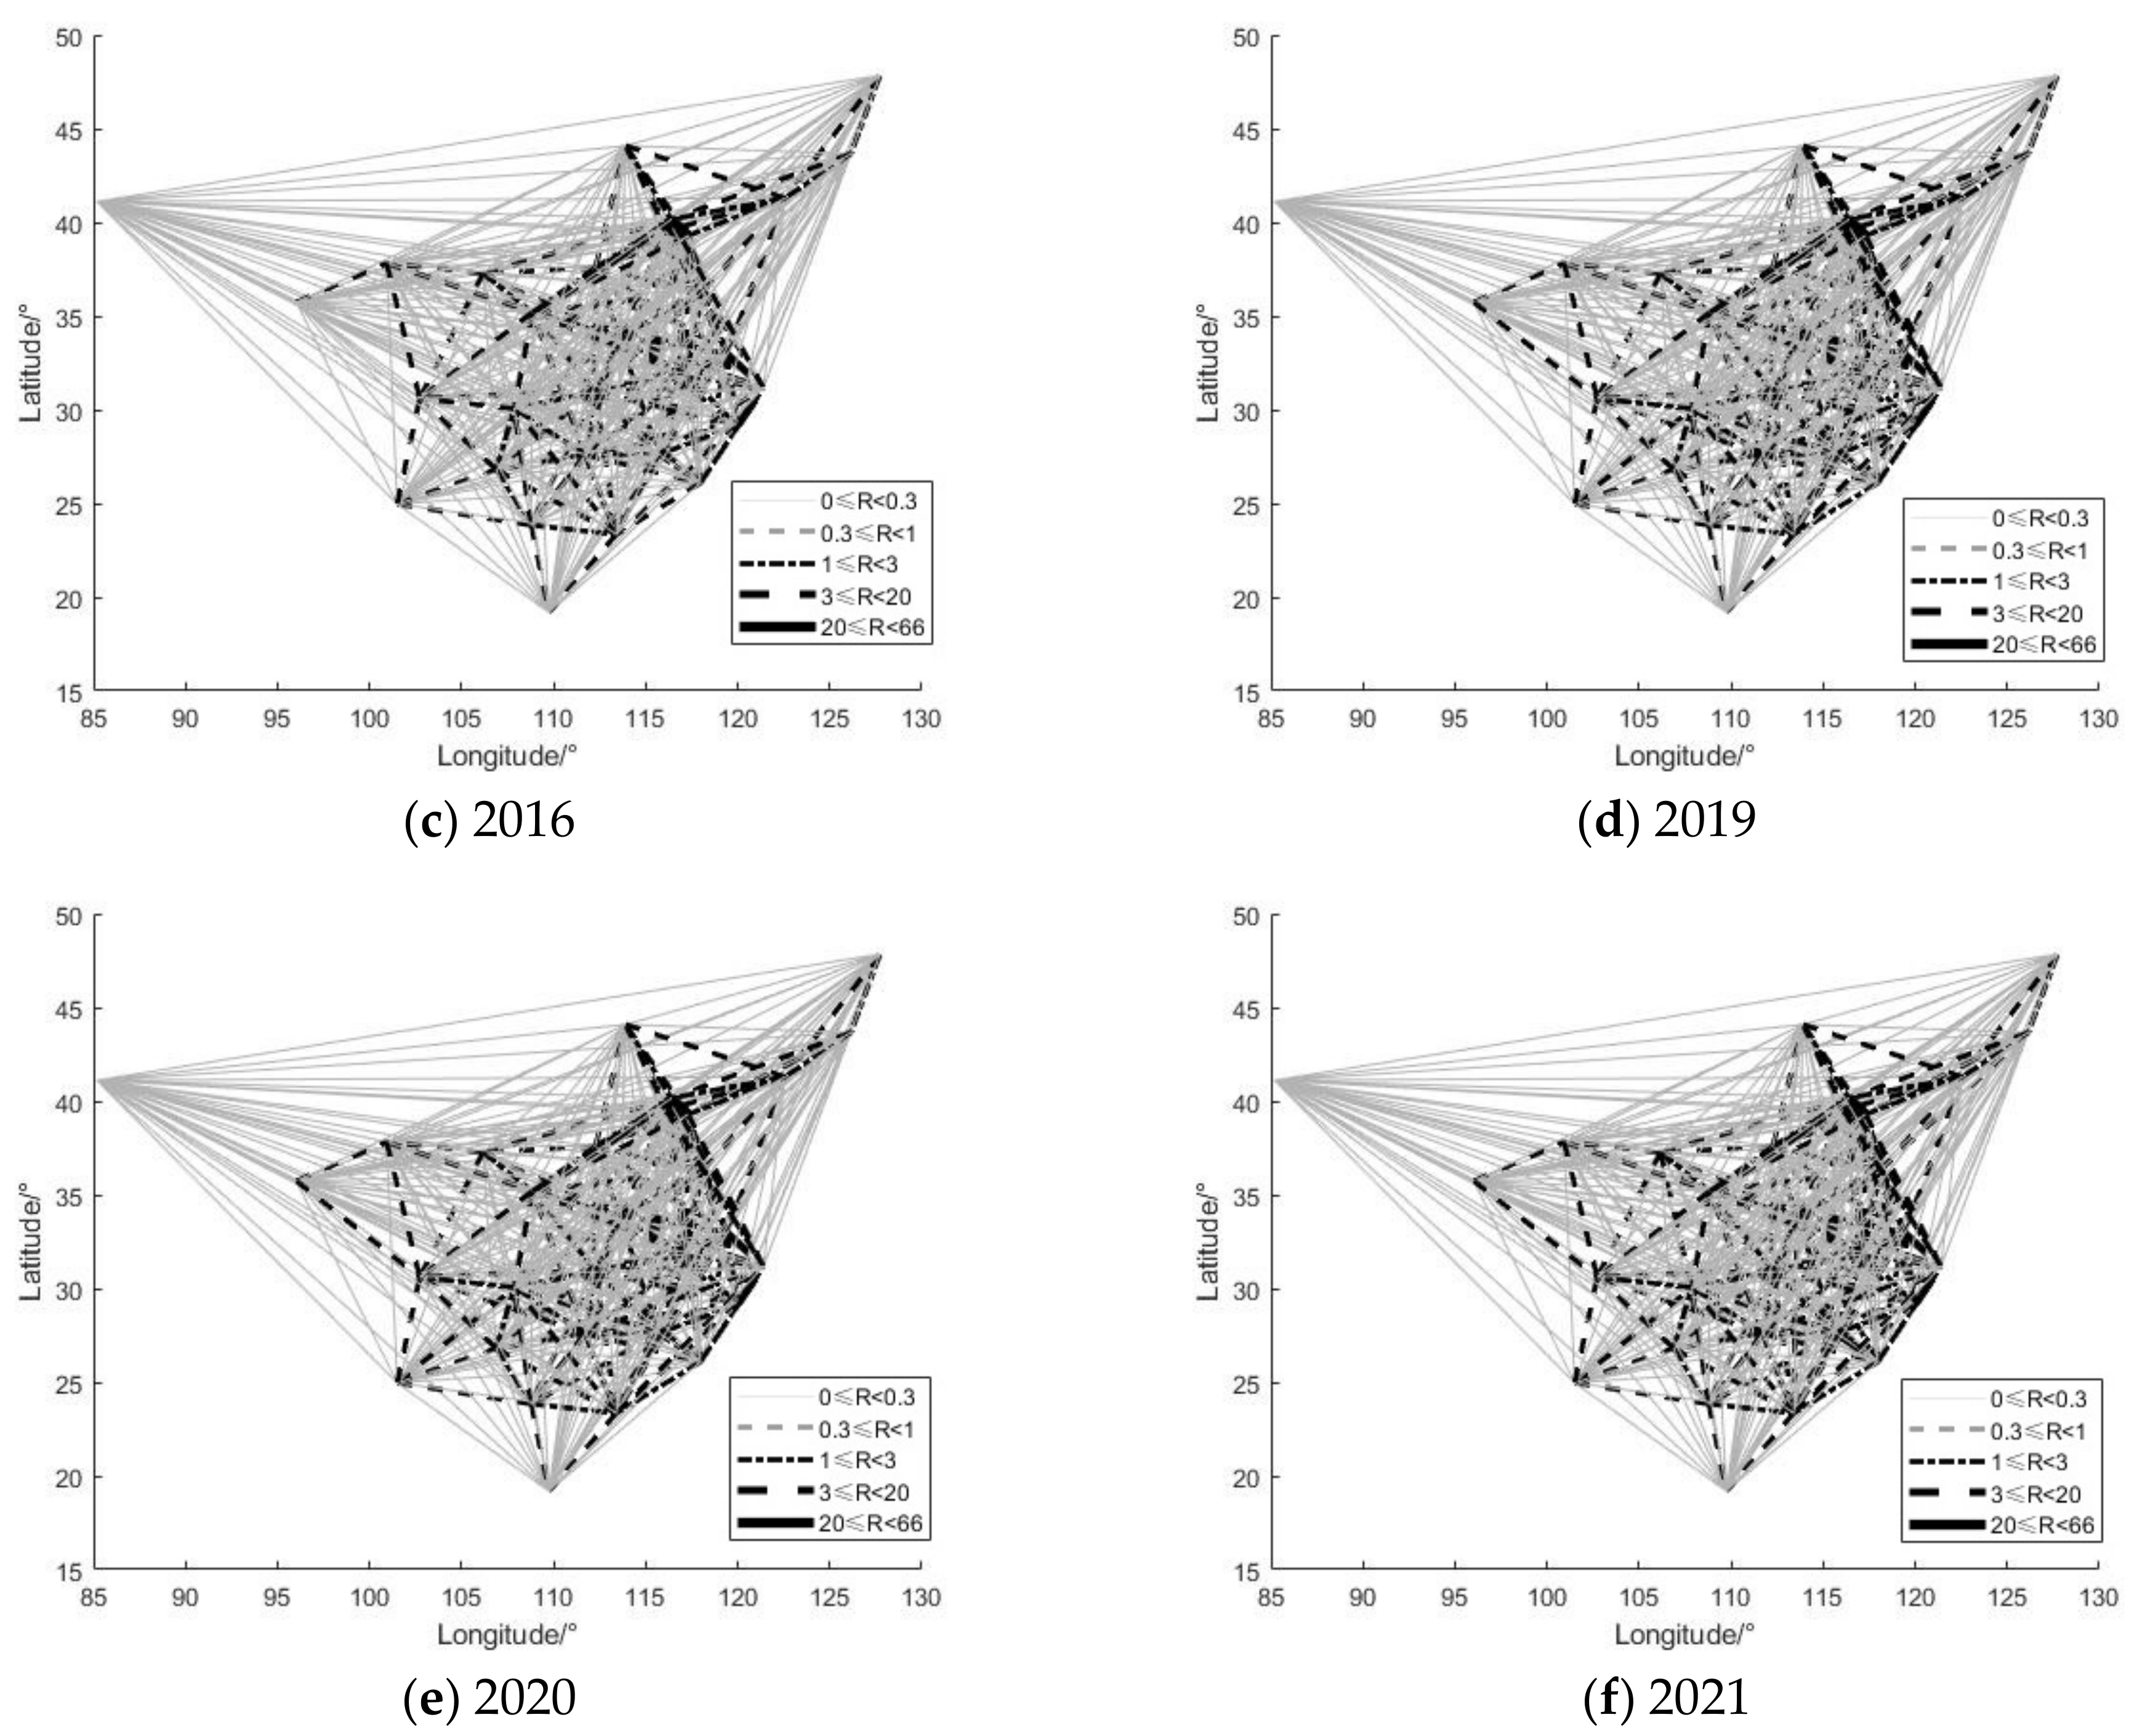
- According to the results of gravity model, the regional distribution of spatial connection strength is unbalanced, showing that the spatial connection strength of the eastern region is significantly greater than that of the western region. Among them, the spatial connection strength of Beijing-Tianjin-Tangshan region and the Yangtze River Delta is the highest. At the same time, with the passage of time, the spatial connection strength of coupling coordination degree is increasing, and the azimuth trend is from the east coast to the northwest.
- According to the results of gravity model and spatial potential energy value, the total value of spatial connection potential energy in Beijing-Tianjin-Tangshan region where Beijing, Tianjin, and Hebei are located and the Yangtze River Delta where Shanghai, Jiangsu and Zhejiang are located account for the largest proportion in China. With the passage of time, the status of the above areas has not changed significantly. Simultaneously, it can be seen from the proportion of spatial potential energy value that it forms a radial diffusion around Beijing-Tianjin-Tangshan region and the Yangtze River Delta driving the spatial connection strength of the surrounding areas to strengthen over time, which also shows that the above two regions promote the coordinated development between regions and play a central role in promoting the spatial coupling between knowledge subsystem, innovation subsystem and industrial subsystem. It is of core significance to promote the coordinated development of industrial innovation ecosystem.
7.2. Managerial Implications
- For regions with high coupling and coordination level, such as Beijing-Tianjin-Tangshan region and southeast coastal areas, we should continue to give full play to their advantages in innovative resources and economic development level, eliminate inefficient and high consumption industries, and reduce pollutant emissions. Meanwhile, we should make good use of the spatial driving role of regions with high coupling coordination degree and drive the coupling coordination degree of local and surrounding industrial subsystems with innovative knowledge and innovative technology to reach the coupling stage through the overflow of knowledge and technology driven by the flow of high-quality talents in these regions.
- For the regions with medium coupling and coordination level in the central region, compared with the regions with high coordination level, the three systems are in the “Valley Area”. We should make use of its geographical advantages, improve the level of opening up, rely on the middle and lower reaches of the Middle and Lower Yangtze River Economic Belt, carry out multi-directional regional cooperation, and use external economic and innovative resources to drive its economic and innovative development. Internally, relevant policies and environmental regulation according to local characteristics should be formulated. Concurrently, the region is located at the intersection of east-west and north-south directions, and is the backbone to promote the balanced development of China’s East, West, North, and South. We should strengthen the economic cooperation between relevant regions and provinces, forming a joint force for development to promote the development of regional integration.
- For the areas with low coupling and coordination degree in the northwest, we should make full use of their advantages of high altitude and natural energy and develop clean energy such as wind and electric energy, reducing pollutant emissions from the source. Giving full play to resource advantages to drive regional development. Meanwhile, learning the innovation achievements of areas with high innovation level to advance local innovation development, and then promote the mutual coupling of the three systems, and narrow the gap gradually.
- Strengthen the output of original technologies and promote disruptive innovation. Original new knowledge is the fundamental driving force to drive the emergence of new technologies, new products, and even new business models. At present, China’s economic development is facing the problem of “neck sticking”, because technological production does not echo the basic theory of the source. Further, China’s innovation mode “Introduction Imitation” will always limit the thinking mode of innovators. On the contrary, we should consciously adhere to the original knowledge system to support innovation output, to achieve the subversive transcendence of innovative technology.
- Enrich the main body of industrial innovation to promote high-quality industrial development. Heterogeneous subjects, whose functional eigenvalues have a large coefficient of variation, are an important factor in promoting the energy release of the innovation ecosystem, knowledge spillover and innovation development. To achieve independent innovation, China needs not only the support of multinational companies such as Huawei, but also the support of “invisible champions” small and medium-sized enterprises and small and micro “unicorn” enterprises. With their own advantages, these enterprises are of great significance to improve innovation efficiency. Therefore, enriching the main body of industrial innovation is an important content to improve the function of industrial innovation ecosystem.
7.3. Research Limitations
Supplementary Materials
Author Contributions
Funding
Institutional Review Board Statement
Informed Consent Statement
Data Availability Statement
Conflicts of Interest
References
- Fukuda, K. Science, Technology and Innovation Ecosystem Transformation Toward Society 5.0. Int. J. Prod. Econ. 2019, 220, 107460. [Google Scholar] [CrossRef]
- Zhao, X.; Ding, X.; Li, L. Research on Environmental Regulation, Technological Innovation and Green Transformation of Manufacturing Industry in the Yangtze River Economic Belt. Sustainability 2021, 13, 10005. [Google Scholar] [CrossRef]
- Zhao, X.; Shang, Y.; Song, M. Industrial structure distortion and urban ecological efficiency from the perspective of green entrepreneurial ecosystems. Socio-Econ. Plan. Sci. 2020, 72, 100757. [Google Scholar] [CrossRef]
- Pan-Qun, L.I.; Chen, G.J. The Impact of the Relationship between Innovation Subjects on the Innovation Efficiency of High-tech Industry from the Perspective of the Innovation Ecosystem. Technol. Innov. Manag. 2018, 39, 664–670 + 681. [Google Scholar]
- Zhang, J.; Lu, Y.; Zhang, X. Unlocking the Sustainable Development Path of China’s Nonferrous Metal Industry Based on Collaborative Innovation. Discret. Dyn. Nat. Soc. 2021, 2021, 2026086. [Google Scholar] [CrossRef]
- Xie, X.; Wang, H. Research on the Stability of Industrial Technology Innovation Strategic Alliance Based on Cooperation Mechanism: An Exploratory Multi-Case Study. Sci. Technol. Prog. Policy 2020, 37, 62–71. [Google Scholar]
- Zhou, C.; Zeng, G.; Shang, Y. Progress and Prospect of Research on Innovation Networks: A Perspective from Evolutionary Economic Geography. Econ. Geogr. 2019, 39, 27–36. [Google Scholar]
- Chung, S. Building a national innovation system through regional innovation systems. Technovation 2002, 22, 485–491. [Google Scholar] [CrossRef]
- Ritala, P.; Almpanopoulou, A. In defense of ‘eco’ in innovation ecosystem. Technovation 2017, 60–61, 39–42. [Google Scholar] [CrossRef]
- Su, Y.S.; Oh, E.T.; Liu, R.J. Establishing Standardization and an Innovation Ecosystem for the Global Bicycle Industry—The Case of Taiwan. IEEE Trans. Eng. Manag. 2021. [Google Scholar] [CrossRef]
- Korhonen, J. Four ecosystem principles for an industrial ecosystem. J. Clean. Prod. 2001, 9, 253–259. [Google Scholar] [CrossRef]
- Burström, T.; Parida, V.; Lahti, T.; Wincent, J. AI-enabled business-model innovation and transformation in industrial ecosystems: A framework, model and outline for further research. J. Bus. Res. 2021, 127, 85–95. [Google Scholar] [CrossRef]
- Huang, L.C. Stability Mechanism of Regional Technological Innovation Ecosystem. RD Manag. 2003, 15, 48–220. [Google Scholar]
- Villani, E.; Lechner, C. How to acquire legitimacy and become a player in a regional innovation ecosystem? The case of a young university. J. Technol. Transf. 2021, 46, 1017–1045. [Google Scholar] [CrossRef]
- Cao, R.Z.; Shi, J.Y.; Guo, H.; Qiu, L. Research on Creative Industry Innovation Ecosystem: Motivation, Model and Function Division. Econ. Geogr. 2015, 35, 107–113. [Google Scholar]
- Wang, L.; Bi, X. Risk assessment of knowledge fusion in an innovation ecosystem based on a GA-BP neural network. Cogn. Syst. Res. 2020, 66, 201–210. [Google Scholar] [CrossRef]
- Wu, R.; Wang, Z.Q.; Shi, Q.F. Increment of Heterogeneous Knowledge in Enterprise Innovation Ecosystem: An Agent-Based Simulation Framework. Complexity 2021, 2021, 9550232. [Google Scholar] [CrossRef]
- Feng, L.; Lu, J.; Wang, J. A Systematic Review of Enterprise Innovation Ecosystems. Sustainability 2021, 13, 5742. [Google Scholar] [CrossRef]
- Yan, Q.; RHou Luo, J. Simulation Research on Innovation Ecosystem Performance of Urban Agglomeration in the Middle Reaches of the Yangtze River. J. Test. Eval. 2021, 49, 20200174. [Google Scholar]
- Zhu, G.L.; Cai, C.L.; Zhi, X.U. Formation and Evolution of Competitive Advantages of Industrial Clusters’ Innovation Ecosystem in the Network Environment: A Perspective of Ecological Rents. RD Manag. 2018, 30, 2–13. [Google Scholar]
- Gao, Y.; Liu, X.; Ma, X. How do firms meet the challenge of technological change by redesigning innovation ecosystem A case study of IBM. Int. J. Technol. Manag. 2019, 80, 241–251. [Google Scholar] [CrossRef]
- Ghazinoory, S.; Sarkissian, A.; Farhanchi, M.; Saghafi, F. Renewing a dysfunctional innovation ecosystem: The case of the Lalejin ceramics and pottery. Technovation 2020, 96–97, 102122. [Google Scholar] [CrossRef]
- Xu, Q.R.; Jiang, J.; Zheng, G. Empirical Study on the Relation between Total Synergy Degree of the Innovation Elementsand the Enterprise Features. RD Manag. 2005, 3, 16–21. [Google Scholar]
- Thong, R.; Lotta, T. Creating a Culture of Productivity and Collaborative Innovation Orion’s R&D Transformation. Res. Technol. Manag. 2015, 58, 41–51. [Google Scholar]
- Mitze, T.; Alecke, B.; Reinkowski, J.; Untiedt, G. Linking collaborative R&D strategies with the research and innovation performance of SMEs in peripheral regions: Do spatial and organizational choices make a difference? Ann. Reg. Sci. 2015, 55, 555–596. [Google Scholar]
- Ariken, M.; Zhang, F.; Liu, K.; Fang, C.; Kung, H.T. Coupling coordination analysis of urbanization and eco-environment in Yanqi Basin based on multi-source remote sensing data. Ecol. Indic. 2020, 114, 106331. [Google Scholar] [CrossRef]
- Huiping, Z.; Yuqin, Y. How Does Knowledge Coupling Affect Firm’s Incremental Innovation? The Moderating Effects of Government Support Policies. Discret. Dyn. Nat. Soc. 2021, 2021, 6941138. [Google Scholar] [CrossRef]
- López-Nicolás, C.; Meroño-Cerdán, Á.L. Strategic knowledge management, innovation and performance. Int. J. Inf. Manag. 2011, 31, 502–509. [Google Scholar] [CrossRef]
- Lengyel, B.; Leydesdorff, L. Regional Innovation Systems in Hungary: The Failing Synergy at the National Level. Reg. Stud. 2011, 45, 677–693. [Google Scholar] [CrossRef] [Green Version]
- Rodríguez, R.; Molina-Castillo, F.J.; Svensson, G. The mediating role of organizational complexity between enterprise resource planning and business model innovation. Ind. Mark. Manag. 2020, 84, 328–341. [Google Scholar] [CrossRef]
- Hou, N.; Zhu, Q.; Yang, J.; Zhang, D.; Liu, W.; Chang, H. The Impact of Environmental Governance on the Development of Fishery Economy—The Intermediary Role of Technological Innovation. Sustainability 2021, 13, 11378. [Google Scholar] [CrossRef]
- Xie, X.M.; Zeng, S.X.; Tam, C.M. How does cooperative innovation affect innovation performance? Evidence from Chinese firms. Technol. Anal. Strateg. Manag. 2013, 25, 939–956. [Google Scholar] [CrossRef]
- Zaggl, M.A.; Schweisfurth, T.G.; Herstatt, C. The Dynamics of Openness and the Role of User Communities: A Case Study in the Ecosystem of Open-Source Gaming Handhelds. IEEE Trans. Eng. Manag. 2019, 67, 712–723. [Google Scholar] [CrossRef]
- Dong, K.; Yang, M. Analysis on innovation system and innovation ecosystem. Sci. Technol. Manag. Res. 2018, 38, 1–9. [Google Scholar]
- Robertson, J.; Caruana, A.; Ferreira, C. Innovation performance: The effect of knowledge-based dynamic capabilities in cross-country innovation ecosystems. Int. Bus. Rev. 2021, 101866. [Google Scholar] [CrossRef]
- Laursen, K.; Salter, A. Open for innovation: The role of openness in explaining innovation performance among UK. manufacturing firms. Strateg. Manag. J. 2006, 27, 131–150. [Google Scholar] [CrossRef]
- Serdar, S. Durmusoglu. Open Innovation: The New Imperative for Creating and Profiting from Technology. Eur. J. Innov. Manag. 2004, 7, 325–326. [Google Scholar]
- Wang, X.; Fang, H.; Zhang, F.; Fang, S.A. The Spatial Analysis of Regional Innovation Performance and Industry-University-Research Institution Collaborative Innovation—An Empirical Study of Chinese Provincial Data. Sustainability 2018, 10, 1243. [Google Scholar] [CrossRef] [Green Version]
- Bartoli, A.; Hermel, P. Managing change and innovation in IT implementation process. J. Manuf. Technol. Manag. 2004, 15, 416–425. [Google Scholar] [CrossRef]
- Schiederig, T.; Tietze, F.; Herstatt, C. Green innovation in technology and innovation management-an exploratory literature review. RD Manag. 2012, 42, 180–192. [Google Scholar] [CrossRef]
- Aguilera-Caracuel, J.; Ortiz-de-Mandojana, N. Green innovation and financial performance: An institutional approach. Organ. Environ. 2013, 26, 365–385. [Google Scholar] [CrossRef]
- Derlukiewicz, N.; Mempel-Śnieżyk, A.; Mankowska, D.; Dyjakon, A.; Minta, S.; Pilawka, T. How do clusters foster sustainable development? An analysis of EU policies. Sustainability 2020, 12, 1297. [Google Scholar] [CrossRef] [Green Version]
- Lee, I.H.; Hong, E.; Sun, L. Regional knowledge production and entrepreneurial firm creation: Spatial Dynamic Analyses. J. Bus. Res. 2013, 66, 2106–2115. [Google Scholar] [CrossRef]
- Jiang, X.; Wang, G.; De Clercq, D.; Yi, X. How Do Firms Achieve Successful Technology Commercialization? Evidence from Chinese Manufacturing Firms. IEEE Trans. Eng. Manag. 2020, 1–14. [Google Scholar] [CrossRef]
- Brang, U.; Gorg, C.; Wissen, M. Overcoming Neoliberal Globalization: Social-ecological Transformation from a Polanyian Perspective and beyond. Globaliaztions 2019, 17, 161–176. [Google Scholar]
- Yin, Y.; Xi, F.-M.; Wang, J.-Y.; Bing, L.-F.; Du, L.-Y. Application of Ecosystem Value in Policy System Design: A Case Study of Fuzhou City, China. China J. Appl. Ecol. 2021, 32, 3815–3823. [Google Scholar]
- Yu, F.; Lin, S. Promotion Strategies of Green Transformation and Development of Enterprises under the “Dual Carbon” Goal. Reform 2022, 336, 144–145. [Google Scholar]
- Zhang, A.; Xue, B.; Zhang, H. Analysis on Coupling Coordination and Spatial Distribution of China’s Provincial Innovation Ecosystem. Econ. Probl. 2021, 98–105. [Google Scholar] [CrossRef]
- Yao, J.; Li, H.; Shang, D.; Ding, L. Evolution of the Industrial Innovation Ecosystem of Resoyrce-bsed Cities (RBCs): A Case Study of Shanxi Province, China. Sustainability 2021, 13, 11350. [Google Scholar] [CrossRef]
- Zhang, Y.; Zhu, H. Empirical research on coupling coordination of cultural industry and tourism industry in Southwest China. Areal Res. Dev. 2013, 32, 16–21. [Google Scholar]
- Du, D.; Wang, J.; Jiao, J. Research on the coupling between the regional distribution of intellectual property resources and economic development in the Yangtze River Economic Belt. Resour. Environ. Yangtze Basin 2019, 28, 2564–2573. [Google Scholar]
- Sheng, Y.; Ma, Y. Coupling coordination analysis and influencing factors of regional industry-university-research institute innovation system. Econ. Geogr. 2017, 37, 10–18 + 36. [Google Scholar] [CrossRef]
- Yang, X.; Niu, F. Research on spatial and temporal coupling process of urbanization process and resource-environmental pressure in Liaoning. World Reg. Stud. 2022, 31, 317–328. [Google Scholar]
- Li, X.M.; Guo, Y.J.; Tian, S.Z.; Bai, Z.Z.; Liu, H. The spatio-temporal pattern evolution and driving force of coupling coordination degree of urban human settlements system in Liaoning Province. Sci. Geogr. Sin. 2019, 39, 1208–1218. [Google Scholar]
- Hua, X.; Yang, Z.; Ye, Y. Spatial linkages of finance and economic growth—Research on counties of Jiangsu Province. Econ. Geogr. 2016, 36, 32–40. [Google Scholar]
| Subsystem | Primary Index | Secondary Index |
|---|---|---|
| Knowledge subsystem | Knowledge reserve | Number of published scientific papers |
| Number of published scientific and technological works | ||
| Knowledge subject | Number of colleges and universities | |
| Number of R&D institutions | ||
| Intellectual talents | Full time equivalent of R&D project investment personnel in Colleges and Universities | |
| Full time equivalent of R&D project input personnel of research and development institutions | ||
| Knowledge funds | Internal expenditure of R&D project investment in Colleges and Universities | |
| Internal expenditure of R&D project investment funds of research and development institutions | ||
| Knowledge cooperation | Amount of R&D funds of colleges and universities from enterprises | |
| Amount of R&D funds of R&D institutions from enterprises | ||
| Innovation subsystem | Innovative achievements | Number of invention patents authorized |
| Number of R&D projects | ||
| Innovation ability | Number of valid patents of colleges and universities/Number of colleges and Universities | |
| Number of valid patents of R&D institutions/Number of R&D institutions | ||
| Number of valid patents of enterprises/number of industrial enterprises above designated size with R&D activities | ||
| Innovation funds | Internal expenditure of R&D funds in Colleges and Universities | |
| Internal expenditure of R&D funds of research and development institutions | ||
| Internal expenditure of R&D funds of industrial enterprises above designated size | ||
| Trading market | Turnover of export technology market | |
| Turnover of absorbing technology market | ||
| Technical exchange | Number of foreign technology import contracts | |
| Government support | Government investment in Colleges and Universities | |
| Government investment in R&D institutions | ||
| Government investment of industrial enterprises above designated size | ||
| Economic environment | Per capita GDP | |
| Per capita consumption expenditure | ||
| Industrial subsystem | Industrial Subject | Number of high-tech enterprises |
| Service organization | Number of technology business incubators | |
| Number of science and Technology Museums | ||
| Achievement transformation | Total output value of high-tech industry/number of R&D institutions | |
| New product sales revenue | ||
| Ecological environment | Water resource | |
| Urban greening coverage | ||
| Forest coverage | ||
| Low carbon development | Coal consumption/total energy consumption | |
| Oil consumption/total energy consumption | ||
| Natural gas consumption/total energy consumption | ||
| Carbon emissions | ||
| Generating capacity | ||
| Circular development | Waste water consumption | |
| Comprehensive utilization of general industrial solid waste | ||
| Pollutant treatment | Completed investment of government pollution control project | |
| Wastewater treatment/wastewater discharge | ||
| Waste gas treatment/sulfur dioxide emission | ||
| Solid waste treatment/solid waste discharge |
| Serial Number | Type | Grade | Numerical Value |
|---|---|---|---|
| 1 | Maladjusted Stage | Extreme Disorder | 0 ≤ D < 0.1 |
| 2 | Severe Disorder | 0.1 ≤ D < 0.2 | |
| 3 | Antagonistic Stage | Moderate Disorder | 0.2 ≤ D < 0.3 |
| 4 | Mild Disorder | 0.3 ≤ D < 0.4 | |
| 5 | Verge of Disorder | 0.4 ≤ D < 0.5 | |
| 6 | Grinding-in Stage | Reluctantly Coordinate | 0.5 ≤ D < 0.6 |
| 7 | Primary Coordination | 0.6 ≤ D < 0.7 | |
| 8 | Intermediate Coordination | 0.7 ≤ D < 0.8 | |
| 9 | Coupling Stage | Good Coordination | 0.8 ≤ D < 0.9 |
| 10 | Highly Coordination | 0.9 ≤ D ≤ 1 |
Publisher’s Note: MDPI stays neutral with regard to jurisdictional claims in published maps and institutional affiliations. |
© 2022 by the authors. Licensee MDPI, Basel, Switzerland. This article is an open access article distributed under the terms and conditions of the Creative Commons Attribution (CC BY) license (https://creativecommons.org/licenses/by/4.0/).
Share and Cite
Yu, X.; Qi, Y.; Yu, L.; He, Y. Temporal and Spatial Evolution of Coupling Coordination Degree of Industrial Innovation Ecosystem—From the Perspective of Green Transformation. Sustainability 2022, 14, 4111. https://doi.org/10.3390/su14074111
Yu X, Qi Y, Yu L, He Y. Temporal and Spatial Evolution of Coupling Coordination Degree of Industrial Innovation Ecosystem—From the Perspective of Green Transformation. Sustainability. 2022; 14(7):4111. https://doi.org/10.3390/su14074111
Chicago/Turabian StyleYu, Xiaohua, Yuan Qi, Longzhen Yu, and Yuanyuan He. 2022. "Temporal and Spatial Evolution of Coupling Coordination Degree of Industrial Innovation Ecosystem—From the Perspective of Green Transformation" Sustainability 14, no. 7: 4111. https://doi.org/10.3390/su14074111
APA StyleYu, X., Qi, Y., Yu, L., & He, Y. (2022). Temporal and Spatial Evolution of Coupling Coordination Degree of Industrial Innovation Ecosystem—From the Perspective of Green Transformation. Sustainability, 14(7), 4111. https://doi.org/10.3390/su14074111